the use of information in decision making literature ... · the use of information in decision...
TRANSCRIPT

The Use of Information in Decision Making
Literature Review for the Audit Commission
Prepared by Dr Mike Kennerley and Dr Steve Mason, Centre for Business Performance Cranfield School of Management
Executive Summary..............................................................................................................2 1. Introduction .......................................................................................................................4 2. Extracting Value from Data...............................................................................................6
Definitions .........................................................................................................................6 3. Using Data ........................................................................................................................9
1. Which Data / Information to Collect.............................................................................10 2. Data Collection............................................................................................................19 3. Data analysis / processing ..........................................................................................20 4. Data Interpretation ......................................................................................................21 5. Communication ...........................................................................................................22 6. Decision Making / Action Planning..............................................................................23 Supporting infrastructure.................................................................................................23
4. Application in Practice ....................................................................................................24 5. What can we Learn from the History of Measurement ? ................................................35 6. Judgement in Decision-Making.......................................................................................38 7. Conclusions ....................................................................................................................44 References .........................................................................................................................45

The Use of Information in Decision Making
15/02/2008 2
Executive Summary
The Audit Commission commissioned the Centre for Business Performance to produce a report on the use of information in decision making. The report forms part of the Commission’s national study “Making better use of information to drive improvement in local public services”, and is a review of the literature on what can be learnt form the private sector on the use of information in decision making.
The report was commissioned because the issue of how information can be used to improve the quality of decisions is one that is common to public and private sector contexts. The report draws together the literature which informs the use of information in decision making with examples from practice. The literature addressing this topic is broad, wide ranging and necessarily multi-disciplinary in nature. Whilst the management literature contributes considerably to the subject, other disciplines including social science, information technology, psychology and measurement theory are also related. It is not surprising therefore that there is not agreement on the mechanisms and approaches to decision making.
Private sector organisations have access to almost unlimited data of different types and relating to different areas of their operations. The collection and manipulation of this data consumes considerable time, effort and resources. As a result the way in which this information can be used to increase the value extracted from it, improve decision making and ultimately improve the outcome or performance of the organisation is the subject of intense interest. There is some evidence that better use of information can lead to better decisions and hence performance, it is increasingly being argued that analytics and the ability to effectively use the insights contained with the data available to an organisation can be a key competitive capability.
In management research considerable attention has been paid to the use of information, almost all management disciplines have a perspective and suggested approaches to the use of data and application of insights. Much of the research in the management literature has focused on a rational approach to decision making which involves the use of data to inform decisions. There is a plethora of decision support tools and techniques designed to help managers make better, more informed decisions. However many organisations complain that they are “drowning in data, whilst thirsting for information”. In order to overcome these issues, and to extract the maximum value out of the data that is available, a structured approach to working with data to inform decision making is necessary. Such a structure is presented in this report and is used to structure the analysis of the literature. It reflects the need to define what data is required, how the data is collected, how the data is analysed, how it is interpreted, how the data and insights are communicated and how decisions are made. Tools and techniques can be applied to improve the execution of each stage of this structured approach and use of such a guiding structure aids understanding of the appropriate application of these tools and techniques. In addition to a structured approach, to be effectively applied tools and techniques need to be supported by appropriate capabilities including processes, skills, infrastructure and culture.
As has been stated, there is some evidence that better use of information can lead to better decisions and performance and the report presents approaches to realise these opportunities. However, review and analysis of the literature related to the subject has highlighted a number of limitations of this rational view of decision making and the use of information.
The history and theory of measurement, and the way we collect data about entities, provides important additional insight regarding the rational approach to decision making. This field argues that data and information are attributed to entities by people and hence should not be considered to be fact or truth. Furthermore it argues that:

The Use of Information in Decision Making
15/02/2008 3
- The context of and purpose for which it is collected can significantly affect data and its interpretation. Considerable care should be taken when using data in context or for a purpose other than that for which it was originally intended.
- To improve decision making through the use of data and information the models reflected in the data and in the decision makers’ mental model should be as closely aligned to the entity about which the decision is being made as possible.
A further caveat to the rational approach to decision making is that people don’t necessarily take a rational approach to making decisions. The field of psychology contains extensive research on decision making including normative (how we ought to behave rationally), descriptive (how people actually make decisions) and prescriptive (how normative theories are applied) theories. In order to improve decision making we need to understand how individuals make decisions and what role data and information play in that process.
To better understand this situation we need to understand what influences the degree to which decision makers use data to make decisions rather than judgement or intuition. This balance of approach depends on: personality of the decision maker(s); perceived reliability of the data; type of decision; experience / expertise of decision maker. Cognitive approaches to decision making can be flexible and deal with complexity, however consideration must be given to the biases that people have and the role of judgement in the decision. With cognitive approaches the need remains to align the mental model of the decision maker with the entity and decision being made.
Report Structure
Following an introduction, the report begins by discussing the use of information in decision-making, emphasising the importance and currency of the issue and the benefits to be gained from improved use of information in decision making. This section includes definition of some terms that are key to the report.
Section 3 examines the use of data in decision-making, outlining the generic stages in the logical, rational process. Each stage is discussed in turn. Section 4 presents a number of examples of the application of such rational approaches of the use of information in decision making in practice.
Section 5 uses measurement theory to examine the application of the rational model, highlighting the danger of over interpreting data and indicating where caution needs to be taken.
Section 6 introduces the broader decision-making literature, primarily from the field of psychology, which investigates how decisions are actually made, including rational and non-rational approaches. Conclusions are drawn in section 7

The Use of Information in Decision Making
15/02/2008 4
1. Introduction Organisations today have access to almost unlimited amounts of data – sales, demographics, economic trends, competitive data, consumer behaviour, efficiency measures, financial calculations, etc. For example, over the last thirty years the field of performance measurement (PM) has been the focus of considerable attention from academics and practitioners alike in both the private and the public sector (Behn, 2003; Bovaird 1996; Carter et al., 1992; Hood, 2006; Johnson and Kaplan, 1987; Kaplan and Norton, 2004; Neely, 1999; Pollitt and Bouckaert, 2004; Smith, 1995a).
Research has shown that, through appropriate measurement and management of performance, organisations can greatly benefit in the following areas:
- Formulation, implementation and review of organisational strategy (e.g. Ahn, 2001; Butler et al., 1997; Campbell et al., 2002; Euske et al., 1993; Lingle and Schiemann, 1996; Veliyath, 1992);
- Communication to stakeholders of the results achieved, and strengthening of brand and reputation (Atkinson et al., 1997; McKevitt and Lawton, 1996; Smith, 1995);
- Motivation of employees at all levels, creation of a performance improvement culture, and fostering of organisational learning (Gittell, 2000; Malina and Selto, 2002; Roos and Roos, 1997).
Furthermore, research has shown that private companies have made substantial investments in performance measurement. Recent reports suggest that the average organisation with $1 billion sales spends over 25,000 person days planning and measuring their organisational performance. Additionally, companies such as Volvo believe that up to 20% of management time is associated with planning and budgeting, while Ford report that they spend some $1.2 billion a year on their budgeting process (Neely et al., 2001).
In the public sector, following the recent introduction of “New Public Management” reforms in a number of OECD countries, considerable attention has been paid to performance measurement by governments, practitioners and the media. In the UK, government departments estimate that they spend more than £150m per year solely to monitor progress on national targets (his figure does not include the costs of front line organisations providing data) (NAO, 2006).
Empirical research conducted in this field has shown how performance measurement can be generally productive and help improve organisational performance (cf. Cavalluzzo and Ittner, 2004; Davis and Albright, 2004; Ittner et al., 2003). However, if done poorly, it can be very expensive, and not only ineffective but harmful and indeed destructive (Royal Statistical Society, 2003). Therefore, in order to realise value and to help organisations become more sustainable in the longer term, it is crucial to improve the ways they measure and manage their performance.
Today, more than ever, companies have to work harder to keep up with the pace of change and increased global competition. To succeed in multi-channel, high-speed environments, organisations need to leverage the data they have at their disposal. Organisations today have access to almost unlimited amounts of data – sales, demographics, economic trends, competitive data, consumer behaviour, efficiency measures, financial calculations, etc.
However, many decision makers in organisations feel lost and perplexed. They have mountains of data and still are not capable of making the correct decisions, or understanding where they really are. They fall under the delusion that mere data is enough. If we have the data and facts, then what more do we need? In today’s connected digital economy, it is very easy to get data (too easy for the likes of many organisations). Yet, and possibly due to this phenomenon, it has become increasingly difficult to convert this data into meaningful

The Use of Information in Decision Making
15/02/2008 5
information. Managers today complain of “drowning in data while thirsting for information” Herrmann, K. (2001). Chopoorian et al. (2001) found that businesses currently analyse less than 7% of the data that they collect, whilst Ittner and Larker (2006) report survey data indicating that, despite collecting lots of data, organisations do not undertake the expected level of analysis on that data. Goff (2003) argues that the reduction in the cost of storing large amounts of data is causing organisations to be swamped with data. Neely et al. (2002) argue that there is a proliferation of data in organisations driven by the demands of information from an increasing number of stakeholders and an increasing number of internal initiatives. Organisations seem to be generating data at a much faster rate than any manager can master, and in parallel to that, the useful life of that data is collapsing. Those developing and managing five-year plans are being forced now to rely on monthly planning cycles.
“One of the most enduring traits of the information age is that we have focused too much on mastering transaction data and not enough on turning it into information and knowledge that can lead to business results” (Davenport, et al. 2000).
The problem has never been lack of useful tools or proven techniques. Most tools for data analysis, interpretation, and visualisation have been around for many years. Various disciplines have provided numerous ways to extract value form data like Industrial Engineering developments, Quality Management tools, Information Visualisation techniques, among others. Neither was the problem any lack of capable IT or business systems to deploy these tools. In the year 2000, World Research Inc. (World research Inc., 1999) estimated that the “business intelligence and data warehousing” tools and services market was growing at an average of more than 50% and was estimated to reach $113 billion by 2002.
As a result of the growing investment in information and the need to ensure that the return on this investment is maximised this report intends to review the literature relating to whether the better use of information leads to better decisions, and if so how this can be achieved.
The literature addressing the topics of decision making and the use of information is multi-disciplinary and spans topics such as management, social science, information technology, and human neurology and psychology. Many more subjects are almost certainly related. Consequently the literature is not cohesive, and each of the subject areas takes its own perspective. For example, much of the Information System (IS) literature concentrates on the properties of the IS itself, as evidenced by the literature review of Delone and McLean (2003), and not the properties of the wider socio-technical system. Conversely, much of the neurology literature understandably focuses purely on the cognitive aspects of individuals.
It is not surprising that with such a diverse research input, researchers in the fields of decision making and decision tools are far from reaching agreement concerning the mechanisms of the decision process, nor the best way to support these processes. In addition, it appears that few studies deal with how a Management Information System (MIS) can be constructed to aid the social cognition implied by an organisational context. This presents management practitioners, looking for applicable science to create technologies, with a substantial problem. To gain a practical insight into the science of decisions, we concentrate our attention on those areas close to the management context, namely marketing, management control and finance.

The Use of Information in Decision Making
15/02/2008 6
2. Extracting Value from Data There is research evidence suggesting that better use of information can improve decision making (Ittner and Larker, 2006; Davenport and Harris, 2007). The use of information to improve decision making and organisational outcomes is a topic that is receiving considerable attention with academics and consultants attempting to provide insights into how information can better be used. Ittner and Larker (2006) report the growing evidence that greater use of effective analysis tools deliver better financial performance. Davenport and Harris (2007) argue that traditional bases for competitive advantage have evaporated and that leading organisations are ‘competing on analytics’ by using sophisticated qualitative and statistical analysis using Information Technology to improve the information available to managers. They propose skills and technologies required to improve the use of information, whilst Hemmingway (2006) echoes the need to build analytic capabilities in order to improve decision-making. Furthermore Marchland et al., (2001) present an Information Orientation framework which integrates IT, information management and information behaviours and values to improve performance. Through the Evidence Based Management movement, Pfeffer and Sutton (2006a; 2006b) are attempting to promote the application of principles originating in medicine and education so that managerial decisions and organizational practices are informed by the best available scientific evidence.
In looking at the use of information in decision making there is an overriding causal model underpinning the analysis. The basis of the work in this regard is the conversion of data into information and information into knowledge to enable decisions to be made. Thus the assumption is that if we have better data this will enable us to have better information leading to better knowledge and hence better decisions.
This is a rational view of decision making which is implicit in much of the management research in the field. Many tools, techniques and technologies have been developed to support the conversion of data into information to inform decision making.
The terms data, information and knowledge are frequently used for overlapping concepts. These three concepts are ill- or ambiguously defined in the subject matter literature. As a result it is important that we begin by defining what is meant by the terms.
Definitions Data – The word data is the plural of Latin datum, past participle of dare, "to give", hence "something given". Thus in general, data consists of propositions that reflect reality. A large class of practically important propositions are measurements or observations of a variable. Such propositions may comprise numbers, words, or images.
“Measurement is an experimental and formal process aimed at obtaining and expressing descriptive information about the property of an object (phenomenon, body, substance, ...)” (Mari, 2007).
Information - The Oxford English Dictionary defines information as “Knowledge communicated concerning some particular fact, subject or event; of which one is apprised or told; intelligence, news.”
Hence the way the word information is used can refer to both "facts" in themselves and the transmission of the facts. The double notions of information as both facts and communication are also inherent in one of the foundations of information theory: cybernetics introduced by Norbert Wiener (1948).
Information is the result of processing, manipulating and organising data in a way that adds to the knowledge of the receiver. In other words, it is the context in which data is taken.

The Use of Information in Decision Making
15/02/2008 7
Knowledge – is what is known. Like the related concepts truth, belief, and wisdom, there is no single definition of knowledge on which scholars agree, but rather numerous theories and continued debate about the nature of knowledge.
Knowledge acquisition involves complex cognitive processes: perception, learning, communication, association, and reasoning. The term knowledge is also used to mean the confident understanding of a subject, potentially with the ability to use it for a specific purpose. Knowledge doesn’t exist until people are involved.
Epistemology is the theory of knowledge and is the branch of philosophy that studies the nature and scope of knowledge and belief. Much of the debate in this field has focused on analysing the nature of knowledge and how it relates to similar notions such as truth, belief, and justification. It also deals with the means of production of knowledge, as well as scepticism about different knowledge claims. In other words, epistemology primarily addresses the following questions: "What is knowledge?", "How is knowledge acquired?", and "What do people know?". The classical view of epistemology defines knowledge as being a product of both truth and belief as represented below.
According to Plato, knowledge is a subset of that which is both true and believed
Decision - A decision is a choice made from available alternatives. A decision is a final product of the specific mental/cognitive process of an individual or a group of persons/organisations which is called decision making, therefore it is a subjective concept. It is a mental object and can be an opinion, a rule or a task for execution/application.
Decision making - is the cognitive process leading to the selection of a course of action among alternatives. Every decision making process produces a final choice. It can be an action or an opinion. It begins when we need to do something but we do not know what. Therefore, decision making is a reasoning process which can be rational or irrational, and can be based on explicit assumptions or tacit assumptions.
The definition of these terms clearly indicates that knowledge and hence decisions are not solely rational processes. Authors such as Bazerman (2005) and Daft and Marcic (2003) suggest that there are at least two different approaches to decision making which need to be considered. Although a number of scholars have remarked that the “concept of objectivity in

The Use of Information in Decision Making
15/02/2008 8
accounting is largely a myth” (Morgan, 1988: 477), performance measurement, accounting and auditing are still seen as objective evaluations of reality by most academics and practitioners (Power, 1997).
The first stage of this research will look at the rational model and the use of data and information to inform decision making before going on to discuss the weaknesses of this view and alternative approaches.

The Use of Information in Decision Making
15/02/2008 9
3. Using Data As already mentioned, most organisations have an abundance of data available to them with which to make decisions with some complaining of “drowning in data whilst thirsting for information” Herrmann, K. (2001). There are a plethora of tools for managers to use to analyse data with the aim of improving decisions. Neely and Jarrar (2004) proposed the Performance Planning Value Chain as a systemic process for using data to enhance decision-making, bringing together a vast array of tools to extract value from data and focus efforts on what will add real value to the organisation. It aims to:
- provide a process for the transformation of data – often disorganised or dispersed in its original form – into high-quality, value-added information that enables the users to make more effective decisions.
- provide a process that coherently brings together a combination of skills for analysing and interpreting complex information from a variety of sources and the ability to present complex technical information to non-specialists, and an ability to add insights.
The Performance Planning Value Chain covers the process of extracting value from data, from setting the hypothesis at hand to planning action based on informed decisions. The Performance Planning Value Chain framework covers various steps for extracting value from data including: Develop hypothesis; Gather data; Data analysis; Interpretation; Inform/communicate insights; Make informed decisions and plan/take action. The PPVC is designed to move the organisation from working with data to effectively handling information and turning it into value adding knowledge and sustainable experience for competitive advantage. The PPVC framework is consistent with the Plan Do Check Act (PDCA) cycle made popular by Dr. W. Edwards Deming, who is considered by many to be the father of modern quality control; however it was always referred to by him as the "Shewhart cycle." Later in Deming's career, he modified PDCA to "Plan, Do, Study, Act" (PDSA) so as to better describe his recommendations. In Six Sigma programs, this cycle is called "Define, Measure, Analyse, Improve, Control" (DMAIC).
Fundamentally the subject of using information for decision making is concerned with the conversion of data into information and of that information into knowledge with which decisions can be made. The Performance Planning Value Chain (PPVC) is a prescriptive, normative model describing how this process can be undertaken. There are a host of tools and techniques that can be used at each stage to improve the value that can be extracted from the data available within the organisation, improving the return on the investment made in the gathering of information.
Whist the PPVC is a prescriptive framework, the stages within it are generic in nature and can be used as an organising descriptive framework through which to synthesise the vast literature related to this subject. The framework reflects the generic “Scientific Method” describing how data should be used. In review of this literature the process is not considered to be a linear or sequential process, but a set of activities in the process of using data to inform decision making. In reality each of the stages in this process can be undertaken independently.
Which Data
Data Collection
Data Analysis
Data Interpret-
ation
Commun-ication
Decision making / planning

The Use of Information in Decision Making
15/02/2008 10
If undertaken in a linear process data, defined in the first stage of the process becomes information when it has been given context and meaning through interpretation. When this information is combined with the beliefs of the decision maker(s) at the decision making stage it becomes knowledge.
Most management disciplines make some comment on the use of information to make decisions. The generic framework presented above has been used to organise the literature reviewed to provide generic insight is into whether and how information can improve decision making. The first part of the report is structured around this framework and discusses each of the stages in turn.
1. Which Data / Information to Collect If decision making is to be informed by information then clearly it is important what data is available. Not only does the availability of data enable a decision to be made, but in many circumstances data can indicate when a decision needs to be made. Although several authors have advocated deeper reflections in the performance management field, in order to move away from a “what gets measured gets done” standpoint (Chua and Degeling, 1993), it is still the case that collecting and reporting data, particularly performance measurement data, indicates that something is important and requiring of attention.
The performance measurement field has highlighted the problems of collecting the wrong data. By the early 1980s concerns about the measurement systems being used in organisations were growing. The increasing threat from Japanese manufacturers prompted widespread sole-searching the US, which in turn resulted in numerous articles questioning whether the American model of management was doomed. Hayes and Abernathy, writing in 1980, for example, asserted that: “Responsibility for competitive listlessness belongs not just to a set of external conditions but also to the attitudes, preoccupations, and practices of American managers. By their preference for servicing existing markets rather than creating new ones and by their devotion to short term returns and “management by the numbers”, many of them have effectively forsworn long-term technological superiority as a competitive weapon. In consequence, they have abdicated their strategic responsibilities” (Hayes and Abernathy, 1980).
Other vocal and influential authors, such as Robert Kaplan, from the accounting community, and Robert Hall, from the operations management community, began to criticise openly the measures traditionally used by organisations. The theme underlying their criticisms was that the world had changed – especially the world of manufacturing – and that the measurement systems now used in many organisations were inappropriate because they were encouraging inappropriate behaviours. Provocatively entitled papers, such as “Yesterday’s Accounting Undermines Production” (Kaplan, 1984) and “Measuring Manufacturing Performance: A New Challenge for Managerial Accounting” (Kaplan, 1983) highlighted the fact that traditional financial measures:
- Encouraged short-termism, for example the delay of capital investment (Banks and Wheelwright, 1979; Hayes and Abernathy, 1980).
- Lacked strategic focus and failed to provide data on quality, responsiveness and flexibility (Skinner, 1974).
- Encouraged local optimisation, for example “manufacturing” inventory to keep people and machines busy (Goldratt and Cox, 1986; Hall, 1983).
- Encouraged managers to minimise the variances from standard rather than seek to improve continually (Schmenner, 1988; Turney and Andersen, 1989).

The Use of Information in Decision Making
15/02/2008 11
- Failed to provide information on what customers want and how competitors are performing (Camp, 1989; Kaplan and Norton, 1992).
Although the critics continued (e.g. Schmenner, 1988), it appears that by the time Johnson and Kaplan’s “Relevance Lost” was published in 1987 the argument that the traditional accounting measurement systems were inappropriate for modern manufacturing firms had effectively been won.
This evolution in the use of data demonstrates that the data we collect defines the model of how we understand an entity or phenomenon about which a decision is to be made.
Purposes of Data The history of measurement 1 , which has evolved through the physical sciences and philosophy, teaches us a number of lessons about data which we collect and measurements that make. It teaches us that numbers do not belong to the physical world, entities do not have inherent values, only numbers which we assign to them. As measurement is an assignment that we make, any result reports information that is only meaningful in the context in which the data was collected including why the data is being collected and by whom it is collected. This is supported by Behn (2003) who clearly highlights that data should be collected for a specific purpose, and that data should not serve multiple purposes. This is supported by Goohhart’s Law (Goodhart, 1975) which states that once a social or economic indicator or other surrogate measure is used as a target it becomes useless for its original purpose of measurement / assessment. Similarly, Daníelsson, J. (2002) found that risk models break down when they are used for regulatory purposes.
Given the importance of context, it is worth taking some time to reflect on purposes and uses of data that are reported in the literature.
The importance of context in the identification and use of data is highlighted by Busby and Williamson (2000). In their study of the measurement and control of design engineers, a highly creative activity, found that measurement in such contexts is “inappropriate for managerial control, for attributing results to engineers or to the environment, and for concluding problem solving activities”. They note however that PM does have its uses despite numerous defects. They separate measures into strong and weak forms. The strong forms are:
- Control
- External reporting
- Diagnosis (without extensive contextual analysis)
The weak forms are;
- For alerting or prompting where discrepancies may be subtle
- Organisational learning
- Providing a common language for discussion
They regard the weak functions as more beneficial.
One of the tenets of the systems perspective is the notion of organisational controls (OC). In the past this has primarily been a management accounting system (MAS) of some
1 In this context measurement is refers to it in its broadest sense, i.e. data collection, originating in measurement of the physical sciences and developed in philosophy, rather than the more recent performance measurement field.
The Use of Information in Decision Making
15/02/2008 12
description. Chenhall (2003) defines a Management Control System (MCS) as “a broader term that encompasses MAS and also includes other controls such as personal or clan controls. OC is sometimes used to refer to controls built into activities and processes such as statistical quality control, just-in-time management.” (pg 129). Chenhall’s paper on the importance of context in information processing and control identifies that the variables implicated in the design of MCS can be traced back to contingency frameworks in organisational theory. These variables include environment, and the associated need for structural coupling, and technology, and the associated need for environmental scanning. Chenhall makes the important statement that “In considering MCS research since 1980, it is apparent that these key variables have been confirmed as descriptors of fundamental, generic elements of context”.
This resonates with the view of the continuous improvement (CI) community, including just in time, six sigma and lean thinking, in that understanding processes in their operational context is key to effective organisational learning, without which process improvement and design cannot occur effectively.
Chenhall’s work summarises a huge literature, his comments concerning MCS and the environment are enlightening;
“Propositions concerning the external environment and MCS:
- The more uncertain the external environment the more open and externally focused the MCS
- The more hostile and turbulent the external environment the greater the reliance on formal controls and an emphasis on traditional budgets.
- Where MCS focused on tight financial controls are used in uncertain environments they will be used together with an emphasis on flexible, interpersonal interactions” (P.138)
Hence, we see the importance of the ‘human-in-the-loop’, even when extensive MCS exist.
Otley (1999) like many others states that the traditional framework for considering how managers use information can be attributed to Anthony (1965). Anthony defined Management control as "the process by which managers ensure that resources are obtained and used effectively and efficiently in the accomplishment of the organisation's objectives." This definition limited subsequent researchers not only to envisage MCS as encompassing the largely accounting-based controls of planning, monitoring of activities, measuring performance and integrative mechanisms, it also served to artificially separate management control from strategic control and operational control. This demonstrates that even the management control field, the use of management information is broader than just the measurement of performance
Goold and Quinn, 1990, describe the role of strategic control systems as “the process which allows senior management to determine whether a business unit is performing satisfactorily, and which provides motivation for business unit management to see that it continues to do so.” In order to do this there necessarily must be some monitoring of performance, and an understanding of the feedback information so obtained. They note that “the attempt to identify a ‘few key strategic control variables’ will inevitably screen out much information of relevance to the skilful manager…” and in so doing focus attention on the largely subjective and intuitive nature of management decision. Information in this context is merely an aid to the human process of decision making, and is not a replacement for it.
The TQM field concentrates heavily on the process model of organisation. A key element of this is the concept of continuous improvement and organisational learning. Segar (1998), in

The Use of Information in Decision Making
15/02/2008 13
examining the role of MIS to support strategic planning, also notes the importance of “self analysis” through rigorous examination of information. Segar also notes that alignment of mental models is important to drive strategy implementation and cooperation.
de Haas and Kleingeld (1999) discuss how models of processes enable measures to be used to predict future performance. Otley (1999) also deals with the issue of prediction, commenting that information is a necessary ingredient to “complete the control loop”, indicating the focus on control typical of work in this area.
Behn (2003) indicated that as part of their overall management strategy, managers can use performance measurement data to evaluate, control, budget, motivate, promote, celebrate, learn, and improve. His research found that no single performance measure is appropriate for all eight purposes. Consequently, he concluded that managers should not seek the one magic performance measure. Instead, they need to think seriously about the managerial purposes to which performance measurement might contribute and how they might deploy these measures. Only then can they select measures with the characteristics necessary to help achieve each purpose. Without at least a tentative theory about how performance measures can be employed to foster improvement (which is the core purpose behind the other seven), public managers will be unable to decide what should be measured.
There has been extensive research in the performance measurement field on the purpose of collecting and using performance measurement data. Taken as a whole2, it can be argued that performance measurement systems have the following roles:
Manage the strategy implementation process, by examining whether an intended strategy is being put into practice as planned.
Challenge assumptions, by focusing not only on the implementation of an intended strategy but also on making sure that its content is still valid.
Check position, by looking at whether the expected performance results are being achieved.
Comply with the non-negotiable parameters, by making sure that the organisation is achieving the minimum standards needed, if it is to survive (e.g. legal requirements, environmental parameters, etc.).
Communicate direction to the rest of the employees, by passing on information about what are the strategic goals individuals are expected to achieve.
Provide feedback, by reporting to employees how they are, their group and the organisation as a whole is performing against the expected goals.
Evaluate and reward behaviour, in order to focus employees’ attention on strategic priorities; and to motivate them to take actions and make decisions, which are consistent with organisational goals.
2 By analysing the different roles of SPM systems mentioned in the work of: Archer and Otley (1991), Atkinson (1998); Atkinson et al. (2001), Bungay and Goold, (1991); Campbell et al. (2002), Dabhilakar and Bengtsson, (2002); Dumond (1994), Eccles (1991), Euske et al. (1993); Feurer and Chaharbaghi, (1995), Fitzgerald et al. (1991), Ghalayini and Noble (1996), Kaplan and Norton (1992, 1996b, 2001b), Kellinghusen and Wubbenhorst, (1990); Lebas (1995), Letza (1996), Martins and Salerno (1999), Martins (2000, 2002); Martinsons et al. (1999); Neely et al. (1995; 2002), Neely (1998), Otley (1999); Rajan (1992); Roberts (1990); Schneier et al (1991); Sink (1991); and Vandenbosch (1999).

The Use of Information in Decision Making
15/02/2008 14
Benchmark the performance of different organisations, plants, departments, teams and individuals.
Inform decision-making processes.
Encourage improvement and learning.
These SPM systems’ roles can be classified into three main categories:
Formulation, implementation and review of organisational strategy (e.g. Ahn, 2001; Butler et al., 1997; Campbell et al., 2002; Euske et al., 1993; Lingle and Schiemann, 1996; Veliyath, 1992);
Communication of the results achieved to stakeholders, and strengthening of brand and reputation (Atkinson et al., 1997; McKevitt and Lawton, 1996; Smith, 1995);
Motivation of employees at all levels, creation of a performance improvement culture, and fostering of organisational learning (Gittell, 2000; Malina and Selto, 2002; Roos and Roos, 1997).
Out of these three main categories, the one that differentiates a SPM system from a more traditional management control system (e.g. an accounting system) is the strategic category (Sprinkle, 2003). Furthermore, when a SPM system is used for making sure the strategy is being implemented as well as for questioning the validity of the strategy, it can be argued that this system is similar to what authors in the strategy literature refer to as “strategic control system” (e.g. Asch, 1992; Eden and Ackermann, 1993; Hrebiniak and Joyce, 1986; Muralidharan, 1997, 1999; Neely, 1998; Preble, 1992; Roush and Ball, 1980; Schreyogg and Steinmann, 1987) .
Previous research has suggested that how a SPM system is used influences business outcomes (Blenkinsop and Burns, 1992; Martins and Salerno, 1999). Simons (1990, 1994, 1995) argues that management control systems used interactively can guide organisational learning, influence the process of strategic control and therefore influence business results. “A management control system is categorised as interactive when top managers use it to personally and regularly involve themselves in the decisions of subordinates. When systems are used for this purpose, four conditions are typically present: Information generated by the management control system is an important and recurring agenda addressed by the highest levels of management; the process demands frequent and regular attention from operating managers at all levels of the organisation; data is interpreted and discussed in face-to-face meetings of superiors, subordinates, and peers; the process relies on the continual challenge and debate of underlying data, assumptions and action plans” (Simons, 1991).
In theoretical terms, a SPM system is meant to be an interactive system (Neely, 1998; Kaplan and Norton, 2001) since its main roles are to facilitate the implementation of the business strategy and to question strategic assumptions. Critics of the balanced scorecard have argued that this SPM system can only be seen as a diagnostic system of performance measurement. Given the multitude of measures, managers who try to use the balance scorecard, as an interactive system will be overloaded. Consequently, they won’t be able to interactively use the system (Weber and Scha¨ffer, 2000). However, this argument can be weakened by the findings of Lipe and Salterio’s (2000; 2002) studies. These two researchers have found that the use of the scorecard framework helps managers’ judgement, it improves their focus on what is important; and it does not create information overload. Further, Nilsson and Kald’s (2002) survey of Nordic firms has found that SPM systems are used both diagnostically and interactively.

The Use of Information in Decision Making
15/02/2008 15
Apart from the strategic purpose of the SPM system, its motivational purpose has also been stressed as a critical factor for its effectiveness (e.g.Eccles, 1991; Kaplan and Norton, 1992; 1996; 2001; Otley, 1999). A SPM system is used as a motivational device when it is integrated with the compensation system. Traditionally, evaluation and reward programs have been linked exclusively to company financial measures. But more companies are now using SPM frameworks to calculate their rewards. A consultant’s study has shown that 88 percent (out of 214) of large and mid-sized firms in the US find the balanced scorecard approach as an effective method to determine pay (Mercer, William M. & Co., 1999).
The use of performance measures in a compensation system or performance appraisals process is not a new topic in the management control or human resources literature (e.g. Boudreau and Berman, 1991; Coates et al., 1995; Chenhall, 1997; Datar et al. 2001; Williams et al, 1985). Previous academic research on this topic has been mainly concerned with the use of accounting measures in incentive schemes3 or in performance evaluation processes4. From the mid 90s, researchers started to focus on the use of non-financial measures in annual incentive schemes (e.g. Ittner et al. 1997a; 2002) or on the performance and behavioural effects of incorporating non-financial measures in incentive contracts (e.g.Banker et al, 2000; Scott and Tiessen, 1999). However, none of these researchers explicitly state that the type of financial and non-financial performance measures they investigate are the ones included in the companies’ SPM system.
Few studies have exclusively focused on the behavioural and performance effects of using the measures included in a company SPM system for reward and evaluation purposes. Moreover, an aggregated analysis of the findings extracted from those studies shows some contradictory results. For instance, two practitioners’ surveys, one carried out by Gates (1999) and another one by Maisel (2001); and several case studies presented by Kaplan and Norton in their 2001 balanced scorecard book (e.g. Mobil North America Marketing and Refining, Texaco Refinery and Marketing) have shown positive behavioural and business effects of the use of SPM systems to determine pay. Further an experiment developed by Swain et al. (2002) suggests that the perceived linkage between BSC metrics and divisional strategy has a significant and positive effect on the use of these metrics in individual’s performance evaluation processes.
However, research developed by Ittner et al. (2003a) or Ho and McKay (2002) has revealed that the use of scorecard measures in compensation might produce dysfunctional behaviours that can diminish the value of the SPM system itself and of companies’ business performance in the long run. In Ittner’s et al. (2003a) research, the use of the Balanced Scorecard for determining pay in the studied company increased the level of subjectivity in the reward system. Specifically these researchers found that the subjectivity of the system allowed superiors: to reduce the “balance” in bonus awards by placing most of the weight on financial measures; to incorporate factors other than the scorecard measures in performance evaluations; to change evaluation criteria from quarter to quarter; to ignore measures that were predictive of future financial performance; and to weight measures that were not predictive of desired results. These outcomes led many branch managers to complain about favouritism in bonus awards and uncertainty in the criteria being used to determine rewards, and caused corporate executive and human resource managers to question the scorecard’s use for compensation purposes.
In Ho and McKay’s (2002) study, the company investigated decided to develop a Balanced Scorecard, primarily, for compensation purposes. This clear purpose was not made explicit a
3 A detail analysis on the use of financial measures in reward practices can be found in Prendergast’s (1999) and Pavlik’s et al. (1993) literature reviews. 4 A detail analysis on the use of financial measures in reward practices can be found in Hartmann’s (2000) or Hunt’s (1995) literature reviews.

The Use of Information in Decision Making
15/02/2008 16
priori, and inconsistent messages were continuously sent to employees. As a result, resistance to the new system was high and the management team failed to implement the system. Using Data for Prediction Ultimately all decision making is about the future therefore if we are to use data to improve decision-making we need to build a model that provides some predictive support. It is insufficient for data to merely contribute to an understanding of current performance; it must also allow the development of predictive management capabilities in order to effectively manage risk and enable change (Wilcox and Bourne 2003). The ability to predict allows management to create robust systems and resources that are resilient to environmental variety, perturbations, and threats (Beer, 1972). This view of ‘management as prediction’ has a long and rich history (Shewhart, 1931, 1939; Deming, 1986; Peters, 1987; Handy, 1989; Drucker, 1998).
Wilcox and Bourne (2002) define prediction based on the work of Lewis “Prediction is an ongoing process of arguing from the past to the future. This means an interpretation of evidence which involves a prediction. Predictions are always hypothetical, and can never be true because of the variable nature of the process. In this sense, predictions must necessarily be constantly revised in the light of new experience as the future unfolds.”
Shewhart (1931) provides a detailed definition of the notion of ‘control’, which we will see is linked to prediction:
“For our present purpose a phenomenon will be said to be in control if through the use of past experience, we can predict, at least within limits, how the phenomenon may be expected to behave in the future. Here it is understood that prediction within limits means that we can state, at least approximately, the probability that the observed phenomenon will fall within the given limits" (Shewhart, 1931:6)
The link between control and prediction sets the scene for his thesis and is a dominant theme throughout his work. Wheeler, a leading authority on the work of Shewhart, succinctly relates prediction to the behaviour of processes and the function of management:
"Since prediction is the essence of management, this ability to know what to expect when a process is behaving predictably is invaluable" (Wheeler, 2000:24).
Shewhart was a physicist and he explained how scientists tried to understand the universe using exact, empirical and statistical laws. It is this combination of theory and empirical evidence that allows the development of belief, and thus prediction. As stated by Shewhart;
“… to be able to make [such] predictions it is necessary that we know certain laws. These laws may be exact, empirical, or statistical. Exact laws are generally stated in terms of the differential equations of physics and chemistry. Statistical laws are the frequency distributions arising from the very general law of large numbers. All other laws are empirical. The technique of finding and using exact and statistical laws is better established than that of finding and using what we term empirical laws” (Shewhart,1931:144).
In the context of performance measurement and management, the notion of prediction often relates to a dubious distinction made by managers between leading and lagging indicators (Ittner et al, 2003). Such a distinction is only meaningful when we consider causal models of organisation:
“In order to achieve performance, the causal model has to be defined in terms of leading indicators. Lagging indicators only provide history; leading indicators allow for the creation of the conditions for fostering performance. In order to

The Use of Information in Decision Making
15/02/2008 17
maintain the validity of the leading indicators, the model must be continuously validated for its relevance” (Lebas and Euske, 2002, p. 77).
Furthermore, this distinction cannot be maintained from a contingency perspective, because both labels can be applied to almost any measure. A lead indicator can be a result of a lagging indicator and vice-versa and the relationship is in constant flux (Kast and Rosenzweig, 1979; Rayburn and Rayburn, 1991; Strőh and Jaatinen, 2001; Willocks, 1998). Not surprisingly, ‘magic bullets’ in the form of predictive leading measures have proven to be an illusory concept for many in this field of study (Wilcox and Bourne, 2003).
The thesis of prediction put forward by Lewis (1929) and condensed into a pragmatic theory by Shewhart (Wilcox, 2004), is not predicated on the basis of ‘predictive’ or ‘leading’ measures (Wilcox and Bourne, 2003), but rather on the human process of prediction, using ‘normal’ 5 measures of process performance, structured by models of causality formed through experience and learning. In management decision making, these models are most often cognitive in nature (Oliver and Roos, 2005). Due to the presence of cognitive bias (see end noteI), affective influence and the enduring nature of belief (Friedman, 2004) the ability to predict demands a continual learning process to maintain the accuracy of our world view, the efficacy of our decision processes, and to keep pace with the rate of change in the world itself.
This means that prediction can be defined as a two-part process: firstly, arguing from the past to the future on the basis of existing data analysed through the application of mental models, and secondly, the development of mental models over time to overcome cognitive bias and inaccuracies (Friedman, 2004). As will be developed in the following sections, these processes have both individual and social aspects.
The complexity and rate of change in our environment, in the widest sense, means that our predictions will always be flawed judgments, rather than objective facts, as they are inevitably formed on the basis of incomplete information. The presence of time lags between an event and the moment of decision will inevitably exacerbate this problem. Beer (1994) clearly advocated that the most effective performance management system is one that is as close to real-time as possible. This resonates with the concepts of availability (Tversky and Kahneman, 1973) and primacy (Asch, 1946), i.e. that events that are easily remembered or accessed are perceived to have higher probabilities and consequently are of higher importance, and that the sequence in which information is presented will affect how each piece of information is used (Friedman, 2004). The use of real-time data goes someway to focusing management teams on the most relevant information, as long as the context and history of the data is also incorporated.
Hence, mental models, learning, social structures, and timely management reviews are the enablers of prediction. In the following sections we discuss each of these issues in detail. We first talk about how models facilitate prediction; then how bias and emotion both hamper and support decision making; we then consider how social structures facilitate prediction; and finally, how timely management reviews facilitate prediction
Prediction through Models
Despite the centrality of mental models in many of the contemporary theories of decision making (Craik, 1943, Johnson-Laird, 1983, 2001, Cannon-Bowers et al 1993, Connolly and Koput, 1997), the need for predictive models as part of a MIS is not often referred to in the PM literature (Wilcox and Bourne, 2003). This may be because organisational model building is problematic:
5 By ‘normal’, we mean a balanced mix of measures appropriate to understanding a situation, and often related to organisational functions, e.g. finance, human resources (Kaplan and Norton, 1996)

The Use of Information in Decision Making
15/02/2008 18
“One of the principal applications of measurement is to the building and validation of models of systems. The nature of soft systems means that their models are generally incomplete and have other inadequacies” (Finkelstein, 2005, p. 270).
At present there appears to be no universal solution for accurately representing organisational behaviour, causality and antecedents – it appears that we must accept that our models will be imprecise, as is the nature of models (Sterman, 2002). One tactic we can employ to develop our causal models of organisation is to develop our models iteratively and continuously, and apply the insight provided by them in small iterations, as suggested by Otley and Berry (1980).
The concept of causal models as the basis for a predictive MIS is an attractive proposition. However, pragmatic problems soon arise, primarily because of the sheer number of different models normally found within organisations – for example, we often find as many causal models of how an organisation ‘works’ in an organisation as there are employees. Otley and Berry (1980) note that:
“…within organisations there are usually multiple and partially conflicting predictive models rather than a single holistic model (e.g. separate models relating to employment of labour, production processes, marketing and finance)” (Otley and Berry, 1980, p. 239).
With few exceptions, these models are manifest as mental, rather than explicit, representations (Senge, 1990; Senge et al, 1995; Van Ackere et al, 1993). Hence, one of the problems that a MIS must address is the elicitation and alignment of these diverse mental models.
There are theories currently in development that suggest mental models are insufficient to describe group cognition (e.g. Moore and Rocklin, 1998, Nosek 2004). Nosek refers to the work of Winograd and Flores (1987) to support the assertion that all cognition is social in nature. Nosek, among others (for example Boland et al, 1994), maintains that information systems should be designed with the intention of supporting social, or distributed, cognition, rather than facilitating the use of individual or group mental models.
The notion of group cognition sublimating, while being comprised of, that of the individual has been raised by many philosophers. For example Koestler (1967), who in a similar fashion to Beer, suggests that groups are self-contained entities at a level of recursion above the individual. As yet these theories provide a less convincing argument than the prevailing mental model theory, and it may be that the basis for them is explainable through robust extensions of the mental model theory (e.g. Johnson-Laird et al. 2004). However, there is synergy between the concepts of group cognition and mental models (e.g. Thompson and Fine, 1999), and this active research area may provide useful insights in the future (e.g. Kirsh, 1991, Schwarz D.L., 1995, Stahl, 2006).
We have concluded from the above, that prediction through models relies on cognition and social interaction. This brings us to consider the issue of bias and emotion in the decision making process. Timely Management Review
In a dynamic environment it is vitally important that models can be quickly restructured to reflect changes and improved knowledge (Lebas and Euske, 2002). It has been proposed that periodic management review can help to elicit updated mental models from the participants involved in periodic reviews (Klein 1986; Simons, 1994; Tversky and Kahneman 1992; Kahneman and Tversky, 2000; Rouwette et al 2002), and previous researchers have demonstrated the ‘double loop’ (Argryis, 1976) power of well formulated, periodic management reviews of organisational performance (Lant, 1992; Martinez and Kennerley, 2005). Many commentators have noted that real-time data is correlated with improved

The Use of Information in Decision Making
15/02/2008 19
decision making, both in terms of the speed of decision (Eisenhardt, 1989) and in decision quality (Beer, 1972).
Since the work of Shewhart (1931, 1939) and Lewis (1929) much research work has been conducted that supports the dynamic and unfolding nature of human prediction. Recent work continues to support this view, and although researchers may not reference Shewhart directly, the underpinning philosophy is similar (e.g. Whitecotton et al, 1998; Edgell et al, 2004 O’Connor et al, 2005). In a study concerning the prediction of stock prices, Mulligan and Hastie (2005) found that not only is information better assimilated for predictive purposes when it is delivered in a ‘story’ format, but it is more effective when in chronological order.
The pragmatic approach to gaining insight from time-series data developed by Shewhart (1939) also provides a means for reducing the level of subjectivity in analysis of highly variable data. Shewhart’s Statistical Process Control (SPC) charts provide a comprehensive framework for assessing data (Neave, 1993), and this has the potential to remove at least some of the bias from data analysis (Wheeler, 1993).
Defining which data to collect We have established that the definition of the data that is to be collected is a crucial stage if we are to inform effective decisions. At this early stage, the first step is to think about the objective of the data analysis. Based on the purpose of the data collection and the scope of the decision to be made, a model of the entity about which the decision is to be made should be developed. This model will define what data is to be collected ensuring that the model defines the data to be collected rather than the available data driving the conclusions you are able to achieve. Ashby’s Law of Requisite variety requires that the model that we use to represent the entity should contain sufficient variables to reflect the complexity of the entity.
In interpreting information, our world view, expressed in terms of mental models, guides our conclusions. One world view with a collection of tools is the systems thinking – Senge (1990) illustrates the use of systems approaches for strategic decision making and organisational learning. Woodside (2006) describes the core proposition of systems thinking as “all variables have both dependent and independent relationships with other variables”. Systems modelling is one technique that explores these dynamic relationships. Such models can be built either as explicit statements of ‘thought experiments’, or using empirical or theoretical information to predict future system states. This use of information allows “groups to make explicit, reflect on, test, and improve the mental frames (i.e. set of assumptions and cause-and-effect relationships mostly held unconsciously by decision makers)” (Woodside 2006). Woodside identifies the use of causal maps, policy maps and systems dynamics models as powerful tools “that help us see the complexities of real-life systems”.
Tools used in this, are mainly those that help describe the scope of the decision to be made. Often these will describe the hypothesis of the decision and include Strategy development tools such as Strategy or Success Maps, Process Maps, and Gap Analysis.
2. Data Collection Whilst stage 1 is concerned with identifying what data we need to collect, stage 2 is concerned with how the data will be collected, whether the data is already collected and how can we gather it in an effective and efficient manner? While most organisations collect lots of data, not all have trust in all of their data. There are always issues with the data sources, how was the data collected, data collection points and timing, and generally how much trust can we put in the data, etc. This is usually due to non-credible and/or non-transparent data sources, a result of poorly designed measures, or a combination of both. It is not unusual to observe two people heatedly arguing over some dimension of performance and later find that

The Use of Information in Decision Making
15/02/2008 20
the root cause of their disagreement was the imprecise definition of a measure. It is for this reason that this step becomes important, and the tools used here were selected to ensure organisations follow a systemic and structured data collection approach.
Fundamentally this process is concerned with translating the conceptual definition of information defined in the model into an operational definition. In his managerial and statistical writings, W. Edwards Deming placed great importance on the value of using operational definitions in all agreements in business. As he said:
"An operational definition is a procedure agreed upon for translation of a concept into measurement of some kind."
The operational definition provides a common definition of a piece of data that everyone can understand. Without such a definition that is commonly understood the only person who fully understand the meaning of that data is the person who defined it. To demonstrate this Deming added:
"There is no true value of any characteristic, state, or condition that is defined in terms of measurement or observation. Change of procedure for measurement (change of operational definition) or observation produces a new number."
This second statement emphasises the importance of the operational definition and lies at the heart of many misunderstandings and misinterpretations of data which lead to the adage “lies damn lies and statistics”. It is easy to talk about changes or trends in a particular piece of data such as a performance measure, but unless we understand the precise formula used to calculate it and how the data was collected, we can not be sure that everyone has the same understanding of what that change or trend actually means.
An example of such an operational definition is provided in the performance measurement literature. A tool such as the Performance Measurement Record Sheet (Neely et al. 1997) specifies important criteria that should be defined when calculating any performance measure. These criteria are the Title (as defined in the model in stage 1); Purpose; Formula; Target; Source of Data; Frequency of data collection; Person responsible for data collection; Resultant action / reporting.
Such criteria are easier to define for performance measures and other forms of quantitative data but the need for an operational definition is equally important for qualitative data. There are a range of techniques for collecting qualitative data Dillman (1999) provides guidance on how to undertake effective surveys which are often used by organisations to assess the perceptions stakeholders, particularly customers and employees. A good questionnaire includes a good brief (why this survey); function of each question should are clear (focus); uses clear phrasing (avoid ambiguity); uses simple language (avoid difficult words, complex sentences, jargon); is easy to complete (avoid too long questionnaires, clear instructions); is attractive (professional look, spacing, font, print quality, not dauntingly long).
Interviews, focus groups and observations provide other mechanisms through which qualitative data can be collected.
In the collection of qualitative and quantitative data consideration of sampling is an important element that should be considered while defining the operational definition. If the full population of data is not being used, the way in which the sample is selected will significantly influence the insight that the data provides. The sample must be representative of the population as a whole, reflecting all of the key variables of that population.
3. Data analysis / processing Once we have all the right data collected via a process that can be trusted, this stage attempts to answer the question: What is the data telling us? At this point, data starts being transformed into information by using tools for quantitative and qualitative data analysis. These tools help dissect the data and show them in different lights to start understanding

The Use of Information in Decision Making
15/02/2008 21
what is the message contained in the data. Tools here include the basic seven tools of quality management (Histograms, Pareto analysis, etc.) among others. The outcomes from this stage would be the information – raw data transformed into value adding information (graphs, comparative tables, percentages, etc.).
4. Data Interpretation Interpretation of data is one of the key stages in the process of using data to inform decision making. Interpretation is to translate data into intelligible or familiar terms, it is at this point that data becomes information having been given context. It is important to differentiate this step from data analysis. Once the charts and graphs have been completed in the previous step, the question now becomes: what does that mean for the decision being made or objective we are seeking to achieve? This stage is crucial and attempts to deal with fundamental questions: What insights can we extract from the data? How will the message differ by changing the angle we look at data? This is converting information into knowledge and is done by adding the important elements of relevance and context which clarify the insights that are contained in the data. Spence (2001) refers to interpretation of information as achieving the Ah-ha moment. That is arriving at the moment at which the messages in the data become clear.
Sensemaking is typically defined as an interpretive process that results in the attachment of meaning to situations and events (Wagner and Gooding, 1997). The problem arises when the evidence is equivocal – equivocality is defined as when two or more possible conclusions are supported by the same information. Wagner and Gooding (1997) found that sensemaking is biased towards attribution of success to internal ability, and attribution of failure to external events or situations. They conclude that “As actors, respondents’ sensemaking showed evidence of self-serving inclinations to credit organisational strengths for organisational successes and blame environmental threats for organisational failures. As observers, respondents’ sensemaking showed the contrasting inclination to attribute organisational successes to the environmental opportunities and explain organisational failures in terms of organisational weaknesses”. The implications of this bias when dealing with information concerning current performance are that a combination of internal and external review is likely to be more capable of reducing equivocality than either in isolation.
Tools include information visualisation and benchmarking.
Information Visualisation - “Decision making can be immensely enhanced by presenting data graphically (and aurally) and allowing a user to interact with the data and rearrange its presentation” Spence (2001). There are many visualisation tools and techniques available that help to present data and information in a way that provides insight. Herrmann (2001) summarises traditional visualisation tools such as Tracking performance; Variances and Comparisons; Trends and Change; Relationships; Presentation; Value Ranges; Schematics and Maps; Organising Data and Information; Probability, Prediction and What-if. Tufte (1990, 1997, 2006) and Spence (2001) provide more dynamic and varied representation of information to enhance the insight that can be gained from it.
Benchmarking is a way of adding context to information by comparing it with that of comparable units of analysis. Camp (1989) identified four types of benchmarking to aide decision making.
- Internal Benchmarking - Comparison of internal operations. For example TNT use league tables to compare the performance of depots to learn about performance improvement (Moon and Fitzgerald, 1996);
- Competitive Benchmarking - Specific competitor-to-competitor comparisons for the product or function of interest
- Functional Benchmarking - Comparisons to similar functions within the same broad industry or to industry leaders

The Use of Information in Decision Making
15/02/2008 22
- Generic Benchmarking - Comparison of business functions or processes that are the same regardless of industry
Hussey (1997), Turner (2002) and The University of Cambridge Institute for Manufacturing (http://www.ifm.eng.cam.ac.uk/dstools/) provide further tools for the interpretation of data to provide information.
5. Communication Communication is concerned with delivering data and information to decision makers in a timely manner in an appropriate format. This may be communicating data or information depending on whether it comes before during or after the analysis and interpretation stages. Whether it is data or information that is being communicated the question becomes: how to best deliver the message we have concluded? Who is my audience and what do they want? What are the best channels for delivering my message? Great analysis and valuable insights could be lost if the message is not delivered in the right frame and light. It is, thus, prudent that once some insights have been identified that they are packaged in a suitable delivery channel for the audience they are targeting.
Research data suggests that 75% of what we know we learn visually. Further Tufte (1997) argues that “there are displays that reveal the truth and those who don’t”. He demonstrates this with the example of the Challenge space shuttle disaster in 1986. Engineers at Defence contractor Morton-Thiokol concluded that Challenger should not be launched as cold weather may cause failure of the O-rings that helped seal joints on rocket motor. They faxed 13 charts to NASA to make this point but no one at NASA made the clear connection and the Challenger was launched with disastrous consequences. Tufte uses this example to demonstrate that the way in which information is communicated is critical to the understanding of that information and that the communicator needs to choose a medium and format that the audience will understand. Ultimately if the audience “don’t get it” it is down to the communicator.
The effectiveness of communication can be assessed by the concept of Information Richness “Information Richness is defined at the ability of information to change understanding within a time interval. Communication transactions that can uncover different frames of reference or clarify ambiguous issues to change understanding in a timely manner are considered to be rich. Communications that require a long time to enable understanding or that cannot overcome different perspectives are lower in richness” (Daft and Lingle 1986, 560). The communication media determine the richness of the information processed. Typical information media can be arranged in decreasing order of information richness as follows: face-to-face meetings; telephone; written personal communications, written formal communications; and numeric formal reports. Face to face meetings are richest as they provide instant feedback, use language variety and are interactive. Numerical reports lack these qualities. Rich media enable people to interpret and reach agreement about difficult, unanalysable, emotional, conflict laden issues. Media low in richness are appropriate for the accurate and efficient transmission of unequivocal messages about routine activities of the organisation (Choo, 1996). This provides some explanation of the comment that “Managing a company by the means of the monthly report is like trying to drive a car by watching the yellow line in the rear view mirror.” (Myron Tribus quoted in Wheeler, 2000).
Skills and tools that can improve communication if used appropriately include Information Visualisation Tools; Presentation Skills; Written Content / Reports (Company Newspaper); Web Based Reporting; and Storytelling. In using such tools some general principles need to be considered:
- Identify the audience - get inside their heads
- Choose an appropriate mode of communication

The Use of Information in Decision Making
15/02/2008 23
- Use language the world (audience) will understand
What ever the context the way in which information is communicated for the message to be received the medium of communication must be trusted and biases in that medium recognised. Demos (2005) recognised that the news media apply their biases, whether conscious or subconscious, to the way in which they communicate information. For the information communicated to better inform the decision maker, they must trust the communication medium and understand its / their biases.
6. Decision Making / Action Planning It is at this stage that an organisation can take actions based on the information presented It is at this pint that information and the beliefs of the decision-maker(s) are combined to form knowledge. Armed with the insights from the previous stages, the questions at this stage include: how do we take action based on that data? How do we prioritise our actions? This is where all the work done so far can be transferred into actions to deliver bottom line value to the organisation. To succeed in this undertaking, the tools required include decision support tools, action planning tools, decision-making and prioritisation techniques, project management and feedback systems.
Making a decision based on data will be dependant on the data available to make that decision. If you only have partial data you won’t be able to make an informed decision although you may not realise that you don’t have sufficient data. Hemmingway (2006) summarises these requirements of data in order to inform decision making identifying the following requirements: Accurate; Timely; Current; Relevant; Complete; Interpretable; Consistent representation; Accessible; Traceable; Easy to use.
Supporting infrastructure Thus far the report has focused on how to undertake each stage of the organising framework so that information can be better used to improve decision making. In addition much of the recent literature has also emphasised the need for supporting capabilities to enable effective execution of the whole process. Davenport and Harris (2007) identify Organisational, Human and Technological capabilities and propose a five stage maturity framework to assess an organisation’s analytic capabilities. Hemmingway (2006) presents a process for developing information capabilities. Marchland et al. (2001) identify 3 categories of capability: (1) Information Technology practices (IT for operational support, IT for business support, IT for innovation support, IT for management support); (2) Information Management practices (Sensing, Collecting, Organising, Processing, Maintaining); and (3) Information Behaviours and Values (Integrity, Formality, Control, Sharing, Information Transparency, Information Proactiveness). Kennerley and Neely (2002; 2003) identified the need for People (skills); Process; Systems and Cultural issues to be managed to enable such a process to be managed effectively.

The Use of Information in Decision Making
15/02/2008 24
4. Application in Practice Key texts reporting approaches for exploiting information such as “Competing on Analytics” (Davenport et al., 2000; Davenport and Harris, 2007), “Information Orientation” (Marchland et al., 2001) and “Evidence Based Management” (Pfeffer and Sutton, 2006a; 2006b) contain present case examples of the application of their frameworks and claimed benefits to organisations. Of these Marchland et al (2001) present extensive research data to support their model. Davenport and Harris present examples at Strategic, Internal Process (Financial, Manufacturing, R&D, and HR) and External Processes (customer and supplier) levels. Sloan and Boyles (2003) also present evidence based performance improvement approach using process / Six Sigma based approaches
Use of Data for Strategic Learning and to Test Business Models Advocates of a “business model” approach to performance measurement propose formulating performance measurement systems around a diverse set of financial and non-financial performance measures that are linked to firm-specific strategies (Eccles, 1991). Kaplan and Norton (1992, 1996, 2000, 2004) argue that a balanced scorecard should not just be a collection of financial and non-financial measures in various categories, but rather an integrated set of measures developed from a business model that articulates the cause-and-effect relationships between the selected performance measures and outcomes. However, survey evidence suggests that only 23% of companies consistently build and test the strength and validity of the hypothesized business models (Ittner and Larcker, 2003). Corresponding to the lack of extensive causal modelling and validation among practitioners, the academic literature provides surprisingly little evidence on how companies develop explicit business models, whether these models can be validated, and how these models vary depending on contextual factors such as strategy, competitive environment, and organizational design (Ittner and Larcker, 2001). Exceptions include Malina and Selto (2004) and Abernethy et al. (2005), which provide field-based evidence on how companies develop explicit business models.
The first and most widely sited example of an organisation using data to test its business model is the Sears model illustrated in Rucci et al. (1998). More than 100 top-level executives at Sears, Roebuck and Co. spent three years rebuilding the company around its customers. The Sears model hypothesizes a chain of cause and effect running from employee behaviour to customer behaviour to profits. This model shows that a 5-point improvement in employee attitudes drives a 1.3-point improvement in customer satisfaction, which in turn drives a 0.5% improvement in revenue growth. Rucci et al. also shows that the business model works for Sears: customer satisfaction increased 4% after incorporating the results from the model into the choice of quality/customer initiatives and the design of their long-term performance plan. The increase in customer satisfaction led to an estimated $200 million increase in revenues, and ultimately an estimated $250 million increase in market capitalization.
In a similar study, Barber et al. (1999) report the case of a UK retailer. Its study of 65,000 employees; 25,000 customers and 100 individual stores found that (1) The service-profit chain has a sound empirical basis; there is a link between employee satisfaction, customer satisfaction and an increase in sales. (2) Customer satisfaction in itself, however, represents a weak link in the chain unless it is accompanied by customer loyalty (i.e. an intention to spend again). (3) Employee satisfaction and, more specifically, employee commitment to the company, directly affect sales increases. It also affects sales through improved customer loyalty and improved staff attendance. (4) This study shows that a one point increase in employee commitment can lead to a monthly increase of up to £200,000 in sales per store.

The Use of Information in Decision Making
15/02/2008 25
The authors developed a new model, "The Attitude Chain", in which they show the results obtained in their case study. These results are that: the perceptions of line managers are strongly related to perceived company culture, which in turn is strongly linked to employee commitment. Employee commitment is directly positively related to a change in sales, and also indirectly influences sales through its effect on customer satisfaction with service. Employee commitment additionally acts through customer satisfaction with service to also change sales. This effect is then mediated through the customer's behavioural spending intention to result in an increase in sales. The effects of employee commitment also act on sales via staff absence: that is, as employee commitment rises absence falls. This effect is then transmitted to sales through customer satisfaction with service and spending intention. A reduction in absence positively affects customer satisfaction with service. Employee commitment, then, acts on sales through three routes in the model: directly on sales, mediated through customer service satisfaction; and through reduction in staff absence.
Two recent studies also provide empirical evidence on whether firm-specific business models can be validated and how they vary with contingency factors. Campbell et al. (2006) analyse a diverse set of financial metrics and non-financial measures of strategy implementation and employee capabilities from the performance measurement system of a convenience store chain that implemented, and subsequently abandoned, a new operating strategy. They investigate the extent to which a diverse set of performance measures, and the links between these measures, reveal information about the quality and implementation of a firm’s strategy. They find that the impact of an increase in the firm’s non-financial measure of strategy implementation on financial performance depends on employee skill levels. These findings underscore the importance of considering interactions among non-financial measures of employee capabilities and strategy implementation when implementing business model based performance measurement systems.
Similarly, Nagar and Rajan (2005) adopts a models view that considers customer relationships as a multidimensional process that involves both financial and non-financial measures that are causally linked to each other. They employ a unique and comprehensive cross-sectional database on retail banks to demonstrate empirically how managers can use a set of customer relationships measures to identify cause-and-effect interrelationships among various customer relationship activities, including price metrics, service metrics, customer satisfaction, customer usage and volume metrics. They find that the individual metrics do not predict future earnings with any statistical significance, but they do so when combined. They also demonstrate that the forward-looking nature of non-financial measures depend on broader environmental features such as strategy.
Neely and Al Najjar (2006) report a case study investigating British Airways’ model linking Employee, Customer and Financial Performance. They report not only the way the analysis of data enable British Airways to understand the linkages between these dimensions of performance but also the implications for the use of data by organisations to learn about their strategic decisions and the assumptions underpinning them in order to revise their strategy based on evidence.
Use of Data to monitor and improve performance Numerous case studies have been presented to demonstrate that collecting data, particularly performance measurement data, can help improve performance. Kaplan and Norton have published a number of case studies describing the benefits they have seen in companies using the Balanced Scorecard. These include:
- Mobil Oil – from least to most profitable company in their sector in 2 years - Cigna Property & Casualty – from $275M loss to $60M profit in 2 years - Chemical Bank – profits increased by 19 times in 3 years
However these case studies provide little detail how these improvements were achieved, and particularly how the performance measurement data was used. There is also emerging

The Use of Information in Decision Making
15/02/2008 26
evidence that implementation of a structured or balanced performance measurement system has a positive impact on the management of the organisation, key areas of performance and the share price (Frigo and Krumwiede, 1999; Schiemann, and Lingle, 1999; Gubman, 1998; Gates 1999). However each of these studies assessed the impact of performance measurement systems by surveying the opinion of the managers in the company in question. There are few studies that investigate the way in which performance measurement systems change the way that organisations are managed, or that present empirical evidence of the actual impact of performance measurement systems.
There are a number of examples of organisations of the use of data to improve organisational performance. Neely et al (2002) and Neely et al (2006) draw conclusions emerging from their cases on how organisations can mage better use of information.
1. The Role of Performance Information: Learning not Control: Both DHL and EDF Energy have made significant shifts in the way that they use their performance measurement systems. They have sought to establish processes and routines – both formal and informal – that enable individuals to learn through measurement. In some cases, such as British Airways’, this learning actually results in people challenging the assumptions they hold about how their organisation operates (Neely and Najjar, 2006). In the organisational learning literature this distinction is often referred to as single versus double loop learning6. In single loop learning, corrective action is taken to bring performance back on track when it deviates. In double loop learning questions are asked about whether the track was right in the first place.
The shift – from measurement as a system of control to measurement as a system of learning – requires some subtle changes. Both DHL and EDF Energy have spent considerable time improving their formal performance review processes (see point 4 below), but they have also paid attention to the softer issues. DHL deliberately adopted the phrase “performance planning” rather than “performance review” to try and signal their change in orientation. Senior managers in EDF Energy devoted significant time to creating cultures of openness and debate, where the insights contained in the measurement data can be debated freely. Balancing the formal and informal is essential if the emphasis of measurement is to shift away from learning and towards control.
2. Performance Analyst Capability: Both DHL and EDF Energy took the crucial decision to establish appropriate performance management infrastructures. These infrastructures – often embodied in performance management teams – involve providing support not just for the processes of measurement, but also for the processes of extracting insight from data and sharing these insights once they had been extracted and validated. DHL’s performance analyst community fulfilled this role, initially working within functions, but latterly joining together as an integrated team. In EDF Energy the fertilisation teams fulfilled a similar role, although they also had a specific remit to disseminate good practice once it had been established.
In terms of skills, members of the performance analyst community need to be able to combine quantitative skills, with qualitative ones – including political and social skills. Performance analysts need to be able to analyse the firm’s data using valid statistical approaches. Having done so they need the intuitive skills necessary to explain what these data mean and then they need the social skills to be able to persuade others of the validity of their analyses. This combination of skills – the ability to quantitatively analyse data,
6 For a much fuller discussion of the distinction between single and double learning see the work of Argyris, C., and D. A. Schon. Organizational Learning: a Theory of Action Perspective. Reading, MA.: Addison-Wesley, 1978.

The Use of Information in Decision Making
15/02/2008 27
intuitively extract insight and sensitively communicate these insights – appear to be in relatively short supply in many organisations.
3. The Value of Theory: In the performance measurement design literature one of the tools that is widely advocated is success or strategy mapping. Success or strategy mapping involves building a causal model of the hypothesised links between an organisation’s performance measures (see box). Many managers appear to operate intuitively using such causal models, although the process of having individuals articulate their own causal models can often expose hidden differences of opinion which can subsequently be debated and examined.
Causal Models in the Public Service: The Health Service (Neely et al. 2006) There are a plethora of targets and indicators in the UK Public Service, many of which appear only loosely connected or correlated. One way of reviewing these targets and indicators would be to try and convert them into causal models. An over-riding objective for the health service, for example, is to reduce waiting lists. To achieve this hospitals are investing in capacity – most notably in the form of doctors and nurses, under the assumption that more doctors and nurses means more capacity. If there is more capacity, then more operations should be undertaken and hence waiting lists should be reduced. This set of statements translates to a causal model of the form: increase numbers of doctors and nurses -> increase capacity -> undertake more operations -> reduce waiting lists. The challenge, of course, is to link this strand of the Health Services’ causal map with other strands that are implicit in other targets and indicators. Building causal maps this way not only illustrates the coherence and comprehensive of sets of performance measures, but also highlights inherent conflicts or trade-offs that might exist.
As the example above illustrates, one way to think of causal models is to consider them as summary theories about how an organisation works – “we do X because we believe it will result in Y”. Clearly causal models, like all theories, are oversimplifications of reality, but they are valuable because they provide a framework for the performance analysts to begin to extract insight from data through the performance review process (see section 4).
4. The Performance Review Process: The performance review process is an important, yet apparently under-studied, element of the performance management system. A useful analogy to think of is that of a detective. Detectives gather data (evidence) from multiple sources and seek to collate that evidence so that they can develop a meaningful and justifiable interpretation of events. If the case they are preparing goes to court then the role of the judge and jury is to evaluate the comprehensiveness of the analysis and make an appropriate recommendation. Both DHL and EDF Energy have adopted similar processes for their performance reviews. The structure underpinning both organisations’ performance review processes is encapsulated in the performance planning value chain shown in figure below (Neely and Jarrar, 2004). The performance planning value chain emphasises the importance of shifting focus from reviewing past performance to planning future performance. The focus of performance planning reviews should be “how are we going to get to where we want to be” rather than “why we are where we are”. Too often in organisations performance reviews are designed in a way that simply encourages defensive behaviour. If the performance reviews are set up as an interrogation then those participating in them will prepare a defence. They will come to the reviews armed with reasons and excuses to explain why performance is not as good as it is expected to be. This interrogative approach to performance reviews can become extremely destructive in organisations. What matters is focusing on the future – exploring

The Use of Information in Decision Making
15/02/2008 28
issues such as how do we get to where we want to be given where we are now. Points 5 and 6 expand on this theme.
Add Value to Stakeholders
Add Value to Stakeholders
Develop Performance Insights
Apply Performance Insights
Gather Analyse Interpret Engage
Make Informed
Decisions
Plan &ExpediteActions
Work with DataWork with Data
Hypothesise Add Value to Stakeholders
Add Value to Stakeholders
Develop Performance Insights
Apply Performance Insights
Gather Analyse Interpret Engage
Make Informed
Decisions
Plan &ExpediteActions
Work with DataWork with Data
Hypothesise
Develop Performance Insights
Apply Performance Insights
Gather Analyse Interpret Engage
Make Informed
Decisions
Plan &ExpediteActions
Work with DataWork with Data
HypothesiseGather Analyse Interpret Engage
Make Informed
Decisions
Plan &ExpediteActions
Work with DataWork with Data
Hypothesise
The Performance Planning Value Chain
5. The Role of Senior Management: Senior managers exert significant influence over the tenor of performance reviews in organisations. One of the reasons that DHL found it so difficult to extract insight from their data was senior management’s tendency to request ever more data. Prior to redesigning their performance review processes, DHL’s senior managers used to try to analyse detailed performance data in real time during their performance reviews. Inevitably this approach would lead them to ask supplementary questions – the vast majority of which translated into requests for additional data. Between meetings the performance analysts would process these requests and generate yet more data for the next meeting of the senior management team. The senior managers would repeat the process, but faced with new data they would generate new supplementary questions and so the cycle continued.
Having redesigned their performance reviews DHL’s senior management team adopted a role much more akin to the judge and jury in the detective analogy. They expected their performance analysts to “work with the data” – see central bar in the performance planning value chain. Their role became to question to the quality of the analysis and to make informed decisions and expedite actions once they were satisfied with the evidence as presented.
6. The Balance of Effort: The reason that DHL’s senior management team were able to adopt a different role in the performance review process is that they accepted the need for a shift in effort. In many organisations the majority of the effort – when it comes to performance measurement and management – is exerted in the small box labelled “gather” in the performance planning value chain. Especially in situations where data resides in multiple locations in different databases, those responsible for collating statistics seem to have to spend a significant proportion of their time gathering data. In fact they often end up spending so much of their time gathering data that they never have the time to analyse and interpret the data thereby extracting insight from it. EDF Energy have recognised this problem and the organisation is deliberately seeking to equip people with the skills they need to address all stages of the performance planning value chain. Members of the firm recognise that the performance review process itself offers opportunities for individuals to improve their capabilities to analyse and interpret data.

The Use of Information in Decision Making
15/02/2008 29
7. Visualisation Matters: A common theme in those organisations that successfully extract insight from data is that they pay attention to the process of visualisation – the engage element of the performance planning value chain. In many organisations so much time and effort is spent gathering data that once the gather process is complete those responsible simply collate the data they have gathered into standardised templates and release the resultant performance reports. The problem is that this approach allows no time for analysis and interpretation of the data. A novel way of tackling this problem has been developed by a Belgian neurosurgeon, Professor Dr. Patrick M. Georges7. The Management Cockpit, inspired by the classic war room, uses over 100 indicators spread across the four walls of a meeting room (see figure Example of the Management Cockpit).
Example of the Management Cockpit
Each panel of six indicators relates to a specific question, similar in style to the questions DHL adopted. The four walls in the room are colour coded. The “black” wall contains a series of questions and associated panels of six indicators that relate to overall business performance. The “red” wall presents information about markets and customers, the “blue” wall about internal processes and resources, while the “white” wall contains information about the company’s key projects.
Other organisations have sought to adopted visualisations that reflect their strategy and/or success maps (see figure - Using Success Maps and Stories to Visualise Insight). The point is that in each case members of the organisation have considered carefully the issues associated with information visualisation. They are seeking to develop ways of presenting data that engages those reviewing it in a conversation about what the data mean and what insight they contain.
7 The Management Cockpit concept was originally developed by Patrick Georges and his company N.E.T. Research. In 1998 SAP acquired the intellectual property rights for the Management Cockpit. For further details see Daum, J.H. “Intangible Assets and Value Creation”, John Wiley & Sons Ltd, Chichester/UK, 2003.

The Use of Information in Decision Making
15/02/2008 30
ValueCashflowversus planNew
sales
% cross selling to clients
Customer Retention
Cost to income ratio
SLA adherence
Purchasing power
Labourturnover
Sickness and absenteeism
Performance reviews
Value creation is under threat because of cost escalationEscalating costs in the travel business are adversely affecting our value creation strategy. Of particular concern is the growth in headcount in Nordic and Canadian regions. In Nordic staff costs have grown by 12% in the last quarter. In Canada staff costs have grown by 9%. In the same period income has only grown by 3%. Specific steps are being taken by the management teams in both of these regions to address this issue.
Performance reviews need attentionOnce again we have serious challenges in terms of completing performance reviews. Of the 6,200 reviews that should have been completed to date, only 1,278 have been completed. We need to focus our efforts on this, particularly in the non-travel businesses.
Customer retention is excellent for the second year running
We have been successful in retaining our major clients for the second year running. Of particular importance is the recent confirmation of the NHS contract and the business travel contracts for Astra Zeneca, Barclays, ICI, Morgan Stanley and Shell. Congratulations to all involved.
ValueValueCashflowversus planCashflowversus planNew
salesNew sales
% cross selling to clients
% cross selling to clients
Customer RetentionCustomer Retention
Cost to income ratioCost to income ratio
SLA adherenceSLA adherence
Purchasing powerPurchasing power
LabourturnoverLabourturnover
Sickness and absenteeismSickness and absenteeism
Performance reviewsPerformance reviews
Value creation is under threat because of cost escalationEscalating costs in the travel business are adversely affecting our value creation strategy. Of particular concern is the growth in headcount in Nordic and Canadian regions. In Nordic staff costs have grown by 12% in the last quarter. In Canada staff costs have grown by 9%. In the same period income has only grown by 3%. Specific steps are being taken by the management teams in both of these regions to address this issue.
Value creation is under threat because of cost escalationEscalating costs in the travel business are adversely affecting our value creation strategy. Of particular concern is the growth in headcount in Nordic and Canadian regions. In Nordic staff costs have grown by 12% in the last quarter. In Canada staff costs have grown by 9%. In the same period income has only grown by 3%. Specific steps are being taken by the management teams in both of these regions to address this issue.
Performance reviews need attentionOnce again we have serious challenges in terms of completing performance reviews. Of the 6,200 reviews that should have been completed to date, only 1,278 have been completed. We need to focus our efforts on this, particularly in the non-travel businesses.
Performance reviews need attentionOnce again we have serious challenges in terms of completing performance reviews. Of the 6,200 reviews that should have been completed to date, only 1,278 have been completed. We need to focus our efforts on this, particularly in the non-travel businesses.
Customer retention is excellent for the second year running
We have been successful in retaining our major clients for the second year running. Of particular importance is the recent confirmation of the NHS contract and the business travel contracts for Astra Zeneca, Barclays, ICI, Morgan Stanley and Shell. Congratulations to all involved.
Using Success Maps and Stories to Visualise Insight
8. The Dynamics of Processes: Underpinning much of the preceding discussion is an assumption that organisations wish to improve their performance. While this assumption can hardly be questioned, the rate at which organisations can improve is an open question. The most common ways of establishing performance standards and targets are either to review historical progress or find an appropriate benchmark comparator. The shortcoming of both of these approaches is that they ignore the underlying dynamics of the processes which organisations operate. Art Schneiderman, a US based quality expert, explored this particular issue when studying what he called “the half-life of organisational improvement”. Schneiderman found that the rate at which an organisation could improve its performance was constant when plotted on a logarithmic scale (Schneriderman, 1988). A related body of work is seeking to explore ways in which improvement targets can be set for organisations based on the statistical properties of the organisational processes they operate (Wilcox et al, 2006).
9. The Lifecycle of Decisions: A particularly important aspect of the EDF Energy case is their focus on the lifecycles of decisions. Just as processes are dynamic, EDF Energy recognises that decisions have lifecycles. The four step process adopted by EDF Energy: (i) identify if the solution solved the problem, (ii) analyse the impact of the solution on other operations, (ii) enhance the solution, and (iv) identify when it is no longer needed – is an example of a best practice that many firms – in both the public and private sectors – could usefully emulate.
10. The Sharing of Insight: Related to this point is EDF Energy’s focus on sharing of learning and experience. The formal “fertilisation scheme” is one example of how such schemes can operate. Other organisations adopt slogans to summarise their approach. Siemens, for example, with its RAG (red-amber-green) reporting uses the shorthand – AORSOG: act on red, share on green. From a theoretical perspective two important issues to bear in mind with these best

The Use of Information in Decision Making
15/02/2008 31
practice sharing schemes are the questions of context and ability to absorb 8 . Clearly practices that prove to be “best” in one context, may not be best in another and indeed may not even be adoptable in another. It is for this reason that throughout this report numerous examples of practice have been offered. The challenge for organisations as they seek to extract insight from their data is to adopt the bundle of practices that best fit with their specific circumstances and needs.
In addition Bourne et al. (2005) studied the way in which managers in a branch based business use information differently on a branch by branch basis. Comparing good and average performing branches they found that in average-performing business units, performance was managed using a simple control approach. Data were captured through the standard company systems, simply analysed and compared against company targets. The results were then communicated and acted upon. In comparison, although the same approach was evident in high-performing business units, this was not the main source of control. In high-performing business units, the simple control approach was used to verify performance at the end of the period, but the main drive for performance came from continual interaction with the performance data. Branch managers had their own data collection systems and indicators of performance. They created their own approaches to analysis and used these to project forward future performance. They then intervened using their knowledge of the situation throughout the period, rather than waiting for period end feedback. Branch managers in high-performing business units were also more sophisticated and explicit in their understanding of the drivers of performance, more intense in their communication and more varied in their courses of action. However, the “interactive” nature of how they managed performance is the most prevalent difference observed between high and average-performing business units.
Moon and Fitzgerald (1996) report the practices in TNT where there are five properties of the performance measurement system which have facilitated the translating of strategy into action. (1) the company measures the right things in that dimensions are consistent with corporate strategy, (2) it provides standards for performance through internal benchmarking, (3) it adopts a mixture of financial and non-financial based rewards. (4) it uses of league tables to report the relative performance of the depots, and (5) there is a strong corporate champion who drives the message and importance of the performance measurement system from the centre to the depots.
Use of Data for External Reporting HSBC’s recent publication of a 454 page annual report has focused attention on the annual report as a means of communicating performance information (Jopson, 2007). It highlighted the fact that despite the large amounts of effort and resources that organisations dedicate to their production, annual reports don’t provide information in a useful format for their users.
Through their leading ValueReporting research (www.corporatereporting.com; Eccles et al., 2001), PricewaterhouseCoopers have observed changes in approaches and attitudes to corporate reporting over a number of years. Their research shows that the majority of CEOs believe that their stock prices are either significantly over or under valued. A survey conducted in 1998, for example, found that 40% of CFOs in US and UK believed that their
8 For a more detailed review of the challenges of context see chapter 7 of Delbridge, R. et al. (2006) “The Exceptional Manager”, Oxford University Press, Oxford. He challenges of absorbtion are discussed extensively in Lesure, M.; Birdi, K.; Bauer, J.; Denyer, D. and Neely, A.D. (2005) “Making Best Practices Stick: How UK Firms Can Increase Productivity By Adopting Leading-Edge Working Practices”, Advanced Institute of Management Research, London.

The Use of Information in Decision Making
15/02/2008 32
company’s stock was undervalued. Furthermore the PwC research found that those involved in all sides of the capital markets are questioning what information they need to be better able to understand current organisational performance and predict future performance.
To address this issue PwC have developed a framework (ValueReporting) that provides guidance on how to incorporate information on the business’ value drivers into a company’s internal reporting systems, so that management can become familiar with how the value drivers translate into sustainable cash flows. This framework includes:
- Market Overview (competitive position, regulatory environment, macro-economic
environment). - Value Strategy (goals, objectives, governance, organisation). - Managing for Value (financial performance, financial position, risk management and
business segment analysis). - ValuePlatform (i.e. drivers of value - innovation, brands, customers, supply chain, people,
reputation - social, environmental, ethical).
PwC argue that management make little attempt to communicate this information and their research found that although investors and analysts both demand more information on the cost structure of businesses, the quality of cost information is generally poor. In addition they highlight the benefit of XML and XBRL tags that can be used to automatically identify data required by investors or analysts, facilitating increased reporting speed and ability to manipulate data. The research predicts that in the future data will be made available in real-time and data on “soft issues” that will enable value judgements to be made will be released.
In terms of best practice, PwC have also identified exemplar companies against each of the elements in their ValueReporting framework. Each year PwC present the latest trends in corporate reporting and update their best practice examples which included:
- Market overview - requiring companies to give a clear and unbiased overview of the markets in which they operate, covering current and anticipated economic regulatory and competitive conditions. 1. Competitive environment (Telstra; Volvo). 2. Regulatory environment (United Utilities). 3. Macro-economic environment (Alcan; Munich Re Group; Noranda inc.; United
Utilities; Volvo) - Value Strategy - clearly setting out the company’s strategy. Stating what they are striving
to achieve, what steps they are taking to deliver the strategic goals and how these steps will create value for the shareholders. 1. Goals & Objectives (Bank of Montreal; Barclays; Dow Chemical; Mackenzie Financial
Corporation; Novo Nordisk; Shell). 2. Governance (Dow Chemical; Mackenzie Financial Corporation; Novo Nordisk; Shell). 3. Organisation (Novo Nordisk)
- Managing for Value - clearly communicating the results of actions taken to achieve the
strategic objectives. 1. Financial performance (Alcan; Bank of Montreal; BP Amoco; Diageo; ING Group;
Manitowoc Co.; Rio Tinto; Siemens). 2. Financial position (ING Group; JP Morgan; Siemens). 3. Risk management (Deutsche Bank; JP Morgan). 4. Business segment analysis (Alcan; Deutsche Bank; JP Morgan; ING Group;
Siemens) - ValuePlatform - clearly communicating all of the non-financial elements that need to be
actively managed to optimise shareholder value.

The Use of Information in Decision Making
15/02/2008 33
1. Innovation (Axcan Pharma; Coloplast; Maintowoc). 2. Brands (Carl Bro Group; SCA; Shell). 3. Customers (Canada Trust; Coloplast; The Cooperative Bank; i2 Technologies; Post
Denmark; The SAS Group; Suncorp Metaway; Westpac). 4. Supply Chain (BT; Coloplast; The Cooperative Bank; Post Denmark; The SAS
Group). 5. People (BP Amoco; BT; Coloplast; The Cooperative Bank; Post Denmark; Shell). 6. Reputation (BP Amoco; BT; Rio Tinto; The SAS Group; SCA; Shell; Xerox
Corporation)
The good practice examples are featured on the website www.corporatereporting.com according to the degree to which they manage to report consistently across the Corporate Reporting Framework and fulfil at least the majority of the following criteria:
- Feature both financial and non-financial information
- Make a clear link between the information presented to the strategic objectives of the business
- Provide targets and goals
- Ensure clarity by using simple, understandable language
- Provide information that investors need to make decisions
- Include quantified metrics that support the narrative commentary
- Report the information in a candid fashion
- Present information that is consistent and comparable over time.
The Report Leadership (RL) Initiative (www.reportleadership.com) draws on this research to challenge thinking on corporate reporting. It concludes that the current reporting model is too often approached as a regulatory box-ticking exercise. Information is thrown into the report and investors are left to find the relevant bits. Companies fail to see reporting as a communication tool. They argue that companies should take a step back and think about what they need to communicate – and what investors want to know.
To stimulate debate, the RL group produced a company report for a fictitious firm known as Generico. The Generico Report was designed as a blueprint and focuses on three areas: modelling the future, rethinking the financials and effective communication. The Generico Report aims to counter the shortcomings of traditional reports with a good structure, good navigation and clear messaging. The Generico Report included specific suggestions for achieving clarity:
• organise information into a logical sequence: this is what we do, these are the opportunities and risks, this is how we’re addressing them, here’s how it’s working (or not), these are our future plans
• link strategy to results and KPIs. Report on the delivery of overall strategic goals • introduce important elements of the story early on, then expand on them throughout
the report • carry themes through the report from start to finish using consistent terminology.
The challenge for companies is to structure information so that investors’ time is spent reading the investment case, not looking for it. Companies are often reluctant to repeat information in different parts of the report and indeed excessive repetition is unhelpful. However, the average reader does not read a report from cover to cover - they dip in and out looking at sections of interest. Ruthless avoidance of repetition could cause confusion. A good test is to read individual sections on their own: do they tell a clear and complete story or

The Use of Information in Decision Making
15/02/2008 34
would the reader benefit from more context? To address the navigational concerns of investors the Generico Report:
• includes a clear table of contents, supported by a thumb index and colour-coded sections. This helps readers move quickly to the right part of the report
• repeats information or gives cross-references to provide context • provides a quick-read summary at the start of each new section • includes clear titles and sub-headings • uses box-outs in financial statements to emphasise key figures • provides a glossary and index.
Companies often bury crucial messages in text or fail to spell them out at all. Investors and other users may have to plough through the whole document before they can work out what is going on. Clear messaging helps guide the information that readers take from the report and shape the conclusions that they draw from it. The investors we talked to told us that they wanted reports written in plain English. They must be clear, with a balanced discussion of performance, and evidence to back up the main messages. The Generico Report responded to these requirements by:
• explaining what management believes are the critical issues, spelling out important messages
• presenting key messages using clear typography - pull-out quotes, titles, bullet points and sub-headings
• providing graphical information • sticking to some golden rules – tell it like it is, explain don’t spin, don’t fudge the tricky
bits. Avoid jargon, unexplained acronyms, formality and pomposity.
The Generico Report is an attempt to bring together these ideas using practical examples.
The developments in the “use of data for external reporting” referred to in this section highlight a number of issues that have broader resonance when considering the use of information in decision making. These include:
- Consider the audience for the information to be communicated and tailor the mode and format of communication appropriately;
- Information technology can be used to enable the recipient / audience for information to interrogate the information / data so that they can better understand it and make their own interpretation. This includes tools such as XBRL tags which enable issues of particular interest to be flagged and emphasised;
- Although making decisions about the same subject, different stakeholders have different interests and therefore different information requirements to inform them
- Aligning the internal and external reporting models increases consistency and understanding of performance. It also increases the faith of external stakeholders that they are receiving the pertinent data to make informed decisions.

The Use of Information in Decision Making
15/02/2008 35
5. What can we Learn from the History of Measurement ? In the evolution of the concept of measurement over time, there are conclusions from theory as it has developed from the physical sciences and philosophy, which can inform our understanding of the use of information in decision making. The theory of measurement9 can be considered to be in the relativistic period: “Measures are results of operations recognised as adequate for their goal of obtaining information on measured things” (Mari, 2007). Furthermore reflection on current thinking on the theory of measurement indicate that
- Numbers do not belong to the physical world, i.e. entities do not have an inherent value, but only the value that we put on them;
- Measurement is an assignment, therefore any result reports information that is meaningful only in the context of the model utilised (including who and why the data is collected);
- What exists and the criterion of truth have been replaced by information and a criterion of adequacy;
- The design of a performance indicator is aimed at producing results adequate to given goals, and not ‘ideal’ or ‘true’ values;
- Objectivity and empiricity are targets to be reached. New measures are not seen as forms of insight, but appear to be absolute truths about reality as it is;
- Measure is an insight created by man. When measure is identified with the very essence of reality, this is illusion;
- The results of a measurement should convey information related only to the measured thing, and not to its environment.
This theory has some clear implications for the use of information in decision making. A key element is that the data we collect are not reality but our interpretation of is. This is demonstrated in the figure below. The entity about which we are making a decision exists in the empirical world. The model, explicit or implicit, which defines the data we collect about that entity is in the symbolic world. Hence there is translation from the empirical to the symbolic. As reflected in Ashby’s Law of Requisite Variety the model defining the data to be collected must reflect the complexity and variety of the empirical entity if the data collected is to be sufficiently insightful about the entity. Converting the conceptual definition in the symbolic model into an operational definition that allows a common understand of the actual data to be collected is a further translation resulting in another model. The same concept may be measured in two different ways providing two different sets of data. Hence the data collection stage has its own model, seldom is this recognised.
9 In this context measurement is refers to its broadest sense, i.e. data collection, originating in measurement of the physical sciences and developed in philosophy, rather than the more recent performance measurement field.
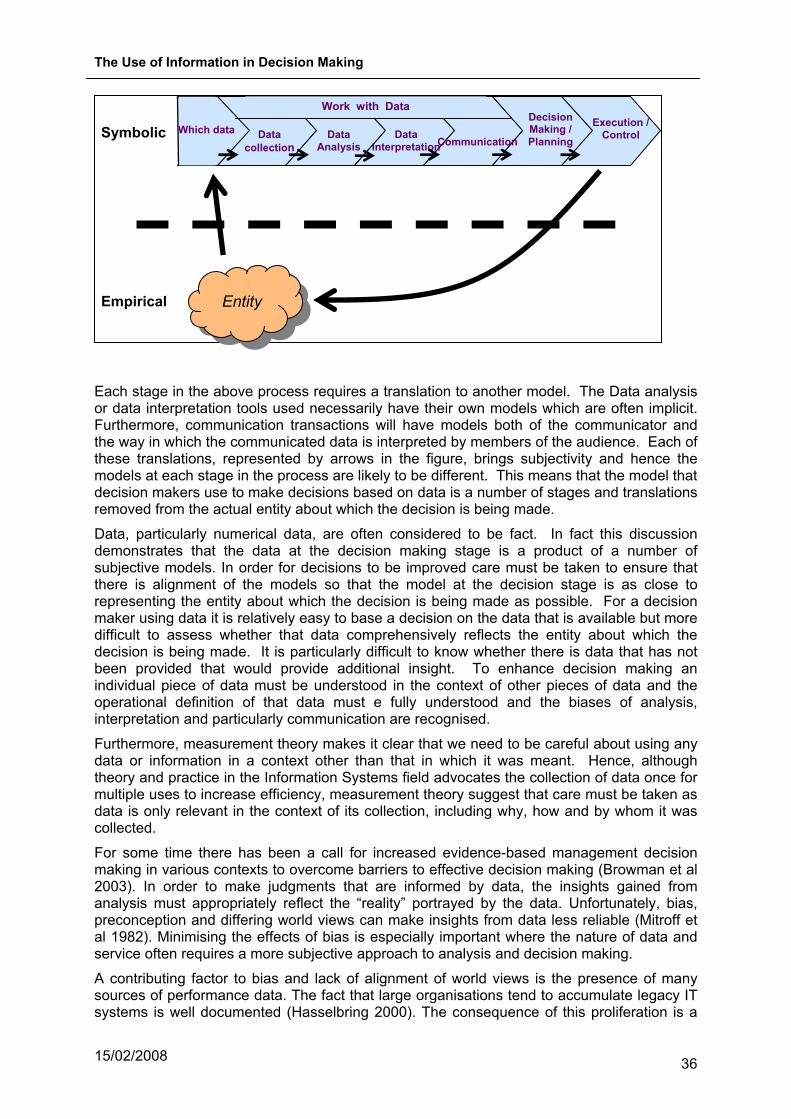
The Use of Information in Decision Making
15/02/2008 36
Each stage in the above process requires a translation to another model. The Data analysis or data interpretation tools used necessarily have their own models which are often implicit. Furthermore, communication transactions will have models both of the communicator and the way in which the communicated data is interpreted by members of the audience. Each of these translations, represented by arrows in the figure, brings subjectivity and hence the models at each stage in the process are likely to be different. This means that the model that decision makers use to make decisions based on data is a number of stages and translations removed from the actual entity about which the decision is being made.
Data, particularly numerical data, are often considered to be fact. In fact this discussion demonstrates that the data at the decision making stage is a product of a number of subjective models. In order for decisions to be improved care must be taken to ensure that there is alignment of the models so that the model at the decision stage is as close to representing the entity about which the decision is being made as possible. For a decision maker using data it is relatively easy to base a decision on the data that is available but more difficult to assess whether that data comprehensively reflects the entity about which the decision is being made. It is particularly difficult to know whether there is data that has not been provided that would provide additional insight. To enhance decision making an individual piece of data must be understood in the context of other pieces of data and the operational definition of that data must e fully understood and the biases of analysis, interpretation and particularly communication are recognised.
Furthermore, measurement theory makes it clear that we need to be careful about using any data or information in a context other than that in which it was meant. Hence, although theory and practice in the Information Systems field advocates the collection of data once for multiple uses to increase efficiency, measurement theory suggest that care must be taken as data is only relevant in the context of its collection, including why, how and by whom it was collected.
For some time there has been a call for increased evidence-based management decision making in various contexts to overcome barriers to effective decision making (Browman et al 2003). In order to make judgments that are informed by data, the insights gained from analysis must appropriately reflect the “reality” portrayed by the data. Unfortunately, bias, preconception and differing world views can make insights from data less reliable (Mitroff et al 1982). Minimising the effects of bias is especially important where the nature of data and service often requires a more subjective approach to analysis and decision making.
A contributing factor to bias and lack of alignment of world views is the presence of many sources of performance data. The fact that large organisations tend to accumulate legacy IT systems is well documented (Hasselbring 2000). The consequence of this proliferation is a
Data collection
Which data
Entity
Symbolic
Empirical
Data Analysis
Data Interpretation Communication
Decision Making / Planning
Execution / Control
Work with Data Work with Data

The Use of Information in Decision Making
15/02/2008 37
lack of agreement as to the relevance of data surrounding problems and potentially a lack of agreement about the underlying factors governing the service delivery model. Hence, to be effective a MIS must bring together a variety of data sources in a form that supports collaborative problem solving, unifies the data, gains acceptable data quality and aligns the world views of the MIS stakeholders (Mason and Mitroff, 1974, Banker and Kauffman, 2004).

The Use of Information in Decision Making
15/02/2008 38
6. Judgement in Decision-Making As has been stated much of the management research focuses on a rational and logical approach to decision-making, using tools to help use data and information to inform decisions. However the wide literature on decision-making from a broad range of disciplines emphasises that there is more to decision making than rationality. Necessarily all decisions are about the future, and as such must include at least an element of judgement. This is consistent with the classical definition of knowledge from the literature on Epistemology, which states that any knowledge is a function not only of truth but also of belief. We have already discussed the need to challenge the idea that data and information should be considered as truth or fact. Further from Information Theory the conclusion from following Shannon is that information has no value in itself. The value of information comes out mainly in connection with human action or as an indirect relation (Shannon & Weaver, 1959).
Stanovich and West (2000) refer to two different approaches to decision making as two “systems” where:
- System 1 refers to our intuitive system which is typically fast, automatic, effortless, implicit and emotional and emotional;
- System 2 refers to slower, conscious, effortful, explicit and logical (Kahneman, 2003)
Similarly, Daft and Marcic (2003) refer to Classical and Administrative decision making models where ;
- Classical Model - Goals are known and agreed upon. Problems are precisely defined; All alternatives and outcomes are calculated; Criteria evaluated and decision maximising economic return is made; rationality and logic are used.
- Administrative Model - describes how managers actually make decisions in difficult situations; managers make decisions with uncertainty and ambiguity; many decisions are not quantitative; managers are unable to make economically rational decisions.
Most decisions are unprogrammed and have at least some degree of uncertainty, ambiguity and complexity. Complex decision situations require a combination of data, experience, and knowledge, and often must draw upon inputs from many personnel. Hence we need to investigate the role of the decision maker in making decisions.
Bias and Emotion in Decision Making
It is widely regarded that humans are efficient ‘pattern recognisers’, and that this ability is part of our evolutionary heritage, as discussed by Bolhuis and Goodman (2005). Despite the long development period of this ability, it is often flawed. Numerous researchers have indicated the need for caveats in the area of human judgment, including the seminal work by Simon concerning bounded rationality (e.g. Simon, 1983). The problems of cognitive bias have been known for many years (see for example, endnoteI, Tversky and Kahneman, 1973, 1974, Sterman, 1989, Kahneman and Lovallo, 1993) and it is generally agreed that although humans are able to gain a great deal of information from direct experience, our processing abilities are questionable in some key areas, especially in probabilistic environments.
Decision makers are often influenced by emotion, personal perception, and numerous subjective influences (Kahneman and Tversky, 2000, Oatley and Johnson-Laird, 2002). In his work on bounded rationality, Simon (1983) suggests that there is no such thing as ‘dispassionate debate’, and that humans are prone to bias caused by passion, invective and feelings (Simon, 1983, pg 10).

The Use of Information in Decision Making
15/02/2008 39
Hsee et al (2003) also refer to ‘hot’ affective, or emotional, factors in decision making. Conversely, their research, associated largely with consumption or ‘hedonic’ decisions, suggests that modern decision makers may be too ‘cold’ and artificially focus too much on numeric and rationalistic data. They explain this partly in relation to ‘lay scientism’, which implies that decision makers place more weight on hard attributes such as numerical data relative to soft or qualitative attributes. They conclude that the nature of the decision and its context will affect the bias brought to bear. This is contrary to much of the literature in consumer research, although Oliver and Roos (2005) report similar conclusions in managerial decision making contexts. Similarly, research in neuroscience and psychology has concluded that not only do ‘hot’ and ‘cold’ processes of cognitive analysis create different insights from data and information, but also that emotion is essential to rationality (e.g. Damasio, 1994, Slovic et al, 2004).
The problem of emotional affect during the decision process has been the subject of numerous research studies in a range of fields of psychology, as examined by Schwarz, N. (2000), and economics, for example Bolhuis and Goodman (2005). Part of this problem is that managers often reject affect as being present in decisions at all (Langley et al 2005), or that decisions should be isolated from emotion, (Howard, 1993). Schwarz’s (2000) review of social psychology indicates one reason why an ‘anti-affect’ movement may exist. Referring to the information-processing paradigm as a potential ‘culprit’, prevalent since the early 1960’s, he considers that this paradigm has fostered a view of individuals as mere information processors.
Contemporary research paradigms are beginning to alter this view, for example Pham et al (2001), who state that according to the affect-as-information framework, individuals rely on their feelings because they perceive them as valuable information. The work conducted by Pham et al (2001) in the field of consumer choice also indicates that not only do some forms of decision making involving emotions offer more stable results and may be more conducive to mental model alignment in groups, but that,
“The conscious monitoring of feelings can be significantly faster than the cold, reason-based assessment of the stimulus’s qualities” (Pham et al, 2001, p. 184).
Hence, in the context of analysing system issues and predicting future process behaviour, bias can translate into a reliance on numerical data, especially in finance or operations, and a rejection of affective elements of decisions. We maintain that rarely can effective conclusions be drawn purely on this basis, as real world problems inevitably involve social and political dimensions resulting from the perspectives of multiple stakeholders (Neely et al, 2002). Assuming that an unbiased assessment of data is not achievable due to the presence of innumerable factors (Tufte, 1997), what can be done to attempt to counterbalance the effects of bias? In practical terms it is tempting to merely separate rational and affective decision making processes to obtain a balanced predictive outcome. Schwarz, N. (2000) suggests that such a simplistic solution is not feasible, as the interplay between cold and hot decision processes controls the decision outcome, and other mediating variables also have an impact.
One of the mediating factors in this interaction identified by Schwartz is personal motivation. Schwarz draws the important conclusion that the evolving synergistic view of motivated and affective reasoning is compatible with the pragmatic emphasis of the motivated tactician metaphor (Schwarz, N. 2000), a concept originally proposed by James over a century ago. The social cognition research metaphor of the ‘motivated tactician’,
“…builds on William James’ pragmatic credo…It emphasises that humans have ‘multiple information processing strategies available, selecting among them on the basis of goals, motives, needs and forces in the environment’ (Taylor, 1998, p.50)” (Schwarz, N. 2000, p.156).

The Use of Information in Decision Making
15/02/2008 40
This implies that it is not just goal alignment amongst a management team that is crucial in driving alignment in decision making, but also motivation. In the healthcare context, the work of O’Connor and Fiol (2002) supports this view that emotion and motivation, what they term “hot interpretative processes” (O’Connor and Fiol, 2002, p.19), are powerful forces in management decisions and action, especially during periods of upheaval.
Our personal research experiences within healthcare organisations support this view, although we would challenge the view that it occurs only during times of radical change. Ongoing observation of acute trusts over an 18-month period suggests that trusts can rarely be described to be in stable periods, and that emotionally charged, social decision making occurs constantly.
We conclude that emotional responses must be incorporated into a rational decision process in a way that controls for bias, and that they can help us to be more effective when making predictions (Spender, 2003). This is contrary to what appears to be the usual explanation of emotional decision making, i.e. that we act emotionally but justify rationally (Bolhuis and Goodman, 2005).
The social nature of decision making introduces a huge number of additional variables, both affective and rational (Katz and Kahn, 1966). Humphrey’s observation (Humphrey, 1976) that the context of social community not only supports information transfer and group processing, but also provides a supportive environment for personal learning. Such support appears of key importance to successful decision making in the long term. Software vendors and researchers alike often seem to ignore this social element. Again, Schwarz attributes this, at least in part, to the focus on the ‘computer metaphor’;
“This focus resulted in a neglect of the social context in which humans do much of their thinking, both in terms of the immediate interactional context and in terms of individuals’ embeddedness in a broader cultural context” (Schwarz, N 2000, p. 150).
From the issues explored in this section it is apparent that organisations need to manage both the rational and emotional elements of the decision process. As the basis for effective prediction, decisions should be influenced by individual and group processes. In the literature, the dichotomy of ‘hot and cold’ decision processes provides a useful continuum for characterising predictions. At one end of the scale, cold processes are rational and repeatable, while a ‘half-way-house’ along this continuum, ‘warm’ decision making, has elements of both rational analysis and emotional intelligence, but is conducted by individuals in isolation. At the other end of the scale hot decisions are emotional, discursive and by nature conducted in groups. Hot processes are therefore highly complex and governed by a wide range of factors. In the next section we consider the implications of social decision making in the context of performance management systems.
Social Structures as Decision Enablers
Although central to many theories of decision making, causal models and their related performance measures are not the only requirements for effective prediction, as there must also be a willingness to use the information and models (Lebas and Euske, 2002). Hence, we must ensure that a MIS engenders decision making, both for individual decision makers, and for groups, in a format that evades the trap of proscription.
Group decision making was shown by Beer (1972) both mathematically and subjectively to be critical for effective organisational prediction. The format of decision making in Beer’s thesis is multi-nodal, collaborative, and social (Beer, 1994), as lone decision makers are more prone to bias and error. Similarly, Ariely et al (2000) demonstrated that the average prediction of a number of participants is significantly better than lone decision makers.
Other researchers have identified the importance of prescriptive social forms of management decision making, for example Simons (1991), whose seminal work on Management Control

The Use of Information in Decision Making
15/02/2008 41
Systems (MCS) 10 identifies four necessary requirements for a socially interactive MCS. These can be summarised as; integration, the degree to which the MIS is the ‘currency of discussion’; frequency of use, the level of acceptance of the MIS; social interaction, the amount of social discussion caused by and focused around the MIS; and organisational learning, the degree to which the MIS supports the questioning of the underlying assumptions of the organisation.
Simons (1994) also describes the purpose of a MCS as being to;
“focus attention, provide an underlying logic and language, induce public commitment, and create shared beliefs (Swieringa and Weick 1987)”.
With the addition of the requirement to support management predictions, this definition conforms to our understanding of the nature of predictive MIS. Hence, these four criteria form the basis of the specification for a predictive MIS. The first, second and third can be interpreted as making the MIS the ‘currency of discussion’ – the MIS should be the first port of call for information to address a problem, and the content of the MIS should be the informational ‘glue’ that permeates the organisation and creates firm relationships between functions. The benefits of this are alignment of the management team towards a single data source, timely interaction with problems, increased visibility, and continual improvement of data quality and collective development of the MIS over time.
The third point also indicates the need for social intercourse as a natural component of decision making. This facilitates the elicitation and development of mental models, subjective interpretation and sharing of meanings, beliefs, and convictions, and sharing of theory, leading to the fourth criteria, which directly targets the continual development and convergence of mental models.
There is a powerful caveat to the proposition that groups can combine disparate sources of insight. The work of Janis (Janis, 1972) dealing with the biases that groups can create, and the barriers to dissemination that can be produced, serves as a reminder that team working can lead to sub-optimal decisions. One of the primary antecedents of ‘groupthink’ is a cohesive group (e.g. Moorhead et al, 1991). A related effect, the ‘inside view’, was identified by Kahneman and Lovallo (1993); a cognitive bias that means group members focus more on their current group context than evidence from external sources. This can be effectively countered by exposing the group to an ‘outside view’: an experiential and pragmatic assessment driven by historical and enumerative data. Other researchers have demonstrated that positive aspects through effective management of team processes can counter the negative aspects of groupthink; what Neck and Manz (1994) refer to as ‘teamthink’. Recent IT research (e.g. Dennis, 1996) has demonstrated that although effective MIS design and use can help mitigate the effects of groupthink, they are by no means a guarantee of effective process.
We therefore reach the conclusion that, if we can mitigate the negative affects of groupthink, a data based, interactive and social process is an important enabler for decision making. This brings us to consider the requirements of the management review process.
Following their extensive review of the literature on intuition in decision making Dane and Pratt (2007) have developed a model of the factors influencing the effectiveness of intuitive decision making.
10 We recognise that an MCS subsumes a MIS, and represents the infrastructure that supports both the MIS and its use.

The Use of Information in Decision Making
15/02/2008 42
Naturalistic Decision Making The Naturalistic Decision Making (NDM) framework emerged as a means of studying how people actually make decisions and perform cognitively complex functions in demanding situations. These include situations marked by time pressure, uncertainty, vague goals, high stakes, team and organisational constraints, changing conditions, and varying amounts of experience. NDM argues that the brain is able to cope with making decisions in these circumstances (Klein et al. 1993)
The work of Klein and his colleagues has been brought into the mainstream by popular books by Gladwell (2005) and Claxton (2005), both of which emphasise the fact that the brain can cope with far more complexity than our conscious mind would think possible. They argue that decision makers can use this capability to apply to decision making by applying the individuals mental model and experience to a situation and make an appropriate decision.
In the context of the rational decision making framework based on the performance planning value chain used in this report, NDM would suggest that if we have the right model at the decision making stage then individuals can cope with the complexity of the situation to make appropriate decisions. This means that if we can align the mental models of decision makers at the decision stage to the entity, or at least our model of the entity it should be possible for the individual to cope with more complexity with greater flexibility than is the case through the rational approach.
We can influence the mental model that decision makers have. Leadership, management behaviour and organisational culture can help individuals to develop a mental model which will guide decision makers towards the right decision. By their behaviour and messages that they communicate leaders can demonstrate the model of behaviour that they expect. Similarly the managerial actions and behaviour that is rewarded and punished, a clear indication of expectations can be established. If this pervades the organisation, a culture can be established which will help guide decision makers in making appropriate decisions.

The Use of Information in Decision Making
15/02/2008 43
The literature demonstrates that all decisions contain a rational and judgemental or intuitive element. The rational model of use of information in decision making proposes one way in which decisions that groups or individuals make can be influenced. However the implicit mental models that are used to make decisions can also be influenced in order to improve them or align them to a desired model or outcome. This can be achieved by communicating and reinforcing the model or reality or hypothesis at the beginning of the process directly to the decision maker(s) in an attempt to align the mental model to this hypothesis. Within an organisation this can be done by leadership demonstrating and reinforcing the actions that are expected and establishing a culture where actions and intended behaviour or outcomes are established and understood. Internally or externally this may be achieved by establishing and communicating the principles or philosophies surrounding the context of the decision. Concise and pertinent mission statements or philosophies and help to guide decisions within organisations in a similar way to that of political philosophies which can establish the overriding expectations or objectives, without necessarily guiding or controlling individual decisions through the use of data and information.
Given that all decisions will contain a rational and a judgemental or intuitive element, to understand the degree to which information influences a decision or set of decisions, it is necessary to understand what balance of rational and judgemental is in each situation. To better understand this situation we need to understand what influences the degree to which decision makers use data to make decisions rather than judgement or intuition. This balance of approach depends on:
- Type of decision (programmed vs. non-programmed / classical vs. administrative / system 1 vs. system 2)
programmed decisions involve situations that have occurred often and for which decision rules can be developed and applied. Managers can formulate decision rules so that subordinates can make decisions freeing managers for other tasks. non-programmed decisions are unique; poorly defined; largely unstructured; uncertainty and complexity are great; routine decision rules for solving the problem do not exist.
System 1 refers to our intuitive system which is typically fast, automatic, effortless, implicit and emotional and emotional; System 2 refers to slower, conscious, effortful, explicit and logical (Kahneman, 2003);
- Availability and perceived reliability of the data
- Certainty of outcomes associated with different options
- Experience / expertise of decision maker
- Decision making environment
- Personality of the decision maker(s). Tools such as Myers-Briggs Type Indicator (MBTI) can give an indication of a person’s preferred decision making approach.
- The cognitive biases that influence the decisions in a give situation. i
By understanding the these factors in different contexts and for different decision makers it is possible to better understand how decisions are made and provide the appropriate information in a manner that is most likely to influence the decision in question.

The Use of Information in Decision Making
15/02/2008 44
7. Conclusions
- There is research evidence that use of information can improve decision making and be developed in to a competitive capability for organisations.
- Much of the research in the management literature has focused on a rational approach to decision making which involves the use of data to inform decisions.
- Most managers have enormous amounts of data and plethora of tools and techniques exist to analyse and interpret data. In order to extract the maximum value out of the data that is available a structured approach to working with data should be used to inform decision making. Tools and techniques can be applied to improve the execution of each stage of this structured approach.
- The use of tools and techniques should be supported by an enabling infrastructure and capabilities that support execution.
- Considerable care should be taken when using data in context or for a purpose other than that for which it was originally collected.
- Data and information are attributed to entities by people, hence we should not be considered to be fact or truth.
- To improve decision making through the use of data and information the models reflected in the data and in the decision makers mental model should be as closely aligned to the entity about which the decision is being made as possible.
- People don’t necessarily take a rational approach to making decisions. We need to understand how individuals make decisions and what role data and information play in that process.
- To better understand this situation we need to understand what influences the degree to which decision makers use data to make decisions rather than judgement or intuition. This balance of approach depends on: Personality of the decision maker(s); Perceived reliability of the data; Type of decision; Experience / Expertise of decision maker.
- Cognitive approaches to decision making can be flexible and deal with complexity, but must be aligned to the entity and decision being made.

The Use of Information in Decision Making
15/02/2008 45
References Abernethy, M. A., M. Horne, A. M. Lillis, M. A. Malina, and F. H. Selto. (2005), A multi-method approach to building causal performance maps from expert knowledge, Management Accounting Research, Vol. 16, pp 135-155.
Ariely, D., Au, W. T., Bender, R. H., Budescu, D. V., Dietz, C. B., Gu, H., Wallsten, T. S. and Zauberman, G. (2000), The effects of averaging subjective probability estimates between and within judges, Journal of Experimental Psychology: Applied, Vol. 6, No. 2, pp 130-147.
Argryis, C., (1976), Single-loop and double-loop models in research on decision making, Administrative Science Quarterly, Vol. 21, No.3, pp 363-375.
Asch, S.E., (1946), Forming impressions of personality, Journal of Abnormal and Social Psychology, Vol. 41, pp 258-290.
Banker, R.D. and Kauffman, R.J. (2004), “The evolution of research on information systems: a fiftieth-year survey of the literature in Management Science”, Management Science, 50, 3, pp 281-298.
Barber, L., Hayday, S. and Bevan. S. (1999), From people to profits, The Institute for Employment Studies Brighton, UK.
Bazerman, M. H., (2005), Judgment in Managerial Decision Making, John Wiley & Sons Inc; 6th edition
Beer, S. (1972), Brain of the firm, Chichester: John Wiley.
Beer, S. (1994), Beyond dispute: the invention of team syntegrity, John Wiley.
Behn, R D, (2003), Why Measure Performance? Different Purposes Require Different Measures, Public Administration Review, Vol. 63, No. 5, pp 586–606.
Boland, R.J., Tenkasi, R.V. and Te’eni, D. (1994), Designing information technology to support distributed cognition, Organization Science, Vol. 5, No. 3, pp 456-475.
Bolhuis, M. and Goodman, N. (2005), Reading between the lines of investor biases, Journal of Financial Planning, Vol. 18, No. 1, pp 62-70Anthony, R.N. (1965), Planning and control systems, Graduate School of Business, Harvard University, Boston, MA.
Bourne, M., Kennerley, M. and Franco-Santos, M. (2005), Managing through measures: a study of impact on performance, Journal of Manufacturing Technology Management, Vol. 16 No. 4, pp. 373-395
Browman, G. P., Sneider, A. and Ellis, P. (2003), Negotiating for change. The healthcare manager as catalyst for evidence-based practice: changing the healthcare environment and sharing experience, Healthcare Papers, Vol. 3, No. 3, pp 10-22.
Busby, J.S. and Williamson, A. (2000), The appropriate use of performance measurement in non-production activity: The case of engineering design, International Journal of Operations & Production Management, Vol. 20, No. 3, pp336 – 358.
Camp, R C (1989), Benchmarking - the search for industry best practices that lead to superior performance, ASQS Quality Press, Milwaukee, Wisconsin
Campbell, D., Datar, S., Kulp, S. L. and Narayanan. V. G. (2006), The strategic content of non-financial performance measures. Working paper. Harvard Business School.
Cannon-Bowers, J.A., Salas, E. and Converse, S.A. (1993), Shared mental models in expert team decision making. In Castellan, N.J. (Ed.), Individual and group decision-making: current issues, Lawrence Erlbaum Associates, pp. 221-246.

The Use of Information in Decision Making
15/02/2008 46
Chenhall, R.H. (2003), Management control systems design within its organizational context: findings from contingency-based research and directions for the future, Accounting Organizations and Society, Vol. 28, pp 127-168
Chopoorian J A, Witherell R, Khalil O E M, Ahmed M (2001), ‘Mind your business by mining your data’, SAM Advanced Management Journal, Vol. 66, No, 2, pp 45-51
Chua, W.F, and Degeling, P (1993), Interrogating an accounting-based intervention on three axes: instrumental, moral, aesthetic, Accounting Organizations and Society, pp.291-318.
Claxton, G., (2005), The Wayward Mind: An Intimate History of the Unconscious, Little, Brown, London.
Connolly, T. and Koput, K. (1997), Naturalistic decision making and the new organizational context, In Organizational Decision Making, edited by Shapira, Z., pp.285-303, Cambridge University Press.
Craik, K., (1943), The Nature of Explanation, Cambridge University Press.
Damasio, A. (1994), Descartes’ Error: emotion, reason and the human brain, Vantage.
Dane, E and Pratt M G, (2007), Exploring Intuition and its Role in Managerial Decision Making, Academy Of Management Review, Vol. 32, No. 1, 33–54.
Daníelsson, J. (2002) The Emperor Has No Clothes: Limits to Risk Modelling, Journal of Banking and Finance, Vol. 26, pp. 1273-96.
Daft, R.L. and Lingle, R.H. (1986), Informaton Richness: A new Approach to Managerial Behaviour and Organizational Design, in Auster, E and Choo, C.W., Managing Information for the Competitive Edge, Neal-Schuman Publishers, New York, pp 171-215.
Daft, R.L. and Marcic, D. (2003). Understanding Management, South-Western College Publication; 4 edition.
Davenport, T.; Harris, J.; De Long, D.; and Jacobson, A. (2000), Data to Knowledge to Results – building an analytic capability. Institute for Strategic Change. Andersen Consulting.
Davenport, T.H. and Harris, J.G. (2007), Competing on Analytics: The New Science of Winning, Harvard Business School Press, Boston, MA.
de Haas, M. and Kleingeld, A. (1999), Multilevel design of performance measurement systems: enhancing strategic dialogue throughout the organisation, Management Accounting Research, Vol.10, pp 233-261.
Delone, W.H. and McLean, E.R., (2003), The Delone and McLean model of information system success: a ten year update, Journal of Management Information Systems, 19, 4, 9-30.
Deming, W.E. (1986), Out of the crisis, MIT Press.
Demos (2005) ‘Press protest’ is politics of the future, March 17, 2005, available from www.demos.co.uk
Dennis, A.R. (1996), Information exchange and use in group decision making: you can lead a group to information, but you can’t make it think, MIS Quarterly, 20, 4, 433-457.
Drucker, P.F. (1998), Peter Drucker on the profession of management, Harvard Business School Press.
Eccles, R. G. (1991), The performance measurement manifesto, Harvard Business Review, Vol. 69, No. 1, pp 131-137.
Eccles, R.G, Herz, R.H., Keegan, E.M. and Phillips, D.M.H (2001), The ValueReporting Revolution: Moving Beyond the Earnings Game, John Wiley & Sons, New York.

The Use of Information in Decision Making
15/02/2008 47
Edgell, S.E., Harbison, J.I., Neace, W.P., Nahinsky, I.D. and Lajoie, A.S., (2004), What is learned from experience in a probabilistic environment? Journal of Behavioral Decision Making, Volume 17, Issue 3, 213-229.
Eisenhardt, K.M., (1989), Making fast strategic decisions in high-velocity environments, Academy of Management Journal, 32, 3, 543-576.
Finkelstein, L. (2003), Widely, strongly and weakly defined measurement, Measurement, Vol. 34, No. 1, pp. 39-48.
Friedman, S. (2004), Learning to make more effective decisions: changing beliefs as a prelude to action, The Learning Organization, 11, 2, 110-128. Frigo, M.L. and Krumwiede, K.R. (1999), "Balanced Scorecards: A Rising Trend in Strategic Performance Measurement", Journal of Strategic Performance Measurement, Vol. 3, No. 1, pp.42-44 Gates, S. (1999), Aligning Strategic Performance Measures and Results, The Conference Board, New York.
Gladwell, M, (2005). ‘Blink: The Power of Thinking Without Thinking’, Boston: Little, Brown.
Goff, J. (2003), ‘Drowning in Data: A flood of corporate data, intensified by Sarbanes-Oxley compliance, threatens to overwhelm business managers’, CFO Magazine, November.
Goodhart, C.A.E. (1975), Monetary Relationships: A View from Threadneedle Street, in Papers in Monetary Economics Volume I, Reserve Bank of Australia.
Goold M. and Quinn, J. L. (1990), The paradox of strategic controls, Strategic Management Journal Vol. 11, pp. 43-57. Gubman, E.L., (1998), The Talent Solution: Aligning Strategy and People to Achieve Extraordinary Results, McGraw-Hill, New York
Handy, C. (1989), The age of reason, Harvard Business School Press.
Hasselbring, W. (2000), Information system integration, Communications of the ACM, Vol. 43, No. 6, pp. 32-38.
Hemmingway, C. (2006), Developing Information Capabilities: Final report of the From Analytics to Action research project, Cranfield School of Management research report.
Herrmann, K. (2001), Visualizing Your Business – let graphics tell the story, John Wiley & Sons.
Howard, N. (1993), The role of emotions in multi-organizational decision making, Journal of the Operational Research Society, 44, 6, 613-623.
Hsee, C.K., Zhang, J., Yu, F. and Xi, Y., (2003), Lay rationalism and inconsistency between predicted experience and decision, Journal of Behavioural Decision Making, 16, pp 257-272.
Humphrey, N. K. (1976), The social function of intellect, In Growing Points in Ethology, edited by Bateson, P.P.G and Hinde, R.A., pp.303-317, Cambridge University Press
Hussey, D. (1997), The Strategic Decision Challenge, John Wiley & Sons.
Ittner, C.D. and Larker, D.F. (2001), Assessing empirical research in managerial accounting: a value-based management perspective Journal of Accounting and Economics Vol. 32, pp 349-410.
Ittner, C.D. and Larker, D.F. (2003), Coming up short on non-financial performance measurement, Harvard Business Review, Vol. 81, No.11, pp88-95.
Ittner, C.D. and Larker, D.F, (2006), Moving from Strategic Measurement to Strategic Data Analysis, in Chapman, C.S. (Ed.), Controlling Strategy, Oxford University Press.
Janis, I.L. (1972), Victims of Groupthink, Houghton Mifflin Company

The Use of Information in Decision Making
15/02/2008 48
Johnson-Laird, P.N. (2001), Mental models and deduction, Trends in Cognitive Science, 5, 434-442.
Johnson-Laird, P.N., (1983), Mental Models: Towards a Cognitive Science of Language, Inference, and Consciousness, Cambridge University Press.
Johson-Laird, P.N., Girotto, V. and Legrenzi, P. (2004), Reasoning from inconsistency to consistency, Psychological Review, 111, 3, 640-661.
Jopson, B. (2007), Enough Already – why corporate reporting so seldom enlightens, Financial Times, 10/4/07.
Kahneman, D. and Lovallo, D. (1993), Timid choices and bold forecasts: a cognitive perspective on risk taking, Management Science, 39,1, 17-31.
Kahneman, D. and Tversky, A., (Eds.), (2000), Choices, Values and Frames. Cambridge University Press.
Kaplan, R.S. and Norton, D.P. (1992), The balanced scorecard – measures that drive performance, Harvard Business Review, Jan/Feb, pp 71-79.
Kaplan, R.S. and Norton, D.P. (1996), The Balanced Scorecard: Translating strategy into action, Harvard Business School Press, Boston, MA,
Kaplan, R.S. and Norton, D.P. (2000), The Strategy Focused Organization: how balanced scorecard companies thrive in the new business environment, Harvard Business School Press, Boston, MA.
Kaplan, R.S. and Norton, D.P. (2004), Strategy Maps, Harvard Business School Press, Boston, MA.
Kast, F. E. and Rosenzweig, J. E. (1979), Organization and management: a systems and contingency approach, 3rd edition, McGraw-Hill, New York.
Katz and Kahn, (1978), The social psychology of organisations, John Wiley.
Kirsh, G. (1991), Today the earwig, tomorrow man? Artificial Intelligence, 47, 161-184.
Klein, G.A. (1986), Validity of analogical predictions, Technological Forecasting and Social Change, 30, 139-148.
Klein, G., Orasanu, J., Calderwood, R., and Zsambok, C.E. (1993), Decision Making in Action: Models and Methods, Ablex Publishing Co., Norwood, NJ.
Koestler, A., (1967), The ghost in the machine, Hutchinson: London
Langley, A., Mintzberg, H., Pitcher, P., Posada, G. and Saint-Macary, J. (1995), Opening up decision making: the view from the black stool, Organization Science, 6, 3, 260-279.
Lant, T. (1992), Aspiration level adaptation: an empirical exploration, Management Science, 38, 623-644.
Lebas, M. and Euske, K. (2002, A conceptual and operational delineation of performance, In Neely, A. (ed.) 2002, Business Performance Measurement, Cambridge University Press, 65-79.
Lewis, C.I. (1929), Mind and the world order: outline of a theory of knowledge, Dover publications New York.
Malina, M. and Selto, F. (2004), Causality in performance measurement models, Working paper, Naval Post Graduate School.
Marchland, D.A., Kettinger, W.K. and Rollins, J.D. (2001), Information Orientation: The Link to Business Performance, Oxford University Press.
Mari, L. (2007), “Measurability”, in Measurement in Economics, forthcoming.

The Use of Information in Decision Making
15/02/2008 49
Martinez, V. and Kennerley, M. (2005), Impact of performance management reviews: evidence from an energy supplier, Conference Proceedings EUROMA – operations and global competitiveness, Budapest, June 19-22.
Mason, R.O. and Mitroff, I.I. (1974), A program for research on management information systems, Management Science, Vol. 19, No. 5, pp 475-487.
Mitroff, I.I., Mason, R.O. and Barabba, V.P. (1982), Policy as argument – a logic for ill-structured decision problems, Management Science, Vol. 28, No. 12, pp 1391-1404.
Moon, P. and Fitzgerald, L. (1996), Delivering the goods at TNT: the role of the performance measurement system, Management Accounting Research, Vol. 7, pp431-457
Moore, J.L. and Rocklin, T.R. (1998), The distribution of distributed cognition: multiple interpretations and uses, Educational Psychology Review, 10, 1, 97-113.
Moorhead, G., Ference, R. and Neck, C.P., (1991), Group decision fiascoes continue: space shuttle Challenger and a revised groupthink framework, Human Relations, 44, 6, 539-550.
Mulligan, E.J. and Hastie, R., (2005), Explanations determine the impact of information on financial investment judgments, Journal of Behavioral Decision Making, Volume 18, Issue 4, 145-156.
Nagar, V., and Rajan. M. V. (2005), Measuring customer relationships: The case of the retail banking industry, Management Science Vol. 51 No. 6, pp 904-919.
Neave, H., (1993), How SPC? British Deming Association.
Neck, C.P. and Manz, C.C., (1994), from groupthink to teamthink: toward the creation of constructive thought patterns in self-managing work teams, Human Relations, 47, 8, 929-952.
Neely, A., Adams, C. and Kennerley, M. (2002), The Performance Prism: the Scorecard for Measuring and Managing Business Success, Pearson Education Ltd., London, UK.
Neely, A. and Al Najjar, M. (2006), “Management Learning not Management Control: The True Role of Performance Measurement?”, California Management Review, Vol. 48, No. 3, pp 101-114.
Neely, A.D., Richards, A.H., Mills, J.F., Platts, K.W. and Bourne, M.C.S. (1997) Designing Performance Measures: A Structured Approach, International Journal of Operations and Production Management, Vol. 17, No. 11, pp 1131-1153.
Neely, A and Jarrar, Y, (2004), Extracting value from data – the performance planning value chain, Business Process Management Journal, Vol. 10 No. 5, pp. 506-509
Neely, A., Micheli, P. and Martinez, V.(2006), Acting on Information: Performance Management for the Public Sector, AIM Executive Briefing prepared for the National Audit Office.
Nosek, J.T. (2004), Group cognition as a basis for supporting group knowledge creation and sharing, Journal of Knowledge Management, 8, 4, 54-64.
O’Connor, M., Remus, W. and Kim, K., (2005), Improving judgmental forecasts with judgmental bootstrapping and task feedback support, Journal of Behavioral Decision Making, 18, 4, 247-260.
Oatley, K.J. and Johson-Laird, P.N. (2002), Emotion and reasoning to consistency. In Moore, S., Oaksford, M. (Eds.) Emotional cognition: from brain to behaviour. Oxford University Press, pp. 157-182.
Oliver, D. and Roos, J., (2005), Decision-making in high-velocity environments: the importance of guiding principles, Organization Studies, 26, 6, 889-913.
Otley, D. T. and Berry, A. J. (1980), Control, organisation and accounting, Accounting, Organizations and Society, 5, 2, 231-244.

The Use of Information in Decision Making
15/02/2008 50
Otley, D. (1999), Performance management: a framework for management control systems research, Management Accounting Research, Vol. 10, pp 363-382.
Peters, T.J. (1987), Thriving on chaos: handbook for a management revolution, AA Knopf.
Pfeffer, J. and Sutton, R.I., (2006a), Evidence-Based Management, Harvard Business Review, Vol. 84, No. 1, pp 62-74.
Pfeffer, J. and Sutton, R.I. (2006b), Hard Facts, Dangerous Half-Truths and Total Nonsense: Profiting From Evidence-Based Management, Harvard Business School Press, Boston, MA
Pham, M.T., Cohen, J.B., Pracejus, J.W. and Hughes, G.D. (2001), Affect monitoring and the primacy of feelings in judgement, Journal of Consumer Research, 28, 167-188.
Power, M. (1997), The audit society - Rituals of verification, Oxford University Press.
Rayburn, J. M. and Rayburn, L. G. (1991), Contingency theory and the impact of new accounting technology in uncertain hospital environments, Accounting Auditing and Accountability Journal, vol. 4 no. 255-75.
Rouwette, E.A.J.A.,Vennix, J.A.M., van Mullekom, T., (2002), Group model building effectiveness: a review of assessment studies, System Dynamics Review, 18, 1, 5-45.
Royal Statistical Society (2003), Performance indicators: Good, bad and ugly. This document can be accessed from the Royal Statistical Society site at: http://www.rss.org.uk .
Rucci, A. J., Kirn, S. P. and Quinn. R. T. (1998), The employee-customer-profit chain at Sears, Harvard Business Review, Vol. 76, No. 1. pp 82-97. Schiemann, W.A. and Lingle, J.H. (1999), Bullseye! Hitting Your Strategic Targets Through High-impact Measurement, The Free Press, New York.
Schwarz, D.L. (1995), The emergence of abstract representation in dyad problem solving, The Journal of the Learning Sciences, 4, 3, 321-354.
Schwarz, N., (2000), Social judgement and attitudes: warmer, more social, and less conscious, European Journal of Social Psychology, 30, 149-176.
Senge, P.C., Roberts, C., Ross, R.B., Smith, B.J., Kleiner, A., (1995), The Fifth Discipline Fieldbook: Strategies and Tools for Building a Learning Organization, Nicholas Brealey, London.
Senge, P.M., (1990), The fifth discipline, Randomhouse Publishing.
Shewhart, W.A., (1931/1980) Economic Control of Quality of Manufactured Product ASQC: Milwaukee.
Shewhart, W.A., (1939), Statistical Method from The Viewpoint of Quality Control
Shannon & Weaver. (1959), The Mathematical Theory of Communication, Univ.of Illinois Press.
Deming, W.E., Dover Publications: New York.
Simon, H.A., (1977), The new science of management decision, revised edition, Prentice Hall.
Simon, H.A., (1983), Reason in Human Affairs, Basil Blackwell, Oxford.
Simons, R. (1991), Strategic orientation and top management attention to control systems, Strategic Management Journal, 12, 29-62.
Simons, R. (1994), How new top managers use control systems as levers of strategic renewal, Strategic Management Journal, 15, 169-189.
Sloan, M.D., and Boyles, R.A. (2003), Profit Signals: How Evidence-Based Decisions Power Six Sigma Breakthroughs, Evidence-Based Decisions, Inc.

The Use of Information in Decision Making
15/02/2008 51
Slovic, P., Finucane, M.L., Peters, E., and MacGregor, D.G., (2004), Risk as analysis and risk as feelings: some thoughts about affect reason, risk and rationality, Risk Analysis, 24, 2, 311-322.
Spence, R (2001), Information Visualisation, Addison Wesley.
Spender, J.-C., (2003), Exploring uncertainty and emotion in the knowledge-based theory of the firm, Information Technology and People, 16, 3, 266-288.
Stahl, G. (2006), Group cognition: computer support for building collaborative knowledge, MIT Press.
Sterman, J.D., (2002), All models are wrong: reflections on becoming a systems scientist, Systems Dynamics Review, 12, 4, 501-531.
Strőh, U. and Jaatinen, M. (2001), New approaches to communication management for transformation and change in organizations, Journal of Communication Management, 6 2, 148-165.
Swieringa, R.J. and Weick, K.E. (1987), Management accounting and action, Accounting, Organizations and Society, 12, 3, 293-308.
Taylor, S.E. (1998), The social being in social psychology. In Guilbert, D.T., Liske, S.T., and Lindzey, G. (Eds) Handbook of social psychology, fourth edition, volume 1, pp. 58-95, New York: Random House.
Thompson, L. and Fine, G.A. (1999), Socially shared cognition, affect and behaviour: a review and integration, Personality and Social Psychology Review, 3, 4, 278-302.
Tufte, Edward R. (1990). Envisioning Information. Cheshire, CT: Graphics Press.
Tufte, Edward R. (1997). Visual Explanations: Images and Quantities, Evidence and Narrative. Cheshire, CT: Graphics Press.
Tufte, Edward R. (2006). Beautiful Evidence. Cheshire, CT: Graphics Press.
Turner, S. (2002), Tools for Success: A Managers Guide, McGraw Hill.
Tversky, A. and Kahneman, D., (1973), Availability: a heuristic for judging frequency and probability, Cognitive Psychology, 5, 207-232.
Tversky, A. and Kahneman, D., (1974), Judgment under uncertainty: Heuristics and biases, Science, 185, 1124-131.
Tversky, A. and Kahneman, D., (1992), Advances in prospect theory: Cumulative representation of uncertainty, Journal of Risk and Uncertainty, 5, 4, 297 – 323.
Van Ackere, A., Larsen, E. R. and Morecroft, J.D.W. (1993), Systems thinking and business process redesign: an application to the beer game, European Management Journal, 11, 4, 412-423.
Wagner, J.A. and Gooding, R.Z. (1997), Equivocal information and attribution: and investigation of patterns of managerial sensemaking, Strategic Management Journal, Vo. 18, No. 4, pp 275-286.
Wheeler, D., (1993), Understanding variation: the key to managing chaos, SPC Press.
Whitecotton S.M., Sanders D.E., Norris K.B., (1998), Improving predictive accuracy with a combination of human intuition and mechanical decision aids, Organizational Behaviour and Human Decision Processes, 76, 3, 325-348.
Wilcox, M, and Bourne, M (2002), Performance and Prediction, Performance Measurement Association Conference. Boston 17th -19th July, 2002.
Wilcox, M., (2004), Prediction and Pragmatism in Shewhart's Theory of Statistical Control Management Decision, Volume 42. No1 152-164.

The Use of Information in Decision Making
15/02/2008 52
Wilcox, M. and Bourne, M. (2003), Predicting performance, Management Decision, Vol. 41, No. 8, pp 806-816.
Willocks, S. G. (1998), Managerial effectiveness in an NHS Hospital Trust, International Journal of Public Sector Management, 11 2/3 130-138.
Winograd, T. and Flores, T. (1987), Understanding Computers and Cognition, New York: Addision-Wesley.
Woodside, A. G. (2006), Advancing systems thinking and building microworlds in business and industrial marketing, The Journal of Business and Industrial Marketing, Vol. 21, No. 1, pp 24-29.
World research Inc. (1999) Business Intelligence and Data Warehousing (BI/DW) Programme Competitive Analysis. California, USA.
i Cognitive Biases
It is generally agreed that biases creep into our decision making processes, calling into question the correctness of a decision. So, while it is agreed that decision making can be biased, how to tell when it is, and specific cases of biases, are often challenged. The issue in general can be quite controversial among scholars in the field. Below is a list of some of the more commonly debated cognitive biases. • Selective search for evidence (a.k.a Confirmation Bias in psychology) - We tend to be
willing to gather facts that support certain conclusions but disregard other facts that support different conclusions.
• Premature termination of search for evidence - We tend to accept the first alternative that looks like it might work.
• Inertia - Unwillingness to change thought patterns that we have used in the past in the face of new circumstances.
• Contrariness or rebelliousness - Unwillingness to share a view with a perceived oppressive authority.
• Experiential limitations - Unwillingness or inability to look beyond the scope of our past experiences; rejection of the unfamiliar.
• Selective perception - We actively screen-out information that we do not think is salient. • Wishful thinking or optimism - We tend to want to see things in a positive light and this
can distort our perception and thinking. • Choice-supportive bias occurs when we distort our memories of chosen and rejected
options to make the chosen options seem relatively more attractive. • Recency - We tend to place more attention on more recent information and either ignore
or forget more distant information. The opposite effect in the first set of data or other information is termed Primacy effect
• Repetition bias - A willingness to believe what we have been told most often and by the greatest number of different of sources.
• Anchoring and adjustment - Decisions are unduly influenced by initial information that shapes our view of subsequent information.
• Group think - Peer pressure to conform to the opinions held by the group. • Source credibility bias - We reject something if we have a bias against the person,
organization, or group to which the person belongs: We are inclined to accept a statement by someone we like.
• Incremental decision making and escalating commitment - We look at a decision as a small step in a process and this tends to perpetuate a series of similar decisions. This can be contrasted with zero-based decision making.
• Inconsistency - The unwillingness to apply the same decision criteria in similar situations.

The Use of Information in Decision Making
15/02/2008 53
• Attribution asymmetry - We tend to attribute our success to our abilities and talents, but we attribute our failures to bad luck and external factors. We attribute other's success to good luck, and their failures to their mistakes.
• Role fulfillment (Self Fulfilling Prophecy) - We conform to the decision making expectations that others have of someone in our position.
• Underestimating uncertainty and the illusion of control - We tend to underestimate future uncertainty because we tend to believe we have more control over events than we really do. We believe we have control to minimize potential problems in our decisions.
• Faulty generalizations - In order to simplify an extremely complex world, we tend to group things and people. These simplifying generalizations can bias decision making processes.
• Ascription of causality - We tend to ascribe causation even when the evidence only suggests correlation. Just because birds fly to the equatorial regions when the trees lose their leaves, does not mean that the birds migrate because the trees lose their leaves.