the use of digital photographs for the diagnosis of hand ... · consensus photographic scores for...
TRANSCRIPT

1
University of Iceland
Faculty of Medicine
The use of digital photographs for the diagnosis of hand
osteoarthritis
Guðrún Pálína Helgadóttir
Thesis submitted for the degree of Master of Science
Supervisor: Vilmundur Guðnason
Master´s committee:
Gerður Gröndal Sigurður Sigurðsson
Reykjavík, Iceland Spring 2010

2
Háskóli Íslands
Læknadeild
Notkun stafrænna ljósmynda við mat á slitgigt í höndum
Guðrún Pálína Helgadóttir
Ritgerð lögð fram til meistaragráðu
Leiðbeinandi: Vilmundur Guðnason
Mastersnefnd:
Gerður Gröndal Sigurður Sigurðsson
Reykjavík, Iceland Vor 2010

1
ABSTRACT
Objective. The aim of this study was to develop a standardised
grading system for the diagnosis of hand osteoarthritis from high
quality hand photographs and to examine the relationship between
hand osteoarthritis pain in the elderly and different assessment
methods with particular reference to hand photography.
Materials and methods. This was an ancillary study of randomly
selected subjects from the AGES-Reykjavik study. 160 males and 221
females aged 69-92 participated.
All participants had high quality photographs taken of both hands. A
photographic scale was then developed to measure the visible signs of
the presence of hand OA, such as hard tissue enlargement, deformity
and visible soft tissue swelling. Additionally, a clinical examination
for structural osteoarthritis changes (not pain) and standard
radiographs were taken of the hands of all participants. Pain was
documented by a questionnaire.
Results: According to the photographic method, 60,4% of males had
at least one affected hand joint, 85,5% had radiographic OA and
74,2% clinically diagnosed OA in at least one of the 18 hand joints. In
females, the percentages were 66,2%, 93,7% and 82,4%, respectively.
Females were more likely to report pain than males. The prevalence
of ever having hand pain lasting at least one month (the ACR criterion
for diagnosis of hand OA) was 20,0% (10,7% in males and 27,0% in
females).

2
Sixteen males (10,1%) and 92 females (41,4%) reported intermittent
pain. and when pain was present, the number of painful joints was
greater in females than in males. Intermittent pain in individual joints
and joint rows was significantly associated with the severity of OA
assessed by all three methods.
Conclusions. Hand osteoarthritis is common in the elderly.
Agreement between the three methods is better in females than in
males in this age group. Radiography is more sensitive than either the
photographic method or clinical examination. In the majority of cases,
the three methods are identifying the same individuals as having
severe hand OA.
Hand joint pain is relatively rare in elderly males compared to
females in this age group and shows a consistent relation to the
severity of hand OA in individual joints and joint groups.

3
ÁGRIP
Markmið. Markmið þessarar rannsóknar var að þróa aðferð við að
greina handarslitgigt af hágæða ljósmyndum og bera hana saman við
klíníska skoðun og röntgengreiningu við mat á handarslitgigt í eldra
fólki. Jafnframt var ætlunin að skoða tengsl sársauka í höndum við
þessar þrjár greiningaraðferðir.
Efni og aðferðir. Þátttakendur voru 381, 160 karlar og 221 konur á
aldrinum 69-92, sem valdir voru af handahófi úr AGES-Reykjavík
rannsókninni. Teknar voru hágæða ljósmyndir af höndum allra
þátttakenda og aðferð þróuð til að meta sjáanleg merki
handarslitgigtar af ljósmyndunum. Einnig voru teknar röntgenmyndir
af höndum allra þátttakenda og klínísk skoðun framkvæmd. Lagt var
mat á upplifun sársauka með spurningalista.
Niðurstöður. Samkvæmt ljósmyndaaðferðinni höfðu 60,4% karla og
66,2% kvenna slitgigt í a.m.k. einum handarlið. 85,5% karla og
93,7% kvenna greindust með handarslitgigt skv. röntgen og klínísk
skoðun greindi 74,2% karla og 82,4% kvenna með handarslitgigt.
Konur reyndust líklegri til að kvarta yfir verkjum og sársauka í
handarliðum, en 20% þátttakenda (10,7% karla og 27,0% kvenna)
sögðust einhvern tímann hafa fundið fyrir verkjum í að minnsta kosti
mánuð og 10,1% karla og 41,4% kvenna fundu stundum fyrir
sársauka í höndum. Verkir frá einstaka liðum reyndist tengjast
alvarleika slitgigtar samkvæmt öllum þremur greiningaraðferðunum.
Ályktanir. Handarslitgigt er algeng hjá öldruðum og í þessum
aldurshóp er samræmi milli aðferðanna betra hjá konum heldur en

4
körlum. Röntgen er næmari aðferð við greiningu handarslitgigtar
heldur en ljósmyndaaðferðin og klínísk skoðun en í meirihluta tilfella
eru þessar aðferðir sammála um greiningu einstaklingana með
alvarlega slitgigt.
Í þessum aldurshóp kvarta færri karlar en konur yfir sársauka frá
handarliðum en samband er milli verkja frá einstökum liðum og
alvarleika slitgigtar þegar allar þrjár greiningaraðferðirnar eru
notaðar.
5
ACKNOWLEDGEMENTS
This thesis could not have been carried out without the help from a
number of persons, to whom I owe a great debt of gratitude and
would like to thank for their valuable contribution.
This study was carried out at the Icelandic Heart Association
(Hjartavernd). I am deeply grateful to Vilmundur Guðnason, my
supervisor, for giving me the opportunity to use unique data from the
AGES-Reykjavik Study. He has given me excellent guidance and
supported me in the long journey to produce this thesis.
I thank my father, Helgi Jónsson. His professional insight, endless
enthusiasm and encouragement have made this study possible.
I am grateful to the members of my Master´s committee, Gerður
Gröndal and Sigurður Sigurðsson, for the time spent reviewing the
manuscript and for their valuable criticism and suggestions which
have greatly improved this work.
I owe special thanks to the radiologists Ásbjörn Jónsson and
Guðmundur J. Elíasson, who did enormous amounts of work reading
and re-reading the hand radiographs for this study. I would also like
to thank Lauren Abbott for coming to Iceland and assisting with the
clinical examinations.
I am grateful to all the participants of the Icelandic Heart Association
Age, Gene/Environment Susceptibility-Reykjavik Study (AGES-
Reykjavik) as well as to all my coworkers at Hjartavernd. I would
especially like to thank Thor Aspelund who has helped with the
statistical data analysis.
6
I would also like to express my gratitude for the many grants we
received for this project. Funding for this study was provided by the
National Institutes of Health contract N01-AG-1-2100, National
Institute on Aging Intramural Research Program, Hjartavernd (the
Icelandic Heart Association), the Alþingi (the Icelandic Parliamant),
the Icelandic Osteoarthritis Fund and the University of Iceland
Research Fund
Finally, I wish to thank my husband Kristinn Theódórsson, and my
children, Theódór Helgi and Katla Kristín,.for all their love, patience
and support.
7
TABLE OF CONTENTS Abstract ........................................................................................ 1
Ágrip ............................................................................................ 3
Acknowledgements ....................................................................... 5
List of tables ................................................................................. 9
List of figures ............................................................................. 10
Abbreviations ............................................................................. 12
1.Introduction ............................................................................. 13
1.2 Pathogenesis of osteoarthritis .................................................. 14
1.3 Prevalence ................................................................................ 16
1.4 Risk factors .............................................................................. 17
1.5 Defining hand OA and standard approaches to the diagnosis . 18
1.5.1. Radiology ..................................................................... 20
1.5.2. Photography as a method of diagnosing hand OA....... 21
1.6 Pain .......................................................................................... 22
1.7 Aims of the study ..................................................................... 23
2.Materials and methods ............................................................. 24
2.1 Subjects .................................................................................... 24
2.2 Finger joint pain assessments................................................... 24
2.3 Radiographic procedure ........................................................... 25
2.4 Clinical examination ................................................................ 25
2.5 Photographic reading procedure .............................................. 26
2.6 Statistics ................................................................................... 33
3.Results ..................................................................................... 35
3.1 Photographic scoring ............................................................... 36
3.2 Comparison of photographic scoring with clinical examination and radiographic scoring ................................................................ 43
3.3. Pain prevalence ....................................................................... 52

8
3.4 Comparison of the three methods in relation to pain ............... 53
3.4.1. ACR pain criterion in relation to the three methods ........ 53
3.4.2. Intermittent pain and joint pain distribution in relation to the three scoring methods .......................................................... 56
4.Discussion ............................................................................... 64
4.1 Photographic reading system ................................................... 64
4.2 Prevalence of hand osteoarthritis ............................................. 65
4.2.1. Prevalence in different age groups ................................... 67
4.2.2. Hand OA prevalence and body mass index (BMI) .......... 68
4.3 Pain prevalence and relation to the three scoring methods ...... 69
4.3.1 Pain according to the ACR criteria ................................... 69
4.3.2 Intermittent hand pain ....................................................... 70
4.4 Advantages and limitations of this study ................................. 72
5.References ............................................................................... 74
6.Appendix 1 .............................................................................. 81

9
LIST OF TABLES
Table 1. Baseline characteristics of the study participants……..35
Table 2. Characteristics of all the participants in the AGES-
Reykjavik Study……………………………………………….....35
Table 3. Kappa and Average Measure Intraclass Correlation
Coefficient (ICC) between readings of the two observers………37
Table 4. Average Measure Intraclass Correlation Coefficient (ICC)
between two readings of the same observer………………………..38
Table 5. Consensus photographic scores for the DIP and PIP
joints for all subjects……………………………………………...39
Table 6. Consensus photographic scores for the DIP and PIP
joints for males………………………………………………..…..40
Table 7. Consensus photographic scores for the DIP and PIP
joints for females……………………………………………..…..41
Table 8. Consensus photographic scores for the CMC1
joints……………………………………………………………....42
Table 9. Point prevalence of OA in the hand joints of males and
females…………………………………………………..………..43
Table 10. Hand joint pain by joints and gender………………..53
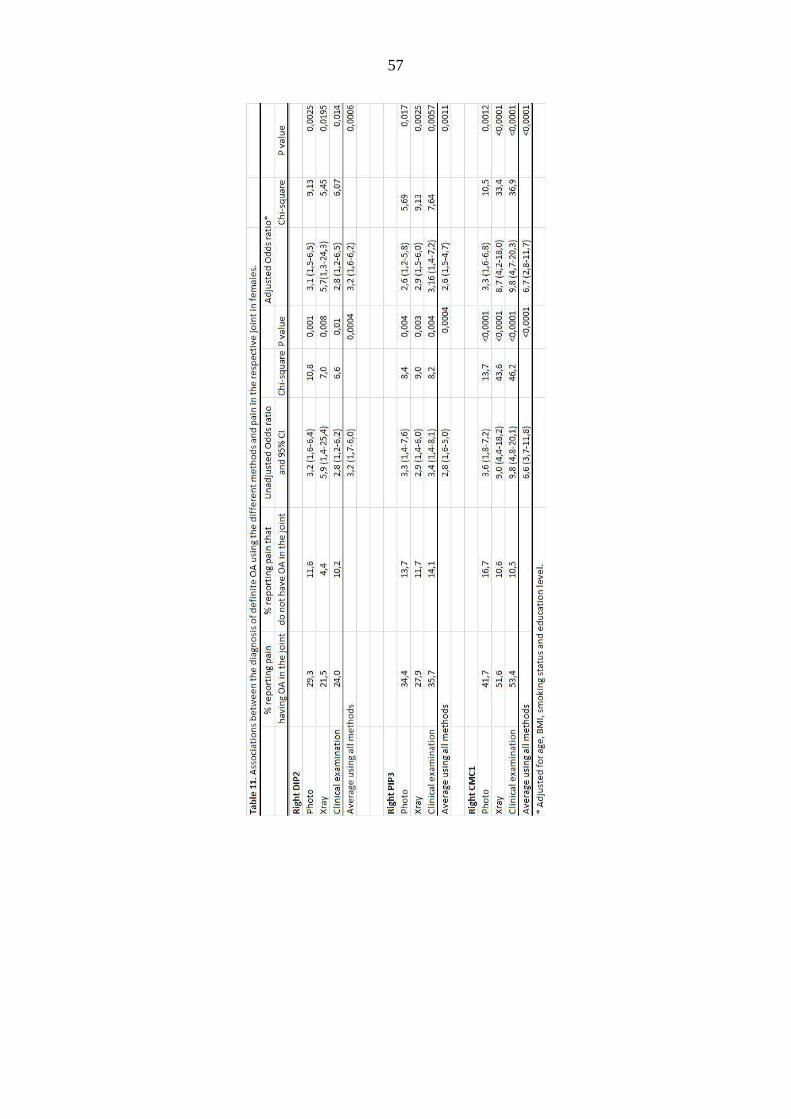
Table 11. Associations between the diagnosis of definite OA using
the different methods and pain in the respective joint in females….57
Table 12. Associations between the diagnosis of definite OA using
the different methods and pain in the respective joint in males……59

10
LIST OF FIGURES
Figure 1. The Heberden node is characterized by osteophyte
formation on the dorsal and lateral aspects of the DIP joint. Bouchard
nodes occur adjacent to the PIP joints. .............................................. 15
Figure 2. Pathogenic features consistent with osteoarthritis ............. 16
Figure 3. Reference photographs showing osteoarthritis of the right
second DIP.. ....................................................................................... 28
Figure 4. Reference photographs showing osteoarthritis of the right
third PIP. ............................................................................................ 29
Figure 5. Reference photographs showing osteoarthritis of the CMC1
joint. ................................................................................................... 31
Figure 6. Percent prevalence of OA in the DIP joints of males
according to the different methods. ................................................... 45
Figure 7. Percent prevalence of OA in the DIP joints of females
according to the different methods. ................................................... 46
Figure 8. Percent prevalence of OA in the PIP joints of males
according to the different methods. ................................................... 46
Figure 9. Percent prevalence of OA in the PIP joints of females
according to the different methods. ................................................... 47
Figure 10. Percent prevalence of OA in the CMC1 joints of males
and females according to the different methods. ............................... 47
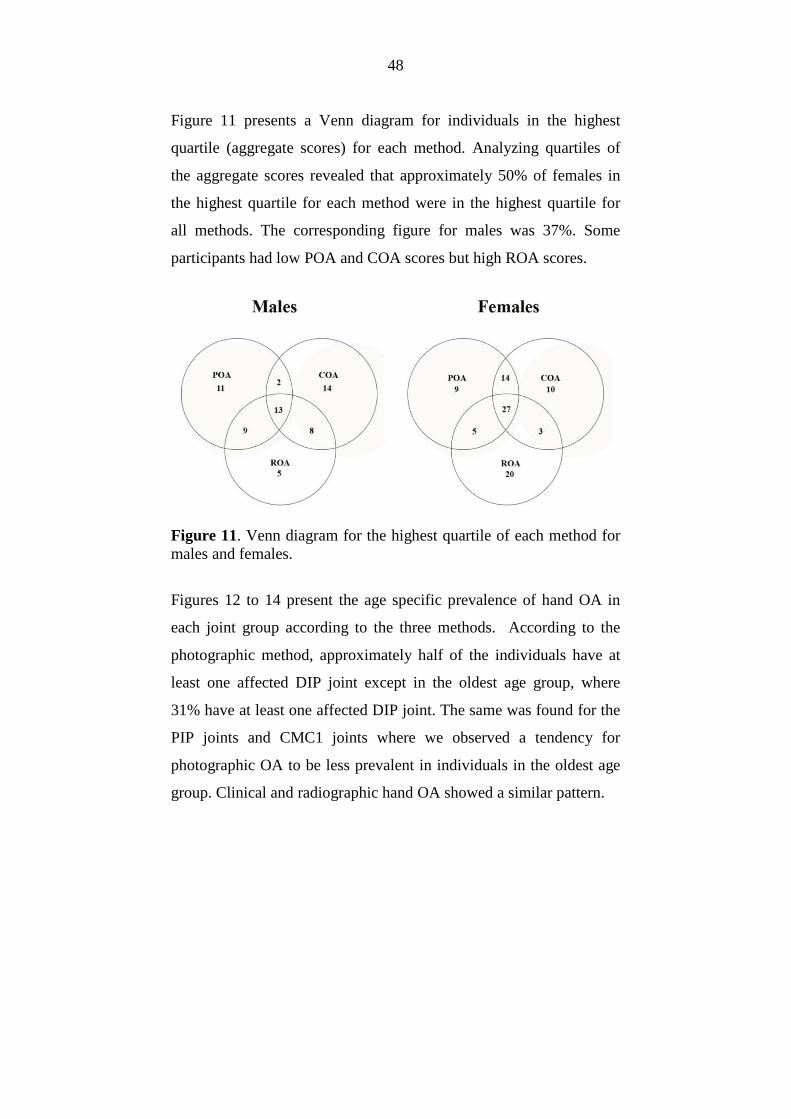
Figure 11. Venn diagram for the highest quartile of each method for
males and females. ............................................................................. 48
Figure 12. Age specific prevalence (%) of photographic hand OA in
each joint group according to age group. ........................................... 49

11
Figure 13. Age specific prevalence (%) of radiographic hand OA in
each joint group according to age group. ........................................... 49
Figure 14. Age specific prevalence (%) of clinically diagnosed hand
OA in each joint group according to age group. ................................ 50
Figure 15. Percent prevalence of OA in at least one DIP joint
according to BMI status for all three methods. .................................. 51
Figure 16. Percent prevalence of OA in at least one PIP joint
according to BMI status for all three methods. .................................. 51
Figure 17. Percent prevalence of OA in at least one of the two CMC1
joints according to BMI status for all three methods. ........................ 52
Figure 18. ROC curve analysis of the accuracy of the three methods
(aggregate scores in the 18 joints by each method) in detecting pain of
at least one months duration in males. ............................................... 54
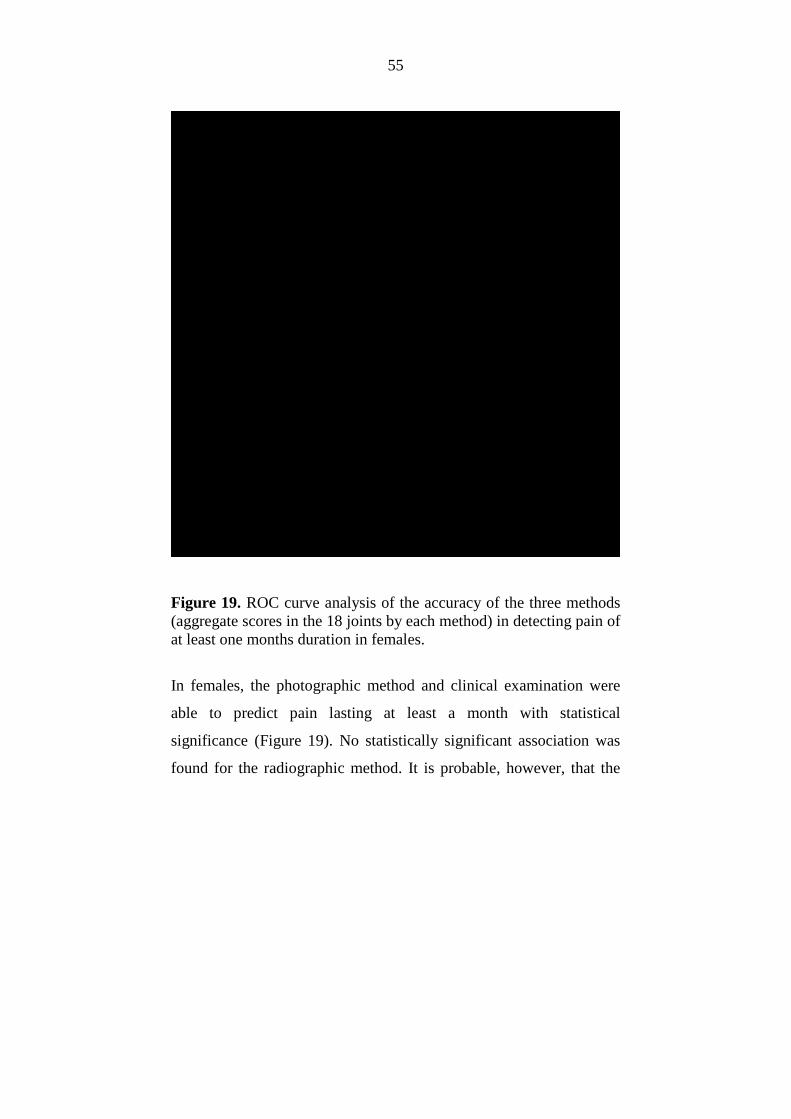
Figure 19. ROC curve analysis of the accuracy of the three methods
(aggregate scores in the 18 joints by each method) in detecting pain of
at least one months duration in females. ............................................ 55
Figure 20. ROC curves for accuracy of the three methods in
predicting pain in three commonly affected joints in females. ......... 60
Figure 21. ROC curves showing how pain from joint rows correlates
with pain from the respective joint row in females............................ 62
Figure 22. Hand diagram. Participants were asked to mark the
location of hand joint pain on a diagram. .......................................... 81
Figure 23. Informed consent form. All participants in the AGES-
Reykjavik Study during the spring of 2005 were invited to have a
radiograph of their hands taken for this study. .................................. 82
12
ABBREVIATIONS
ACR American College of Rheumatology
BMI Body Mass Index
CMC1 first carpometacarpal (thumb base) joint
COA clinical osteoarthritis
DIP distal interphalangeal joint
HOA hand osteoarthritis
ICC Intraclass correlation coefficient
K-L Kellgren-Lawrence scoring system
OA osteoarthritis
POA photographic osteoarthritis
PIP proximal interphalangeal joint
ROA radiographic osteoarthritis
GPH Guðrún P. Helgadóttir

13
1. INTRODUCTION
Osteoarthritis is the most common form of arthritis among the elderly
and one of the leading causes of chronic disability in Western
countries (Felson, 1988; March and Bachmeier, 1997). The magnitude
of this problem is increasing with the aging of the population in many
countries. Osteoarthritis can arise in any synovial joint in the body,
but most often in the hand, knee, and hip joints. A single joint can be
involved, but more commonly multiple joints are affected.
1.1 Definition
The term osteoarthritis (OA) describes a common, age-related,
heterogeneous group of disorders that are defined:
“OA diseases are a result of both mechanical and biological events
that destabilize the normal coupling of degradation and synthesis of
articular cartilage chondrocytes and extracellular matrix, and
subchondral bone. Although they may be initiated by multiple factors,
including genetic, developmental, metabolic, and traumatic, OA
diseases involve all of the tissues of the diarthrodal joint. Ultimately,
OA diseases are manifested by morphologic, biochemical, molecular,
and biomechanical changes of both cells and matrix which lead to a
softening, fibrillation, ulceration, loss of articular cartilage, sclerosis
and eburnation of subchondral bone, osteophytes, and subchondral
cysts. When clinically evident, OA diseases are characterized by joint

14
pain, tenderness, limitation of movement, crepitus, occasional
effusion, and variable degrees of inflammation without systemic
effects.” (Kuettner, 1995)
1.2 Pathogenesis of osteoarthritis
The view of osteoarthritis and its pathogenesis continues to change.
Previously, OA was considered a degenerative disease, and simply an
inevitable part of ageing. Now, however, OA is increasingly viewed
as a dynamic process, one that is metabolically active, with the
process of the disease involving both destruction and repair that may
be triggered by a variety of biochemical as well as mechanical insults.
Hand OA commonly affects the distal interphalangeal (DIP) joints,
proximal interphalangeal (PIP) joints and the carpometacarpal joint of
the thumb (CMC1). The Heberden node is characterized by
osteophyte formation on the dorsal and lateral aspects of the DIP
joint. Bouchard nodes occur adjacent to the PIP joints and are
pathoanatomically similar to Heberden´s nodes, but occur less
frequently.

15
Figure 1. The Heberden node is characterized by osteophyte formation on the dorsal and lateral aspects of the DIP joint. Bouchard nodes occur adjacent to the PIP joints.
The characterics of the osteoarthritic joint is shown in Figure 2. A
number of pathogenic features consistent with osteoarthritis are
shown. Osteoarthritis involves the entire joint organ, including the
subchondral bone, menisci, ligaments, periarticular muscle, capsule,
and synovium.

16
Figure 2. Pathogenic features consistent with osteoarthritis (Hunter and Felson, 2006).
1.3 Prevalence
The prevalence data available on hand OA depends on the diagnostic
criteria used and the age of the study population. Although point
prevalence of radiographic OA (ROA) is reported to be as high as
28.9% to 76% in population-based studies, the prevalence of
symptomatic hand OA is much lower with a point prevalence of 4%
to 6.2%. (Niu et. al., 2003; Van Saase et. al., 1989).
17
The prevalence of radiographically diagnosed hand OA increases
steadily with age. Radiological studies have shown that in the age
group older than 70, up to 90% of women and 80% of men are
affected. It is likely that these figures overestimate the real clinical
burden of hand OA, as studies suggest that the prevalence of
symptomatic hand OA in subjects older than 65 years is only 15%
(Mannoni et. al., 2000).
1.4 Risk factors
Risk factors for development of osteoarthritis include age, female sex,
a positive family history, previous trauma, occupation (Kalichman
and Hernández-Molina, 2009), and joint hypermobility (Jonsson et.
al., 2009a). Some investigators have reported a negative association
with osteoporosis (Haugen et. al., 2007). A strong association has
been described between high BMI and the presence of knee OA
(Manek et. al., 2003; Nisha et. al., 2003) and body weight has also
been shown to be a predictor of incident osteoarthritis of the hand
(Kalichman et. al., 2009; Oliveria et. al., 1999).
Conflicting results have been reported on the relationship that
smoking shares with OA, with some researchers finding a protective
effect of smoking (Haara et. al., 2003; Jones et. al., 2001) while
others have found no clinically significant protection (Wilder et. al.,
2003).

18
1.5 Defining hand OA and standard approaches to the diagnosis
Defining hand OA is important to advance the investigation of the
disease and to document its presence as a marker of a systemic
predisposition towards OA.
The phenotype of hand osteoarthritis is usually defined by pathologic
examination of affected joints, by evaluation of clinical signs and
symptoms, or by examination of radiographic characteristics of the
joints, as pathological changes associated with osteoarthritis are
usually visible on plain radiographs.
Unfortunately, defining hand OA is still problematic because of lack
of an absolute clinical, radiological, or pathological standard that the
epidemiology of hand OA can be compared to. Thus, epidemiological
studies using symptoms questionnaires, clinical criteria, radiographs
or bone scintigraphy have tended to display heterogeneous results.
Currently, both clinical and radiographic criteria have their advocates
for use in epidemiological studies. The radiographic criteria are
considered more robust, but disadvantages include cost, radiation and
availability of equipment and trained readers. Furthermore the
radiographic changes develop over a considerable length of time,
possibly underdiagnosing the youngest and often most symptomatic
group of hand OA patients which constitute a future target group in
the event of preventive treatment. Clinical criteria have worked well
in certain settings, but among the main disadvantages are the
availability of expert examiners and that standardization has proved
difficult (Mejjad and Maheu, 1995).
19
In addition, despite advances in our understanding of the disease, a
discrepancy remains between structural markers of pathology and the
clinical syndrome of osteoarthritis typified by joint pain and
disability. Zhang and colleagues reported that symptomatic hand
osteoarthritis limits several daily functional activities in the
Framingham study (Zhang et. al., 2002). A modest association has
been reported between the presence of ROA and the presence of pain
and disability in a population with diagnosis of hand osteoarthritis
(Fautrel et. al., 2005; Jones et. al. , 2001).
Clinical diagnosis is usually based on the presence of joint symptoms
and evidence of structural changes seen on radiographs. The
American College of Rheumatology (ACR) has established a
diagnostic criteria for OA of the hand. The ACR criteria call for
• hand pain, aching or stiffness lasting at least a month,
• nodal enlargement in at least two of ten joints (bilateral first
CMC and the second and third DIPs and PIPs),
• swelling of fewer than three MCP joints, and
• nodal enlargement of at least two DIP joint or deformity of
two or more of the 10 selected joints (Altman et. al., 1990)
The limitations of the ACR criteria for epidemiological studies have
been mentioned (Hart et. al., 1994), they seem good for identifying
cases of persistent symptomatic disease but previous epidemiologic
and genetic studies have largely targeted radiographic OA. While
symptomatic hand OA should be a focus of studies because it causes
disability, few studies have been conducted to study symptomatic
20
hand OA, especially in the elderly. Little data is available on pattern
of joint involvement and risk factors for symptomatic hand OA as
most persons with radiographic OA do not have persistent symptoms.
A study of an elderly population in Iceland based on the ACR
classification criteria (Aspelund et. al., 1996) found that the
prevalence of symptomatic hand OA was 3% in men and 7% in
women. The symptoms criterion, however, showed considerable
variation with time and thus the symptomatic OA group was not
stable.
1.5.1. Radiology
Radiological changes are most commonly used to grade hand OA. At
present, several different radiographic classification systems are used
but the Kellgren-Lawrence (K-L) scale for grading of radiological
changes has been most widely used in the past (Kellgren and
Lawrence, 1957) but there is no agreement on the best threshold for
the definition of generalized HOA(Hart and Spector, 1995). In a
review by Marshall and colleagues in 2008 it was reported that in
1996-2005 thirty epidemiological studies, all using the K-L scale,
used 13 different cut-off points for diagnosis of systemic HOA
(Marshall et. al., 2008). Comparison and harmonization of these
systems is desirable to facilitate comparison between prevalence
studies.
Also, radiographic findings do not necessarily correlate well with
symptoms, as studies have shown limited correlation between

21
radiological changes and the presence of symptoms such as pain and
impaired function of the joint (Sowers, 2001). Not all people with
radiological evidence of osteoarthritis have symptoms, and not all
people with symptoms have radiological evidence of osteoarthritis
(Lachance et. al., 2001).
Therefore, the appropriateness of radiology in clinical and large
population-based studies has been questioned (Kallman et. al., 1989;
Lane et. al., 1993).
1.5.2. Photography as a method of diagnosing hand OA
For a relatively common disease like hand OA, large population-
based studies can be very expensive and labor-intensive. It would be
useful to be able to utilize an inexpensive screening system to select
those individuals appropriate for further study from the general
population.
In recent years, the use of photography to diagnose hand OA has been
considered by many investigators (Stern et. al., 2004). In one
instance, the presence of 'bony prominence or deformity' read from a
photograph was utilized for the diagnosis of OA (Hirsch et. al., 2000);
However, no assessment for accuracy or precision was reported.
(Hirsch et. al. , 2000)
Acheson and colleagues assessed the relative value of a photographic
presence of any bony deformity (including nodes), compared with
symptoms, as a screening tool for assessing the presence of hand OA
in a population study (hand OA defined as Kellgren-Lawrence grades
22
2-4 in corresponding joints). For all adults included, the sensitivity of
photographic evidence of bony deformity of the DIP joints was
between 50-60%, while specificity was between 76.74% and 81.6%
when compared to radiography (Acheson et. al., 1969).
1.6 Pain
The most common symptom of osteoarthritis is joint pain, and
stiffness and functional impairment is also often present. Arthritis
pain is the most common cause of pain in elderly populations
(Linaker et. al., 1999) and arguably the most debilitating aspect of
OA.
Usually, pain is associated with joint use and relieved by rest. For
many patients, a circadian pattern can be seen (Bellamy et. al., 1990).
As the disease progresses, many patients experience more persistent
pain that can occur at night and when resting, causing trouble with
sleep.
Studies show that hand OA leads to variable degrees of pain and
disability (Fautrel et. al., 2005; Niu et. al., 2003). A recent review by
Dahaghin and colleagues revealed that the strength of the association
between radiographic hand OA and pain varies widely in the
published studies (Dahaghin et. al., 2006). It is apparent that a
discrepancy remains between structural markers of pathology and the
clinical syndrome of osteoarthritis typified by joint pain and disability
(Ding et. al., 2007; Elliott et. al., 2007).

23
Gender differences in pain are well described (Keefe et. al., 2000),
and many studies suggest that women are more likely to report pain
than men (Davis, 1981; Unruh, 1996). The reasons for those
differences are not well understood.
1.7 Aims of the study
The aim of this study was to develop a simple, inexpensive screening
method to diagnose hand OA. In this study, we suggest the use of
high quality hand photographs as a method for diagnosing hand
osteoarthritis. We also took the first step towards standardization of a
reproducible scoring system. If it were possible to standardize the
taking and reading of hand photographs to an acceptable level, it
would open a number of epidemiological possibilities, including
comparisons of populations and possible associations with other
diseases.
Secondly, the aim of this study is to compare in the same sample of
patients the precision and the sensitivity of three different scoring
methods; photographic, radiographic and clinically diagnosed hand
OA to assess the severity of structural changes in hand OA. Also, we
wish to enlarge the evidence concerning the prevalence and pattern of
osteoarthritis in the hand joints in the elderly and to investigate the
association between photographic, radiographic as well as clinically
diagnosed hand OA in the hand and self-reported pain in this age
group.

24
2. MATERIALS AND METHODS
2.1 Subjects
All participants were enrolled in the Age, Gene/Environment
Susceptibility-Reykjavik (AGES-Reykjavik) Study (Harris et. al.,
2007) between February and June of 2005. Subjects were asked to
participate in an ancillary study that involved radiographs being taken
of both hands. Of the total 800 participants in the AGES study during
that timeframe, 389 agreed to have a hand radiograph taken. Other
diseases affecting visual assessment or the development of hand OA
were recorded (e.g. inflammatory arthropathies, Dupuytren´s
contracture, neuropathies, post-traumatic) and those subjects
disqualified.
Among 381 eligible participants there were 160 males and 221
females. Males ranged in age from 69 to 90, with a mean age of 76,
and females ranged in age from 69-92 with mean age of 75 years.
2.2 Finger joint pain assessments
Participants were asked about hand symptoms with the following
questions:
• Have you ever had pain lasting at least one month in the joints
of your hands or wrist? (The ACR criterion for diagnosis of
hand OA)

25
• In the past 12 months have you had pain lasting at least one
month in the joints of your hands or wrist?
• Do you sometimes have pain in the joints of your hand or
wrist?
• If participants answered the third question positively, they
were asked to fill out a diagram showing where the pain was
located. The diagram is shown in Figure 22 in Appendix 1.
2.3 Radiographic procedure
Standard radiographs were taken of both hands. All radiographs were
examined by two experienced radiologists (Guðmundur J. Elíasson
and Ásbjörn Jónsson) and interreliability was found to be excellent
(ICC=0,87). Consensus scores reached at a second sitting. The degree
of radiographic OA in individual joints was graded using the
Kellgren-Lawrence scoring system (Kellgren et. al., 1963)
(0=absence; 1=doubtful; 2=mild; 3=moderate; 4=severe). Grade 2 or
higher was considered a definite sign of radiographic OA.
2.4 Clinical examination
All subjects were examined by an experienced clinician (Helgi
Jónsson). Individual hand joints were scored on a 0-3 scale as
follows: 0=no evidence of OA, 1=suspected but not definite OA, 2=
definite moderate OA, 3= severe OA. Grade 2 or higher was
considered a definite sign of clinically diagnosed OA. To measure the

26
reliability af the clinical examination, a second clinician, Lauren
Abbott, reexamined 50 individuals. Interobserver agreement was
found to be good (ICC=0,81).
2.5 Photographic reading procedure
All photographs were taken with a Fuji Finepix 6800 zoom camera
with images taken at 2800x2200 pixels. The camera was mounted on
a tripod with a fixed distance to a velvet board with markers for
thumb positioning. The quality of the digital images is important in
order for the readers to be able to visually assess the degree of
enlargement and deformity.
A photographic scoring system was developed. In preparing the
scoring system, a number of variables that were suspected to be
related to hand osteoarthritis in each joint were registered. After
comparing the results with hand radiographs, the variables most likely
to be associated with clinical and radiographic hand OA were
determined.
Each individual hand joint was graded separately for the visual signs
of the presence of hand OA. Several factors are of importance, such
as hard tissue enlargement, visible soft tissue swelling, position and
deformity.
The distal interphalangeal (DIP) and the proximal interphalangeal
(PIP) joints were scored on a 0-3 scale as follows: 0=no evidence of
OA, 1=suspected but not definite OA, 2= definite moderate OA, 3=
severe OA.
27
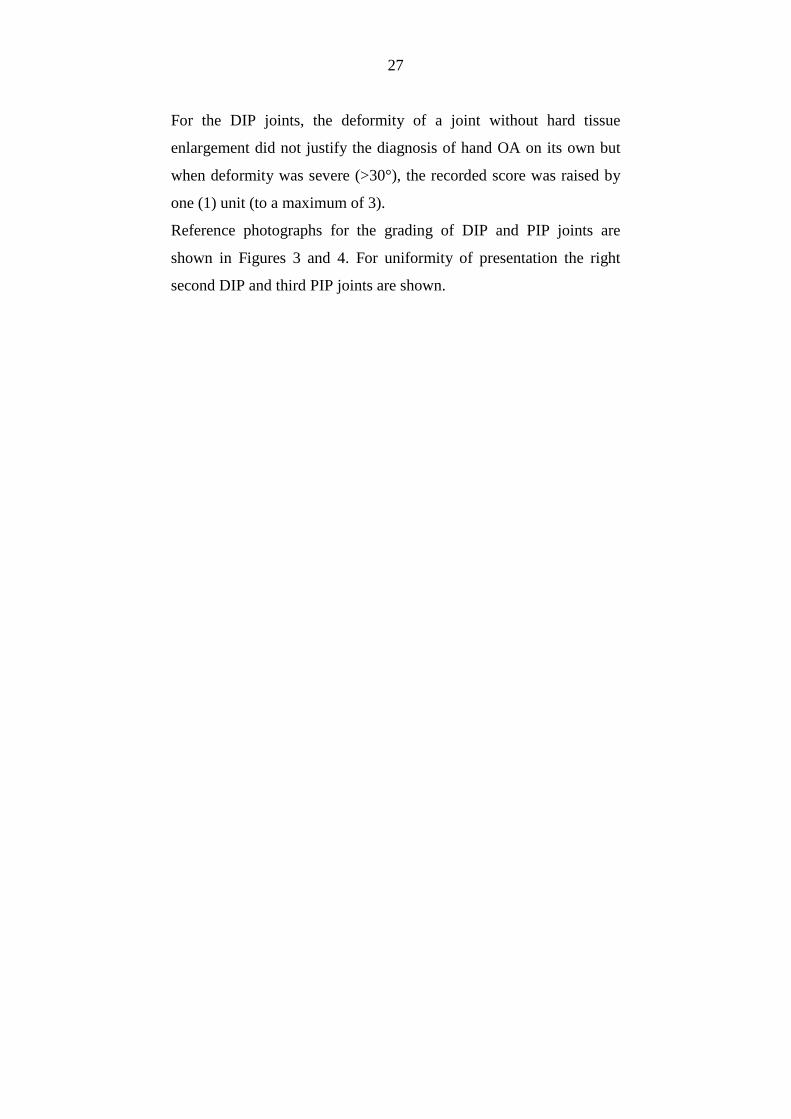
For the DIP joints, the deformity of a joint without hard tissue
enlargement did not justify the diagnosis of hand OA on its own but
when deformity was severe (>30°), the recorded score was raised by
one (1) unit (to a maximum of 3).
Reference photographs for the grading of DIP and PIP joints are
shown in Figures 3 and 4. For uniformity of presentation the right
second DIP and third PIP joints are shown.

28
Figure 3. Reference photographs showing osteoarthritis of the right second DIP. The joint is given a score (0-3) for hard tissue enlargement (Heberden´s nodes) and deformity of the joint.
29
Figure 4. Reference photographs showing osteoarthritis of the right third PIP. The joint is given a score (0-3) for hard tissue enlargement and deformity of the joint.
30
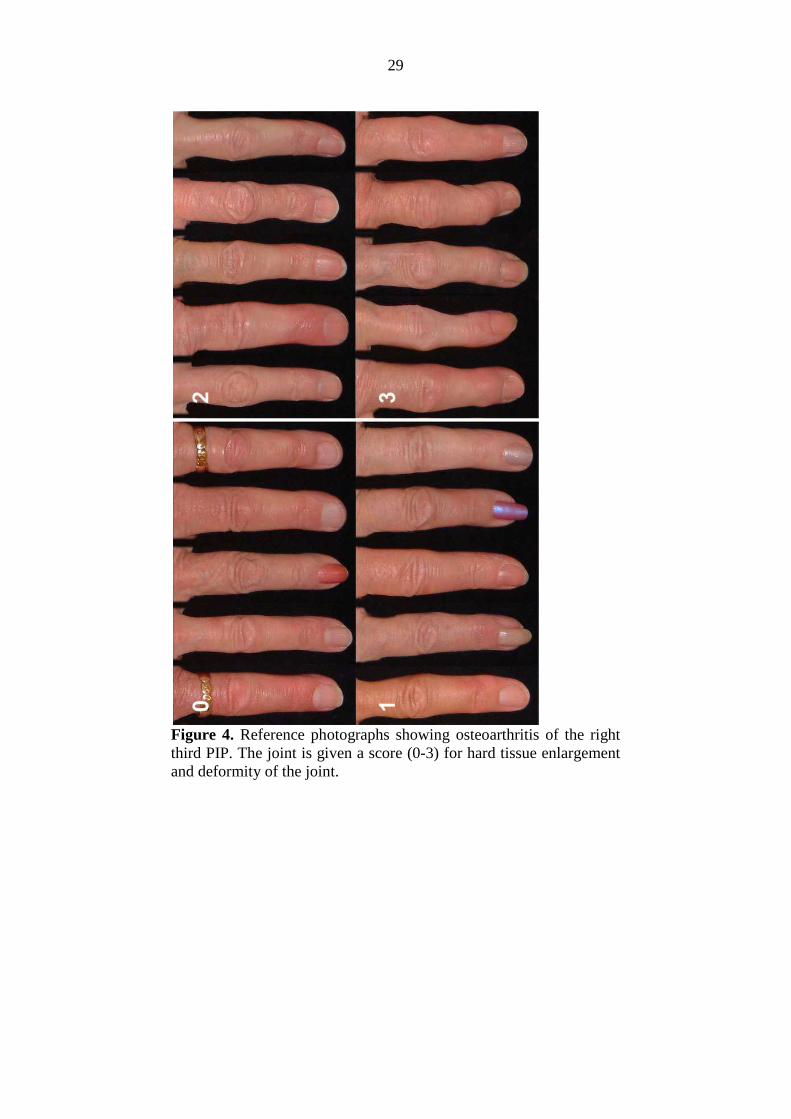
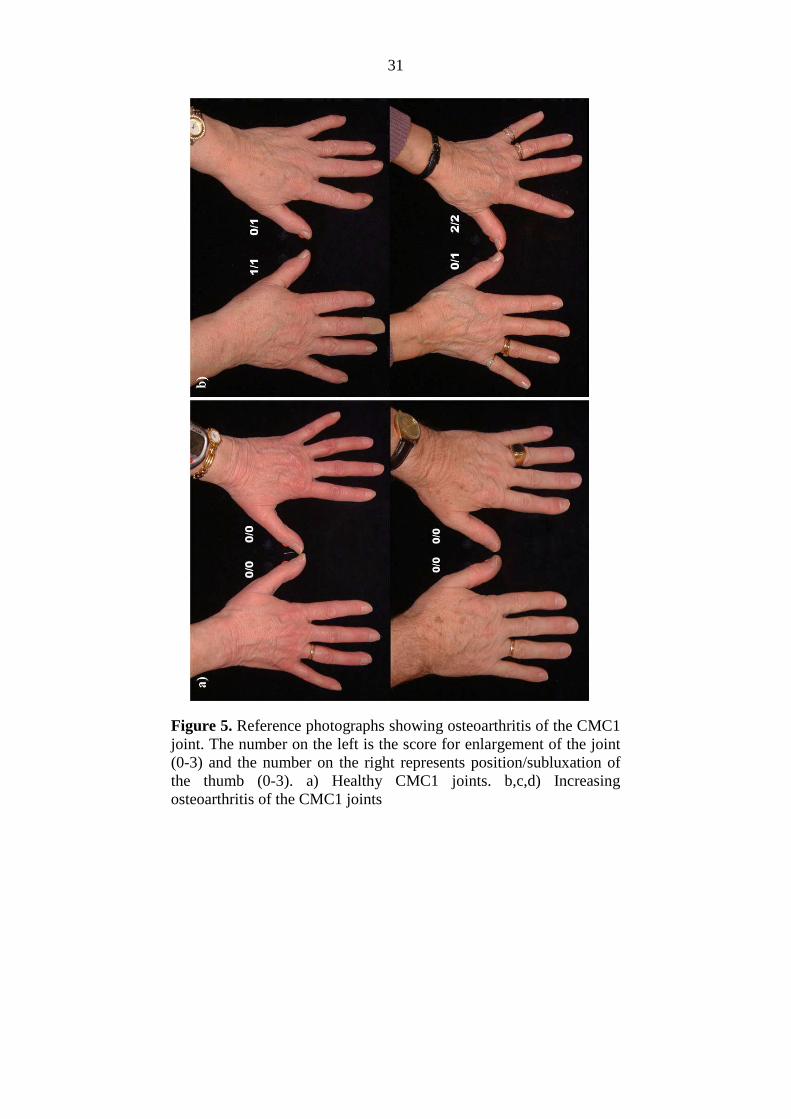
For assessment of OA of the first carpometacarpal (CMC1) joints, a
slightly different approach was needed. Two different findings,
enlargement of the joint and abnormal positioning, were related to
OA in that joint. Abnormal positioning reflects palmar migration of
the base of the first metacarpal bone and is reflected on photography
by a number of factors, including disappearance of the normal
configuration of the CMC1 joint, medial rotation of the thumb
showing increased folding of the skin over the first metacarpal joint
(MCP1) and sometimes hyperextension of that joint.
Both enlargement and position were scored on a 0-3 scale, (0=no
evidence of OA, 1=suspected but not definite OA, 2= definite
moderate OA, 3= severe OA.) and subsequently added, giving a score
of 0-6 which was translated into a 0-3 score as follows: (0= Normal
joint, 1= Doubtful OA, 2-3= Definite OA and 4+= Severe OA).
Reference photos for the CMC1 joints are shown in Figure 5.
31
Figure 5. Reference photographs showing osteoarthritis of the CMC1 joint. The number on the left is the score for enlargement of the joint (0-3) and the number on the right represents position/subluxation of the thumb (0-3). a) Healthy CMC1 joints. b,c,d) Increasing osteoarthritis of the CMC1 joints

32
Figure 5. Continued.
33
Two observers, Guðrún P. Helgadóttir and Helgi Jónsson, assessed
the hand joints of every participant. Initially the observers read small
samples. Radiography and clinical examination were used to help
determine the visual factors of importance and to define the role of
deformity of joints and/or enlargement and whether it could be
attributed to OA. It was found that deformity of the DIP joint had to
be substantial (>30°) for it to be relevant to the score and in the case
of the CMC1 joint, both the positioning of the thumb and enlargement
of the joint were relevant.
For measurement of intraobserver correlation, the photographic
reading of 50 individuals was repeated by GPH with a minimum time
interval of one month between readings.
2.6 Statistics
All statistical analyses were carried out with SPSS (v. 16.0) and
SAS/STAT (version 9.2). Non-parametric statistical methods were
used. For estimates of interobserver and intraobserver reliability and
agreement for assessment of individual joints Kappa (on/off) (where
grade 2 was used as cut-off point) and Average Measure Intraclass
Correlation Coefficient (ICC) were used. Kappa (on/off) denotes the
percentage of cases where observers agree on the diagnosis of hand
OA for each joint. ICC measures the reliability directly.
Due to prevalence differences between the genders, prevalence data
were calculated for males and females separately. The associations
between reported pain and diagnosis of osteoarthritis by photo,
34
clinical examination, and radiography were compared with a logistic
regression model for the DIP, PIP, and CMC1 joint groups separately.
The generalized estimating equation approach, using the
exchangeable log-odds association structure, was used to take
repeated measures (photo, clinical examination and radiography) of
the same subject into account. The analyses were done by sex, with
and without adjustment for age, BMI, smoking status, and education
level.

3.
The baseline characteristics of the 381 participants are presented in
Table 1. Mean age was 75,8 years with 58,3% females.
For comparison, the characteristics of all the participants in the
AGES-Reykjavik Study during the time period is shown in Table 2.
Our study population does not differ significantly in age/age
distribution or BMI distribution from the entire AGES
Study population during the time interval in question.
35
3. RESULTS
The baseline characteristics of the 381 participants are presented in
Table 1. Mean age was 75,8 years with 58,3% females.
For comparison, the characteristics of all the participants in the
ng the time period is shown in Table 2.
Our study population does not differ significantly in age/age
distribution or BMI distribution from the entire AGES-Reykjavik
Study population during the time interval in question.

36
3.1 Photographic scoring
In the first sample comparisons, Average Measure Intraclass
Correlation Coefficient (ICC) for assessment of the DIP joints was
approximately 0,60 but after repeated blind sample assessments and
with the help of a reference photograph collection the agreement
between observers improved and rose to above 0,78 (range 0,78-
0,85). Agreement between the two observers, measured with Kappa,
using 2 as cut-off point was excellent (average 0,87) and the average
ICC was 0,83 (see further in Table 3).
The interobserver agreement measured by ICC is now comparable to
that reported in radiological studies (Clohisy et. al., 2009; Lane et. al.,
1993; Scott et. al., 1993).

37
Reliability between readers was excellent for all joints, with the
interreader reliability being higher for the PIP joints (mean
kappa=0,90) than the DIP joints (mean kappa=0,84).
The Average Measure Intraclass Correlation Coefficient (ICC) for
each joint between repeated measurements of photographs by the
same reader are presented in Table 4.
Table 3. Kappa and Average Measure Intraclass Correlation
Coefficient (ICC) between the readings of the two observers.
Joint Kappa ICC
Left DIP5 0,83 0,85
DIP4 0,87 0,83
DIP3 0,85 0,84
DIP2 0,80 0,84
PIP5 0,92 0,79
PIP4 0,94 0,78
PIP3 0,86 0,86
PIP2 0,84 0,81
CMC1 0,87 0,88
Right DIP5 0,82 0,84
DIP4 0,88 0,80
DIP3 0,88 0,85
DIP2 0,79 0,78
PIP5 0,95 0,83
PIP4 0,97 0,80
PIP3 0,89 0,87
PIP2 0,84 0,81
CMC1 0,89 0,89
Average for all 18 joints 0,87 0,83

38
When the method had been established, both readers (GPH and HJ)
scored the hand joints of the 381 participants. The distribution of
photographic scores by gender for each joint for both readers
combined are shown in Tables 5 -8.
Table 4. Average Measure Intraclass Correlation Coefficient
(ICC) between two readings of the same observer.
Joint ICC
Left handDIP5 0,90
DIP4 0,91
DIP3 0,93
DIP2 0,95
PIP5 0,81
PIP4 0,90
PIP3 0,92
PIP2 0,81
CMC1 0,91
Right handDIP5 0,87
DIP4 0,94
DIP3 0,93
DIP2 0,95
PIP5 0,88
PIP4 0,89
PIP3 0,89
PIP2 0,84
CMC1 0,95

39
Ta
ble
5.
Co
nse
nsu
s p
ho
tog
rap
hic
sco
re f
or
the
DIP
an
d P
IP j
oin
ts f
or
all
su
bje
cts.
Join
t0
12
3
nn
nn
Tot
al n
All
su
bje
cts
Rig
ht
han
dD
IP5
16
31
43
66
73
79
DIP
42
31
10
93
82
38
0
DIP
32
01
11
35
01
23
76
DIP
29
91
54
10
02
23
75
PIP
52
81
67
30
03
78
PIP
43
20
47
11
23
80
PIP
32
14
10
35
48
37
9
PIP
21
92
14
04
32
37
7
Lef
t h
and
DIP
51
80
13
75
57
37
9
DIP
42
32
11
82
34
37
7
DIP
31
83
13
65
36
37
8
DIP
21
16
16
98
51
03
80
PIP
53
03
52
26
03
81
PIP
43
49
22
53
37
9
PIP
32
55
91
29
53
80
PIP
22
13
14
42
12
38
0
Gra
de

40
Ta
ble
6.
Co
nse
nsu
s p
ho
tog
rap
hic
sco
re f
or
the
DIP
an
d P
IP j
oin
ts s
ho
wn
fo
r m
ale
s.
Join
t0
12
3
nn
nn
Tot
al n
Ma
les
Rig
ht
han
dD
IP5
73
59
25
11
58
DIP
41
03
42
13
01
58
DIP
39
14
51
72
15
5
DIP
24
37
83
70
15
8
PIP
51
16
30
11
01
57
PIP
41
29
22
70
15
8
PIP
38
14
62
82
15
7
PIP
27
26
02
40
15
6
Lef
t h
and
DIP
57
36
12
40
15
8
DIP
49
94
97
01
55
DIP
38
35
71
60
15
6
DIP
24
37
83
70
15
8
PIP
51
21
21
17
01
59
PIP
41
45
11
10
15
7
PIP
39
64
31
72
15
8
PIP
28
36
41
10
15
8
Gra
de

41
Ta
ble
7.
Co
nse
nsu
s p
ho
tog
rap
hic
sco
re f
or
the
DIP
an
d P
IP j
oin
ts s
ho
wn
fo
r fe
ma
les.
Join
t0
12
3
nn
nn
Tot
al n
Fe
ma
les
Rig
ht
han
dD
IP5
90
84
41
62
21
DIP
41
28
67
25
22
22
DIP
31
10
68
33
10
22
1
DIP
24
69
26
51
72
20
PIP
51
65
37
19
02
21
PIP
41
91
25
42
22
2
PIP
31
33
57
26
62
22
PIP
21
20
80
19
22
21
Lef
t h
and
DIP
51
07
76
31
72
21
DIP
41
33
69
16
42
22
DIP
31
00
79
37
62
22
DIP
27
39
14
81
02
22
PIP
51
82
31
90
22
2
PIP
42
04
11
43
22
2
PIP
31
59
48
12
32
22
PIP
21
30
80
10
22
22
Gra
de

42
Tab
le 8
. C
on
sen
sus
sco
re f
or
the
CM
C1
jo
int,
sh
ow
n f
or
all
in
div
idu
als
an
d m
ale
s a
nd
fe
ma
les
se
pa
rate
ly.
Join
t0
12
34
56
nn
nn
nn
nT
otal
n
All
CM
C1
Rig
ht
26
16
23
21
46
32
38
0
CM
C1
Lef
t2
90
50
15
14
52
23
78
Mal
es
CM
C1
Rig
ht
12
72
27
20
00
15
8
CM
C1
Lef
t1
41
12
31
00
01
57
Fe
ma
les
CM
C1
Rig
ht
13
44
02
51
26
32
22
2
CM
C1
Lef
t1
49
38
12
13
52
22
21
Gra
de

43
The scores for the CMC1 joints that are shown in Table 8 were then
translated into a 0-3 score as follows: (0= Normal joint, 1= Doubtful
OA, 2-3= Definite OA and 4+= Severe OA).
3.2 Comparison of photographic scoring with clinical
examination and radiographic scoring
Osteoarthritis was evaluated for a total of 18 commonly affected
joints (4 DIP joints, 4 PIP joints and the CMC1 joint on each hand).
Table 9 shows the point prevalence of osteoarthritis in the hand joint
groups of males and females for each of the three methods. Grade ≥2
in one or more joints in the joint group is considered a marker of OA
in the joint group.
Table 9. Point prevalence of OA in the hand joints of males and females.
Males (N=159) Females (N=222)
Right/Left Right Left Right/Left Right Left
POA of DIPs % 48,4 39,0 32,7 50,0 45,0 34,7
POA of PIPs % 36,5 28,3 20,1 27,5 22,5 12,2
POA of CMC1 % 5,7 5,7 2,5 25,2 21,7 15,4
ROA of DIPs % 81,8 78,0 66,7 91,9 88,3 80,6
ROA of PIPs % 50,3 35,8 32,1 67,6 50,0 43,2
ROA of CMC1 % 25,8 18,2 19,5 35,1 27,9 28,4
COA of DIPs % 69,2 61,0 53,5 75,7 68,9 59,0
COA of PIPs % 28,9 20,8 18,9 22,5 18,5 14,9
COA of CMC1 % 13,2 7,5 10,1 36,0 26,1 26,6
*ROA: presence of K-L?2 in at least one joint of the group.
*POA: presence of photographic grade ?2 in at least one joint of the group.
*COA: presence of clinical grade?2 in at least one joint of the group.
44
Of the study participants, 49,3% (males 48,4%, females 50,0%) had
photographic OA (score ≥2) in at least one DIP joint, 31,2% (males
36,5%, females 27,5%) had photographic OA in at least one PIP joint
and 17,1% (5,7% males and 25,2% females) had photographic OA in
at least one of the two CMC1 joints.
For radiography, 87,7% of participants had OA in at least one DIP
joint, 60,4% in at least one PIP joint and 31,2% in at least one CMC1
joint. According to the clinical examination, 73,4% had OA in at least
one DIP joint, 25,3% in at least one PIP joint and 26,6% in at least
one CMC1 joint.
According to the photographic method, 60,4% of males had at least
one affected hand joint, 85,5% had radiographic OA and 74,2%
clinically diagnosed OA in at least one of the 18 hand joints. In
females, the percentages were 66,2%, 93,7% and 82,4%, respectively.
Figures 6 to 10 show the percent prevalence of osteoarthritis in each
hand joint examined, according to the three methods. Grade 2 is used
as cut-off for each method. Females are more often affected than
males using all three methods and according to all three methods, the
right hand is more often affected than the left hand in all joint groups
in both sexes.
The DIP joints were most frequently affected according to all three
methods. Using the photographic method, the PIP joints were more
often affected than the CMC1 joint. This was reversed in women,

45
with CMC1 OA being more prevalent than PIP OA. According to
radiography and clinical examination, CMC1 and PIP joints showed
similar prevalence in both males and females except CMC1 OA was
more prevalent than PIP OA in females using clinical examination.
Figure 6. Percent prevalence of OA (score 2+) in the DIP joints of males according to the different methods.
DIP5 DIP4 DIP3 DIP2 DIP2 DIP3 DIP4 DIP5
Left hand Right hand
Photo 15,2 4,5 10,3 23,4 25,8 12,3 8,2 16,4
Xray 45,3 32,1 34,4 51,9 61,2 44,0 36,9 45,9
Clin 44,8 13,9 18,5 37,4 43,2 16,6 20,7 47,4
0,0
10,0
20,0
30,0
40,0
50,0
60,0
70,0
Pre
va
len
ce (
%)
Photo
Xray
Clin

46
Figure 7. Percent prevalence of OA (score 2+) in the DIP joints of females according to the different methods.
Figure 8. Percent prevalence of OA (score 2+) in the PIP joints of males according to the different methods.
DIP5 DIP4 DIP3 DIP2 DIP2 DIP3 DIP4 DIP5
Left hand Right hand
Photo 17,2 9,0 19,4 26,1 37,2 19,4 12,2 21,3
Xray 57,2 51,3 61,3 65,8 79,7 69,4 51,8 58,8
Clin 42,4 19,5 28,3 42,8 59,4 23,1 37,0 40,9
0,010,0
20,030,0
40,050,0
60,070,0
80,090,0
Pre
va
len
ce (
%)
PIP5 PIP4 PIP3 PIP2 PIP2 PIP3 PIP4 PIP5
Left hand Right hand
Photo 10,7 0,6 12,1 7,0 15,4 19,1 4,4 7,0
Xray 19,1 8,2 15,7 17,6 17,6 20,1 13,3 24,1
Clin 4,4 2,5 10,7 8,2 12,6 15,4 3,8 2,5
0,0
5,0
10,0
15,0
20,0
25,0
30,0
Pre
va
len
ce (
%)

47
Figure 9. Percent prevalence of OA (score 2+) in the PIP joints of females according to the different methods.
Figure 10. Percent prevalence of OA (score 2+) in the CMC1 joints of males and females according to the different methods.
PIP5 PIP4 PIP3 PIP2 PIP2 PIP3 PIP4 PIP5
Left hand Right hand
Photo 4,1 3,2 6,8 5,4 9,5 14,4 2,7 8,6
Xray 28,9 24,4 26,1 23,9 23,9 30,6 25,3 33,0
Clin 3,7 7,3 8,7 8,2 9,5 12,8 6,9 5,0
0,0
5,0
10,0
15,0
20,0
25,0
30,0
35,0
Pre
va
len
ce (
%)
Left CMC1 Right CMC1 Left CMC1 Right CMC1
Males Females
Photo 2,5 5,7 15,4 21,7
Xray 19,7 18,2 28,4 28,0
Clin 10,1 7,6 26,8 26,4
0,0
5,0
10,0
15,0
20,0
25,0
30,0
Pre
va
len
ce (
%)
48
Figure 11 presents a Venn diagram for individuals in the highest
quartile (aggregate scores) for each method. Analyzing quartiles of
the aggregate scores revealed that approximately 50% of females in
the highest quartile for each method were in the highest quartile for
all methods. The corresponding figure for males was 37%. Some
participants had low POA and COA scores but high ROA scores.
Figure 11. Venn diagram for the highest quartile of each method for males and females.
Figures 12 to 14 present the age specific prevalence of hand OA in
each joint group according to the three methods. According to the
photographic method, approximately half of the individuals have at
least one affected DIP joint except in the oldest age group, where
31% have at least one affected DIP joint. The same was found for the
PIP joints and CMC1 joints where we observed a tendency for
photographic OA to be less prevalent in individuals in the oldest age
group. Clinical and radiographic hand OA showed a similar pattern.

49
Figure 12. Age specific prevalence (%) of photographic hand OA in each joint group according to age group.
Figure 13. Age specific prevalence (%) of radiographic hand OA in each joint group according to age group.
DIPs PIPs CMC1
<75 52,1 26,1 13,8
75-79 50,9 32,8 18,1
80-84 45,1 45,1 27,5
85> 30,8 34,6 15,4
0,0
10,0
20,0
30,0
40,0
50,0
60,0
% P
rev
ale
nce
DIPs PIPs CMC1
<75 84,6 53,7 27,1
75-79 90,5 69,0 34,5
80-84 92,2 60,8 39,2
85> 88,5 69,2 30,8
0102030405060708090
100
% P
rev
ale
nce
50
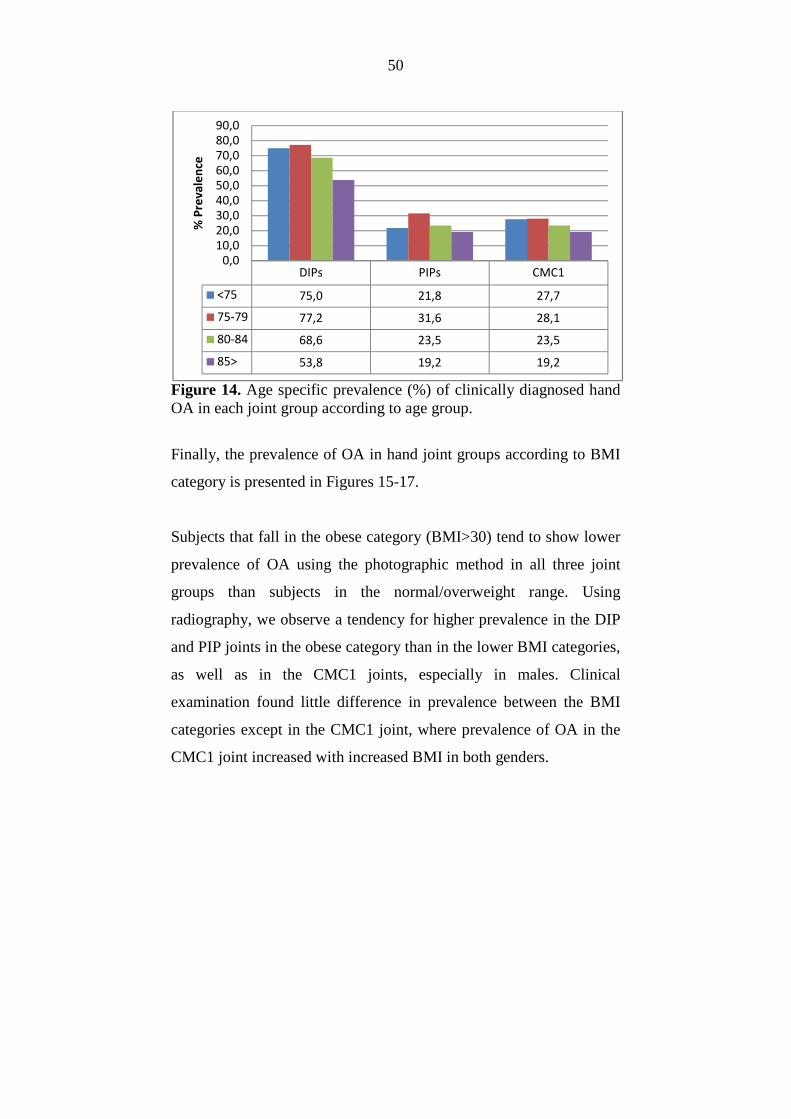
Figure 14. Age specific prevalence (%) of clinically diagnosed hand OA in each joint group according to age group.
Finally, the prevalence of OA in hand joint groups according to BMI
category is presented in Figures 15-17.
Subjects that fall in the obese category (BMI>30) tend to show lower
prevalence of OA using the photographic method in all three joint
groups than subjects in the normal/overweight range. Using
radiography, we observe a tendency for higher prevalence in the DIP
and PIP joints in the obese category than in the lower BMI categories,
as well as in the CMC1 joints, especially in males. Clinical
examination found little difference in prevalence between the BMI
categories except in the CMC1 joint, where prevalence of OA in the
CMC1 joint increased with increased BMI in both genders.
DIPs PIPs CMC1
<75 75,0 21,8 27,7
75-79 77,2 31,6 28,1
80-84 68,6 23,5 23,5
85> 53,8 19,2 19,2
0,0
10,0
20,0
30,0
40,0
50,0
60,0
70,0
80,0
90,0
% P
rev
ale
nce
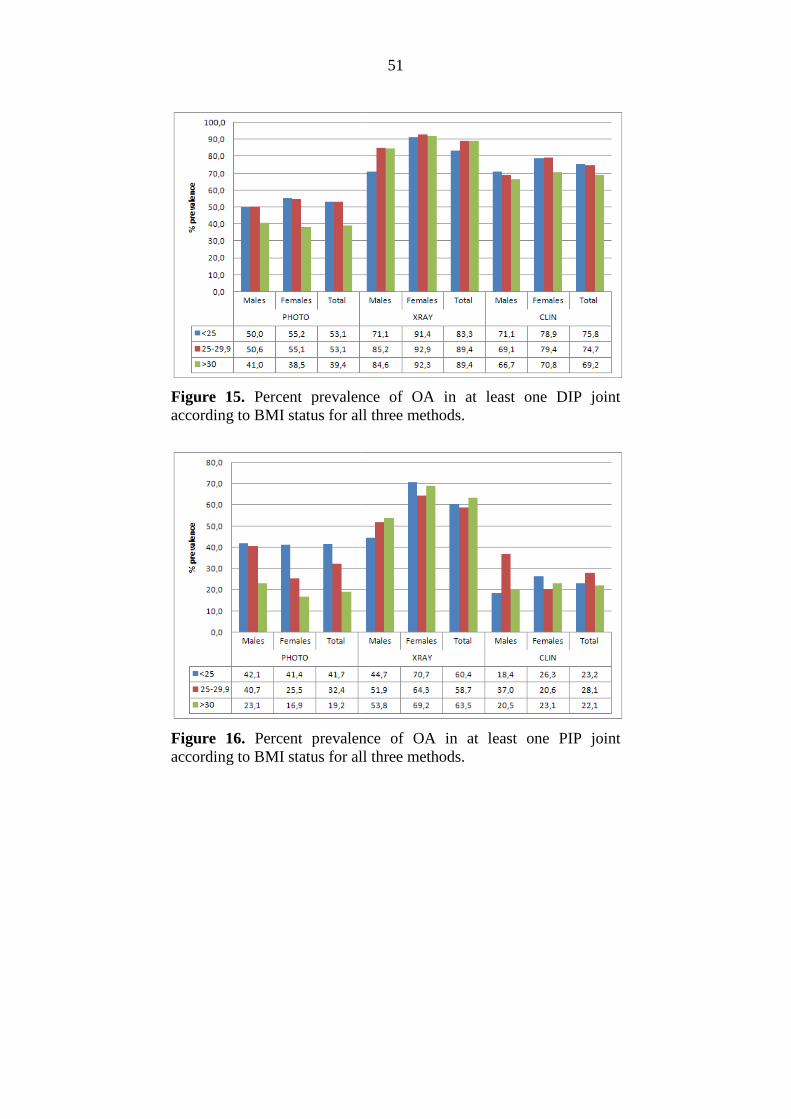
Figure 15. Percent prevalence of OA in at least one DIP joint according to BMI status for all three methods.
Figure 16. Percent prevalence of OA in at least one PIP joint according to BMI status for all three methods.
51
Percent prevalence of OA in at least one DIP joint according to BMI status for all three methods.
Percent prevalence of OA in at least one PIP joint ing to BMI status for all three methods.

Figure 17. Percent prevalence of OA in at least one of the two CMC1 joints according to BMI status for all three methods.
3.3. Pain prevalence
The one month period prevalence of ever havin
least one month was 20,0% (77 individuals) with 17 males (10,7%)
and 60 females (27,0%). In the previous year, 7 males (4,4%) and 43
females (19,4%) reported having pain lasting at least a month.
16 males (10,1%) and 92 females (41,4
52
Percent prevalence of OA in at least one of the two CMC1 joints according to BMI status for all three methods.
The one month period prevalence of ever having hand pain lasting at
least one month was 20,0% (77 individuals) with 17 males (10,7%)
and 60 females (27,0%). In the previous year, 7 males (4,4%) and 43
females (19,4%) reported having pain lasting at least a month.
16 males (10,1%) and 92 females (41,4%) reported intermittent pain.
53
Table 10 shows the prevalence of self-reported intermittent pain in the
hand joints by gender. Females are more likely to report pain than
males. Very few males reported having intermittent pain, with almost
none reporting DIP pain. In females, the CMC1 is most often painful,
followed by the PIP joints and the DIP joints.
3.4 Comparison of the three methods in relation to pain
3.4.1. ACR pain criterion in relation to the three methods
A receiver operating characteristic (ROC) curve analysis was
performed for accuracy of the three methods in predicting pain lasting
at least a month, which the ACR criterion for diagnosis of hand OA
calls for.
Table 10. Hand joint pain by joints and gender (N(%)).
Left hand Right hand Left hand Right hand
DIP5 0 (0,0) 1 (0,6) 26 (11,7) 22 (9,9)
DIP4 1 (0,6) 0 (0,0) 30 (13,5) 26 (11,7)
DIP3 1 (0,6) 0 (0,0) 43 (19,4) 35( 15,8)
DIP2 1 (0,6) 0 (0,0) 40 (18,0) 35 (15,8)
PIP5 4 (2,5) 5 (3,1) 34 (15,3) 38 (17,1)
PIP4 5 (3,1) 7 (4,4) 39 (17,6) 45 (20,3)
PIP3 7 (4,4) 8 (5,0) 38 (17,1) 37 (16,7)
PIP2 4 (2,5) 7 (4,4) 30 (13,5) 29 (13,1)
CMC1 4 (2,5) 5 (3,1) 46 (20,7) 49 (22,1)
Males Females
54
Figure 18. ROC curve analysis of the accuracy of the three methods (aggregate scores in the 18 joints by each method) in detecting pain of at least one months duration in males.
As shown in Figure 18, with only 13 males having data for all three
methods reporting pain lasting at least a month, no significant
association was found.
Males Area under curve
Photographic OA 0,55 ns
Radiographic OA 0,55 ns
Clinical OA 0,56 ns
55
Figure 19. ROC curve analysis of the accuracy of the three methods (aggregate scores in the 18 joints by each method) in detecting pain of at least one months duration in females.
In females, the photographic method and clinical examination were
able to predict pain lasting at least a month with statistical
significance (Figure 19). No statistically significant association was
found for the radiographic method. It is probable, however, that the
Females Area Under Curve
Photographic OA 0,62 *
Radiographic OA 0,58 ns
Clinical OA 0,62 *
* P<0,01.
56
radiographic method would reach significance with a larger sample
size.
3.4.2. Intermittent pain and joint pain distribution in relation to the
three scoring methods
Intermittent pain in individual joints and joint rows was significantly
associated with the severity of OA assessed by all three methods. The
strongest associations were seen for the CMC1 joints and the
interphalangeal joints of the second and third fingers.
Table 11 presents the associations between the diagnosis of OA using
the different methods and pain in the respective joint for the second
DIP, third PIP and CMC1 joint of the right hand in females. In the
DIP2 and the PIP3 joints, the difference in association between OA
and pain between the methods is not statistically significant (P-value
0,57 and 0,91, respectively). In the CMC1 joint however, the
association between osteoarthritis of the joint and pain is stronger for
radiography and clinical examination than for the photographic
method (P-value 0,018).
57
58
In Table 12, the associations between the diagnosis of OA using the
different methods and pain in the respective joint for the third PIP and
CMC1 joint of the right hand for males are shown. Due to the fact
that few males reported intermittent pain, we were unable to compute
odds ratios for the second DIP joint as well as adjusted odds ratios for
all three joints. Males seem to have less association between OA and
pain than females except in the case of the clinical diagnosis of
osteoarthritis of the CMC1 joint.

59
Ta
ble
12
. A
sso
cia
tio
ns
be
twe
en
th
e d
iag
no
sis
of
de
fin
ite
OA
usi
ng
th
e d
iffe
ren
t m
eth
od
s a
nd
pa
in i
n t
he
re
spe
ctiv
e j
oin
t in
ma
les.
% r
ep
ort
ing
pa
in
% r
ep
ort
ing
pa
in t
ha
t U
na
dju
ste
d O
dd
s ra
tio
ha
vin
g O
A i
n t
he
jo
int
do
no
t h
av
e O
A i
n t
he
jo
int
an
d 9
5%
CI
Ch
i-sq
ua
reP
va
lue
Rig
ht
PIP
Ph
oto
6,7
4,7
1,4
(0
,3-7
,5)
0,2
0,7
Xra
y6
,34
,71
,3 (
0,3
-7,0
)0
,10
,7
Cli
nic
al
exa
min
ati
on
12
,53
,83
,6 (
0,8
-16
,3)
3,2
0,0
8
Rig
ht
CM
C1
Ph
oto
11
,12
,74
,5 (
0,4
-45
,4)
2,0
0,2
Xra
y1
0,3
1,5
7,4
(1
,2-4
6,4
)6
,00
,01
Cli
nic
al
exa
min
ati
on
16
,71
,41
4,3
(1
,8-1
12
,4)
10
,40
,00
1

60
Figure 20. ROC curves for accuracy of the three methods in predicting pain in three commonly affected joints in females.
A receiver operating characteristic (ROC) curve analysis was
performed for accuracy of the three methods in predicting pain in
Are
a U
nder
the
Cur
veA
rea
Und
er th
e C
urve
Are
a U
nder
the
Cur
veTe
st R
esul
t Var
iabl
e(s)
Are
aTe
st R
esul
t Var
iabl
e(s)
Are
aTe
st R
esul
t Var
iabl
e(s)
Are
aP
HO
TOD
3D0,
69P
HO
TOP
3D0,
58P
AG
C03
D0,
68R
DIP
3D0,
80R
PIP
3D0,
67R
CM
CD
0,78
KD
3D0,
63K
P3D
0,63
KC
MC
D0,
79
RO
C C
urve
Dia
gona
l seg
men
ts a
re p
rodu
ced
by ti
es.
1 -
Spe
cific
ity
1,0
,8,5
,30,
0
Sensitivity
1,0 ,8 ,5 ,3 0,0
Sou
rce
of th
e C
urve
KD
3D
RD
IP3D
PHO
TOD
3D
RO
C C
urve
Dia
gona
l seg
men
ts a
re p
rodu
ced
by ti
es.
1 -
Spe
cific
ity
1,0
,8,5
,30,
0
Sensitivity
1,0 ,8 ,5 ,3 0,0
Sou
rce
of th
e C
urve
KP3
D
RPI
P3D
PHO
TOP3
D
RO
C C
urve
Dia
gona
l seg
men
ts a
re p
rodu
ced
by ti
es.
1 -
Spe
cific
ity
1,0
,8,5
,30,
0
Sensitivity
1,0 ,8 ,5 ,3 0,0
Sou
rce
of th
e C
urve
KC
MC
D
RC
MC
D
PAG
C03
D

61
three commonly affected joints on the right side, DIP2, PIP3 and
CMC1 in females as shown in Figure 20.
The analysis indicates that XRAY has the highest accuracy for the
prediction of pain in the DIP joint with CLIN and PHOTO showing
similar accuracy. In predicting pain in the PIP joint, XRAY had the
highest accuracy while CLIN and XRAY perform similarly for
predicting pain in the CMC1 joint.
Figure 21. presents ROC curves showing how pain from joint rows
correlates with pain from the respective joint group in females.

62
Figure 21. ROC curves showing how pain from joint rows correlates with pain from the respective joint row in females.
Hand joint pain in females in this age group is much more prevalent
and shows a consistent relation to the severity of HOA in individual
Are
a U
nder
the
Cur
veA
rea
Und
er th
e C
urve
Are
a U
nder
the
Cur
veT
est R
esul
t Var
iabl
e(s)
Are
aT
est R
esul
t Var
iabl
e(s)
Are
aT
est R
esul
t Var
iabl
e(s)
Are
aP
HC
UM
DIP
0,70
PH
CU
MP
IP0,
59P
HC
UM
CM
C0,
70R
CU
MD
IP0,
78R
CU
MP
IP0,
68R
CU
MC
MC
0,77
KC
UM
DIP
0,71
KC
UM
PIP
0,64
KC
UM
CM
C0,
80
RO
C C
urve
Dia
gonal s
eg
ments
are
pro
duced
by
tie
s.
1 -
Sp
eci
ficity
1,0
,8,5
,30
,0
Sensitivity
1,0 ,8 ,5 ,3
0,0
So
urc
e o
f th
e C
urv
e
KC
UM
DIP
RC
UM
DIP
PH
CU
MD
IP
RO
C C
urve
Dia
go
nal s
egm
ents
are
pro
duce
d b
y tie
s.
1 -
Sp
eci
ficity
1,0
,8,5
,30
,0
Sensitivity
1,0 ,8 ,5 ,3
0,0
So
urc
e o
f th
e C
urv
e
KC
UM
PIP
RC
UM
PIP
PH
CU
MPIP
RO
C C
urve
Dia
gona
l se
gm
en
ts a
re p
rod
uce
d b
y t
ies.
1 -
Sp
eci
ficity
1,0
,8,5
,30,0
Sensitivity
1,0 ,8 ,5 ,3
0,0
So
urc
e o
f th
e C
urv
e
KC
UM
CM
C
RC
UM
CM
C
PH
CU
MC
MC

63
joints and joint groups. This study indicates that hand photography
can be used to assess the severity of HOA but is less accurate than
radiographs in predicting pain, particularly in the PIP joints.
64
4. DISCUSSION
4.1 Photographic reading system
In this study we present a photographic scoring system to assess the
prevalence of hand osteoarthritis in clinical and epidemiological study
samples. The method is simple and time- as well as cost efficient
compared to the methods most commonly used for the diagnosis of
hand OA. Given the central role of hand OA in genetic studies of OA
and its relation to the presence and prognosis of OA at other sites, this
may be a step forward in osteoarthritis research.
The proposed scale is based on the visual evidience of OA on digital
photographs. Nine individual joints are scored on each hand (four DIP
joints, four PIP joints and the CMC1 joint). Initially, the first IP joints
were incuded as well. These 20 joints were selected because they are
shown to be most often affected by OA and also because they have
been used in conjunction with knee or hip OA as a marker for the
presence of generalized OA. However, we found the IP joints hard to
read and ended up focusing on the remaining 18 joints.
First results of the use of photographic readings for diagnosis of hand
OA are promising. After repeated assessments and with use of
standardization photographs it is possible to achieve agreement
similar to that between radiology readings between two experienced
readers (Clohisy et. al., 2009; Lane et. al., 1993). However, this
65
photographic index of osteoarthritis has only been used in the elderly
and requires further validation in other populations.
This scale is very efficient and therefore interesting for investigations
on hand OA in large patient samples.
The results of our study also suggest that it may be sufficient to have
only one trained reader for photographic studies of hand OA, because
inter-rater reliability is good. On the other hand, there are potential
problems with a single reader. One reader scoring all of the
photographs might display a trend bias and may be less reproducible
when reading routinely compared to an experimental situation. To
protect against such problems with a single reader, intra- and inter-
reader reliability needs to be evaluated frequently. Obtaining a
consensus among multiple readers on all photographs may be an
accurate and reproducible method, but is not always feasible in
epidemiologic studies with very large numbers of photographs. Thus,
one approach could be to screen large samples of photographs for
positive osteoarthritic joints and to subject the potential cases to more
detailed scrutiny by multiple readers.
4.2 Prevalence of hand osteoarthritis
There is no absolute clinical, radiological, or pathological standard
against which epidemiological definitions of hand OA can be tested.
We decided to compare the photographic method to the most

66
commonly used methods for the diagnosis of hand OA, radiography
and symptomatic clinical diagnosis.
We have presented extensive data on the prevalence of both
radiographically, clinically as well as photographically diagnosed
osteoarthritis in an elderly population including both genders. The
results of this study confirmed that hand OA is a frequently occurring
disease in the elderly, especially in females. Therefore, the disease
burden of hand OA affects a large percentage of the aging population.
Research efforts that further our understanding of hand OA may
contribute towards interventions that impact a rapidly growing
segment of our population.
In our study, 60,4% of males and 66,2% of females were diagnosed
with OA in at least one of the hand joints using the photographic
method. Using radiographic OA, 85,5% of males and 82,4% of
females had OA and using clinical examination 74,2% of males and
82,4% of females in at least one joint of the hand. This high
frequency of ROA and it being more frequent in females confirmed
previous findings (Kalichman et. al., 2004; Van Saase et. al., 1989).
According to all three methods, there is a tendency for the right hand
to be more often affected than the left hand in all joint groups. This is
in agreement with the results of others (Caspi et. al., 2001; Wilder et.
al., 2006). Dahaghin et al found a higher prevalence of CMC1 OA in
the left hand (Dahaghin et. al., 2005).
67
In all age groups, the DIP joints are most often affected joint group.
The PIP joints are relatively less affected in each age group. Pattern
of joint involvement in our study is comparable with other findings
(Egger et. al., 1995; Kalichman et. al., 2009).
Interestingly, there are a number of individuals who have high ROA
scores and low POA and COA scores (non-nodal hand OA). This
subgroup will be the subject of further studies.
4.2.1. Prevalence in different age groups
Our data suggest a ceiling effect with regard to age and the prevalence
of hand OA. In the oldest age group we observed a slight decrease in
the prevalence of hand OA using all three methods, exept in the case
of radiographic PIP OA. It is possible that this is at least partly due to
the fact that relatively few individuals were in the oldest age group.
However, it has previously been reported by other investigators that
incidence and prevalence of symptomatic osteoarthritis seem to level
off or to decline at around 80 years (Bagge et. al., 1991; Van Saase et.
al., 1989).
Wilder et al. reported opposing findings, that the prevalence of
radiographic OA increased with age in both the DIP and PIP joints,
being more prevalent in the >80 year age group than in the 70-79 year
old group (Wilder et. al., 2006).
The reason for this discrepancy is unclear and calls for further
research. However, when we take into consideration that osteoarthritis
is a chronic disease, we could argue that disabled persons are less

68
likely to participate in the study and possibly that the selection of
healthy survivors is an explanation.
4.2.2. Hand OA prevalence and body mass index (BMI)
Obesity has been viewed as a possible risk factor for osteoarthritis
through mechanical loading of weight-bearing joints with the
relationship of BMI and knee as well as hip OA being well described
(Manninen et. al., 1996). Data regarding the association of obesity
with hand osteoarthritis are conflicting, with some studies not finding
any association (Hochberg et. al., 1993) while other studies do show
an association of obesity with hand osteoarthritis (Oliveria et. al.,
1999; Wilder et. al., 2006), suggesting that obesity is associated with
development of OA not only through increasing mechanical loading,
but also that being obese is a systemic risk factor for OA, especially
in women.
Using radiography, we observe a tendency for higher prevalence of
OA in the DIP and PIP joints, as well as in the CMC1 joints
(especially in males) in the obese category than in the lower BMI
categories,. Clinical examination found little difference in prevalence
between the BMI categories except in the CMC1 joint, where
prevalence of OA in the CMC1 joint increased with increased BMI in
both genders.

69
Using the photographic method, subjects that fall in the obese
category (BMI>30) show lower prevalence of OA in all three joint
groups than subjects in the normal/overweight range. It is possible
that this is due to the effect that excess fat on the hands make it harder
to visually detect signs of osteoarthritis.
4.3 Pain prevalence and relation to the three scoring methods
4.3.1 Pain according to the ACR criteria
The prevalence of ever having hand pain lasting at least one month
(the ACR criterion for diagnosis of hand OA) was 20,0% (10,7% in
males and 27,0% in females).
Sixteen males (10,1%) and 92 females (41,4%) reported intermittent
pain.
Females reported having more frequent pain than males and when
pain was present, the number of painful joints was greater in females
than in males. Previous studies have reported similar findings, that
men and women differ in the factors associated with musculoskeletal
pain in older ages (Dahaghin et. al., 2005; Keefe et. al., 2000;
Leveille et. al., 2005).
Receiver operating curve analysis was used to assess accuracy of the
three methods in predicting pain. The best possible prediction method
would yield a point in the upper left corner or coordinate (0,1) of the
ROC space, representing 100% sensitivity (no false negatives) and
70
100% specificity (no false positives). How close the ROC curve is to
the upper left corner and therefore the accuracy of the test is reflected
by the area under the curve and is shown for each method below each
ROC curve.
With so few males reporting pain lasting at least a month we lacked
the statistical power to assess the association between the different
methods and reported pain. In females, the photographic method and
clinical examination were able to predict pain lasting at least a month
with statistical significance. No statistically significant association
was found for the radiographic method. It is probable, however, that
the radiographic method would reach significance with a larger
sample size. In the case of the ACR pain criterion, we found that the
photographic method was comparable to clinical examination in
predicting pain.
4.3.2 Intermittent hand pain
Symptomatic osteoarthritis, when present, often involved multiple
hand joints, with only 17,6% of those reporting intermittent pain
having only one painful joint. The CMC1 joints are most often
affected in females and the CMC1 and PIP joints are most often
affected in males. Very few males reported having intermittent pain,
with almost none reporting DIP pain.
We found that the rate of finger joint pain was higher in the right hand
than in the left, in the thumb, index and middle fingers compared with
the little finger, which is in concordance with the results of Ding and
71
colleagues in a study on middle-aged females (Ding et. al. , 2007).
Ding also found evidence of clear graded association of the severity
of ROA with finger joint pain among middle-aged women.
Our data suggest that pain in the hand joints increases with age only
up until the mid eight decade. This is in accord with the results of
Helme and colleagues who reported that pain increases only up until
the seventh decade. (Helme and Gibson, 2001) This may be attributed
to a number of factors, such as increased stoicism in older individuals,
the possibility of selection bias in our population selection with lower
response rate in older/sicker people or possibly to age-related changes
in the function of pain pathways.
We confirmed a modest association between hand OA diagnosed
using all three methods and intermittent hand pain, the strongest
relationship in the case of the base of the thumb, confirming previous
findings of Dahaghin et. al (Dahaghin et. al., 2005). Dahaghin also
reported a stronger association with hand pain in the presence of
radiographic OA in the base of the thumb than with radiographic OA
in the other hand joints. Lawrence et al reported similar association
between pain and the presence of radiographic OA in the base of the
thumb (Lawrence et. al., 1966).
The associations between the diagnosis of OA and intermittent pain in
females using all three methods were statistically significant for the
72
three joints shown (second DIP, third PIP and the CMC1 joint of the
right hand). In the DIP2 and the PIP3 joints, the difference in
association between OA and pain between the methods is not
statistically significant but in the CMC1 joint, however, the
association between osteoarthritis of the joint and pain is stronger for
radiography and clinical examination than for the photographic
method. This suggests that the methods perform similarly in
predicting DIP2 and PIP3 pain and that radiography and clinical
examination are better predictors of CMC1 pain than photographic
reading.
4.4 Advantages and limitations of this study
This study has several advantages. The study population consists of
elderly individuals who were living in the community rather than
from a clinical series. We developed a mini-atlas of photographs
illustrating grades that each reader could refer to as they read the
photographs. This contributed to a standardized approach to the
readings, and resulted in a grading scale that was shown to be reliable
between and within raters for all the individual joints.
On the other hand, this study has several limitations. Subjects were
elderly, with the youngest being 69 years old. The prevalence of hand
osteoarthritis in this age group is high. It would be interesting to
repeat this study using a middle- aged population.

73
We cannot completely rule out that there may some selection bias in
the subgroup used for the analysis of radiographic hand osteoarthritis,
due to the fact that radiographs were only available for about 400
individuals out of the 800 total participants of the AGES-Reykjavik
study during the spring of 2005. However, the subgroup is not
statistically different in composition from the rest of the participants
with regards to age, sex and BMI.
Our study on hand pain was based on self-reports and thus reflects
different forms of hand pain, including pain not related to
osteoarthritis. Also, the intensity of pain was not registered, only
given as present/absent. Further investigations are needed to clarify
the relationship of hand osteoarthritis and pain in the elderly.
Despite these limitations, this study gives valuable insight into hand
osteoarthritis and hand pain and their relationship in an elderly
population. The photographic scoring method has now already been
used in the whole AGES-Reykjavík Study with the discovery of
important associations between hand OA and atherosclerosis (Jonsson
et. al., 2009b) and thus the method appears to be a step forward in
osteoarthritis research.
74
5. REFERENCES
Acheson RM, Collart AB, Greenberg RH, Clemett AR. New Haven survey of joint disease. Photographs and other variables in screening for arthritis of the hands. Am J Epidemiol. 1969 Sep;90(3):224-35. Altman R, Alarcon G, Appelrouth D, Bloch D, Borenstein D, Brandt K et al. The American College of Rheumatology criteria for the classification and reporting of osteoarthritis of the hand. Arthritis Rheum. 1990 Nov;33(11):1601-10. Aspelund G, Gunnarsdottir S, Jonsson P, Jonsson H. Hand osteoarthritis in the elderly. Application of clinical criteria. Scand J Rheumatol. 1996;25(1):34-6. Bagge E, Bjelle A, Eden S, Svanborg A. Osteoarthritis in the elderly: clinical and radiological findings in 79 and 85 year olds. Ann Rheum Dis. 1991 Aug;50(8):535-9. Bellamy N, Sothern RB, Campbell J. Rhythmic variations in pain perception in osteoarthritis of the knee. J Rheumatol. 1990 Mar;17(3):364-72. Caspi D, Flusser G, Farber I, Ribak J, Leibovitz A, Habot B et al. Clinical, radiologic, demographic, and occupational aspects of hand osteoarthritis in the elderly. Semin Arthritis Rheum. 2001 Apr;30(5):321-31. Clohisy JC, Carlisle JC, Trousdale R, Kim YJ, Beaule PE, Morgan P et al. Radiographic evaluation of the hip has limited reliability. Clin Orthop Relat Res. 2009 Mar;467(3):666-75. Dahaghin S, Bierma-Zeinstra SM, Ginai AZ, Pols HA, Hazes JM, Koes BW. Prevalence and pattern of radiographic hand osteoarthritis and association with pain and disability (the Rotterdam study). Ann Rheum Dis. 2005 May;64(5):682-7.

75
Dahaghin S, Bierma-Zeinstra SM, Hazes JM, Koes BW. Clinical burden of radiographic hand osteoarthritis: a systematic appraisal. Arthritis Rheum. 2006 Aug 15;55(4):636-47. Davis MA. Sex differences in reporting osteoarthritic symptoms: a sociomedical approach. J Health Soc Behav. 1981 Sep;22(3):298-310. Ding H, Solovieva S, Vehmas T, Riihimaki H, Leino-Arjas P. Finger joint pain in relation to radiographic osteoarthritis and joint location--a study of middle-aged female dentists and teachers. Rheumatology (Oxford). 2007 Sep;46(9):1502-5. Egger P, Cooper C, Hart DJ, Doyle DV, Coggon D, Spector TD. Patterns of joint involvement in osteoarthritis of the hand: the Chingford Study. J Rheumatol. 1995 Aug;22(8):1509-13. Elliott AL, Kraus VB, Fang F, Renner JB, Schwartz TA, Salazar A et al. Joint-specific hand symptoms and self-reported and performance-based functional status in African Americans and Caucasians: The Johnston County Osteoarthritis Project. Ann Rheum Dis. 2007 Dec;66(12):1622-6. Fautrel B, Hilliquin P, Rozenberg S, Allaert FA, Coste P, Leclerc A et al. Impact of osteoarthritis: results of a nationwide survey of 10,000 patients consulting for OA. Joint Bone Spine. 2005 May;72(3):235-40. Felson DT. Epidemiology of hip and knee osteoarthritis. Epidemiol Rev. 1988;10:1-28. Haara MM, Manninen P, Kroger H, Arokoski JP, Karkkainen A, Knekt P et al. Osteoarthritis of finger joints in Finns aged 30 or over: prevalence, determinants, and association with mortality. Ann Rheum Dis. 2003 Feb;62(2):151-8. Harris TB, Launer LJ, Eiriksdottir G, Kjartansson O, Jonsson PV, Sigurdsson G et al. Age, Gene/Environment Susceptibility-Reykjavik

76
Study: multidisciplinary applied phenomics. Am J Epidemiol. 2007 May 1;165(9):1076-87. Hart D, Spector T, Egger P, Coggon D, Cooper C. Defining osteoarthritis of the hand for epidemiological studies: the Chingford Study. Ann Rheum Dis. 1994 Apr;53(4):220-3. Hart DJ, Spector TD. Definition and epidemiology of osteoarthritis of the hand: A review. Osteoarthritis Cartilage. 1995;8(Supplement 1):S2-S7. Haugen IK, Slatkowsky-Christensen B, Orstavik R, Kvien TK. Bone mineral density in patients with hand osteoarthritis compared to population controls and patients with rheumatoid arthritis. Ann Rheum Dis. 2007 Dec;66(12):1594-8. Helme RD, Gibson SJ. The epidemiology of pain in elderly people. Clin Geriatr Med. 2001 Aug;17(3):417-31, v. Hirsch R, Guralnik JM, Ling SM, Fried LP, Hochberg MC. The patterns and prevalence of hand osteoarthritis in a population of disabled older women: The Women's Health and Aging Study. Osteoarthritis Cartilage. 2000;8 Suppl A:S16-21. Hochberg MC, Lethbridge-Cejku M, Scott WW, Jr., Plato CC, Tobin JD. Obesity and osteoarthritis of the hands in women. Osteoarthritis Cartilage. 1993 Apr;1(2):129-35. Hunter DJ, Felson DT. Osteoarthritis. BMJ. 2006 Mar 18;332(7542):639-42. Jones G, Cooley HM, Bellamy N. A cross-sectional study of the association between Heberden's nodes, radiographic osteoarthritis of the hands, grip strength, disability and pain. Osteoarthritis Cartilage. 2001 Oct;9(7):606-11. Jonsson H, Eliasson GJ, Jonsson A, Eiriksdottir G, Sigurdsson S, Aspelund T et al. High hand joint mobility is associated with

77
radiological CMC1 osteoarthritis: the AGES-Reykjavik study. Osteoarthritis Cartilage. 2009a May;17(5):592-5. Jonsson H, Helgadottir GP, Aspelund T, Eiriksdottir G, Sigurdsson S, Ingvarsson T et al. Hand osteoarthritis in older women is associated with carotid and coronary atherosclerosis: the AGES Reykjavik study. Ann Rheum Dis. 2009b November 2009;68(11):1696-700. Kalichman L, Cohen Z, Kobyliansky E, Livshits G. Patterns of joint distribution in hand osteoarthritis: contribution of age, sex, and handedness. Am J Hum Biol. 2004 Mar-Apr;16(2):125-34. Kalichman L, Hernández-Molina G. Hand Osteoarthritis: An Epidemiological Perspective. Semin Arthritis Rheum. 2009;In Press, Corrected Proof. Kalichman L, Li L, Kobyliansky E. Prevalence, pattern and determinants of radiographic hand osteoarthritis in Turkmen community-based sample. Rheumatol Int. [Article]. 2009 Aug;29(10):1143-9. Kallman DA, Wigley FM, Scott WW, Jr., Hochberg MC, Tobin JD. New radiographic grading scales for osteoarthritis of the hand. Reliability for determining prevalence and progression. Arthritis Rheum. 1989 Dec;32(12):1584-91. Keefe FJ, Lefebvre JC, Egert JR, Affleck G, Sullivan MJ, Caldwell DS. The relationship of gender to pain, pain behavior, and disability in osteoarthritis patients: the role of catastrophizing. Pain. 2000 Sep;87(3):325-34. Kellgren JH, Lawrence JS. Radiological assessment of osteo-arthrosis. Ann Rheum Dis. 1957 Dec;16(4):494-502. Kellgren JH, Lawrence JS, Bier F. Genetic factors in generalized osteo-arthrosis. Ann Rheum Dis. 1963 Jul;22:237-55.

78
Kuettner KE, V.M. Goldberg Introduction. Kuettner KE, V.M. Goldberg, editor. Rosemont: American Academy of Orthopaedic Surgeons; 1995. Lachance L, Sowers M, Jamadar D, Jannausch M, Hochberg M, Crutchfield M. The experience of pain and emergent osteoarthritis of the knee. Osteoarthritis Cartilage. 2001 Aug;9(6):527-32. Lane NE, Nevitt MC, Genant HK, Hochberg MC. Reliability of new indices of radiographic osteoarthritis of the hand and hip and lumbar disc degeneration. J Rheumatol. 1993 Nov;20(11):1911-8. Lawrence JS, Bremner JM, Bier F. Osteo-arthrosis. Prevalence in the population and relationship between symptoms and x-ray changes. Ann Rheum Dis. 1966 Jan;25(1):1-24. Leveille SG, Zhang Y, McMullen W, Kelly-Hayes M, Felson DT. Sex differences in musculoskeletal pain in older adults. Pain. 2005 Aug;116(3):332-8. Linaker CH, Walker-Bone K, Palmer K, Cooper C. Frequency and impact of regional musculoskeletal disorders. Baillieres Clin Rheumatol. 1999 Jun;13(2):197-215. Manek NJ, Hart D, Spector TD, MacGregor AJ. The association of body mass index and osteoarthritis of the knee joint: an examination of genetic and environmental influences. Arthritis Rheum. 2003 Apr;48(4):1024-9. Manninen P, Riihimaki H, Heliovaara M, Makela P. Overweight, gender and knee osteoarthritis. Int J Obes Relat Metab Disord. 1996 Jun;20(6):595-7. Mannoni A, Briganti MP, Di Bari M, Ferrucci L, Serni U, Masotti G et al. Prevalence of symptomatic hand osteoarthritis in community-dwelling older persons: the ICARe Dicomano study. Osteoarthritis Cartilage. 2000;8 Suppl A:S11-3.

79
March LM, Bachmeier CJ. Economics of osteoarthritis: a global perspective. Baillieres Clin Rheumatol. 1997 Nov;11(4):817-34. Marshall M, Dziedzic KS, van der Windt DA, Hay EM. A systematic search and narrative review of radiographic definitions of hand osteoarthritis in population-based studies. Osteoarthritis Cartilage. 2008 Feb;16(2):219-26. Mejjad O, Maheu E. Therapeutic trials in hand osteoarthritis: A critical review. Osteoarthritis Cartilage. 1995;8(Supplement 1):S57-S63. Nisha JM, Deborah H, Timothy DS, Alexander JM. The association of body mass index and osteoarthritis of the knee joint: An examination of genetic and environmental influences. Arthritis Rheum. 2003;48(4):1024-9. Niu J, Zhang Y, LaValley M, Chaisson CE, Aliabadi P, Felson DT. Symmetry and clustering of symptomatic hand osteoarthritis in elderly men and women: the Framingham Study. Rheumatology (Oxford). 2003 Feb;42(2):343-8. Oliveria SA, Felson DT, Cirillo PA, Reed JI, Walker AM. Body weight, body mass index, and incident symptomatic osteoarthritis of the hand, hip, and knee. Epidemiology. 1999 Mar;10(2):161-6. Scott WWJ, Lethbridge-Cejku M, Reichle R, Wigley FM, Tobin JD, Hochberg MC. Reliability of Grading Scales for Individual Radiographic Features of Osteoarthritis of the Knee: The Baltimore Longitudinal Study of Aging Atlas of Knee Osteoarthritis. Invest Radiol. 1993;28(6):501. Sowers M. Epidemiology of risk factors for osteoarthritis: systemic factors. Curr Opin Rheumatol. 2001 Sep;13(5):447-51. Stern AG, Moxley G, Sudha Rao TP, Disler D, McDowell C, Park M et al. Utility of digital photographs of the hand for assessing the
80
presence of hand osteoarthritis. Osteoarthritis Cartilage. 2004 May;12(5):360-5. Unruh AM. Gender variations in clinical pain experience. Pain. 1996 May-Jun;65(2-3):123-67. Van Saase JL, Van Romunde LK, Cats A, Vandenbroucke JP, Valkenburg HA. Epidemiology of osteoarthritis: Zoetermeer survey. Comparison of radiological osteoarthritis in a Dutch population with that in 10 other populations. Ann Rheum Dis. 1989 Apr;48(4):271-80. Wilder FV, Barrett JP, Farina EJ. Joint-specific prevalence of osteoarthritis of the hand. Osteoarthritis Cartilage. 2006 Sep;14(9):953-7. Wilder FV, Hall BJ, Barrett JP. Smoking and osteoarthritis: is there an association? The Clearwater Osteoarthritis Study. Osteoarthritis Cartilage. 2003 Jan;11(1):29-35. Zhang Y, Niu J, Kelly-Hayes M, Chaisson CE, Aliabadi P, Felson DT. Prevalence of symptomatic hand osteoarthritis and its impact on functional status among the elderly: The Framingham Study. Am J Epidemiol. 2002 Dec 1;156(11):1021-7.
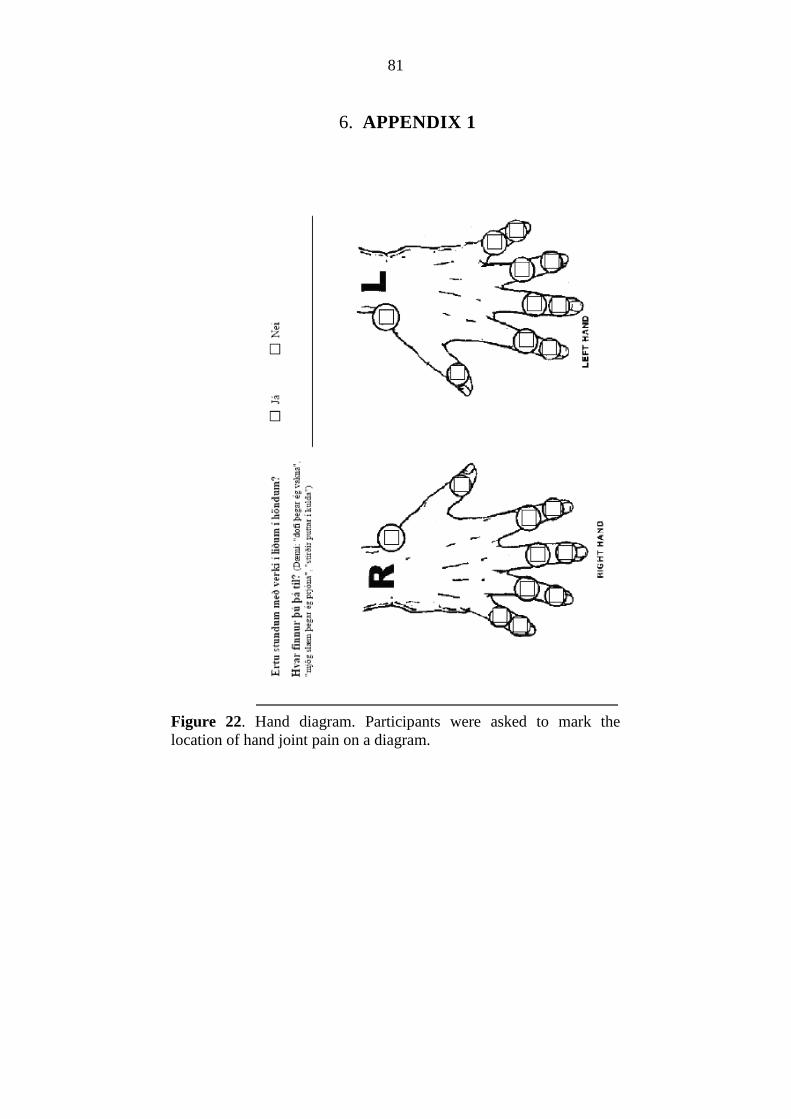
6.
Figure 22. Hand diagram. location of hand joint pain on a diagram.
81
APPENDIX 1
. Hand diagram. Participants were asked to mark the location of hand joint pain on a diagram.
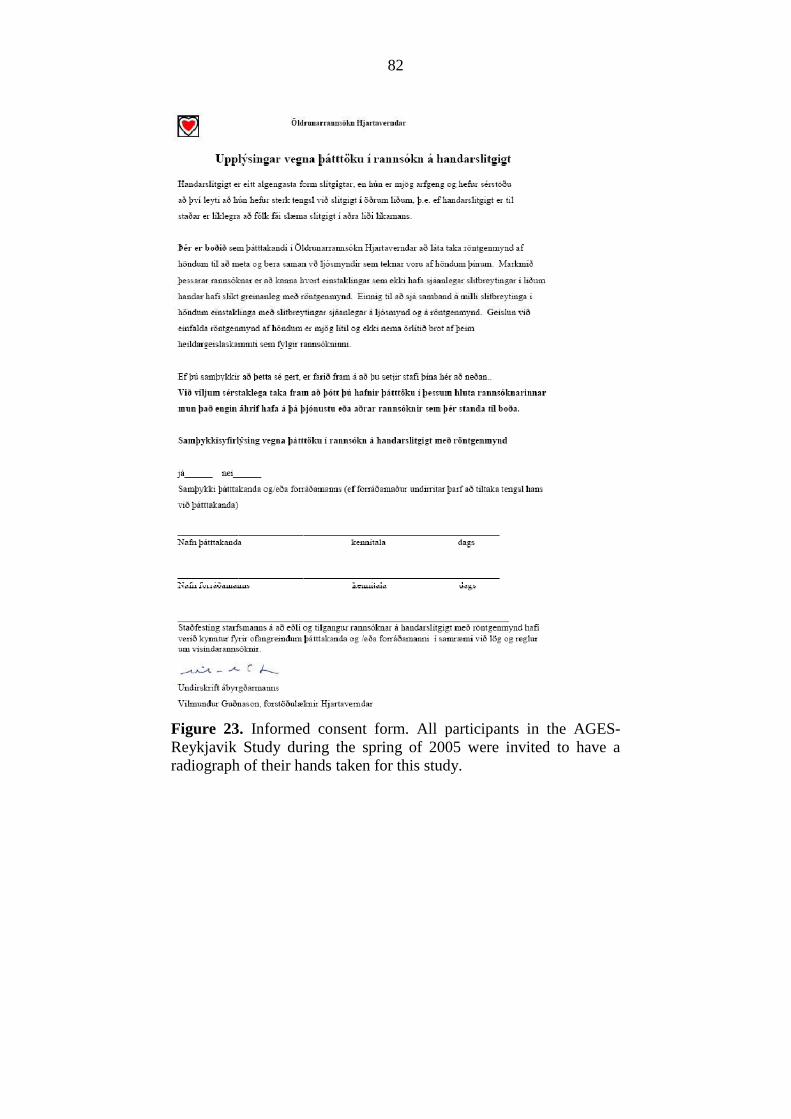
82
Figure 23. Informed consent form. All participants in the AGES-Reykjavik Study during the spring of 2005 were invited to have a radiograph of their hands taken for this study.

83