the use of derivatives trade repository data ... · the use of derivatives trade repository data:...
TRANSCRIPT

IFC-National Bank of Belgium Workshop on "Data needs and Statistics compilation for macroprudential analysis"
Brussels, Belgium, 18-19 May 2017
The use of derivatives trade repository data: possibilities and challenges1
Iman van Lelyveld, Netherlands Bank
1 This paper was prepared for the meeting. The views expressed are those of the author and do not necessarily reflect the views of the BIS, the IFC or the central banks and other institutions represented at the meeting.

The use of derivatives trade repository data: possibilities and challenges 1
The use of derivatives trade repository data: possibilities and challenges
Iman van Lelyveld1
Abstract
The EMIR derivatives data collected through trade repositories is coming to fruition. Given the scale of the reporting exercise and the complexity of the subject matter it has taken some time to develop but now the data is used in earnest in more and more institutions. It is potentially useful for both micro and macro prudential supervision as well as for producing statistics. In this paper, I first sketch these potential uses and then sketch how we are currently approaching the EMIR project at De Nederlandsche Bank.
Keywords: EMIR, derivatives reporting, trade repositories
Introduction
The 2008-2009 crisis made it abundantly clear that we did not have an accurate picture of risk concentrations in the global financial system. Reporting of exposures was mainly aggregated, on a consolidated basis, and confined within borders. This is now changing rapidly for many markets due to new reporting, although gaps remain (e.g. shadow banking). In many cases the new reporting allows for analysis based on individual transactions between two counterparties known by name. Often the frequency is such that analyses could potentially be done in real time.
A prime example of newly collected data is the reporting on derivatives – once one of the most opaque financial markets in the world which is in the process of becoming much more transparent. In 2009, G20 leaders committed to a requirement that all OTC derivative contracts be reported to trade repositories.2 In the EU, this G20 commitment is implemented in the European Markets Infrastructure Regulation (EMIR).3 Since 2014, counterparties resident in the EU (including CCPs) have been required to report the details of new and outstanding derivatives transactions to trade repositories. Whereas EMIR grants the ESRB and ESMA access to the full EU-wide dataset, Dutch competent authorities have access to those transactions where at least one of the counterparties is a Dutch resident or where the underlying is Dutch.4
1 Views expressed are those of the author and do not necessarily reflect official positions of De
Nederlandsche Bank. I would like to thank colleagues at DNB for their comments and Sanne Schimmel for her work on the network section. All remaining errors are mine.
2 See http://www.g20.utoronto.ca/2009/2009communique0925.html. It is part of 20 recommendations aiming to improve financial stability analysis (cf. Heath and Goksu (2013)). In the Netherlands these are at the moment CME, DTCC, Ice Trade Vault, Regis-TR, and UnaVista
3 See Art. 9 of EMIR (http://eur-lex.europa.eu/legalcontent/EN/TXT/?uri=CELEX:32012R0648).
4 See Art. 81(3) of EMIR (ibid).
2 The use of derivatives trade repository data: possibilities and challenges
This paper aims to cover two topics. First, we want to describe the potential uses the EMIR data can have at de Nederlandsche Bank (DNB). Secondly, we aim to describe our current two-track approach towards opening up the data source. We will briefly describe both aims below, starting with the data’s use at DNB. The EMIR trade repository (TR) data provides granular information on a daily frequency that can potentially inform many parts of a central bank with supervisory responsibilities such as DNB. The use of the data can broadly be classified in 1) checking the compliance with legal requirements following from EMIR, 2) microprudential supervisory questions, 3) macroprudential issues and 4) statistical uses. For the first, ascertaining legal requirements, the data could provide information on the timeliness of confirmations, revaluation and margining. The second area, microprudential questions, could for instance analyse the risk of an individual institution’s position. Given the scope of reporting, these institutions can be banks, pension funds, insurance firms or other (financial) firms of interest. The third use is in answering macroprudential questions. Here one could look at where risks flow in the system. Finally, the data could be used for producing national accounts or balance of payments statistics. The data could be used either to check the existing reporting or even to replace the current reporting altogether. We will describe our progress in this area and give examples of the analysis produced.
The second aim of the paper is to describe our current two-track approach to unlocking the data. On the one hand, we are taking a rigorous approach where we have first defined the Logical Data Model (LDM) for the ‘Activities’ report. It is currently being adapted for the ‘Trade State’ reports including the upcoming ESMA changes. Given the quality of submissions, a strict application of the LDM results in a very small data set. Using business rules, a data set of sufficient quality can nevertheless be constructed. To understand where quality could be improved most, we have built an application in SAS Visual Analytics and are working closely with the Dutch Authority for Financial Markets (AFM) to improve the data quality feedback loop with reporters.5
In parallel, we are also taking a more pragmatic approach where we process the files from just a single TR and asset class (i.e. DTCC Credit CDS) from December 1st
2015 onwards.6 In cleaning, we apply ’business rules’ such as making the spelling of country names compliant with ISO standard names. Strict application of the LDM would lead to dropping some otherwise compliant observations. We are also enriching the data with information from Legal Entity Identifier (LEI) registers, the Centralised Securities Data Base (CSDB), the Securities Holding Statistics (SHS), Bloomberg, and Datastream. This pragmatic approach allows us to already get acquainted with the data, suggest plausible business rules and provide relevant and timely analysis speaking to supervisory and policy questions.
Given the aims of the paper, the set-up is straightforward. I will first provide an overview of the existing work. Then we will discuss the potential uses of trade repository data followed by a section on the caveats. This brings us to the second part of the paper where I give a brief overview of how the EMIR project is progressing at DNB. Finally, I conclude.
5 In another effort to improve the feedback loop we organised a seminar at the end of 2015 entitled
“TR data: Sharing is Caring” and invited all parties involved in the reporting (trading firms, TRs, regulators and supervisors).
6 Stata is the main package used although part of the process is handled in R, Python and Gephi.
The use of derivatives trade repository data: possibilities and challenges 3
Overview of existing work
Analysing the trade repository data has been slow to take off but now shows a steady stream of papers being published. The stock of papers I am currently aware of includes the following. An early paper was published by Clerc et al. (2014) who look at the network structure of the European derivatives market. The ESRB has been very supportive of work in this area, coordinating efforts between National Competent Authorities (NCAs) and inviting academics to work on the data. This has resulted in several papers that look at the market as a whole (Peltonen et al. (2014), Abad et al. (2016)). In addition, there are a number of topical papers on for example the Greek crisis, the transfer of risk, compression, and the structure of the interest rate swap market (See Hal aj et al.(2016), D’Errico et al. (2016), D’Errico and Roukny (2017), and Fiedor et al. (2017), respectively). Some NCAs have been very active as well, in particular the Bank of England. This had led to contributions focussing on for example the structure of the market, counterparty credit risk and the de-pegging of the Swiss Franc (Ali et al. (2016), Benos et al. (2013), Benos et al. (2016), Morrison et al. (2016), and Cielinska et al. (2017)). The Deutsche Bundesbank is quite active in this field as well (Gehde-Trapp et al. (2015), Gu¨ndu¨z et al. (2016), and Gündüz (2016)). Another noteworthy paper is Kenny et al. (2016). In this analysis the use of derivatives by Irish SPVs is examined.
Since the Dodd-Frank act in the US mandates a very similar reporting framework, several recent publications make use of trade repository data as well. For example, Cetina et al. (2016) and Paddrik et al. (2016) use CDS data to look at counterparty concentration and systemic risks, respectively. Iercosan and Jiron (2017) look at the value of trading relationships.
Since the trade repository data include the names of the counterparties, it consequently has the drawback that access is restricted for academic researchers. Some researchers have therefore turned to the information in DTCC’s Trade Information Warehouse. This has for instance resulted in an excellent job market paper by Siriwardane (2015). Finally, there is a wealth of data in the ESMA reporting on EMIR progress (ESMA (2015a), ESMA (2015b)).
Potential use of the trade repository data
The trade repository data can be used in many areas relevant for supervisors, regulators and central banks. We will discuss applications in the area of micro prudential, macro prudential and statistics in turn.
Using one reporting framework to answer different data needs is part of a wider trend. Traditionally, authorities reacted to information demands by designing forms with a precise structure and definitions. These definitions were fit-for-purpose – because they for instance matched a particular regulatory or accounting framework – but were often very inflexible and had little regard for other data needs. Data from different reports are thus difficult to reconcile. Also, if a slightly different question arises, costly new reporting is required. By collecting data on a much more granular level, it is potentially possible to aggregate the data in multiple ways and thus flexibly answer several data questions with just one report. The flexibility comes with a cost: the compiler of the data needs to have a much deeper understanding of the

4 The use of derivatives trade repository data: possibilities and challenges
aggregation process and the resources to compile the data as well. Furthermore, there needs to be a discussion on standardisation of financial records keeping and on where the optimal collection point of the data is. It is clear, however, that in the long run we will be relying on more granular data that is collected closer to the source.
Micro prudential
From a micro-prudential regulation perspective, the TR data provide a wealth of information on a frequent basis. For those parts of the supervised firm that operate in the European Area, all transactions - including intragroup - need to be reported.
Derivative contracts are often non-linear and hence the value of a position can fluctuate drastically. To asses a firm’s position thus requires frequent updates on the value of the exposures.
To accurately assess the net risk, more information is needed. For one, to mitigate the impact of a possible default, counterparties exchange margin aiming to reduce the exposure as much as possible. Often the required margin is computed based on the net value of a portfolio of positions (netting set). A proper assessment of real exposures thus requires information on what has been legally agreed to as netting sets. The TR reporting does include the type of information to come to a comprehensive assessment although further work is needed in matching the TR positions with those reported in prudential reporting. Moreover, many derivative positions are used to hedge other risks such as credit or interest rate risk on loans. The derivative portfolio should thus be assessed jointly with other positions. For example, to assess interest rate risk we could start with linking the bond portfolio information reported in the ESCB Securities Holdings Statistics with the TR data.
Macro prudential
One of the key motivations for the G20 to push for more comprehensive reporting on derivatives was that due to the global and over-the-counter nature of this market, no single authority had a proper understanding of the structure of the market. This made it difficult to assess the macro risk. A macro risk is for instance the risk of an individual institution being too systemic. The insurer AIG is a case in point. Alternatively, it can also emerge because a group of firms act in a very similar way. Such herding can lead to unpredictable overreactions. In both cases we need a better understanding of the structure of the market.
An empirical argument for why the structure of the market matters is provided by Morrison et al. (2016). The authors argue that market participants price the counterparty risk. That is, firms hit by a negative shock can charge less for protection sold. Intriguingly, participants charge a risk premium for a risk they cannot readily observe. This means that shocks to the creditworthiness of key players will affect the price of risk, charged to financials but also to the real economy.
Another example is given by D’Errico et al. (2016). This paper traces out how risk is sold into the market, intermediated by big dealer banks and then absorbed by other market players. This is exactly how textbooks see the role of derivatives: risk is being redistributed to those willing to bear it. With the current reporting set we can now see who the parties are that are providing credit risk insurance to the market. If these parties have sufficient buffers, then this will not pose any a risk to the system.

The use of derivatives trade repository data: possibilities and challenges 5
However, if buffers are too low or providers are politically connected making a bailout more likely, this might not be a stable situation.
Finally, Paddrik et al. (2016) provide a macro perspective on the distribution of stress through margin calls. In their paper, the authors apply the US prudential stress test scenario (CCAR) to the value of the derivative portfolio in the system. They then analyse how margin requirements would be redistributed. Interestingly they find that those firms most exposed are not necessarily the core firms.
Using the Dutch credit derivative data, we have examined the structure of the Dutch market as well. Figure 1 plots the relations amongst all counterparties in the data. This network has a core-periphery structure with several large banks in the core similar to the interbank market (cf. in ’t Veld and van Lelyveld (2014)). Interestingly there is also a Other Financial Intermediary quite important in the in core. The structure is relatively stable over time.
Figure 1: The network structure of the Dutch CDS market
Statistics
There is a growing recognition that collecting micro data can improve and complement traditional ways of constructing (macro) statistics (Tissot, 2016). A key challenge is the aggregation from micro to macro. Financial transaction reporting has generally been set up for a different purpose and hence has definitions that might be different from those used in statistics. Also, since the data is at the level of individual entities (or even natural persons), data sharing can be very sensitive and is usually protected by quite restrictive rules. Notwithstanding these issues, trade repository information can be potentially useful in cross-checking or even replacing existing reporting exercises. This holds for both statistics on financials flows (“Flow of Funds”) as well as for positions (“National Accounts”). For both the stock and flow terms, the micro data has to be consistent not just on the national level but also internationally. For both we thus need a broad coverage and the location of the ultimate owner which the TR data provide. However, the TR data were set up to monitor trading relations and hence do not have the ultimate owner information embedded. Using group information the legal entity level reporting (i.e., LEI) can be aggregated to various definition of what constitutes a group (See the box).
6 The use of derivatives trade repository data: possibilities and challenges
Other statistical reporting, for example on the activities of less or nonregulated parts of the financial system can also benefit from TR information. For example, special purpose vehicles in Ireland are keen users of derivatives. Kenny et al. (2016) use TR data for an analysis of this sector and identify SPVs who are net sellers of CDS contracts with linkages to regulated, non-domestic monetary financial institutions (MFIs). Overall, the authors note that their analysis “points to the importance of access to good quality micro-level regulatory data when monitoring financial stability risks”.
The importance of consolidation
A major challenge in the use of data that is reported on the individual legal entity is its relationship with the data of other related firms. A firm might for instance own (part of) another firm or conversely be owned. Such ownership relations might be reflected or not (i.e. consolidated versus solo). Although the Legal Entity Identifier (LEI) should uniquely identify the firm, it currently does not record the ultimate owner structure although this is envisaged in the future.a The relationship data will allow for combining groups of firms according to particular views. This could be 1) an accounting view, 2) a prudential regulatory view, 3) a counterparty credit risk (CCR) view or 4) the resolution authority view. The first two views are the firm as it is defined by the accountant or the regulator. The third, the CCR view is the view taken by the counterparty of the group. The difference with the accounting view is that the counterparty might for instance judge that a securitisation vehicle will come back on the balance sheet and hence the effective consolidation perimeter would be different. Finally, the resolution authority might carve out some parts of the firm that are within its jurisdiction. It would therefore delineate the firm differently. With a well-maintained dynamic database of granular ownership data, users can generate their own group definition whenever needed. The same reporting can then be used to generate different views.
a The GLEIF is currently finalising, in consultation with LEI Issuers, the technical specifications for recording
relationship data, which will start being implemented in early 2017. It is expected that all LEI Issuers will
have developed the capacity to record relationships with direct and ultimate parents as defined in the
report (cf LEI ROC (2016)).
Caveats
TR reports are relatively new and have yet to be used to their full potential. As with any new reporting framework there are flaws in reporting that need to be addressed. Since the start of reporting, ESMA has undertaken various steps to improve the data collection, also as part of ESMAs data quality action plan. In particular, ESMA is involved in on-going TR supervision, provides regular updates of Questions and Answers (Q&As), and now enforces validation rules implemented by TRs (Level 1 and Level 2 validations). All of this has contributed to gradual improvements in data quality.
The use of derivatives trade repository data: possibilities and challenges 7
Some of the shortcomings will be addressed by the Regulatory Technical Standard (RTS) coming into force on November 1st 2017.7 For instance, in reporting an index derivative, the composition of the index currently does not have to be disclosed. For bespoke baskets this might be defensible but if the index is a widely used benchmark (e.g., the S&P 500), it would seem quite informative if reporters indicate the relevant underlying benchmark. Another example is that it is currently not possible to link individual components of a complex derivative. End-users thus see several transactions, without knowing that they are a part of one (complex) derivative. The new reporting regime introduces the field “Complex trade component ID” which can be used to identify all the observations that should be evaluated jointly.
Tackling the EMIR repository data at DNB
The second aim of the paper is to describe our current two-track approach to unlocking the data: one the one hand a rigorous approach, handling EMIR as a regular statistical resource, and on the other a more pragmatic exploratory approach. EMIR fits into a more general development at DNB which aims to make our supervision and policy work more data-driven. It also fits in the trend – discussed above in Section 3.3 – of moving away from the single form and single purpose reporting to comprehensive granular reporting to be used for multiple objectives.
At the same time, on-boarding the EMIR data is a daunting task with little in terms of low hanging fruit at first. Three aspects of the data are particularly problematic: 1) the lack of a natural owner, 2) the size of the data, and 3) the complexity of the subject matter.
First, there is no natural owner for TR-data. The data does not cover a particular sector, nor does it neatly follow the prudential / conduct-of-business split and hence there is not one business area that is clearly best placed to take ownership. And at DNB – as will be common in many institutions – a data sets needs an ultimate owner who is willing to organise budget and wants to overcome hurdles. To address this issue, we have set up a group of owners from across the bank. This group now jointly decides on things such as access rights and Business Intelligence (BI) tooling.
Second, the size of data coming in is daunting. Figure 2 shows the number and volume of zipped files currently available. In the top-left panel we see that total volume currently stands at 160 GB, growing at roughly 900 MB a day. With a compression factor of about 80% this translates into 800 GB in raw csv files. Since the data quality is at places rather poor it is difficult to reduce the volume through clever database management. The other panels in Figure 2 show the files by trade repository where each of the colours indicates a different type of files (based on the naming convention used). Clearly repositories use different names, change the names occasionally, provide just a few or many files and sometimes misreport (leading to spikes in reporting volume).
Finally, complexity. Derivatives are not easy to value. The current value is determined by a myriad of factors such as the volatility of the underlying, the length of the contract, the credit worthiness of the protection seller, margins exchanged and
7 See https://www.esma.europa.eu/convergence/guidelines-and-technical-standards for a full
description of the changes in the RTS.

8 The use of derivatives trade repository data: possibilities and challenges
so on and so forth. Nevertheless the EMIR reporting framework can potentially provide many of the building blocks to come to a proper evaluation. For instance, we should be able to come to gross notional positions for all participants. Assuming we can always net on the same underlying, we can also come to net positions. Going one step further we could even take an educated guess at real net positions. Where things become more complicated is for instance in reported mark to market values. Counterparties do not necessarily have to agree on these. However, the values should be in the same ballpark. Big discrepancies can indicate a failure of risk management of at least one of the counterparties.
Figure 2: The volume of files
The high road
The first of our two parallel tracks is taking a rigorous approach where we first define a Logical Data Model (LDM) for the ‘Activities’ report. Such a model, shown in Figure 3, describes in detail the aspects of each data point submitted and can be used to assess the quality of the submissions. Currently we are drawing up the data model for the ‘Trade State’ reports. In addition, we will be adapting the model to account for the upcoming ESMA changes. Given the quality of submission, a strict application of the LDM does not result in anything useful.
To understand where the quality could be improved most, we have built an application in SAS Visual Analytics (screenshot in Figure 4). In this application it is possible to see the number of errors the data generates. It is also possible to drill down into the quality for a particular reporter or underlying ISIN. We are working closely together with the Dutch Authority for Financial Markets (AFM) to improve the data quality feedback loop with reporters.

The use of derivatives trade repository data: possibilities and challenges 9
Figure 3: Logical Data Model for TR reporting
Available on request: [email protected]
Figure 4: Data quality dashboard
EMIR Analysis group
In parallel, we are also taking a more pragmatic approach where we process the files from just a single TR and asset class (i.e. DTCC Credit CDS) from December 1st 2015 onwards.8 Given our very limited resources, we decided to focus on this single slice but write our code flexibly so that it should in principle be able to handle other asset classes and TRs.
In cleaning we apply ’business rules’ such as making the spelling of country names compliant with ISO standard names. Daily currency rates sourced from the ECB are used to denominate all amounts in euro. We are also enriching the data with information from LEI registers, the Centralised Securities Data Base (CSDB), the Securities Holding Statistics (SHS), Bloomberg, and Datastream. This pragmatic approach allows us to already get acquainted with the data, suggest plausible business rules and provide relevant and timely analysis speaking to supervisory and policy questions.
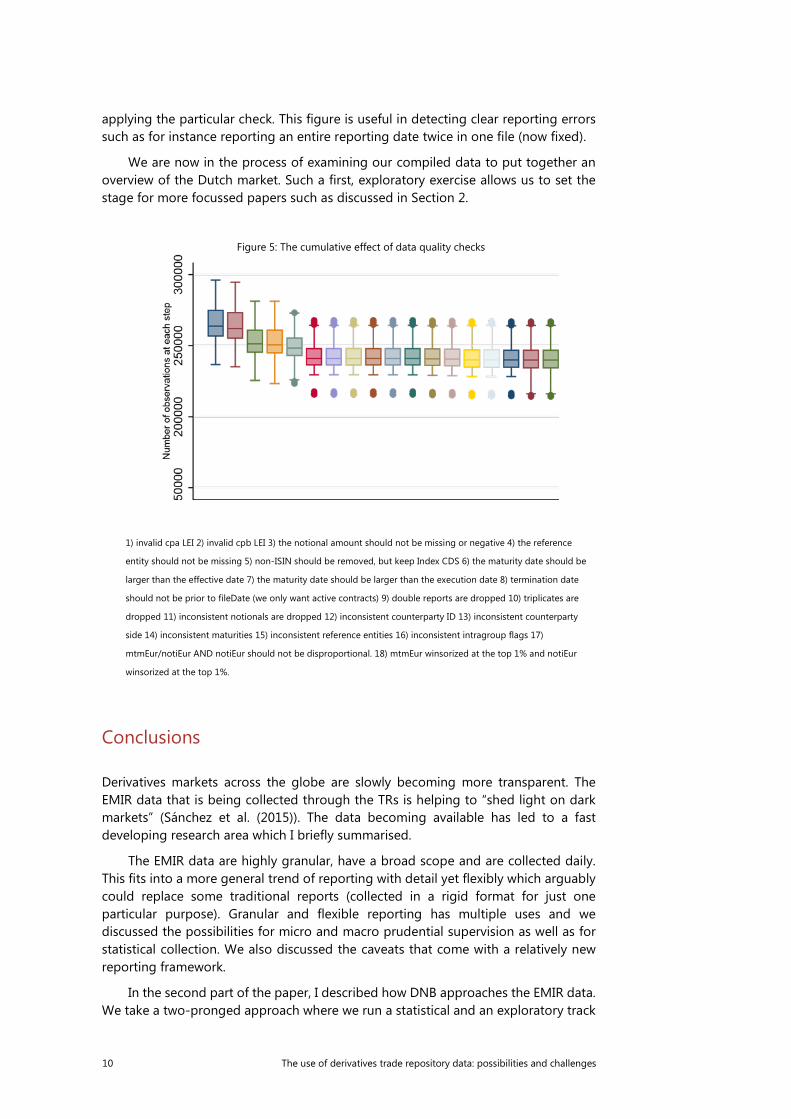
We apply a complete set of data quality checks to DTCC credit trade state reports between December 1st 2015 and all of 2016. For each of the steps (documented below the figure), Figure 5 shows the distribution of remaining observations after the
8 Stata is the main package used although part of the process is handled in R, Python, Ox and Gephi.
We would be very happy to share our Stata code with competent authorities to promote cooperation in terms of coding.
10 The use of derivatives trade repository data: possibilities and challenges
applying the particular check. This figure is useful in detecting clear reporting errors such as for instance reporting an entire reporting date twice in one file (now fixed).
We are now in the process of examining our compiled data to put together an overview of the Dutch market. Such a first, exploratory exercise allows us to set the stage for more focussed papers such as discussed in Section 2.
Figure 5: The cumulative effect of data quality checks
1) invalid cpa LEI 2) invalid cpb LEI 3) the notional amount should not be missing or negative 4) the reference
entity should not be missing 5) non-ISIN should be removed, but keep Index CDS 6) the maturity date should be
larger than the effective date 7) the maturity date should be larger than the execution date 8) termination date
should not be prior to fileDate (we only want active contracts) 9) double reports are dropped 10) triplicates are
dropped 11) inconsistent notionals are dropped 12) inconsistent counterparty ID 13) inconsistent counterparty
side 14) inconsistent maturities 15) inconsistent reference entities 16) inconsistent intragroup flags 17)
mtmEur/notiEur AND notiEur should not be disproportional. 18) mtmEur winsorized at the top 1% and notiEur
winsorized at the top 1%.
Conclusions
Derivatives markets across the globe are slowly becoming more transparent. The EMIR data that is being collected through the TRs is helping to “shed light on dark markets” (Sánchez et al. (2015)). The data becoming available has led to a fast developing research area which I briefly summarised.
The EMIR data are highly granular, have a broad scope and are collected daily. This fits into a more general trend of reporting with detail yet flexibly which arguably could replace some traditional reports (collected in a rigid format for just one particular purpose). Granular and flexible reporting has multiple uses and we discussed the possibilities for micro and macro prudential supervision as well as for statistical collection. We also discussed the caveats that come with a relatively new reporting framework.
In the second part of the paper, I described how DNB approaches the EMIR data. We take a two-pronged approach where we run a statistical and an exploratory track
The use of derivatives trade repository data: possibilities and challenges 11
in parallel. The former aims to on-board the data as a fully fledged statistical resource. This is a rigorous process with the emphasis on traceability, reproducibility, and dependability. Obviously this is a resource intensive and thus – given budget restrictions – a slow process that in itself does not provide any insights into the trends and risks in the market. Therefore we also take a more pragmatic approach where we start with a limited scope, explore the data and then fix problems along the way. Naturally this process is coded and thus no less rigorous. But, for instance, reproducing the analysis for another TR requires a deeper understanding of the code and manual updating of auxiliary data such as for example exchange rates. The clear advantage is that it provides insights much faster. Moreover, the blemishes in the data identified along the way are helpful in the first statistical track.
In the coming year we aim to on-board both the “Flow” and the “Trade State” reports. The former will be used to assess the data quality while the latter is more useful in risk analysis. Hopefully we can make progress in understanding how to match them up. With both types of reports on our statistical platform, access, performance and thus ultimately the analysis will be much improved.
References
Abad J, Aldasoro I, Aymanns C, D’Errico M, Rousová LF, Hoffmann P, Langfield S, Neychev M, Roukny T. Shedding light on dark markets: First insights from the new EU-wide OTC derivatives dataset. ESRB Occasional Paper 2016;11.
Ali R, Vause N, Zikes F. Systemic risk in derivatives markets: a pilot study using CDS data. Bank of England Financial Stability Paper 2016;38.
Benos E, Richard Payne , Michalis Vasios . Centralising trading in the interest rate swap markets: The impact of Dodd-Frank. Bank of England Staff Working Paper 2016;580.
Benos E, Wetherilt A, Zikes F. The structure and dynamics of the UK credit default swap market. Financial Stability Paper 2013;25.
Cetina J, Rajan S, Paddrik M. Stressed to the Core : Counterparty Concentrations and Systemic Losses in CDS Markets. OFR Working Paper 2016;.
Cielinska O, Joseph A, Shreyas U, Tanner J, Vasios M. Gauging market dynamics using trade repository data: The case of the Swiss franc de-pegging. Bank of England Financial Stability Paper 2017;41.
Clerc L, Gabrieli S, Kern S, Omari YE. Monitoring the European CDS Market through networks: Implications for contagion risks. ESMA Working Paper 2014;1.
Committee LEIO. Collecting data on direct and ultimate parents of legal entities in the Global LEI System Phase 1. 2016. URL: http://www.leiroc.org/ publications/gls/lou_20161003-1.pdf.
D’Errico M, Battiston S, Peltonen T, Scheicher M. How does risk flow in the Credit Default Swap market?, 2016.
D’Errico M, Roukny T. Compressing over-the-counter markets. Mimeo 2017;.
ESMA . EMIR Review Report no . 1: Review on the use of OTC derivatives by non-financial counterparties 2015a;(1).
12 The use of derivatives trade repository data: possibilities and challenges
ESMA . EMIR Review Report no . 4: ESMA input as part of the Commission consultation on the EMIR Review 2015b;(4).
Fiedor P, Lapschies S, Orszaghova L. Networks of counterparties in the centrally cleared EU-wide interest rate derivatives market 2017;.
Gehde-Trapp M, Gündüz Y, Nasev J. The liquidity premium in CDS transaction prices: Do frictions matter? Journal of Banking and Finance 2015;61:184– 205.
Gündüz Y. Mitigating Counterparty Risk. Working Paper 2016;.
Gündüz Y, Ongena S, Tümer-Alkan G, Yu Y. CDS and Credit : Testing the Small Bang Theory of the Financial Universe with Micro Data. Working Paper 2016;.
Halaj G, Peltonen TA, Scheicher M. How Did the Greek Credit Event Impact the Credit Default Swap Market ? Journal of Financial Stability 2016.
Heath R, Goksu E. Why are the G-20 Data Gaps Initiative and the SDDS Plus Relevant for Financial Stability Analysis? IMF Working Paper 2013;WP/13/6.
Iercosan D, Jiron A. The Value Of Trading Relationships and Networks in the CDS Market. Working Paper 2017;.
Kenny O, Killeen N, Moloney K. Network analysis using EMIR credit default swap data: Micro-level evidence from Irish domiciled special purpose vehicles (SPVs). Working Paper 2016;:1–20.
Morrison A, Vasios M, Wilson M, Zikes F. Identifying Contagion in a Banking Network. Working Paper 2016;.
Paddrik M, Rajan S, Peyton Young H. Contagion in the CDS Market. OFR working paper 2016;.
Peltonen T, Scheicher M, Vuillemey G. The network structure of the CDS market and its determinants. Journal of Financial Stability 2014;13:118– 33.
Sánchez JA, Hoffmann P, Langfield S., Mining for gold : Unearthing macro-prudential treasures in the new EU-wide transactions-level derivatives (’EMIR’) data. Mimeo 2015;(August).
Siriwardane EN. Concentrated Capital Losses and the Pricing of Corporate Credit Risk. Job Market Paper 2015.
Tissot B. Development of financial sectoral accounts. Irving Fisher Committee on Central Bank Statistics Working Papers 2016;15.
in ’t Veld D, van Lelyveld I. Finding the Core: Network Structure in Interbank Markets. Journal of Banking & Finance 2014;49:27–40.