the use of computers and technology increase student achievement and · pdf file ·...
TRANSCRIPT

114
The Use of Computers and Technology Increase Student Achievement and Improve Attitude
The Use of Computers and Technology Increase Student Achievement and Improve Attitude
El uso de computadoras y tecnología para aumentar el logro estudiantil y mejoramiento de la actitud.
Bonaveri, Pablo Daniel,
Blanco, Luis Simón.
Calvo, Marcos Julio.
Cepeda, Gilberto
Master of Science Buffalo State University, New York, Doctor of Mechatronics, Major in Mechatronics Systems. Atlantic. International University. Haway. Docente Investigador Uniautónoma, [email protected]
Master of Science, in Multidisciplinary Studies for International Educators, Buffalo State University. State of New York. USA, Docente en el Área de Tecnología [email protected]
Master of Science, in Multidisciplinary Studies for International Educators. Buffalo State University. State of New York. USA, Ingeniero de entrenamiento de Relianz Mining Solutions
Master of Science, in Multidisciplinary Studies for International Educators. Buffalo State University. State Of New York. USA Catedrático en la Escuela Normal Superior del Distrito de Barranquilla [email protected]
Recibido: Abril 8 de 2015Aprobado: Mayo 21 de 2015
ABSTRACT
This report describes how the use of technology helps lessons run smoothly for teacher and stu-dents during the first semester of 2007, with a particular focus on the use of computer technology to improve academic achievement. Is based on observations of pretests, Likert scales, posttests, and statistical analysis with certain classrooms which were chosen previously by teachers who made this project. Demographics are as follows:Age Range: 17 to 19 (12th grade)/16 to 17 (10th grade), Sex Distribution: M & F, Ethnic Break-down: mixed Hispanic, White, Colombian students. Location: Barranquilla, Colombia, SA, Other important characteristics (attach additional sheets as necessary ) most students are from upper middle class families in Colombia. With the following design: Pre Test -Treatment- Pos-ttest The investigation revealed that technology had a positive impact on the students because their level of motivation and performance grew up consistently. Because of available amount of compu-ters at the school was not enough, students used simulators through internet at home, reducing the teacher’s supervision, and the amount of time dedicated to the web page (with the simulator) by each student was not the same.
Key words: Technology. Computers. Achievement. Attitude.
Para citar este artículo: Bonaveri P., Blanco, L& Calvo, M. Cepeda G. ( 2015)The Use of Computers and Technology Increase Student Achievement and Improve Attitude, Escenarios Vol 13 No 2, p,p.114-134
DOI: http://dx.doi.org/10.15665/esc.v13i2.603

115
Escenarios • Vol. 13, No. 2, Julio - Diciembre de 2015, págs.The Use of Computers and Technology Increase Student Achievement and Improve Attitude 114-134
RESUMEN
Se analiza, cómo el uso de la tecnología ayudo a los profesores y sus estudiantes durante el primer semestre de 2007, para el aprendizaje de ciertas lecciones, con un enfoque particular en el uso de la tecnología informática para mejorar el rendimiento académico. Se basa en las observaciones de las evaluaciones preliminares, escalas Li-kert, evaluaciones posteriores y análisis estadístico con ciertos salones de clase que fueron elegidos previamente por profesores que hicieron este proyecto. Datos demográficos son los siguientes: rango de edad: 17 a 19 (grado 12) / 16 a 17 (décimo grado), distribución del sexo: Masculino y femenino, Mixto hispano, blanco, estudiantes colombianos. Ubicación: Barranquilla, Colombia, S.A, otras características importantes (Adjunte hojas adicio-nales si es necesario) mayoría de los estudiantes provienen de familias de clase media superiores en Colombia. Con el siguiente diseño: Pre Test - Treatment -Post test. La investigación reveló que la tecnología ha tenido un impacto positivo en los estudiantes, debido a que su nivel de motivación y el rendimiento creció constantemente. Debido a que la cantidad de computadores disponibles en el colegio no fue suficiente, los estudiantes utilizaron simuladores de internet en sus casas, esto redujo la supervisión del profesor y la cantidad de tiempo dedicado a la página web (con el simulador) por cada estudiante no fue la misma.
Palabras Clave: Tecnología. Computador. Logro. Actitud.
INTRODUCCIÓN
Not all teachers feel comfortable using new te-chnologies of communication and information inside the classroom, developing lessons and evaluating students’ skils.
Especially for difficult subject-areas such as ours: physics, chemistry and math. Because of this, we decided to form a multidisciplinary group invol-ving computer technology, Science and Math.
Taking into account all limitations that we have (resources, technological support provided by the school, own educational background) as well as mayor part of time students must be working lonely, we chose some simulators through regar-ding topics which were identified as critical is-sues of each particular subject.
All of these represent obstacles for students’ learning and motivation, and also for getting be-tter results from them.
As we know, we are living in a constant progress of technological development in which the use of technology is essential to be adopted into changing world.
Based on this, we are pursing more engagement in all students, using simulators in web pages in which there are applied important concepts worked on class.
Using technology in education is no longer a “new” idea. Since technology has grown and been introduced to the society, it is very im-portant to integrate its use in education. As an instructional tool, it offers a great variety of in-formation and skills required to succeed in life. Also it is a motivational tool that helps students to develop attitudes and skills toward learning, self-esteem, and self-confidence.
Today’s technology provides teachers and stu-dents a great variety of opportunities for tea-ching and learning that are impossible to use with traditional methods; in fact, the use of com-puter technology goes beyond assisted instruc-tion in the form of tutorials in which students interact with computers to learn knowledge and skills that allow then build reports, that include graphs, photos, tables, etc., of great appearance and quality.
“There are many factors that make computers a cog-nition tool” (Nogueira, 2003)
REVIEW OF LITERATURE & RESEARCH QUESTION:Article Summary Sheet - Use Google Scholar to locate articles
Name of Article: The tutorial benefits of on-line assignments: MasteringPhysics in first year phy-sics at the University of Sydney

116
The Use of Computers and Technology Increase Student Achievement and Improve Attitude
Author: John O’Byrne and Richard Thompson. School of Physics, University of Sydney. [email protected]. [email protected]
Source: MasteringPhysics, CyberTutor.Research Question? How well do the assign-ments generate good quality learning activity?Sample? The MasteringPhysics system was trialled at the University of Sydney during second semester
of 2004 in the PHYS 1003 (Technological) unit of study. This group of approximately 250 stu-dents, mostly from science and engineering de-grees, was chosen because problem solving is an important aspect of their course. Importantly, these students had already completed one se-mester of physics using the paper-based assign-ment system. They could therefore comment on the relative merits of the two systems from the students’ perspective (O’Byrne, 2004). (Table 2)Results?
Table 2. Student ratings of the helpfulness os MasteringPhysics in problem solving in physics and understanding of concepts in physics
Figure 1. Final overall results in the unit of study for students who thouht MasteringPhysics (a) helped and (b) did not help their understanding of concepts of physics.
Figure 2. Comparison of MasteringPhysics as-signment mark and Examination mark for the
PHYS 1003 class in 2004
Figure 3. Percentage of students attempting some non-complusory questions from book
chapters covered by MasteringPhysics

117
Escenarios • Vol. 13, No. 2, Julio - Diciembre de 2015, págs.
Implications according to author:
As described earlier, the attractions of Masterin-gPhysics (http://www.njctl.org/?gclid=CPTlq-bbV8sgCFc-RHwodgqUE5Q) as a teaching aid centred on its ability to deliver timely and tar-geted feedback to the students doing the assig-nments. The system of hints and the immediate feedback was generally popular with students:‘Yes, the feedback and hints assist you in the ri-ght direction and knowing that your answer is incorrect right away and getting a second chance is really, really good.’From a technical point of view, MasteringPhy-sics performed well and most students adapted to it without many problems.
Table 3 illustrates our rating of the effectiveness of MasteringPhysics in the Trial against the same scale used for paper-based assignments in Table 1. Once again these are our perceptions, althou-gh in this case based on student feedback. Com-parison with Table 1 emphasizes our positive view of the effectiveness of MasteringPhysics.
There were losses in going from paper-based assignments to MasteringPhysics. Short answer questions cannot be marked by the system. Group work that our paper-based assignments encourage (in principle) is perhaps discouraged (also in principle) by students working through the MasteringPhysics questions under their own login name. Students particularly noted the loss
of the close alignment between questions in the paper-based assignments and those in the final examination. The ‘Skill Builder’ questions used in MasteringPhysics are indeed different, but the other problems are conceptually similar to examination questions. However only the ‘End of Chapter’ questions, used for a few Masterin-gPhysics questions, are like examination ques-tions in providing no feedback. Does this reflect an assessment-driven attitude where the stu-dents use the feedback simply to complete the assignment questions and don’t see assignment questions as learning?
An assessment-driven approach to learning is also suggested by the very low usage of optional tutorial questions. This is not a change however, since only a few students ever find the time to do extra questions. With most students doing some paid work alongside their university and social commitments, making time for anything beyond assessment tasks is always an issue. Usage of MasteringPhysics beyond the compulsory assig-nments may be easier to encourage if students use it from the start of their university physics career, as has happened in 2005.
Disappointingly, the adoption of MasteringPhy-sics did not make a perceptible change in the performance of students in the final examina-tion, although this is hard to establish without using a standard examination. This lack of im-pact occurred despite MasteringPhysics offering
Table 3. Staff ratings of the effectiveness of MasteringPhysics ssignments in promoting studen learning
114-134

118
The Use of Computers and Technology Increase Student Achievement and Improve Attitude
students a clearly better educational approach than the previous paper-based assignments. We suggest that the students’ assessment-dri-ven approach to learning did not allow them to take real advantage of the system, in particular by using questions beyond the compulsory as-signment. We need to use MasteringPhysics en-courage a new attitude among the students. We need to sell it better and have attempted to do that in a wider implementation of the system in first semester 2005.
Name of Article: Online homework: Does It Make a Difference?Author: Scott Bonham and Robert Beichner. Department of Physics, North Carolina State University, Box 8202, Raleigh, NC 27695Duane Deardorff. Dept. of Physics and Astro-nomy, CB 3255 Phillips Hall, University of North Carolina, Chapel Hill, NC 27599Source: WebAssign, CAPA, OWL or Homework Service.
Research Question? Online homework: Does It Make a Difference?Sample? This project was done with two large groups of an introductory calculus-based phy-sics course (~110 students in each section) and then repeated the next semester with two sec-tions of an algebra based course (~60 students each).
What did the researcher do? In both courses, an instructor taught the sections on the same day, trying to keep everything as similar as possible except for the homework method used. In one section students sent their work to WebAssign for grading (with resubmissions allowed), while students in the other group turned in their ho-mework on paper to be graded by a graduate teaching assistant (TA). The paired sections were given basically the same duties, which were ba-sically composed of standard textbook-type problems. Student learning was measured by multiple choice and written problems on exams and quizzes, along with the Force and Motion Concept Exam (FMCE) in the calculus course. Students were also surveyed, and some were interviewed. Both of these courses were multi-ple-section courses taught by different instruc-
tors in any given semester; students in the other calculus-based sections took the same common exams and received the same web-based assig-nments.
The study compared the performance of stu-dents using an online homework system to tho-se submitting their work on paper in the tradi-tional manner (Moor F. , 2004).Results?
According to the authors, student performance was similar between the paper and web sections. The students from the web sections consistent-ly performed slightly better on the tests (Table 4. calculus, 78% vs. 75%; algebra, 82% vs. 77%), but this difference was not statistically signifi-cant—no conclusions can be drawn from it. In fact, differences between calculus-based sections taught by different instructors were greater. In addition, the small difference seen in test scores is possibly because of a difference in student abi-lity—in both courses the students in the web sec-tion had slightly better GPAs and SAT math sco-res. When the scores are broken down between written and multiple-choice questions, there are still no significant differences between the two homework methods. A selection of written work from the calculus course was analyzed for diffe-rences in how students wrote out the problems (use of equations, words, numbers, units, etc.).
The only significant difference found with this data is that the paper group was better at fo-llowing instructions to box or circle the final answer. The FCI was given to the calculus stu-dents at the beginning and end of the semester,
Table 4. Calculus and algebra courses.

119
Escenarios • Vol. 13, No. 2, Julio - Diciembre de 2015, págs. 114-134
and the two sections had nearly identical gains. Looking at the rest of the course, the major sig-nificant difference found between paired sec-tions was for the calculus section’s homework scores—81% vs. 76%. The web section may have done better because they had the opportunity to resubmit assignments or, alternatively, becau-se they had three short assignments a week as opposed to one long one likes their paper-based colleagues. This difference was not seen in the al-gebra course, where both sections had one long assignment a week. Also, the scores in the alge-bra web section might have been depressed be-cause of unusually high levels of technical diffi-culties during the first few weeks, which caused the instructor and many of the students to de-velop negative attitudes towards the homework system. No differences were found in laboratory performance or in the use of the walk-in Physics Tutorial Center (Abbott, 1994).
Implications according to author:The authors conclude that the method of collec-ting and grading homework makes little diffe-rence to student performance. There are some additional points that should be considered:
• The effort involved in grading of the paper exercises in this comparison was much more thorough than typical. All problems on all assig-nments were graded, including both the process and the final result.Written comments were often given, and occa-sionally these were extensive. We would expect that feedback by hand or by computer is better than no feedback at all, but to what degree we can not say.
• The resources (money/time) required by using paper vs. computer homework could be signifi-cantly different, particularly in large groups. In this study, the paper-based sections employed a full-time graduate teaching assistant (15-20 hours/week). The cost of online homework sys-tems ranges from free software (provide your own machine and content) to fully hosted sys-tems with lots of content for several hundred dollars a semester per class. Perhaps the greatest benefit of web-based homework is that it can free up personal or monetary resources which
can be devoted to other aspects of the course where they can make a greater difference.
• Although web-based systems did not seem to hinder student performance, technical problems and negative instructor attitude did make the al-gebra web section a more unpleasant experience than it had to be. Others have observed that ha-ving someone available to ensure that things run smoothly has a great impact on student and ins-tructor attitudes toward the homework system.
• Standard textbook-like problems were used in this investigation; to a certain extent, these have been optimized for paper homework. Com-puters allow us to give types of questions that would not be possible on paper (e.g., Physlet ™ exercises 11) which could prove to be a decisive improvement over textbook problems—not be-cause of the technology itself, but as a result of better pedagogy enabled by the technology.
According to the authors, web based homework is a viable alternative to the traditional paper-ba-sed approach. It does not bring significantly greater benefits to students, but neither does it do much worse than standard methods of co-llecting and grading homework. It probably will help students in courses where homework could not otherwise be assigned. Students ge-nerally respond positively to using a computer for homework and, in general, seem to take their assignments seriously. Web based homework may also allow for more pedagogically sound instruction by freeing up instructor resources for other aspects of the course, or by enabling new kinds of assignments that may be more valuable than traditional paper-and-pencil ones. Techno-logy alone is not going to improve instruction, but web-based homework has a rightful place in the physics instructor’s toolbox.
Name of Article: Training of undergraduate tea-chers in Nigerian universities: focus on problems of effective integration and attitude of students to computers in mathematics instructionAuthor: Dr. (Mrs.) Uche N. V. AGWAGAH. Science Education Department - University of Nigeria, NSUKKA. [email protected]. Kamoru OLAYIWOLA USMAN. Science

120
The Use of Computers and Technology Increase Student Achievement and Improve Attitude
Education Department - University of Nigeria, NSUKKA. [email protected] Question? • To what extent are mathematics education stu-dents exposed to the use of computer in teaching mathematics in the mathematics methods cour-se?• What proportion of mathematics educators own computer machines?• What are the attitudes of undergraduate ma-thematics education students to computer usage in mathematics instruction? Sample? The subjects were selected from thirty Nigerian Universities that run the mathematics education program. A total of three hundred and thirty subjects (300 undergraduate mathematics education students and 30 mathematics edu-cators were selected through stratified random sampling. The unit of stratification was owners-hip of university (Federal-owned and State-ow-ned universities).
What did the researcher do? Two sets of ques-tionnaires – one for the students and the other for the mathematics educators were used for data collection. The questionnaire for students had 3 sections. Section sought information on personal data – students’ gender and ownership of uni-versity. Section B sought information on availa-bility of computers in education departments, and extent of exposure of students to computer usage in mathematics instruction. Section C sou-ght information on general attitudes of students toward computer in mathematics instruction.
The questionnaire for mathematics educators also had three sections. Section A was on owner-ship of university. Section B was meant to collect data on availability of computers for mathema-tics method course, and extent of exposing stu-dents to computer usage in mathematics instruc-tion. The items were also meant for collecting data on computer literacy level of the educators, mode of training in computer literacy and access to computer in homes. Section C sought infor-mation on problems of integrating computer in mathematics education program. The question-naires were found to have an alpha reliability of 0.89 and 0.83 respectively. Two types of validity
were assessed: face validity and content validity by a panel of 3 judges (AGWAGAH, 2003).
Results?
Moreover, very few (30 per cent) of the mathe-matics educators studied have access to compu-ters in their homes (table 5). Definitely, the in-ability of teachers to have access to computers and the lack of opportunity to be computer lite-rate would hamper their effectiveness in the ma-thematics education program. Renzulli (1998) observed that more rigorous curriculum stan-dards, without improved curricular materials and teachers able to use them would not yield significant improved academic performance.
The results of this study indicated that generally, the mathematics education students have positi-ve attitudes towards the use of computers in ma-thematics instruction. They believe that compu-ter can greatly improve learning in mathematics; the use of computers in mathematics instruction can have a significant motivating effect on stu-dents; computers offer a cost-effective way of individualizing mathematics instruction; with the use of computers, the teacher can cover a lot of work to be done within a short time; the learning of mathematics would become easier; computers are very important and necessary in mathematics instruction; and computers would help to increase socialization among students in the mathematics classroom. However, on the negative aspect, the students in addition to be-lieving that some mathematics topics cannot be taught with computers and computers cannot be useful for teaching for understanding in ma-thematics believe that integration of computers in mathematics instruction will threaten the job of teachers. This result supports Harbor-Peters (1997) finding that Nigerian Secondary school teachers are not in support of the use of compu-ters for fear of being displaced from job.
Implications according to author:
It has been found that computers are not widely available in the Nigerian Universities for the tra-ining of undergraduate mathematics teachers, and the student teachers are not exposed to the
121
Escenarios • Vol. 13, No. 2, Julio - Diciembre de 2015, págs.
computer usage in mathematics instructions. Also, very few of the mathematics educators are computer literate, and have access to compu-ters in their homes. If the Nigerian government should achieve its goal of integrating the com-puters into education especially mathematics education in Nigerian schools, then the teachers must be empowered through training in the use and application of the new technology. The au-thors therefore make the following recommen-dations.
1. The government should adequately fund the universities in Nigeria. Besides, in-dustries and some “well-to-do Nigerians” should be involved in the funding of higher education in Nigeria.
2. Mathematics educators should be suppor-ted to attend at least one international confe-rence on the teaching and learning of mathe-matics every year.
3. Universities should form linkages/ex-change programs with Universities in the developed nations so as to help train the mathematics educators in the areas of using computers in teaching mathematics.
4. Universities should restore oversea trai-ning for their lecturers, so as to be exposed to current methods and materials for teaching and learning of mathematics.
Recent comparisons of traditional mathematics instruction to its computer-assisted counterpart also yielded positive learning results related to the use of technology, including commercially available problem-solving software (D. Fletcher, 1990), (Djang, 1993).
Similarly, studies by the Cognition and Tech-nology group at Vanderbilt University of their video series entitled “The Adventures of Jasper Woodbury” showed positive results (Cognition and Technology Group at Vanderbilt University, “The Jasper Series as an Example of Anchored Instruction: Theory, Program Description, and Assessment Data,” Educational Psychologist , 1992).
This series itself is of particular interest to library media specialists: each “adventure” is a fifteen- to twenty-minute story that embeds all the in-formation students need to solve a particular mathematical problem; students need not only mathematical skills but skills in identifying, eva-luating, and using information to reach their so-lutions. The series thus provides a strong exam-ple of the ways in which information skills are inherent in the contemporary curriculum and can be linked to achievement in curricular areas (Neuman, 1996).
This link is underscored by the findings of a more recent study that suggests supplementing the Jasper videos with a variety of contextual tools and follow-up activities will help students apply their learning to new situations (Barron, 1995).
RESEARCH DESIGN
Research Planning Sheet Number 1Research Idea from Web #3: Use of computer technologyResearch Question: Will the use of computers and technology increase student achievement and improve attitude?Rate your research question on a scale from 1 (low) to 4 (high)Feasible: Clear: Significant: Ethical: Shows a relationship Y or N
Definitions of terms: Underline the terms in your research question that you believe will require definition. Write each term below and provide their operational definitions. Use addi-tional pages as necessary.
a. Computer technology:b. Achievement: Based on teacher testc. Attitude: Based on Likert ScaleSpecific type of Research: Interventional General Type of Research: Interventional
1. Our Hypothesis is: The use of computers and technology will increase student achievement
114-134

122
and improve attitude.What kind of study?What is your idea here? (Intervention)What is the independent variable or the experi-mental variable? Computer & Technology use.What is the dependent variable? Achievement and attitude.
Data Collection MatrixWhat am I measuring? (Dependent or Outcome Variables)How am I measuring?From whom am I collecting Data?Research Questions: 1. Computer use achieve-ment and attitude.Sources (From whom will you collect informa-tion?): Students
Research Planning Sheet Number 2Part ASampling Plan:1. My intended sample (subjects who would participate in my study) consists of (tell who and how many):24 students in 12th grade (9 in regular group and 15 in advanced group).36 students in 10th grade (17 in 10th A and 19 in 10th B).
2. Demographics are as follows:
a. Age Range: 17 to 19 (12th grade)/16 to 17 (10th grade)b. Sex Distribution: M & Fc. Ethnic Breakdown: mixed Hispanic, Whi-te, Colombian students.d. Location: Barranquilla, Colombia, SAe.Other important characteristics (attach ad-ditional sheets as necessary): most students are from upper middle class families in Co-lombia.
3. The type of Sample Simple Random: Convenience XXStratified Random: PurposiveCluster Random
4. I will obtain my sample by: Teacher conve-nience (Table 5)
Threats to ValidityHawthorneMortalityPrior KnowledgeTutoringNovelty
Research Planning Sheet Number 3Data Analysis:
1. How will I analyze my data? (Consider the
Pre Test
Pre test A & PPhysics and Lab II
(12th Grade)
Post Test A & P Physics and Lab II
(12th Grade)50% of the classes
will receive the treatment in a unit. 50 % will serve as
a control group.In second unit the Control group gets the treatment and
the treatment serves as the control.
Hawthorne effectMortality
Prior computer knowledge
Technology at homeTutoring
Some students are in two classes
Pre Test A & P Pre-Chemistry (10th Grade)
Post Test A & P Pre-Chemistry (10th Grade)
Pre Test A & P Math (10th Grade)
Treatment Post test
Table 5: Teacher convenience
The Use of Computers and Technology Increase Student Achievement and Improve Attitude

123
use of descriptive display. (Bar graphs, scatter plots, percent table, other): Bar graphs, Vassar stats & R Language Program
2. Which comparative technique will I use?Independent SamplesLevel of significance : 0.05t-test (s)df : n-2
3. How will I use qualitative techniques to en-hance understanding?Observations XInterviews X 4. How can I share my results? With whom?Other Staff members, volunteer faculty mem-bers, another school, being published in specia-lized magazines.
ACTION PLAN FOR MASTERS PROJECT
Research Question: Will the use of computers and technology increa-se student achievement and improve attitude?
List the steps to you will take to implement your action research project then complete your timeline below:
1. Search for some bibliographic references in or-der to support the project 1 per group member. 2. Check software applications and computatio-nal tools which are going to support the research.
3. Choose the appropriate software according to our goals in each specific lesson. Be more spe-cific.
4. Because of this project involves interdiscipli-nary areas each teacher will select the lesson in which the software will be applied. Treatment group and control group will be chosen by ran-dom selection.
5. After choosing lessons and groups, a schedule will be designed to apply the pre test & Likert Scale survey.
6. When we will have collected the pre scores, each teacher will implement the treatment su-pported by the technology consultant (Compu-ters teacher).
7. Then, the post test & Likert Scale will be ad-ministered to the students.
8. The process will be repeated a second time with the whole process being reversed where the control group becomes the experimental and the experimental becomes the control group.
9. With both scores (pre & post) collected both groups serving as control and experimental, a statistics calculation will be done to compare results and determine whether the treatment is effective or not.
Escenarios • Vol. 12, No. 2, Julio - Diciembre de 2015, págs. 114-134

124
h t t p : / / w w w. e d u m e -d i a - s c i e n c e s . c o m / e s /n o d e / 9 0 - p r o p i e d a -des-de-la-materiah t t p : / / w w w. e d u m e -dia-sciences.com/es/no-de/357-reacciones-quimi-cas
Gilberto
Cmputers , VideobeamsChemistry laboratory room
Feb 05, 2007 May 18, 2007
Feb 05, 2007 May 18, 2007
Feb 05, 2007 May 18, 2007
Feb 05, 2007 May 18, 2007
Cmputers , Videobeams
C o m p u t e r room
Cmputers , VideobeamsScience la-b o r a t o r y room
Marco
Pablo
Luis
Resources Person Respon Needs
Anticipated Completion
Date
Actual Completion
DateStep
Pre-Test (R Group).Likert ScaleTechnologi-cal SupportPos-Test (R Group)Pre-Test (AP Group)Technologi-cal SupportPos-Test (AP Group).Likert ScaleAnalysis and Conclusions
http://www.schools.utah.g o v / C U R R / m a t h s e c /Core/Secondary-I.aspxhttps://www-math.umd.edu/secondary-mathema-tics-education.html
http://www.robeson.k12.nc.us/Page/5217h t t p : / / b a t t l e f i e l d h s .schools.pwcs.edu/modu-les/cms/pages.phtml?pa-geid=85077&SID
h t t p : / / w w w. e d u m e -dia-sciences.com/m103_l3-lente-espejos.htmlh t t p : / / w w w. e d u m e -dia-sciences.com/m103_l3-lenses-and-mirrors.htmlhttp://www.retena.es/per-sonales/lpastord/applets/optica/lentes/lentes.htmTechnological Supportt-TESThttp://faculty.vassar.edu/lowry/VassarStats.htmlSTATISTICAL INFEREN-CIAL
The Use of Computers and Technology Increase Student Achievement and Improve Attitude

125
Escenarios • Vol. 12, No. 2, Julio - Diciembre de 2015, págs.
LIKERT SCALE
126
The Use of Computers and Technology Increase Student Achievement and Improve Attitude
FINDINGS
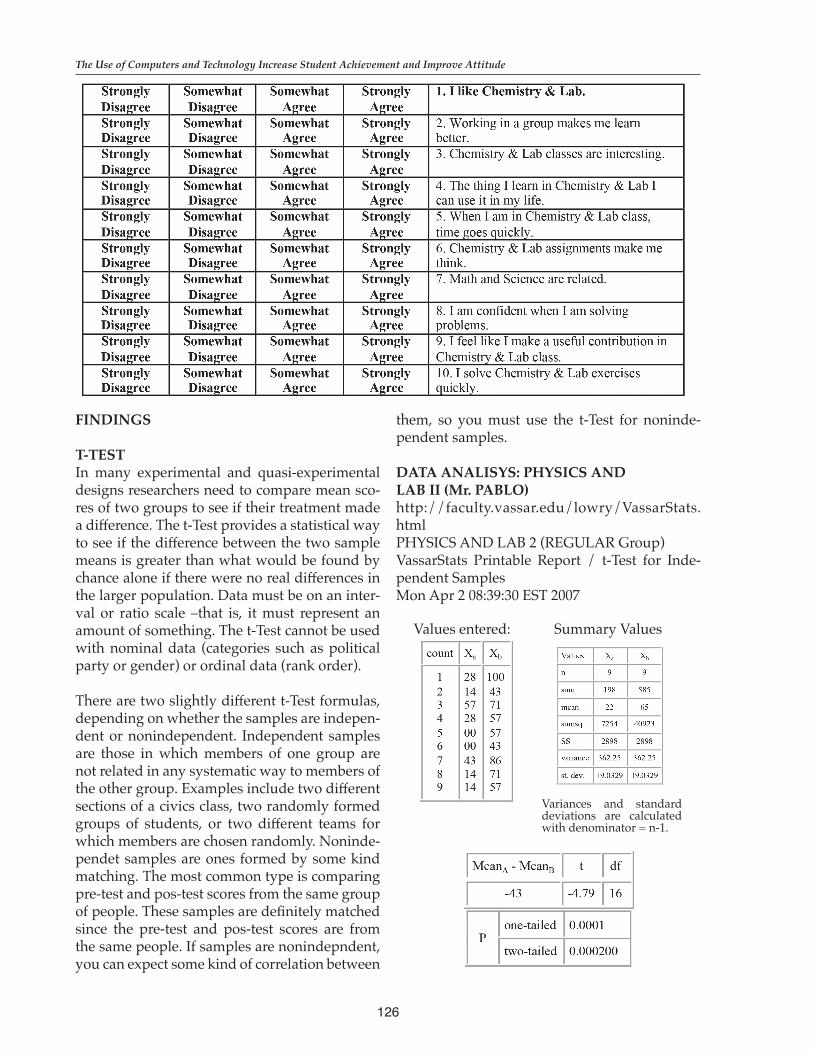
T-TESTIn many experimental and quasi-experimental designs researchers need to compare mean sco-res of two groups to see if their treatment made a difference. The t-Test provides a statistical way to see if the difference between the two sample means is greater than what would be found by chance alone if there were no real differences in the larger population. Data must be on an inter-val or ratio scale –that is, it must represent an amount of something. The t-Test cannot be used with nominal data (categories such as political party or gender) or ordinal data (rank order).
There are two slightly different t-Test formulas, depending on whether the samples are indepen-dent or nonindependent. Independent samples are those in which members of one group are not related in any systematic way to members of the other group. Examples include two different sections of a civics class, two randomly formed groups of students, or two different teams for which members are chosen randomly. Noninde-pendet samples are ones formed by some kind matching. The most common type is comparing pre-test and pos-test scores from the same group of people. These samples are definitely matched since the pre-test and pos-test scores are from the same people. If samples are nonindepndent, you can expect some kind of correlation between
them, so you must use the t-Test for noninde-pendent samples.
DATA ANALISYS: PHYSICS AND LAB II (Mr. PABLO)http://faculty.vassar.edu/lowry/VassarStats.htmlPHYSICS AND LAB 2 (REGULAR Group)VassarStats Printable Report / t-Test for Inde-pendent SamplesMon Apr 2 08:39:30 EST 2007
Values entered: Summary Values
Variances and standard deviations are calculated with denominator = n-1.

127
Escenarios • Vol. 13, No. 2, Julio - Diciembre de 2015, págs.
VassarStats Printable Report / t-Test for Correlated SamplesMon Apr 2 09:23:25 EST 2007
Values entered: Summary Values
Variances and standard deviations are calculated with denominator = n-1
Figure 4. Progress of student in Regular Group.
114-134

128
PHYSICS AND LAB 2 (AP Group) - VassarStats Printable Reportt-Test for Independent Samples - Mon Apr 2 09:05:09 EST 2007
VassarStats Printable Report - t-Test for Correlated SamplesMon Apr 2 09:21:45 EST 2007
Values entered:
Values entered:
Summary Values
Summary Values
Variances and standard deviations are calculated with denominator = n-1.
Variances and standard deviations are calculated
with denominator = n-1.
The Use of Computers and Technology Increase Student Achievement and Improve Attitude

129
Escenarios • Vol. 13, No. 2, Julio - Diciembre de 2015, págs.
Figure 5. Progress of student in AP Group
Figure 6. Likert Skill Pre-Test AP Group.
Figure 7. Likert Skill Post-Test AP Group.
LIKERT SCALES
I II III IVLSK1 3 3 6 3LSK2 1 2 3 9LSK3 2 2 5 6LSK4 0 0 10 5LSK5 2 4 5 4LSK6 1 0 3 11LSK7 2 1 3 9LSK8 3 4 7 1LSK9 2 5 6 2LSK10 6 7 2 0
I II III IVLSK1 0 3 3 9LSK2 0 1 2 12LSK3 0 1 2 12LSK4 0 0 3 12LSK5 0 1 5 9LSK6 0 0 1 14LSK7 0 1 3 11LSK8 0 3 7 5LSK9 0 1 8 6LSK10 0 2 7 6
114-134

130
The Use of Computers and Technology Increase Student Achievement and Improve Attitude
R Language Program
DESCRIPTIVE STATISTIC
STATISTICAL INFERENCIAL

131
Escenarios • Vol. 13, No. 2, Julio - Diciembre de 2015, págs.
DESCRIPTIVE STATISTIC
This work was done by using the statistical tool of Longitudinal Data because the responses (grades in this case) are obtained from the same fellows (students), that is to say there should be a correlation between the first and second note in the time, since it is carried out by the same fellow (student), which favors the application of this technique.
T techniques of students applied in some texts, are not convenient since they imply or it assume that a grade of an individual is independent to the following qualification, what induces to an error since it is the same individual, a correlation should exist in the time what in this case would be the development of his knowledge through the time.
This graph of Box plots shows that the level of both groups (AP and R) is always supe-rior on the second evaluation; this suggests that a statistical difference exists among the groups when using technological support.
114-134

132
The Use of Computers and Technology Increase Student Achievement and Improve Attitude
STATISTICAL INFERENCIAL In this study, a comparison between the groups is done by using Wilks
Statistics, observing the following results:
This value P indicates a significant difference among the groups, what implies that Wilks show us that between the groups Regular students and AP a very significant difference exists.
Another test very used to determine differences among the groups it is the test of Pillai,
For a level of significance of 0.05, it implies that a statistical difference exists among the groups of students evaluated by the use of the two types of methodology.
DISCUSSION AND ACTION PLAN
Technology has become such an integral part of society, it is necessary to integrate its use in edu-cation in a variety of ways.
Today’s technology can provide teachers and students with opportunities for teaching and
learning that were impossible in the past.Computers in the classroom develop important skills.
Computers makes understanding how to use them essential.
The ability to locate information, distinguish the important from the unimportant, think critically, work effectively in groups and present informa-tion in many types of media are all aided by the use of computers in the classroom.
It is not yet clear how much computer-based
The value of the test of Pillai (0.4103) shows us a significant difference among the evaluated groups. Another test is the statistical of Hotelling-Lawley, the obtained result is the following one:
Finally these results can be corroborated by a Variance Analysis, like it is presented in the following chart
Source of variation Degrees of freedom Wilks Value F Value PGroups 1 0.5897 7.3058 0.003905Errors 22
Source of variation Degrees of freedom Pillai Value F Value PGroups 1 0.4103 7.3058 0.003905Errors 22
Source of variation Degrees of freedom Hotelling-Lawley Value F Value PGroups 1 0.6958 7.3058 0.003905Errors 22
Source of variation Degrees of freedom Adds of square Square half Value F Value PGroups 1 5130.2 5130.2 5.9208 0.02354Errors 22 19062.4 866.5 Total

133
Escenarios • Vol. 13, No. 2, Julio - Diciembre de 2015, págs.
programs can contribute to the improvement of instruction in American schools. Although many researchers have carried out controlled evalua-tions of technology effects during the last three decades, the evaluation literature still seems pat-chy. For most technologies, results are available only at selected grade levels, in selected subjects, and on selected instructional outcomes. The li-terature is too uneven for sweeping conclusions about the effectiveness of instructional techno-logy. Nonetheless, results are consistent enough for some tentative conclusions in some areas.
It is also clear that instructional technology of-ten improves teaching programs in mathematics and in the natural and social sciences.
Computer tutorials in natural and social science classes also have had an almost uniformly posi-tive record of effectiveness.
Science educators often think of simulation pro-grams as advances over tutorial programs.Teachers therefore may need to use some care in deciding when to use simulations, which simu-lations to use, and how to use them.
The important thing for instructors to remem-ber is that although an online environment is different from face-to-face instruction, the goal of creating a stimulating, interactive learning en-vironment for students is the same, regardless of the context.
Computers in schools help students accomplish their schoolwork both effectively and efficiently.Critical thinking, problem solving, independent learning skills, content knowledge, and the abili-ty to compete in the work force are all enhanced.
The use of technology today both inside and outside of the classroom improves student achievement in a po-sitive way. Teacher and students work hard to use the technology to help lessons run smoothly for all. Tech-nology does have its ups and downs but there is one thing for sure that it keeps students interest. The use of strategies, computer programs, strenuous training, and technical support is a great way to achieve this goal. Technology advances everyday allowing stu-dents and teachers to have more options in learning.
REFERENCE
Barron B. and others, (1995) “Creating Contexts for Community-based Problem Solving: The Jas-per Challenge Series,” in Thinking and Literacy: The Mind at Work, eds. C. N. Hedley, P. Antonac-ci, and M. Rabinowitz (Hillsdale, N.J.: Lawrence Erlbaum) Recovered in http://www.ala.org/aasl/sites/ala.org.aasl/files/content/aaslpub-sandjournals/slr/edchoice/SLMQ_Effective-nessofTechnologyinSchools_InfoPower.pdf
Bruce Arne Sherwood, (1971).American Journal of Physics 39 1199-1202
CAPA, CAPA: A (2001) Computer-As-sisted Personalized Approach. Recovered in http://capa4.lite.msu.edu/homepage/.
Cognition and Technology Group at Vanderbilt University, (1992) “The Jasper Series as an Exam-ple of Anchored Instruction: Theory, Program Description, and Assessment Data,” Educational Psychologist 27 (Fall 1992): 291–316. 14.
Fletcher, D. Hawley, . E. and P. K. Piele, (1993)“Costs, Effects, and Utility of Microcom-puter-assisted Instruction in the Classroom.” Pa-per presented at the Seventh International Con-ference on Technology and Education, Brussels (Mar. 1990); C. Funkhouser and P. Djang, “The Influence of Problem-solving Software on Stu-dent Attitudes about Mathematics,” Journal of Research on Computing in Education 25 (Spring 1993): 339–46.
Fred.Moore, C (2002) Homework Service. Reco-vered in http://hw.ph.utexas.edu/overview.html.
Harbor-Peters (1997.Effectiveness of Selected Teaching Strategies in the Remediation of Pro-cess Errors Committed by Senior Secondary School Students in Mathematics.
Hilton Abbott, (1994).Computers in Physics 8 (2) 166-169
Marcoux B. and Neuman, D. (1996) “Into the Twenty-first Century: New Guidelines and Stan-
114-134

134
dards for Library Media Programs,” SLMQ 24 (Summer 1996): 213–18. 15.
Nogueira, N. R. (2006) Pedagogy of Pro-jects. An interdisciplinary journey to develop multiple intelligences. Chapter 8. p. 157.
O’Byrne, J., Thompson, R. (2005) The tutorial be-nefits of on-line assignments: MasteringPhysics in first year physics at the University of Sydney. School of Physics, the University of Sydney. Re-covered in http://www.njctl.org/?gclid=CPTl-qbbV8sgCFc-RHwodgqUE5Q
Renzulli (1998). Recovered in http://www.unc.edu/~healdric/Workpapers/P117.pdf
Renzulli, L. Aldrich, H.Moody, J. Family Mat-ters(1998). Gender, Networks,and Entrepreneu-rial Outcomes. Social Forces, 79(2), pp. 523-546. Recovered in http://www.unc.edu/~healdric/Workpapers/P117.pdf.
Uche N. V. AGWAGAH. (2003) Training of un-dergraduate teachers in Nigerian universities: focus on problems of effective integration and attitude of students to computers in mathema-tics instruction. Science Education Department - University of Nigeria, NSUKKA.
University of Massachusetts, OWL-Online Web Learning. Recovered in http://ccbit.cs.umass.edu/owl/.
The Use of Computers and Technology Increase Student Achievement and Improve Attitude