the u.s. coast guard 87’ patrol boat maintenance program
TRANSCRIPT

The U.S. Coast Guard 87’ Patrol Boat Maintenance Program:
An Analysis of a Scheduling and Resource Leveling Problem
Amanda DiPietro
A Thesis
Submitted in partial fulfillment of the
Requirements for the degree of
Master of Science in Industrial Engineering
University of Washington
2015
Reading Committee:
Richard Storch
Joseph Heim
Christina Mastrangelo
Program Authorized to Offer Degree:
Industrial and Systems Engineering

©Copyright 2015
Amanda DiPietro

University of Washington
Abstract
The U.S. Coast Guard 87’ Patrol Boat Maintenance Program:
An Analysis of a Scheduling and Resource Leveling Problem
Amanda DiPietro
Chair of the Supervisory Committee:
Professor Emeritus Richard Storch
Industrial and Systems Engineering
Planning and managing military ship repair projects require a delicate balance between software-
based scheduling, resource loading, and risk mitigation strategies. The U.S. Coast Guard
Industrial Yard, through use of Oracle’s Primavera software, has historically used the Critical
Path Method (CPM) of scheduling for their maintenance projects. With the introduction of an
assembly line program to repair all East Coast 87-foot Patrol Boats named the Bow to Stern
Program, the Yard resorted to manually sequencing work items using a Work Breakdown
Structure. In this paper, spreadsheet modeling is used as an inexpensive and available tool to
study concurrent project loading and the benefits of level loading job shops. The results show
imminent program challenges with a compressed project timeline and shared resources
throughout the shipyard. A decision tree for schedule risk mitigation strategies and a prioritized
list of efficiency improvements are created, highlighting the need for labor fatigue studies and an
Integrated Master Plan for overall organizational success.
Key Words: Critical Path Method, Ship Maintenance/Construction, Concurrent Projects, Scheduling, Schedule Risk Mitigation
Strategies, Level Loading

i
TABLE OF CONTENTS
Page
LIST OF FIGURES ………………………………………………………………… iii
LIST OF TABLES ………………………………………………………………… vii
DEDICATION ………………………………………………………………… x
ACKNOWLEDGEMENTS ………………………………………………………… xi
CHAPTER 1: INTRODUCTION ………………………………………………… 1
1.1 Project Details ………………………………………………… 1
1.2 Study Goals ………………………………………………………… 4
CHAPTER 2: BACKGROUND ………………………………………………… 4
2.1 Literature Review ………………………………………………… 4
2.1.1 History of CPM ………………………………………… 4
2.1.2 CPM in the Military and Methodology ………………… 6
2.1.3 Advanced CPM Problems ………………………………… 10
2.1.4 Schedule Implementation and Feedback Loops ……………… 11
2.1.5 Schedule Risk Mitigation Strategies ………………………… 13
2.1.6 Effects of Learning Curves ………………………………… 18
2.1.7 Similarities and Differences to Line Balancing ………… 19
2.1.8 Industry Example ………………………………………… 21
2.2 Hypotheses ………………………………………………………… 22
CHAPTER 3: DATA ANALYSIS ………………………………………………… 23
CHAPTER 4: METHODOLOGY ………………………………………………… 31
4.1 Experimental Design ………………………………………………… 31

ii
4.2 Procedures & Assumptions ………………………………………… 32
4.3 Level-Loading a Single Job Shop ………………………………… 37
4.4 Results ………………………………………………………… 38
4.5 Discussion ………………………………………………………… 48
CHAPTER 5: DECISION SUPPORT TOOLS ………………………………… 55
5.1 Mitigation Strategies ………………………………………………… 55
5.2 Business & Program Improvements ………………………………… 61
CHAPTER 6: GENERAL CONCLUSIONS ………………………………………… 67
6.1 Overall Findings ………………………………………………… 68
6.2 Future Research ………………………………………………… 68
6.3 Contributions ………………………………………………………… 69
REFERENCES ………………………………………………………………… 71
APPENDIX: ANNOTATED TABLES & GRAPHS ………………………………… 77

iii
LIST OF FIGURES
Figure Number Page
1.1.1 87’ WPB Drawing of First Cutter in Class and Cutter Underway …… 1
2.1.1 Critical Path Method Time-Cost tradeoff curve …………………… 5
2.1.2 Activity-On-Arrow Diagram …………………………………………… 9
2.1.3 Activity-On-Node Diagram …………………………………………… 9
2.1.4 Gantt Chart example from 87' Bow to Stern Program (CGC IBIS) …… 9
3.1 Excerpt from Rev0 Specification Listing Availability Work Items …… 26
3.2 Example CLIN Work Item Estimate for Bow to Stern Program …… 30
3.3 Zoomed-in example CLIN Work Item Estimate for Bow to Stern
Program …………………………………………………………… 31
4.2.1 Two-Week Snapshot of X-11 Job Shop Organization of Man-Hours for Three
Parallel Availabilities …………………………………………………… 35
4.2.2 Bar Chart of Total Man-Hours for Shop X-11 with Three Parallel Projects. 35
4.2.3 Two-Week Snapshot of X-42 Job Shop Organization of Man-Hours for Three
Parallel Availabilities …………………………………………………… 36
4.2.4 Bar Chart of Total Man-Hours for Shop X-42 with Three Parallel Projects. 36
4.4.1 Total and per person man-hours for one availability, the CGC IBIS …… 39
4.4.2 Total man-hours for one availability, the CGC IBIS. …………………… 40
4.4.3 Manning Scenario Comparative Graph for One Availability …………… 40
4.4.4 Total man-hours for two availabilities, the CGC IBIS and
CGC STINGRAY …………………………………………………… 41
4.4.5 Total man-hours for three availabilities, the CGC IBIS, CGC STINGRAY,

iv
and CGC HAMMERHEAD …………………………………………… 42
4.4.6 Stepwise Loading of Man-Hours after Level Loading One Availability. 44
4.4.7 Equal Loading of Three Availabilities’ Total Hours over Project Timeline. 45
4.4.8 Level Loading of One Availability over Short Time Periods …………… 46
4.4.9 Level Loading of Three Availabilities over Short Time Periods …… 46
5.1.1 Decision Tree for Selecting Schedule Risk Mitigation Strategies …… 60
A.1 Calendar Schedule Representation of Job Shop X-11 Loading over Three Parallel
Availabilities …………………………………………………………… 79
A.2 Calendar Schedule Representation of Job Shop X-12 Loading over Three Parallel
Availabilities …………………………………………………………… 80
A.3 Calendar Schedule Representation of Job Shop X-13 Loading over Three Parallel
Availabilities …………………………………………………………… 82
A.4 Calendar Schedule Representation of Job Shop X-14 Loading over Three Parallel
Availabilities …………………………………………………………… 83
A.5 Calendar Schedule Representation of Job Shop X-21 Loading over Three Parallel
Availabilities …………………………………………………………… 85
A.6 Calendar Schedule Representation of Job Shop X-22 Loading over Three Parallel
Availabilities …………………………………………………………… 86
A.7 Calendar Schedule Representation of Job Shop X-23 Loading over Three Parallel
Availabilities …………………………………………………………… 88
A.8 Calendar Schedule Representation of Job Shop X-24 Loading over Three Parallel
Availabilities …………………………………………………………… 88

v
A.9 Calendar Schedule Representation of Job Shop X-31 Loading over Three Parallel
Availabilities …………………………………………………………… 90
A.10 Calendar Schedule Representation of Job Shop X-32 Loading over Three Parallel
Availabilities…………………………………………………………… 91
A.11 Calendar Schedule Representation of Job Shop X-33 Loading over Three Parallel
Availabilities …………………………………………………………… 91
A.12 Calendar Schedule Representation of Job Shop X-41 Loading over Three Parallel
Availabilities …………………………………………………………… 92
A.13 Calendar Schedule Representation of Job Shop X-42 Loading over Three Parallel
Availabilities …………………………………………………………… 94
A.14 Calendar Schedule Representation of Job Shop X-43 Loading over Three Parallel
Availabilities …………………………………………………………… 96
A.15 Calendar Schedule Representation of Job Shop X-61 Loading over Three Parallel
Availabilities …………………………………………………………… 97
A.16 Calendar Schedule Representation of Job Shop X-64 Loading over Three Parallel
Availabilities …………………………………………………………… 98
A.17 Calendar Schedule Representation of Job Shop X-65 Loading over Three Parallel
Availabilities …………………………………………………………… 98
A.18 Calendar Schedule Representation of Job Shop X-66 Loading over Three Parallel
Availabilities …………………………………………………………… 99
A.19 Loading of one project with all job shop man-hours combined …… 99
A.20 Loading of two parallel projects with all job shop man-hours combined. 100
A.21 Manning Scenario Comparative Graph for Two Availabilities …… 100

vi
A.22 Loading of three parallel projects with all job shop man-hours combined. 101
A.23 Manning Scenario Comparative Graph for Three Availabilities …… 101
A.24 Color Coded WBS for CGC POMPANO …………………………… 102

vii
LIST OF TABLES
Table Number Page
3.1 Program Schedule for First Five Availabilities …………………… 25
3.2 CG Yard Job Shops …………………………………………………… 27
3.3 Work Breakdown Structure Timeline for CGC IBIS …………………… 29
4.2.1 Initial Data Organization for Job Shop X-11 …………………………… 33
4.4.1 Descriptive Statistics for Manning Scenarios for one availability …… 41
4.4.2 Descriptive Statistics for Loading of Two Availabilities …………… 42
4.4.3 Descriptive Statistics for Loading of Three Availabilities …………… 43
4.4.4 Total Actual Required Man-hours Compared to Original Estimated
Man-hours …………………………………………………………… 43
4.4.5 Progress Notes Detailing Start/End Dates and Problems Encountered
for First Five Cutters …………………………………………………… 47
4.4.6 Items Updated on WBS for CGC POMPANO …………………… 48
5.2.1 AFC30 Work Items’ Actual Required Man-hours Compared to Updated
Estimated Man-hours …………………………………………………… 63
5.2.2 AFC45 Work Items’ Actual Required Man-hours Compared to Updated
Estimated Man-hours …………………………………………………… 63
5.2.3 Over- and Underestimations for Project Task Durations and One Data Set for
Actual Man-hours for CGC IBIS …………………………………… 63
5.2.4 Prioritized Organizational Efficiency Improvements based upon Feasibility for
Implementation at the CG Yard …………………………………… 67
viii
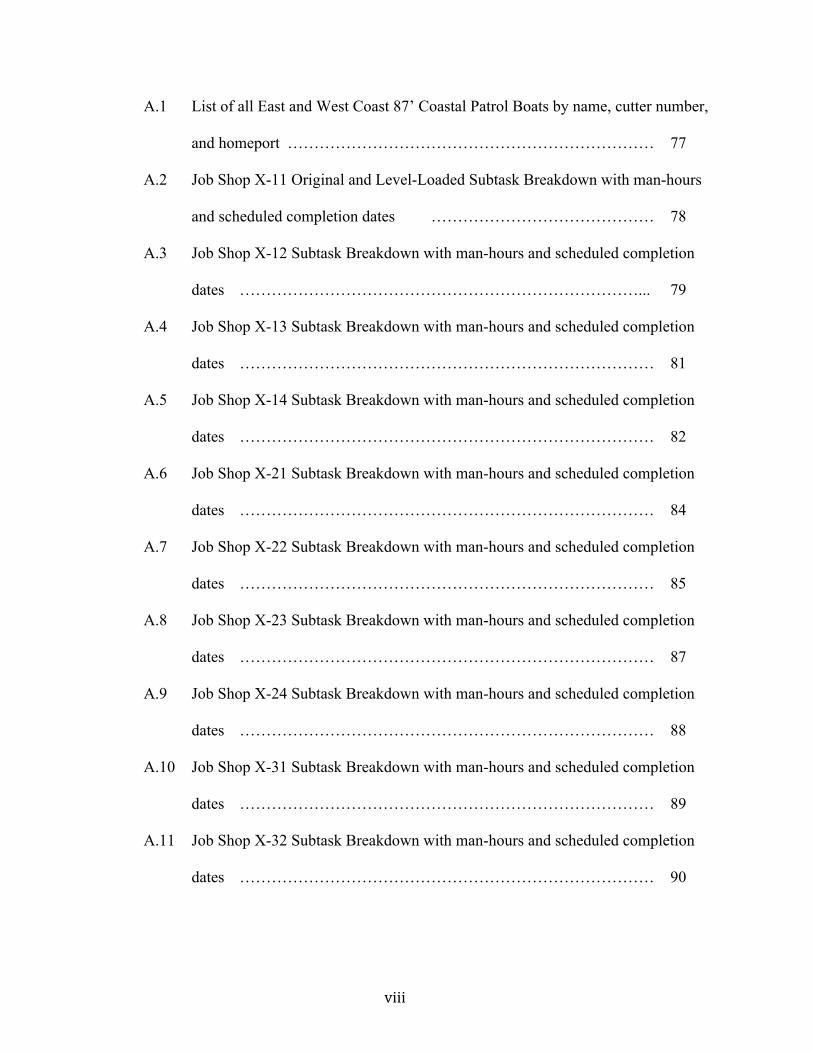
A.1 List of all East and West Coast 87’ Coastal Patrol Boats by name, cutter number,
and homeport …………………………………………………………… 77
A.2 Job Shop X-11 Original and Level-Loaded Subtask Breakdown with man-hours
and scheduled completion dates …………………………………… 78
A.3 Job Shop X-12 Subtask Breakdown with man-hours and scheduled completion
dates …………………………………………………………………... 79
A.4 Job Shop X-13 Subtask Breakdown with man-hours and scheduled completion
dates …………………………………………………………………… 81
A.5 Job Shop X-14 Subtask Breakdown with man-hours and scheduled completion
dates …………………………………………………………………… 82
A.6 Job Shop X-21 Subtask Breakdown with man-hours and scheduled completion
dates …………………………………………………………………… 84
A.7 Job Shop X-22 Subtask Breakdown with man-hours and scheduled completion
dates …………………………………………………………………… 85
A.8 Job Shop X-23 Subtask Breakdown with man-hours and scheduled completion
dates …………………………………………………………………… 87
A.9 Job Shop X-24 Subtask Breakdown with man-hours and scheduled completion
dates …………………………………………………………………… 88
A.10 Job Shop X-31 Subtask Breakdown with man-hours and scheduled completion
dates …………………………………………………………………… 89
A.11 Job Shop X-32 Subtask Breakdown with man-hours and scheduled completion
dates …………………………………………………………………… 90

ix
A.12 Job Shop X-33 Subtask Breakdown with man-hours and scheduled completion
dates …………………………………………………………………… 91
A.13 Job Shop X-41 Subtask Breakdown with man-hours and scheduled completion
dates …………………………………………………………………… 92
A.14 Job Shop X-42 Subtask Breakdown with man-hours and scheduled completion
dates …………………………………………………………………… 93
A.15 Job Shop X-43 Subtask Breakdown with man-hours and scheduled completion
dates …………………………………………………………………… 98
A.16 Job Shops X-61-66 Subtask Breakdown with man-hours and scheduled
completion dates …………………………………………………… 100

x
DEDICATION
To my husband, Joshua, for being my rock.
To my children, Liliana and Natalia, for sacrificing time away from your Mother.

xi
ACKNOWLEDGEMENTS
My project topic has been provided by the United States Coast Guard Industrial Yard and
funded by the United States Coast Guard. Semper Paratus!
There are many people I would like to thank for helping me through the past two-year’s
work. First, I would like to thank my thesis advisor, Professor Richard Storch for sticking with
me through all the ups and downs. He never doubted that I could find a great thesis topic and
always had superb advice when I was lost.
I would also like to thank Professor Heim and Professor Mastrangelo for their
contributions to this paper. Finally, I would like to thank my family and fellow ISE classmates
for their support and encouragement.

1
Chapter 1
INTRODUCTION
1.1 Coast Guard Program Details
The United States Coast Guard Industrial Shipyard (CG Yard), located in Baltimore, MD,
is the Coast Guard’s only in-house depot level maintenance facility in the United States. The CG
Yard has a highly skilled workforce that is capable of working on all Coast Guard surface assets
less than 378 feet. The facility, composed of an unionized civilian workforce and an active duty
support network, tends to be inflexible to major changes, but can take on risky projects that
would be unwise to award to commercial shipyards. Some of those risky projects include new
technology installations for prototyping, service life extension and mission effectiveness
projects, as well as assembly-line maintenance programs utilizing different management
strategies.
The CG Yard began a four-year, $49 million depot level maintenance initiative for its 87’
Coastal Patrol Boat fleet in November of 2014 called the 87’ “Bow-to-Stern” Dry-Dock Program
(Coast Guard Yard News 2014). The program will cycle all Atlantic Area 87’ patrol boats
(WPBs) through the CG Yard instead of awarding individual contracts to commercial shipyards
along the East Coast (Figure 1.1.1).
Figure 1.1.1 87’ WPB Drawing of First Cutter in Class and Cutter Underway.

2
A different cutter (Coast Guard ship) will arrive at the CG Yard every 30 days for a 60-
day maintenance period, called an availability. The availability will consist of a drydock,
dockside work, and trials prior to acceptance. The proposed advantages of this project are
numerous and include operational, financial, and trade-specific benefits. Operationally, the Coast
Guard will use the project to strengthen the predictability of fleet schedules by reducing a 10 ½ -
week maintenance schedule into 60 days. Crews that would normally remain with their cutter
during repair resulting in reduced operational hours will receive a replacement cutter to bring
back to their homeport to continue their mission. Financially, the Coast Guard predicts it will
save $2.2 million annually over the life of the project by keeping the business “in-house”. Other
advantages to using the same facility/workforce include predictable work schedules, optimized
task scheduling within trades, and improved processing times through ship familiarity and
learning curve.
The 87’ Coastal Patrol Boat Marine Protector Class cutters are some of the newest ships
in the Coast Guard fleet. They have been in service (commissioned) from 1998 to the present.
There are currently 49 cutters on the East Coast of the United States (including Puerto Rico) and
24 cutters on the West Coast (including Hawaii) (U.S. Coast Guard 2015). The names and
locations of the cutters can be found in the Appendix (Table A.1). The missions and duties of the
Marine Protector Class include Maritime Law Enforcement, National Security, and Safety
Patrols. Coast Guard cutters have four-year recurring maintenance cycles where major, depot-
level work is conducted at a qualified shipyard.
The “Bow-to-Stern” program will address the most operationally degrading maintenance
items via a standard work item package consisting of 37 individual work items. Differences in
cutters will be addressed with added work requests. In order to accommodate multiple shifts and

3
seasonal weather fluctuations, two temporary scaffolding systems capable of fully containing one
87’ WPB each will remain erected for the four-year project to provide a climate and humidity
controlled environment with proper ventilation, heating, and lighting for parallel work. The
program is unique because this class of cutter is relatively small in size, uniform in their
configurations, and there are a large number available to mimic an assembly line maintenance
program.
Coast Guard project scheduling uses the Critical Path Method (CPM). The typical
planning process for a CG Yard availability begins with a specification detailing the work items
to be completed in the project. The work items are broken down into broad level tasks and
organized into a Work Breakdown Structure (WBS). The WBS is a high level outline of the
sequencing of tasks and is more of a hierarchical guideline than a schedule. During this same
time, estimators look at similar task estimates to determine the quantity of resources needed for
the project. These resources include man-hours for each specific job shop, materials, and support
services. The CG Yard then puts specific task line items and their estimated resource needs into
the scheduling software. The CG Yard uses Oracle’s Primavera P6™ software for their CPM
based scheduling. The version of Primavera (iteration 6) being used by the CG Yard is not user
friendly, is outdated, and does not include an Integrated Master Plan (IMP) where schedulers can
see the impacts of schedule overrun on other projects (B.L. Melvin, personal communication-
email/phone conversation March 31, 2014). These limitations, coupled with new management
practices, make risk assessment difficult and often result in schedule extensions for lower
priority cutters. Priority sequencing is usually politically based, meaning that the cutter whose
mission is of higher importance at that specific time will get the required resources or overloaded
resources to speed up project completion.

4
1.2 Study Goals
The goals of this study are three-fold. First, the estimated required labor (in man-hours)
will be used to develop spreadsheet models of the program. These will be used to determine if
the CG Yard has allocated enough resources to levelly load the project with up to three ships
working in parallel. The results of this analysis will be used to provide appropriate mitigation
strategies to increase the probability that each availability remains on schedule and on budget.
The second goal of the study is to conduct a level-loading study of a single job shop to see how
overtime and overmanning can be minimized to reduce overall project resources. Finally, several
efficiency improvement tools will be proposed for the CG Yard derived from the results of the
first two objectives and prioritized according to implementation feasibility for the organization.
CHAPTER 2
BACKGROUND
2.1 Literature Review
Due to the broad scope of this project, several different areas of interest will be
considered in the literature review. A brief history of scheduling with special emphasis on the
CPM in the military will be discussed followed by the methods available for solving extensions
of the CPM with concurrent projects. Problems with schedule implementation and several
mitigation strategies for reducing schedule risk will be presented as well as an industry example
of improving production in a shipyard job shop.
2.1.1 History of CPM

5
E.I. DuPont de Numours (DuPont) developed the original concept of Critical Path
Method in 1956, when after acquiring his UNIVAC1 computer he decided to use its
computational power to bolster the company’s planning, estimating, and scheduling department
(Weaver 2006). The method, developed by Walker and Kelly, was first used on plant shutdowns
in 1957 to solve the time-cost dilemma. The problem focused on adding resources to certain
tasks to speed up project delivery while minimizing additional costs. Figure 2.1.1 shows direct
and indirect costs and the total costs. In this example, a nine-day duration achieves the lowest
total cost.
Figure 2.1.1 Time-cost tradeoff curve (CPM Tutor 2010).
The data needed for input and subsequent analysis caused engineers and schedulers to
think in a new way. They had to relate subtasks and resources to cost and overall schedule,
therefore it took several months to obtain this data. The computer’s goal was to use linear
programming to constrain sequencing and make solutions feasible using the i-j relationship
between tasks. The ultimate goal was a time-cost tradeoff to find the shortest project duration at
the least cost. DuPont eventually abandoned CPM because a new management staff didn’t see or
understand its value. Catalytic Construction of Philadelphia was the first large industry to use
CPM in the early 1960s. Shortly thereafter, major industries like IBM and H.B. Zachry Company
began to use CPM and precedence in computing. The Navy followed suit with John Fondahl’s

6
research on non-computer approaches to CPM. Future iterations of CPM were discovered with
Program Evaluation and Review Technique (PERT) diagrams and Project software. Even with
the transition to mini or mainframe computers in the 1980s, technology’s involvement was still
limited because computation time was very expensive. A lot of money was invested in training
of the CP Method and manual calculating for schedulers. Scheduling was a highly sought after
trade. Calculations were made manually and then, after several verifications of correctness,
schedules were uploaded to computers. With the dawn of PCs, including the Microplanner and
Primavera software in 1983, scheduling was a skill that anyone who could operate a computer
could handle. The over reliance of computers to schedule projects caused a loss of scheduling
know-how in many industries leading to problems with overall project success. New standards
and scheduling certifications are now being introduced to marry advanced computing technology
with sound judgment of trained professionals.
2.1.2 CPM in the Military and Methodology
The U.S. Navy adopted CPM in 1962 (otherwise called Critical Path Scheduling, Critical
Path Analysis, Least Cost Estimating and Scheduling) for use in construction projects (Fondahl
1961). Computers did most complex CPM problems, but Fondahl was interested in a non-
computer approach. Computer technology in 1962 had many limitations, including high cost,
limited experience, extremely long computation time, and overall lack of access except for large
firms. This method offered a “stepping stone” between manual calculations and computer
methods. Fondahl’s explanation of the method and specific benefits from its use are summarized
in the following paragraphs.

7
Direct costs and time can be balanced to find the best schedule, but project tasks also
have to be divided in several ways with respect to time, which makes this problem very difficult
to solve. Project time, in order to reach minimum cost, needs to be compressed. Speeding up a
project task can then have the negative effect of increasing direct costs as strategies like
overtime, overmanning, advanced equipment, and other expensive methods are utilized. The
problem is further complicated by tasks that have interdependencies and must follow a specific
work sequence. This creates a web of overlapping and interrelated tasks. To determine the task
that needs to be shortened to achieve the lowest cost is not always straightforward either. One
could argue that it is better to shorten a task at great expense than to try and shorten a task
cheaply that requires several other dependent tasks to be shortened. CPM is the systematic
method for making such decisions using a mathematical algorithm. CPM provides five critical
project data points which are: 1) the task that sets the total project duration (the critical path), 2)
the quantitative “float” or “operation scheduling leeway” other tasks possess, 3) the most
economical schedule for a given completion date while considering cost and time, 4) the
completion date that coincides with the lowest cost, and 5) an assessment of how rework or
growth work will impact the overall schedule or individual tasks within a schedule. There are
three phases to the critical path method: Phase 1) Develop a network structure to identify tasks
and their interdependencies on each other to form a sequence, Phase 2) is assigning the time
estimate for each task, and Phase 3) is using computing power to find the time-cost relationships,
review schedule variations, and pinpoint the solution. Phase 2’s time estimate may differ based
on if Phase 3 is implemented. If Phase 3 is omitted, then time estimates (usually estimated in
work days) will be found using standard estimating procedures. However, if Phase 3 is

8
implemented, the time estimate should be input as the schedule that results in the lowest direct
cost for the project (Fondahl 1961).
When beginning this method, one must determine whether the CPM will be used for
resource oriented or time oriented scheduling. Resource oriented scheduling focuses on how to
best use the resources so that they are used most effectively to save time and money. Time
oriented scheduling focuses on determining the shortest project duration (Hendrickson 1989). A
hybrid of the two scheduling techniques is also possible and focuses on resource leveling or
constraining in the presence of sequencing tasks. Heuser and Wynne (1963) used CPM in load
leveling of job shops to reduce lost work time and overtime. The focus was to level the job shops
that are on the critical path and whose resources are fixed (i.e. they cannot be easily performed
by other shops). This reduces the manual work that would be required to level every job shop
within the schedule.
CPM has a language of its own and must be defined to understand the steps and
deliverables. For Phase I, a Work Breakdown Structure (WBS) must be developed to define the
sequential relationships amongst tasks. This can be a simple grouping of tasks in order of when
they begin. However, more advanced visual diagrams are needed to map out the network of
relationships. There are three main diagrams used in traditional CPM: The Activity-On-Arrow,
the Activity-On-Node, and the Gannt Chart (bar chart) diagrams. Activity-On-Arrow diagrams
uses arrow to show sequencing of tasks, where the head of an arrow represents a subsequent task
and the tail represents a preceding task. The tail and head each have a number assigned to
represent its sequence (where head>tail) (Figure 2.1.2). Activity-On-Node also uses arrows, but
the activity is on the node itself and the arrows represent how the nodes are related (Hendrickson
1989) (Figure 2.1.3).

9
Figure 2.1.2 Activity-On-Arrow Diagram (Hendrickson and Au 1989).
Figure 2.1.3 Activity-On-Node Diagram (Hendrickson and Au 1989).
Figure 2.1.4 Gantt Chart example from 87' Bow to Stern Program (CGC IBIS).

10
Gantt Charts (named after Henry Gantt) visually shows the specific tasks that make up a
project against time. A bar that spans some duration of time represents each task/activity (Figure
2.1.4). Gantt Charts are the primary diagram used in project planning. Activity diagrams have
been phased out by precedence flow charts, representing qualitative as opposed to quantitative
relationships. “Float” as mentioned above, can be broken up into free float (the amount of time a
task can be delayed before it delays subsequent tasks) and total float (the amount of time a task
can be delayed before it delays the project completion date) (Hendrickson and Au 1989). The
“crash” time refers to the shortest time that every task can be completed (usually by adding
resources), and this also represents the highest total cost called the all-crash cost (Fondahl 1961).
The normal start refers to the duration of the project that results in the least cost, whereas the all-
crash start refers to the smallest project duration with a higher cost. Constraints, in particular
resource constraints are limitations to labor, equipment, and time within a given project time
frame. Fast tracking is performing activities in parallel to reach a project deadline.
2.1.3 Advanced CPM Problems
Extensions in the CPM are necessary when intra-project scheduling, or scheduling of
concurrent projects occurs. “The fundamental problem involved here is to find some way to
define the many independent and combinatorial restraints involved into account: priorities,
leveling manpower by crafts, shop capacity, material and equipment deliveries, etc.” (Weaver
2006). Risk management, particularly in the early phases of CPM, is crucial for obtaining
reliable schedules. If the estimated task times are not realistic, then the proposed schedule is not
going to lead to project success. Liberatore (2008) uses fuzzy logic to make best estimates for
task durations in the absence of historical data. Fuzzy logic uses a forward and backward

11
algorithm in a project network to “measure imprecision or vagueness in estimation” (Liberatore
2008). Typically CPM uses the likely task duration, PERT tends to underestimate task duration,
and Monte Carlo Simulation can provide a task duration when the data is unreliable. Removing
this uncertainty in estimates is an ideal first step in the CP methodology.
Easa (1989) uses CPM and integer-linear optimization models to minimize the variation
in resources used. The model is applicable in small to medium construction projects with a single
resource and continuous activities. The CPM solutions are interfaced to the model, which holds
the objective function and constraints. The model can be extended to include multiple resources
and provide a trade-off of cost scheduling. Lim et al (2014) also tackles the problem of extended
CPM problems, but with a simulation system. Activities or projects that would normally be
conducted in series are now completed in parallel in order to expedite completion times. Due to
the limitations of scheduling software, Primavera schedules are exported to the Concurrent
Construction Scheduling Simulation System (C2S2). This system is able to calculate rework
probabilities as well as the variability in project completion time and cost by adjusting the
overlap between activities. Greze et al (2014) work on resource-constrained project scheduling
problems with overlapping modes (RCPSP-OM) using the basic premise of CPM while adding
another project layer in parallel. This overlapping of work (or rework) implements a heuristic
that moves the added work to downstream activities while resources are consumed at a constant
rate throughout the schedule. The heuristic also assumes that the duration of rework is known in
advance. The heuristic is used to either minimize project duration (by reducing cost of rework) or
maximize project profits (by trading off between accelerating time and increasing project cost).
2.1.4 Schedule Implementation and Feedback Loops

12
When the proposed schedule is implemented in a project, any number of changes due to
scope growth, rework, or resource adjustments can negatively impact the overall project success
in terms of meeting a deadline and budget. As problems arise in a project, project managers must
close the performance gap by working more or letting the deadline slip. Modifications to project
plans and resources sets off a feedback loop. The different types of feedback loops are
Experience Dilution, Too Big to Manage, Burnout, and Haste Makes Waste loops (Lyneis and
Ford 2007). A closed feedback loop can be reinforcing (negative behavior) or balancing (goal-
seeking behavior). Reinforcing loops can cause a project to reach its tipping point and spin out of
control. “A tipping point is a condition, that when crossed, causes system behaviors to radically
change performance” (Taylor and Ford 2008). Projects become overwhelmed and the workflow
cycle becomes unbalanced.
Changes in a feedback loop can cause secondary and tertiary effects, called ripple and
knock-on effects. Ripple effects and knock-on effects are usually negative consequences and
impact productivity and work quality negatively by increasing the error fraction and rework. The
different type of ripple and knock-on effects include creating out of sequence work (reduced
productivity and increased errors), errors build on errors (reduce quality of downstream work),
errors create more work (rework is more expensive time-wise than original work), and
hopelessness (low morale causes increased errors and lowers productivity) (Lyneis and Ford
2007). Other factors that can compound the ripple and knock-on effects include scope changes,
change orders, poor performance (leading to mistrust and requirements for additional progress
reports), schedule pressure, and potential litigation. Schedule pressure causes work to be done at
a faster pace, increasing risk for poor quality and the need for more rework, increasing the
secondary effects of rework. Management is compelled to act when schedule pressure arises and

13
will try to influence productivity by changing management techniques or adopting a wait and see
strategy. Both techniques have consequences. Increasing staff and focus on design too late in the
game can actually increase rework and decrease productivity. With labor costs representing
about 30% of a total project cost, and 12% of costs being attributed to rework, getting a right
balance is key. (Loushine et al 2006).
When managing the complexities of the feedback loop and follow-on effects, it is good to
understand which has the most serious implications with respect to project resiliency. How to
respond to the consequences is also paramount to getting a project back under control. Projects
are least resilient to rework, followed by ripple effects and sensitivity to schedule pressure.
Projects are most resilient to the project deadline. The solution to taming the rework cycle is to
not overreact when a project’s performance starts to decline. Instead, overtime should be
moderated, workers should be monitored for fatigue, less people should be hired, if hiring occurs
only skilled workers should come onto the job, and staffing should be increased early in the
project and with caution (Cooper 1994).
2.1.5 Schedule Risk Mitigation Strategies
As noted above, mitigation strategies have advantages for improving project performance
if used properly, but also can bring about more reinforcing disadvantages if not monitored.
Mitigation strategies can include overtime, overmanning, creating a multiskilled workforce, and
implementing new tools or procedures. Backlog, or the work that is immediately available to be
completed, should not be too low (two weeks per person) or too high (over four weeks) (Levitt
2009). Too low of a backlog results in slowing down work pace and can indicate overmanning,
while too high of a backlog indicates overtime is needed. Having some overtime built into a

14
project (approximately 3-9%, with a 6% target) indicates that the crew size is appropriate (Levitt
2009). On average construction workers are unproductive 40-60% of their day and 11% of
project time is spent on rework (Loushine et al 2006). An average 8-hour shift might actually
only produce 6-6.5 hours of work due to meals, breaks, and meetings (Levitt 2009). Overtime in
construction is defined as working over 40 hours per week, or over eight hours per day according
to Brunies and Emir (2001). The literature on impacts of prolonged overtime on project
performance are mixed in their views, mostly because of the lack of industry-specific or even
project-specific studies available. Many authors even question the soundness of several studies
that have been conducted on overtime’s effects on productivity. The problems with many of
these studies are that the data, namely efficiency loss charts, is unoriginal or outdated, and much
of the data has been reprinted or reused inappropriately (Brunies and Emir 2001). Singh (2003)
details how overtime techniques are used when project schedules become compromised using an
Army Corps of Engineer efficiency loss study from the 1960s. In this case, overtime, when used
regularly or in excess had a negative consequence on work efficiency. Furthermore, Singh
outlines how to use overtime efficiency curves to calculate the number of workers needed for
overtime by including the efficiency losses due to overtime. Calculating efficiency loss is an
iterative process and oftentimes is not conducted at job sites. By obtaining these industry-specific
details, organizations can more appropriately assign workers to overtime. Sonmez (2007)
conducted a similar efficiency study on a construction project involving concrete pouring,
forming, and finishing, noting anywhere between 8% and 22% productivity loss due to factors
like fatigue, increased absenteeism, and low morale. However, it was also noted that moderate
levels of occasional overtime do not significantly impact productivity. Overtime, if not used
properly, can impact the feedback loop negatively. Working extended overtime may seem like
15
the answer to getting back on schedule, but the secondary effects of overtime on the feedback
loop can add up to reduce and even negate the extra output hours gained.
Shift work, is defined by the National Institute of Occupational Safety and Health as
“working outside normal daylight hours” (Hughes and Stone 2004). Shift work can be evening
shifts, night shifts, rotating shifts, or split shifts. The shifts that have the biggest negative
influences on work performance due to fatigue, sleep loss, and sleepiness are the night shift and
rotating shifts (Hughes and Stone 2004). Jamal and Jamal (1982) studied the work performance
of manufacturing laborers on fixed or rotating shifts. Those on fixed shifts (highly routine
oriented) had better job performance and motivation than their counterparts on a rotating shift
(low routine oriented). Lagodimos and Mihiotis (2006) weigh the costs associated with no
overtime, full overtime, or adding additional shifts by using linear optimization to minimize
overall labor costs. The optimal value for each scenario varies for the workload of that day. For
example, it is better to use one shift (versus two shifts) if the remaining work (past one shift) is
significantly less than a full shift’s work. In other words, it is less costly to utilize overtime for
one shift than to add an additional shift where workers will be underutilized. This is assuming
that the total workforce needed while utilizing overtime is reduced. Furthermore, the use of
overtime plus an additional shift (if needed) can also reduce overall labor costs due to the
improved manpower utilization.
When overtime fails, managers start hiring new people or use subcontractors. Hiring
additional workers can introduce lower skills and experience levels, requiring more time for
managers to train and increasing the chance for rework. Having too large of a workforce can
increase errors and reduce productivity due to poor communication and congested workspace
(Lyneis and Ford 2007, Cooper 1994, Singh 2003). With hiring low skilled workers, another

16
effect comes into play: secondary effects of low-quality work. Low quality work increases
rework, even more than the original work’s rework contribution. For this reason, additional
supervision is required when overmanning a project.
Wang et al (2009) detail one of the strategies for improving workforce capabilities,
namely the multiskilled workforce. The study used correlation and cluster analysis to determine
if multiskilling increases productivity, quality, and continuity of work. The results of the cluster
analysis showed that craft skills (like job shops) could be grouped into civil, mechanical,
electrical, and general support work. The motivation behind becoming multiskilled is to increase
functionality, not to prolong employment. Burleson et al (1998) defines several multiskilling
strategies and determines their impact on required workforce, turnover/absenteeism, earning
potential, productivity, job satisfaction, and innovation/technology implementation within the
construction industry. Four types of multiskilling strategies were defined and evaluated in this
study: Dual Skill, Four Skills, Four Skills-Helpers, and a Theoretical Maximum Labor Strategy.
Dual Skill groups two different skills together based on the number of workers needed and the
timing of the need, ignoring their craft identifiers. Four Skills groups the crafts into four broad
categories: civil/structural, general support, mechanical, and electrical workers. Four Skills-
Helpers strategy uses the same categories, but uses unskilled laborers as helpers for the skilled
laborers. This strategy allows unskilled laborers to experience a wide range of skillsets at a time
in their career where they can be broadened prior to attending trade schools. The results indicated
that the Four Skills-Helpers strategy was the most successful, producing total labor cost savings
of between 5% and 19%. The required workforce was reduced by 35% and employment duration
increased 47%. Some of the barriers for implementing the multiskilling strategies include the
challenge of changing the culture of the industry, including hiring, compensation, staffing, and

17
project management practices. The availability of training and the difference in implementation
between maintenance and new construction may be different.
Mayer et al (2008) experiment with implementing Jobshop-Lean through a change from a
process layout to a cellular layout in the Navy’s Southeast Regional Maintenance Center
(SERMC). The SERMC is a ship repair facility that has individual shops based on trade skills.
This type of layout suits organized trades, but also incurs many of the eight wastes identified
through the Toyota Production System (or Lean). Transportation and operator motion wastes are
very common with job shops, as they are not collocated with the project. Jobshop Lean is a
version of Lean that is useful for high-variety low-volume facilities like SERMC. Cellular
layouts are ideal for grouping dissimilar machines with varying capabilities in one location. The
conversion of process layout to cellular layout requires a large capital investment and is not a
viable option for many established shipyards. Focused factories and virtual cells are alternatives
to the typical cellular layout. Focused factories are made in order to focus a company’s
manufacturing processes on a set of chosen products based on the company’s strategy,
technology, or economics. Virtual cells remove the need to collocate machinery into one area
and instead dedicate tools, parts, and people into a cell. Capital investment requirements are
limited, however the identified wastes are not removed. Communication and information flows
precede material flows, and therefore are a major cause of delays. Electronic communications are
essential for allowing just in time (JIT) deliveries in a virtual cell. “Simulation results showed
that implementing either physical cells or virtual cells based on the different families of repair
jobs could improve job turnaround times” up to 37-82% (Mayer et al 2008). The many
challenges of implementing virtual cells include cross training, redistributing machinery, and

18
increased IT-supported communication devices. The advantages of implementation, however,
include increasing throughput and decreasing lead-time and cycle time.
2.1.6 Effects of Learning Curves
Due to the assembly line nature of the 87’ Bow to Stern Program, it should be expected
that a learning curve will develop with time as the laborers become more familiar with the
platform and adapt sequencing to achieve greater efficiencies. Learning curve gains are achieved
by progressing along a curve or by skipping to a new, more favorable curve. Movement along a
curve is linked to Continuous Improvement and Six Sigma, whereas jumping curves is linked to
Theory of Constraints.
Different levels of learning can occur at the research, development, design, materials,
components, subsystems, product (system), use, maintenance, and end-of-life utilization stages
(Linton and Walsh 2013). Ash and Smith-Daniels (1999) look at the impacts of learning,
forgetting, and relearning (LFR) on project completion time when preemption (or an interruption
of a task) occurs. A penalty toward learning curve progress is applied because the continuous
learning process is interrupted. The goal was to see if LFR in multi-project settings without this
penalty leads to poor decisions, increased project time, and poor resource utilization. The results
show how total project time increases due to the forgetting and relearning periods. There is also a
high correlation between learning and forgetting rates. Some studies have shown a common
forgetting rate of 26% for one month of time. Direct learning (or learning by doing) accounts for
38-46% of production cycle time reduction and indirect learning (or transfer of knowledge)
accounts for 14-18%. Furthermore, knowledge acquisition is dependent on the number of units
produced whereas knowledge depreciation is dependent on accumulated knowledge and the time

19
elapsed between when knowledge is acquired and when it is utilized (Kim and Seo 2009).
Boucher (1987) provides an analysis of the relationship between learning, assembly line design,
and labor productivity. Learning can be accomplished through repetitive task learning or through
creating multiples of the same product through production progress function. The results show
that in deciding between an assembly line or single worker completing a product, “relative
productivity increases with increasing division of labor” (Boucher 1987). Also, for manual
production tasks, twice the number of individual workers would be needed to get the output of an
assembly line with four stations. Learning rate, which was assumed to be constant, changes with
fluctuations in cycle time or task length (decreases with increasing cycle time), job satisfaction
or motivation (increases with increasing motivation), and lot size (higher learning rates are
required for decreasing lot sizes for individual workers compared to assembly lines).
2.1.7 Similarities and Differences to Line Balancing
In manufacturing, the use of assembly lines allow for greater efficiencies in time and use
of resources. The CG Yard 87’ Bow to Stern Program could be looked at as an offset parallel
assembly line, but it differs greatly from standard assembly lines and therefore typical line
balancing solutions may not be appropriate for this example. Scholl et al (2008) uses knowledge
of the simple assembly line balancing problem (SALBP) to look at the solvability of the
sequence-dependent assembly line balancing problem (SDALBP). SALBPs are good for high
volume of one homogenous product with set resources and cycle times for a serial line layout of
multiple stations. The SDALBP is more complicated as there is a precedent relation for tasks.
Sometimes the precedent is a technological requirement (no way of working around it) or
because it is assumed to be a more efficient ordering of tasks (mathematically solved). The

20
interaction between tasks can be unidirectional (i only affects j) or bidirectional (i affects j and j
affects i). Precedence graphs are used to show these relationships in an assembly flow.
Optimizing task time, or the sum of all task times plus the minimum interacting task time, is the
goal of the ALBP. The SDALBP, which if feasible is NP-hard (nondeterministic polynomial
time), can be generalized to a SALBP by setting all interactions to zero. An SDALBP can also be
simplified to a SALBP through relaxation (setting a lower bound) and transformation (setting an
upper bound) and each solvable SALBP’s feasible or optimal solution is also a feasible (but not
necessarily optimal) solution for SDALBP. The solutions to the SALBP are inputs to the
modeling software (SALOME) to solve the SDALBP problem. Optimal solutions are found
when interaction pairs are high, but standard models do poorly with more than 30 tasks. Overall
however, about half of the SALBP solutions are SDALBP-infeasible. This infeasibility increases
with increased task time increments and underestimates total number of stations.
Overestimations can lead to wasted resources, therefore it is better to model precedence
relationships (Scholl et al 2008).
Gokcen et al (2006) detail proposed procedures for balancing parallel assembly lines with
the goals of minimizing worker stations and idle time. Assembly lines must have a total task time
less than or equal to the total cycle time as well as follow the appropriate sequencing. There are
two types of assembly lines, the traditional and U-type, which can deal with single and
multi/mixed products. Multiple assembly lines can be beneficial during high demand periods,
assuming the resources are available, and prevent production failures in the event of an assembly
line crash. The authors propose a procedure to balance parallel lines by assuming one product per
assembly line, with known precedence diagrams and known task times, in which the workers are
multi-skilled and interchangeable, and tasks can be worked on each side of the line. The passive

21
procedure is the case where two assembly lines are producing the same products, the active
procedure is the case where similar or different products are being made in multiple parallel
lines, and finally when task time varies between lines. All three examples are solved theoretically
and numerically. Of the 95 problems in this study (1-30 tasks) with known optimal solutions
(found by other methods), 44 were solved using the mathematical model. The established
procedure proved efficient to use when more than one assembly line requires balancing.
Brown et al (2002) detail a cost minimizing optimization model, called PROFITS, for
plant-line scheduling of multiple product package items over a multi-week planning horizon for
the Hidden Valley Company. The goal of the optimization model was to aid schedulers in
developing a better schedule while reducing time and cost. Optimization models often times do
not produce ideal schedules because they must make broad assumptions and rely on heuristics to
fine tune the final product. The PROFITS model takes into account resource limitation as well as
sequential and parallel work dependencies. The model is capable of producing schedules quickly,
but requires schedulers to fine tune details and implement rules of thumb to create a finished
final production schedule.
2.1.8 Industry Example
NASSCO is a shipbuilding facility located in San Diego California. The shipyard was
searching for ways to improve the efficiency of the production flow and sequencing of products
given the difficult circumstances of producing ships (low material utilization and high
inventory/work in progress). NASSCO wanted to improve the pipe shop’s manufacturing line by
optimizing flow while taking into account individual process times, work station capacities,
engineering design, schedule changes, and level loading of shops. The shipyard looked to their

22
counterparts in Japan at Kawasaki Heavy Industries’ shipyard who had implemented pipe spool
fabrication practices with dynamic nesting of pipe materials. The process to implement a similar
program at NASSCO included conducting a feasibility study, creating a detailed application
specification for the system (which included data flow requirements between scheduling and
parts databases/spreadsheets, business process changes, and operator interfaces/report), and
developing evaluation factors for initial implementation and future operations. The goals of the
improved pipe component routing and nesting were to be more flexible with work plan changes
and schedule changes, and to keep level shop loading. NAASCO interfaced their scheduling
system, product design software, and a newly created Pipe Shop Management System (PSMS).
The material resource requirements (current and future) were input either manually by schedulers
or automatically by an algorithm into an excel file that was automatically bound to the
management system. The software was capable of taking planning data for two weeks out and,
using averaging and work-content-based families (for different pipe spools), schedule the
number and type of pipe spools to be created in a given week. Weekly plans were then level
loaded using the PSMS for more predictable work schedules and part production. After
implementation, NASSCO’s pipe shop observed several performance benefits including reduced
planning labor, reduced work in progress (WIP) and scrap remnants, and increased production
efficiency (General Dynamics-NASSCO 2008).
2.2 Hypotheses
The CG Yard will face potential delays due to excessive loading of resources, particularly
for the paint shop. This will be shown through an analysis of the WBS sequencing and task
duration estimates plotted over time for multiple, overlapping availabilities using spreadsheet

23
modeling. Due to the inflexibility of the schedule and the potential for schedule risk, viable
mitigation strategies will need to be established and prioritized based on their usefulness and
feasibility to the CG Yard. By level-loading a single job shop, resource costs can be reduced by
creating more predictable job shop schedules and reducing overtime needed. The CG Yard’s
standard management practices and their available scheduling software can be improved by
better methods and software. The CG Yard can reduce the need for schedule risk mitigations
strategies and guesswork by implementing an Integrated Master Plan and risk management
techniques into their scheduling and estimating departments. Finally, due to the CG Yard’s high
fluctuation of management personnel due to the active duty job rotation, lessons learned from
current and previous projects or programs will be difficult to implement, but will be necessary
for future project success.
CHAPTER 3
DATA ANALYSIS
The CG Yard’s Industrial Small Boat and Patrol Boat Product Line Asset Program
Manager, Lieutenant Commander Miles Randall provided the data needed for analysis. Raw data
was transmitted via email and taken from the CG Yard’s scheduling and estimating databases
(M.R. Randall, personal communication-email September 15, 2014). The raw data includes the
37 work item specification, the list of CG Yard Job Shops with the available labor resources for
the program, the original Gantt chart, the sequencing plan in a Work Breakdown Structure
(WBS), and the Section B that has all estimated man-hours per job shop, material costs, as well
as estimated costs (U.S. Coast Guard Industrial Yard, 2014-2015).
24
Prior to beginning the Bow to Stern Program, the lead estimator Raymond Dix laid out
the proposed schedule and pointed out what is typical of an 87’ project and where there may be
concern for the Bow to Stern Program. The original schedule was for a 9-week availability, with
9,050 man-hours (8,008 definite hours) in 40 work items. He predicted needing the 25.1 (22.2)
laborers per day to complete this project (R.L. Dix, personal communication-email September
13, 2014). Normally, an 87’ availability would not exceed 20 people per day due to crowding on
the vessel, so he proposed an 11.3-week availability. If only definite items were to be completed,
the standard 10-week availability would suffice given limited growth. Any activation of an
option item would extend the schedule 1-2 weeks. As for the paint shop, Mr. Dix predicted
needing 7 painters per day in 9-weeks or 6.25 painters per day in 10-weeks (for the given 2,496
man-hours estimated). A typical 9-week availability would only require 1,080 man-hours (1,200
for 10-weeks). To reduce overcrowding, three painters per day maximum would be ideal. The
use of two shifts would allow the three people per shift and meet the 9-week time frame, but it
would be extremely tight. The CGC IBIS’ availability was scheduled for 10 weeks with the
hopes of reducing the necessary timeframe to 9 weeks by the fifth availability, CGC
POMPANO. A 60-day (8.5-week) availability is the ultimate goal of the program.
The first five Coast Guard cutters (CGC) and their schedules are listed below in Table
3.1. After project completion, each cutter will have all of their data accessible through the project
management online tool called Contract Workbook Database. From here, a myriad of documents
can be obtained to see weekly project status, final cost reports, schedule changes, etc.

25
Cutter Name Scheduled Maintenance Availability CGC IBIS 04 November 2014 – 14 January 2015 CGC STINGRAY 30 November 2014 – 11 February 2015 CGC HAMMERHEAD 05 January 2015 – 24 March 2015 CGC BLUEFIN 01 February 2015 – 08 April 2015 CGC POMPANO 09 March 2015 – 17 May 2015
Table 3.1 Program Schedule for First Five Availabilities.
The Revision-0 specification (Rev0 final specification) is the legally binding contract
between the Coast Guard and the CG Yard. It details all the work to be completed and includes
references to more specific technical specifications and drawings. Work items are defined as
either being definite (work will be completed no matter the condition of the cutter) or optional
(work will be completed dependent upon the condition of the cutter). The specification says
“what” is to be completed, not “how”. The sequencing of work, given knowledge of how a ship
is assembled can be derived from the specification. The list of work items from the Rev0
specification for the 87 Bow to Stern Program is located in Figure 3.1 (Nakoa 2014).

26
TABLE OF CONTENTS Revisions Record ...................................................................................................................................................... iii!Consolidated List of References ............................................................................................................................... iv!Consolidated List of Government-furnished Property ............................................................................................. vii!Consolidated List of Critical Inspection Items ......................................................................................................... ix!Principal Characteristics ............................................................................................................................................. x!General Requirements ................................................................................................................................................. 1!WORK ITEM 1: Hull Plating (Side Scan), Ultrasonic Testing ................................................................................ 20!WORK ITEM 2: Ultrasonic Thickness Measurements, Perform ............................................................................. 24!WORK ITEM 3: Bilge Surfaces (Lazarette), Preserve (“100%”) ............................................................................ 27!WORK ITEM 4: Bilge Surfaces (Engine Room), Preserve (“Partial”) .................................................................... 30!WORK ITEM 5: Dirty Oil Tank, Clean and Inspect ................................................................................................ 33!WORK ITEM 6: Oily Water Tank, Clean and Inspect ............................................................................................. 36!WORK ITEM 7: Tanks (MP Fuel Service), Clean and Inspect ............................................................................... 39!WORK ITEM 8: Tanks (Potable Water), Clean and Inspect .................................................................................... 43!WORK ITEM 9: Depth Sounder, Capastic Fairing, Renew ..................................................................................... 46!WORK ITEM 10: Main Engine/Reduction Gear, Realign ....................................................................................... 49!WORK ITEM 11: Intermediate Water-Lubricated Propulsion Shaft Bearing, Renew ............................................ 52!WORK ITEM 12: Aft Water-Lubricated Propulsion Shaft Bearing, Renew ........................................................... 55!WORK ITEM 13: Intermediate Bearing Carrier, Renew ......................................................................................... 58!WORK ITEM 14: Aft Bearing Carrier, Renew ........................................................................................................ 60!WORK ITEM 15: Stern Tubes, Interior Surfaces, Preserve 100% .......................................................................... 62!WORK ITEM 16: Propellers, Renew ....................................................................................................................... 65!WORK ITEM 17: Main Diesel Engine Exhaust Lagging and V-Bands, Renew ..................................................... 68!WORK ITEM 18: Sea Water System, Perform Maintenance .................................................................................. 70!WORK ITEM 19: Rudder Assemblies, Renew ........................................................................................................ 74!WORK ITEM 20: Stern Launch Door, Remove, Inspect and Reinstall ................................................................... 78!WORK ITEM 21: Grey Water Holding Tank, Clean and Inspect ............................................................................ 82!WORK ITEM 22: Sewage Holding Tank, Clean and Inspect .................................................................................. 85!WORK ITEM 23: Grey Water Piping, Clean and Flush .......................................................................................... 88!WORK ITEM 24: Sewage Piping, Clean and Flush ................................................................................................. 92!WORK ITEM 25: U/W Body, Preserve (100%) ...................................................................................................... 96!WORK ITEM 26: Hull Plating Freeboard, Preserve -“100%” ............................................................................... 101!WORK ITEM 27: Main Mast, Preserve, 100% ...................................................................................................... 105!WORK ITEM 28: Superstructure, Preserve “100%” ............................................................................................. 109!WORK ITEM 29: Cathodic Protection / Zinc Anodes, Renew .............................................................................. 112!WORK ITEM 30: Drydocking ............................................................................................................................... 115!WORK ITEM 31: Temporary Services, Provide .................................................................................................... 119!WORK ITEM 32: Sea Trial Performance, Support, Provide ................................................................................. 122!WORK ITEM 33: Install Stainless Steel Hull Inserts and Renew BMDE Concentric
Rings .................................................................................................................................................... 126!WORK ITEM 34: Decks – Exterior (Main Deck), Preserve .................................................................................. 128!WORK ITEM 35: Shaft Seal Piping System, Renew ............................................................................................. 132!WORK ITEM 36: Propulsion Shafts, Renew ......................................................................................................... 135!WORK ITEM 37: Speed Log Skin Valve, Renew ................................................................................................. 141!
Figure 3.1 Excerpt from Rev0 Specification Listing Availability Work Items.

27
The CG Yard industrial workforce is composed of 416 wage-grade unionized laborers
that work for varying job shops. The job shop’s labor capacity is divided amongst the ongoing
projects based on priority and schedule. Table 3.2 lists the job shops by title and their area of
expertise (CG Yard Website 2014). For the 87’ Bow to Stern Program, the CG Yard estimated
needing 25.1 people per day for both definite and optional work items or 22.2 people per day for
definite items only. The other labor/schedule restriction for the project is that every job shop,
with the exception of the paint shop (X-42), will be working single shifts (8 hours) on weekdays
with overtime contingent upon growth work or rework. The paint shop will work double shifts
and weekends/holidays. Six workers will be available for the overtime work (3 painters per
shift). The CG Yard follows the federal holiday schedule and typically no work is conducted on
those days.
Table 3.2 CG Yard Job Shops.
!Shop Number Description
X-11 Shipfitting/Structural X-12 Sheetmetal X-13 Welding/Structural X-14 Woodworking/Firewatch X-21 Pipe Shop X-22 Inside Machine Shop (Lathes, etc.)
X-23 Outside Machine Shop/Marine Machine (Propulsion, Shafting, etc.)
X-24 Engine Shop X-31 Electrical Shop X-32 Electronics Shop X-33 Ordnance Shop X-41 Paint/Blast X-42 Paint Shop X-43 Rigging (Cranes, Forklifts, etc.) X-44 Drydock (Cradle Prep, Docking, etc.) X-60s Support/Engineering

28
The original Gantt chart was developed with the standard management practices in mind.
Approximately three months prior to the program start, the management team decided to adopt a
new practice for the first 87’ cutter IBIS. The plan was to scrap the scheduler’s developed Gantt
chart and allow the job shop foremen to sequence work as they progressed through the work
items. This would allow the maintenance experts the flexibility to craft the best methods of
sequencing instead of following a scheduler’s detailed plan. As is the case with the CG Yard, the
foremen are busy year-round and do not have the time to work with the schedulers to fine-tune
each cutter’s schedule. By using the first cutter as a prototype schedule, and capturing the data
for work-item sequencing and actual man-hours expended, the schedulers could then fine-tune a
new Gantt chart for the following cutters.
The Work Breakdown Structure provided by the CG Yard program manager and the shop
foremen, defines a sequencing plan for CGC IBIS. It is a general plan that highlights the major
work item requirements in a calendar timeline. The broadness of the schedule allows the foremen
to adapt to unforeseen complications during the first run of the contract. This characteristic of the
schedule also complicated the procedure of level loading resources for this study, as several
assumptions needed to be made about detail work sequencing even after referencing the
specification. The IBIS WBS schedule is shown in Table 3.3.

29
Table 3.3 Work Breakdown Structure Timeline for CGC IBIS.
The Section B is a document created by the Estimators that has all estimated man-hours
per job shop, material costs, as well as estimated costs. This document was used to pull all of the
man-hour data per task into the resource-loading timeline. It was not disclosed whether or not the
estimators built in a cushion to these estimates. It is unknown whether or not these deterministic
values represent the minimum, average, maximum, or any value in between of the labor required.
Monday 11/3 Tuesday 11/4 Wednesday 11/5Thurs 11/6 -COB
Wed 11/12 Thurs 11/13Friday 11/14-
COB Sat 11/22 Sunday 11/23Sunday 11/23-
Tues 12/02
Ride in & Pre-op test
Measures propulsion shaft shims and pre-
docking propulsion shaft hub
alignment (23) Work Item 36 Drydock Cutter
Seal Enclosure Install Temp
ServicesBlast 100% & Prime UWB
Commence Side Scan
Gray Water & Sewage Pipe Flush (To be coordinated w/side
scan- s/s work hours start at 1500)
Remove liquid loads (CTR)
Clean Bilges/Tanks (CTR) Marine
Chemist/ Gas Free Cert.
Mobilize Blast Equipment Blue Fit Props
Remove Bilge and Lazarette
interferences
Pull TLIs
Remove mast interferences, coil up cables, protect coiled up cables
Bearings/RedGear Optical Alignment
Prep Sea Valves for Install
Install Shaft bearings
Open Fuel, Sewage, Dirty Oil,
Waste Oil, and Grey Water Tanks
Remove Sea Valves & Speed
Log Valve Complete Mast
ModsRemove
underwater appendages
Rudders, Shafts, Props
Remove Stern Door & Notch
PadsCommence Cover-
Ups
Mon 12/01-COB Wed 12/10
Thurs 12/11-COB Tues 12/16
Wed 12/17-COB Mon12/29 Tues 12/30
Wed 12/31-COB 1/02
Mon 1/05-COB Thurs 1/8
Fri 1/09-COB Tues 1/13 Wed 1/14
Prep/paint CutterInstall
Interferences Open Structure Undock VesselTake Final Face
Readings Dock Trials Crew ArrivesEOIW- Cutter
Departs
Capastic Fairing Load Sea Valves Notify Crew of Reporting Date Refuel Vessel Elex Testing Outfit Onload
* Night Shift X-42* Paint ER Bilge
& Lazarette Install Mast Fill P/W TanksClean Vessel
(CTR) Sea Trials
Install Hull ZincsInstall U/W Appendages Load Small Boat Final Walk-Thru
Lay Deck Pads
Install Sea Valves and Speed Log
Valve
Shaft Seal Piping Install
Install Lagging

30
The estimators do not use historical data to their full advantage, which has caused under and
overestimations. An estimate will be generated based upon the number of workers needed per
task and their likely duration. This data is used over and over without ever being updated by the
actual man-hours expended. The values being reused are more of a best approximation and do
not account for the fact that task duration has a distribution. The deterministic values were used
in the level-loading scenario, which may be a limitation to the analysis as the required man-hours
for each cutter will be stochastic in reality. The deterministic values, however, will give a
reasonable assessment of reality given that the foremen and laborers that oversee and complete
these tasks on a daily basis submitted the man-hour estimates to the estimators. With the use of a
distribution of task duration times, the CPM would be more robust and result in more accurate
schedules. A sample work item estimate (called a CLIN estimate) is provided in Figures 3.2 and
3.3.
Figure 3.2 Example CLIN Work Item Estimate for Bow to Stern Program. Job shops listed across top columns with labor
rate, subtasks with duration estimates in each row.

31
Figure 3.3 Zoomed-in example CLIN Work Item Estimate for Bow to Stern Program. Job shops listed across top columns with labor rate, subtasks with duration estimates in each row.
CHAPTER 4
METHODOLOGY
4.1 Experimental Design
In order to determine if the estimated number of man-hours could be completed in the
allotted time schedule and in such a way that the job shops would be working equally loaded
workdays (one 8-hour shift), an Excel Workbook with several spreadsheet models was designed
to enter man-hour, schedule, and sequencing data. Each job shop is listed in its own row,
calendar dates are listed in each column (based on first availability November 1st – January 14th),
and man-hours are filled in the corresponding row/column. This was first done on a micro scale
for each job shop and then filled in a final worksheet containing all data points. Spreadsheet
modeling in Excel is an appropriate method for evaluating raw data when advanced software is
not available due to economic and skilled-user restrictions. This type of modeling can be time
consuming, however, explaining why the CG Yard planning team did not conduct it themselves.

32
The next section will detail the procedures needed in order to get the raw data into a meaningful
schedule and showcase the important analysis and results of spreadsheet modeling.
4.2 Procedures & Assumptions
Given the scheduling and estimate data from the CG Yard, the applicable data had to be
compiled into one spreadsheet to determine if the project could be level-loaded. In this process
several assumptions were made in order to make progress. The sole variable used in the analysis
is man-hours.
The workbook was organized to create a tab for each job shop. With the aid of the CLIN
estimates, Rev0, and WBS, each work item was evaluated and the man-hour data was placed
within a range of dates the work would most reasonably be completed in. The ranges of dates for
specific work were taken from the work sequencing WBS where the CG Yard foremen and
program manager had grouped work that would be done in parallel. Some dates were single
days, such as for docking and undocking the ship, but others were broken into one or two week
periods (Refer back to Table 3.3). The WBS does not schedule work over weekends or holidays,
so it was assumed that no work would take place at that time with the exception of the paint shop
(X-42) as determined by the CG Yard. The CLIN estimates have very specific tasks to be
completed and many of these subtasks were not defined in the WBS. Therefore, the dates for
these subtasks were not obvious. To account for this, the Rev0 specification and previous Naval
Engineering knowledge was used to make a best guess on how the work was to be sequenced.
Table 4.2.1 shows an example of a completed job shop’s initial breakdown of man-hours per
time period.
33
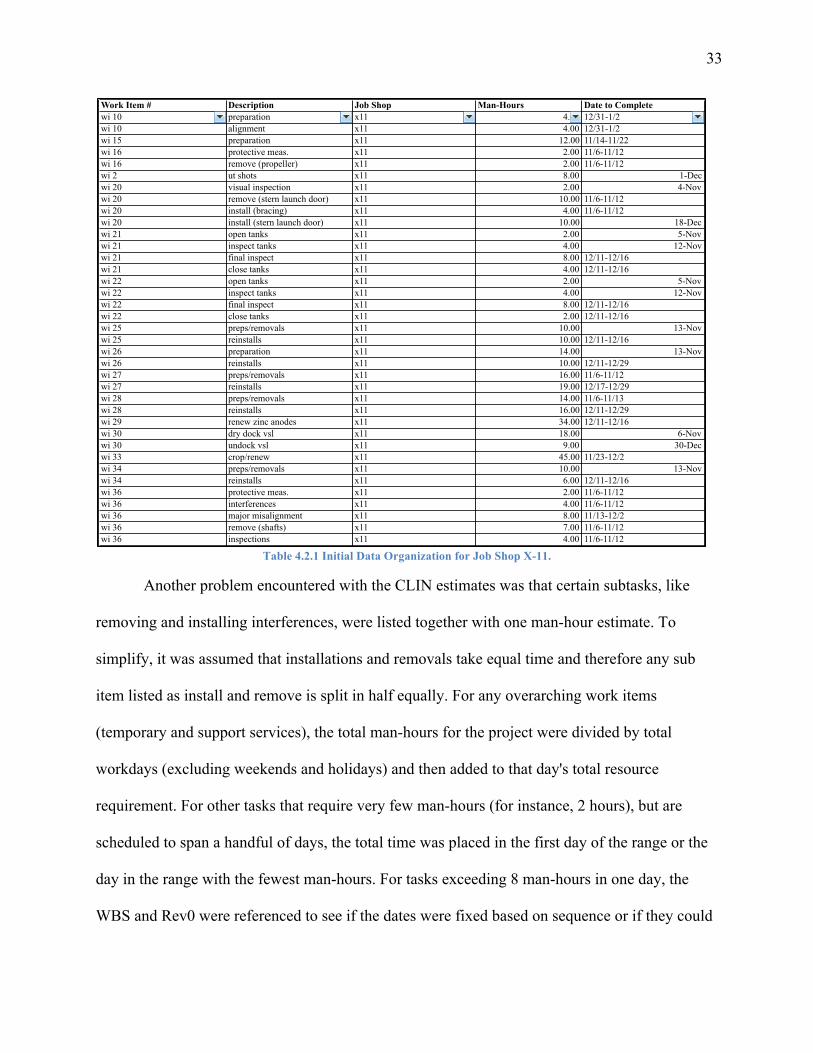
Table 4.2.1 Initial Data Organization for Job Shop X-11.
Another problem encountered with the CLIN estimates was that certain subtasks, like
removing and installing interferences, were listed together with one man-hour estimate. To
simplify, it was assumed that installations and removals take equal time and therefore any sub
item listed as install and remove is split in half equally. For any overarching work items
(temporary and support services), the total man-hours for the project were divided by total
workdays (excluding weekends and holidays) and then added to that day's total resource
requirement. For other tasks that require very few man-hours (for instance, 2 hours), but are
scheduled to span a handful of days, the total time was placed in the first day of the range or the
day in the range with the fewest man-hours. For tasks exceeding 8 man-hours in one day, the
WBS and Rev0 were referenced to see if the dates were fixed based on sequence or if they could
Work Item # Description Job Shop Man-Hours Date to Completewi 10 preparation x11 4.00 12/31-1/2wi 10 alignment x11 4.00 12/31-1/2wi 15 preparation x11 12.00 11/14-11/22wi 16 protective meas. x11 2.00 11/6-11/12wi 16 remove (propeller) x11 2.00 11/6-11/12wi 2 ut shots x11 8.00 1-Decwi 20 visual inspection x11 2.00 4-Novwi 20 remove (stern launch door) x11 10.00 11/6-11/12wi 20 install (bracing) x11 4.00 11/6-11/12wi 20 install (stern launch door) x11 10.00 18-Decwi 21 open tanks x11 2.00 5-Novwi 21 inspect tanks x11 4.00 12-Novwi 21 final inspect x11 8.00 12/11-12/16wi 21 close tanks x11 4.00 12/11-12/16wi 22 open tanks x11 2.00 5-Novwi 22 inspect tanks x11 4.00 12-Novwi 22 final inspect x11 8.00 12/11-12/16wi 22 close tanks x11 2.00 12/11-12/16wi 25 preps/removals x11 10.00 13-Novwi 25 reinstalls x11 10.00 12/11-12/16wi 26 preparation x11 14.00 13-Novwi 26 reinstalls x11 10.00 12/11-12/29wi 27 preps/removals x11 16.00 11/6-11/12wi 27 reinstalls x11 19.00 12/17-12/29wi 28 preps/removals x11 14.00 11/6-11/13wi 28 reinstalls x11 16.00 12/11-12/29wi 29 renew zinc anodes x11 34.00 12/11-12/16wi 30 dry dock vsl x11 18.00 6-Novwi 30 undock vsl x11 9.00 30-Decwi 33 crop/renew x11 45.00 11/23-12/2wi 34 preps/removals x11 10.00 13-Novwi 34 reinstalls x11 6.00 12/11-12/16wi 36 protective meas. x11 2.00 11/6-11/12wi 36 interferences x11 4.00 11/6-11/12wi 36 major misalignment x11 8.00 11/13-12/2wi 36 remove (shafts) x11 7.00 11/6-11/12wi 36 inspections x11 4.00 11/6-11/12

34
be broadened. Some tasks exceeding 8 hours per day were extended into the next day or
following week and for other tasks that would become out of sequence if expanded, it was
assumed the extra man-hours would be covered by an increase of resources in that job-shop.
After entering man-hours into dates for all tasks and job shops, the Rev0 specification was
reviewed again to make sure that there weren’t any obvious tasks missing from the CLIN
estimate spreadsheet. Only a handful of missing items were found and their man-hours were
added to the spreadsheet. After this initial organization, a chart was made of the man-hours onto
a calendar. To do this, all of the man-hours for each date or range of dates were summed up and
then divided by the number of workdays in that range. To ensure the numbers were true to the
CLIN estimates, work hours in the man-hour column as well as in the calendar portion were
summed to verify they were the same. In order to see the total impact of parallel work from
subsequent availabilities, the data from the first availability was copied into the schedule for the
second and third availabilities. From this point, more adjustments had to be made to the man-
hours because when transferred, man-hour data filled into weekends or holidays. Once all three
availabilities were overlapped on one schedule, their columns were summed to calculate the total
number of man-hours required to stay on schedule. Man-hours per shop over time were then
plotted (04 November 2014 to 14 January 2015 when three cutters were being overhauled).
Figures 4.2.1 and 4.2.2 shows shop X-11’s schedule for the first three availabilities, CGC IBIS,
CGC STINGRAY, and CGC HAMMERHEAD.
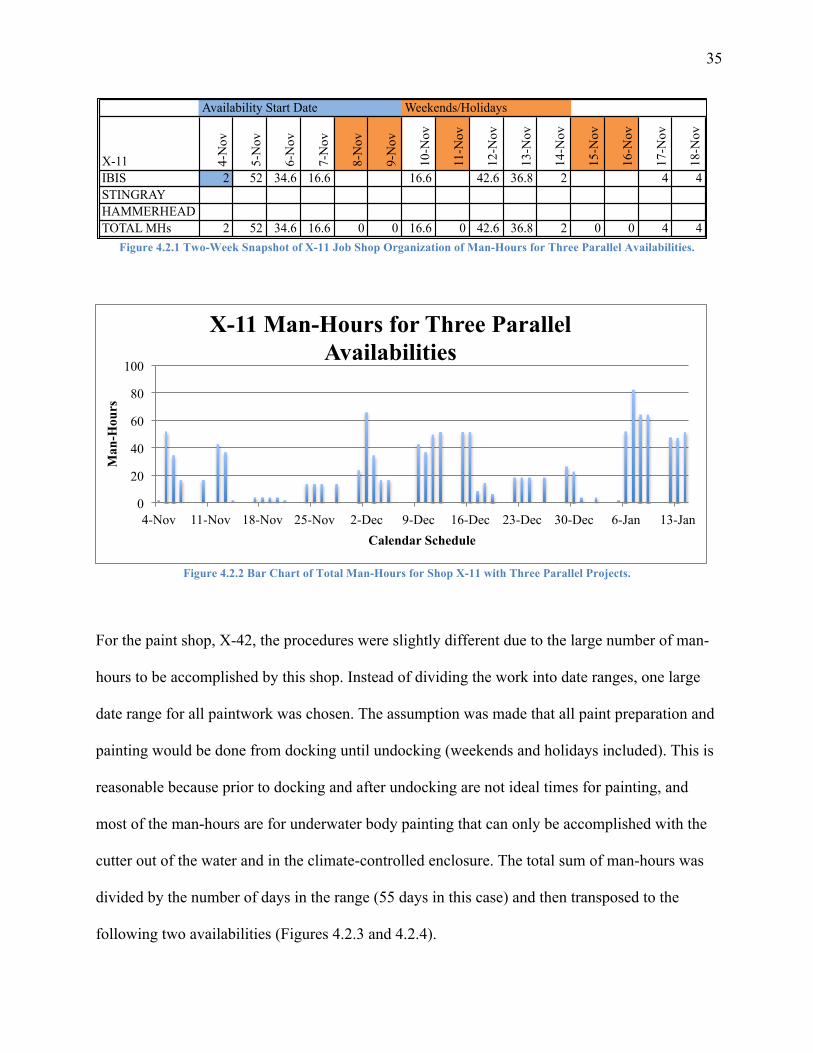
35
Figure 4.2.1 Two-Week Snapshot of X-11 Job Shop Organization of Man-Hours for Three Parallel Availabilities.
Figure 4.2.2 Bar Chart of Total Man-Hours for Shop X-11 with Three Parallel Projects.
For the paint shop, X-42, the procedures were slightly different due to the large number of man-
hours to be accomplished by this shop. Instead of dividing the work into date ranges, one large
date range for all paintwork was chosen. The assumption was made that all paint preparation and
painting would be done from docking until undocking (weekends and holidays included). This is
reasonable because prior to docking and after undocking are not ideal times for painting, and
most of the man-hours are for underwater body painting that can only be accomplished with the
cutter out of the water and in the climate-controlled enclosure. The total sum of man-hours was
divided by the number of days in the range (55 days in this case) and then transposed to the
following two availabilities (Figures 4.2.3 and 4.2.4).
Availability Start Date Weekends/Holidays
X-11 4-N
ov
5-N
ov
6-N
ov
7-N
ov
8-N
ov
9-N
ov
10-N
ov
11-N
ov
12-N
ov
13-N
ov
14-N
ov
15-N
ov
16-N
ov
17-N
ov
18-N
ov
IBIS 2 52 34.6 16.6 16.6 42.6 36.8 2 4 4STINGRAYHAMMERHEADTOTAL MHs 2 52 34.6 16.6 0 0 16.6 0 42.6 36.8 2 0 0 4 4
0
20
40
60
80
100
4-Nov 11-Nov 18-Nov 25-Nov 2-Dec 9-Dec 16-Dec 23-Dec 30-Dec 6-Jan 13-Jan
Man
-Hou
rs
Calendar Schedule
X-11 Man-Hours for Three Parallel Availabilities

36
Figure 4.2.3 Two-Week Snapshot of X-42 Job Shop Organization of Man-Hours for Three Parallel Availabilities.
Figure 4.2.4 Bar Chart of Total Man-Hours for Shop X-42 with Three Parallel Projects.
After compiling the data for every job shop, all of the job shops were combined together. All of
the hours were summed up for each day and then divided by 25.1 and 22.2 people per day (CG
Yard estimated number of resources needed per day) to get the amount of hours per person per
day. It was assumed that the trade labor needed for each day would be determined by the shop
foremen so the labor could be divided equally into the designated number of laborers. However,
the number of laborers per shop could be calculated by taking the total job shop hours for each
day and dividing them by an 8-hour shift. For weekend and holiday work the total man-hours
were divided by six (the predetermined number of paint shop workers to be utilized each
Weekends/Holidays
4-N
ov
5-N
ov
6-N
ov
7-N
ov
8-N
ov
9-N
ov
10-N
ov
11-N
ov
12-N
ov
13-N
ov
14-N
ov
15-N
ov
16-N
ov
17-N
ov
18-N
ov
x42 total hours/55 days 0 0 45 45 45 45 45 45 45 45 45 45 45 45 452nd availtotal sum 0 0 45 45 45 45 45 45 45 45 45 45 45 45 453rd availtotal sum 0 0 45 45 45 45 45 45 45 45 45 45 45 45 45Divided by 6 ppd (total hours each person must work) 0 0 7.5 7.5 7.5 7.5 7.5 7.5 7.5 7.5 7.5 7.5 7.5 7.5 7.5
0
50
100
4-Nov 11-Nov 18-Nov 25-Nov 2-Dec 9-Dec 16-Dec 23-Dec 30-Dec 6-Jan 13-Jan
Man
-Hou
rs
Calendar Schedule
X-42 Man-Hours for Three Parallel Availabilities

37
overtime day). The man-hours per job shop were then plotted along the schedule, with job shop
hours stacked on top of each other as done by NASSCO in their pipe-shop loading study. The
hours per person per day were also plotted over the schedule to see which days went over an 8-
hour shift. These finals steps were completed for one, two, and three availabilities.
4.3 Level-Loading a Single Job Shop
As they become available, the CG Yard provides actual man-hours expended for each job
shop. Currently, only CGC IBIS’ final cost report with man-hours is available. Other data for the
STINGRAY, HAMMERHEAD, BLUEFIN, and POMPANO are available such as final cost,
schedule delays, and progress notes. These results will be examined in the discussion section.
The actual man-hours for CGC IBIS were compared to the estimated man-hours to determine the
major differences. As this is just a single data point, a statistical analysis cannot be conducted.
However, the actual man-hour data can be used to determine which job shop would benefit from
level-loading the workload. This can be done by looking at the actual versus estimated man-
hours as well as the initial loading of each job shop, determine which job shop incurs the most
overtime hours or greatest variability of workday hours over the span of the project timeline
(with three availabilities in parallel), and re-sequence the work of that individual shop with
consideration to the updated WBS and other reasonable sequencing changes. The combinations
of allowable sequencing in a project with this many subtasks are quite large, so this analysis will
only cover one such sequencing option. Also, in re-sequencing one job shop to reduce the overall
impact of overtime hours on the laborers, it is assumed that all other job shop sequencing would
be impacted. Ideally, all job shops would be level loaded across the entire project. Due to the
limited scope of this study, however, only one job shop will be analyzed.

38
4.4 Results
Spreadsheet modeling opened up doors for analysis that could not have been done with
planning documents alone or within current planning software. The analysis provides a visual
representation of project loading and gives the planners and estimators greater control over
program modeling. The results for the loading of the projects were done in an iterative manner in
order to see how adding an additional cutter to the workload would impact total man-hours and
man-hours per person per day. CGC IBIS’ maintenance availability began on November 4th,
2014 and was scheduled to end on January 14th, 2015. In this date range, CGC STINGRAY and
CGC HAMMERHEAD are scheduled to begin their maintenance availabilities. The dates
overlap 46 and 9 calendar days respectively. The loading of man-hours for one availability is
fairly straightforward and reasonable to manage as work is not being done in parallel, and
therefore resources are not being absorbed into other projects. The total daily and per person
man-hours are shown in Figure 4.4.1 and displays that while working just one availability, the
full 8-hour shift for the work crew is underutilized for the majority of the availability, with other
days being slightly or well over two shifts.

39
Figure 4.4.1 Total and per person man-hours for one availability, the CGC IBIS.
Figure 4.4.2 clearly shows the variable loading of man-hours over the course of one
availability. Comparing workday loading, the maximum load is nearly 450 man-hours, while the
minimum load is slightly over 50 man-hours per day. Weekends, when the paint shop will be
using six laborers, stay constant at about 50 man-hours per day.
ONE AVAILABILITY ONLY Weekends/Holidays CGC IBIS
4-N
ov
5-N
ov
6-N
ov
7-N
ov
8-N
ov
9-N
ov
10-N
ov
11-N
ov
12-N
ov
13-N
ov
14-N
ov
15-N
ov
16-N
ov
17-N
ov
18-N
ov
x11 2 52 34.6 16.6 16.6 42.6 36.8 2 4 4x12 6 4 4x13 6 3 18 10 0 0 10 0 10 4 0 0 0 0 0x14 2.0 10.5 10.5 10.5 10.5 10.0 10.0 10.0 10.0x21 10.94 0.94 38.1 26.05 0 0 26.09 0 58.09 14.59 6.19 0 0 6.19 6.19x22 0 8 3.5 3.5 0 0 3.5 0 3.5 6 10.7 0 0 10.7 10.7x23 15 9 54 25 0 0 25 0 25 38 12 0 0 12 12x24 18 3 3 3 3x31 10 18 64 27 0 0 27 0 55 9 2 0 0 2 2x32 8.9 0.9 17.1 17.05 0 0 17.05 0 17.05 5.3 0.9 0 0 0.9 0.9x33 8x41 0.56 0.56 25.26 25.26 0.00 0.00 25.26 0.00 25.26 5.76 4.56 0.00 0.00 4.56 4.56x42 0 0 45.1 45.1 45.1 45.1 45.1 45.1 45.1 45.1 45.1 45.1 45.1 45.1 45.1x43 15.70 20.70 89.10 44.10 0.00 0.00 44.10 0.00 44.10 21.10 5.03 0.00 0.00 5.03 5.03x61 2.5 5.5 5.5 5.5 3 2.3 6.3 2.3 2.3x64 8 1.2 1.2 1.2 1.2x65 1.2 1.2 1.2 1.2x66 1.2 1.2 1.2 1.2
Total 70.8 132 443 262.5 45.1 45.1 258.6 45.1 331.6 204.9 109 45.1 45.1 107 107/25 ppd 2.821 5.25 17.6 10.46 7.52 7.517 10.3 7.52 13.21 8.163 4.32 7.52 7.52 4.24 4.24/22.2ppd 3.189 5.94 19.9 11.82 7.52 7.517 11.65 7.52 14.93 9.23 4.89 7.52 7.52 4.8 4.8

40
Figure 4.4.2 Total man-hours for one availability, the CGC IBIS.
Figure 4.4.3 compares the two different manning scenarios’ loading conditions. The labor
hours per person vary greatly from zero to 20 per day.
Figure 4.4.3 Manning Scenario Comparative Graph for One Availability.
The minimum, maximum, average and standard deviation for the different manning
scenarios are presented in Table 4.4.1. The minimum hours, found on weekends and holidays
0 50
100 150 200 250 300 350 400 450 500
4-Nov 11-Nov 18-Nov 25-Nov 2-Dec 9-Dec 16-Dec 23-Dec 30-Dec 6-Jan 13-Jan
Man
-Hou
rs
Calendar Schedule
All Job Shops over Time for 1 Availability x11 x12 x13 x14 x21 x22 x23 x24 x31
x32 x33 x41 x42 x43 x61 x64 x65 x66

41
when paint shop work has stopped, is zero for one availability. The maximum hours extend over
three standard deviations above the mean for both scenarios.
Table 4.4.1 Descriptive Statistics for Loading of One Availability.
As the second availability CGC STINGRAY overlaps with CGC IBIS, the man-hours
mid-way through the availability represent the conditions for parallel loading of two projects.
The spike in man-hours as seen in Figure 4.4.4 and Table 4.4.2 show that what would normally
be a one-shift workday, now requires at least two shifts.
Figure 4.4.4 Total man-hours for two availabilities, the CGC IBIS and CGC STINGRAY.
Manning Scenario
Minimum Hours
Maximum Hours
Average Hours Standard Deviation
25.1 People 0 17.631 6.017 3.521 22.2 People 0 19.935 6.544 3.891 !
0.0
100.0
200.0
300.0
400.0
500.0
600.0
4-Nov 11-Nov 18-Nov 25-Nov 2-Dec 9-Dec 16-Dec 23-Dec 30-Dec 6-Jan 13-Jan
Man
-Hou
rs
Calendar Schedule
All Job Shops over Time for 2 Availabilities x11 x12 x13 x14 x21 x22 x23 x24 x31
x32 x33 x41 x42 x43 x61 x64 x65 x66
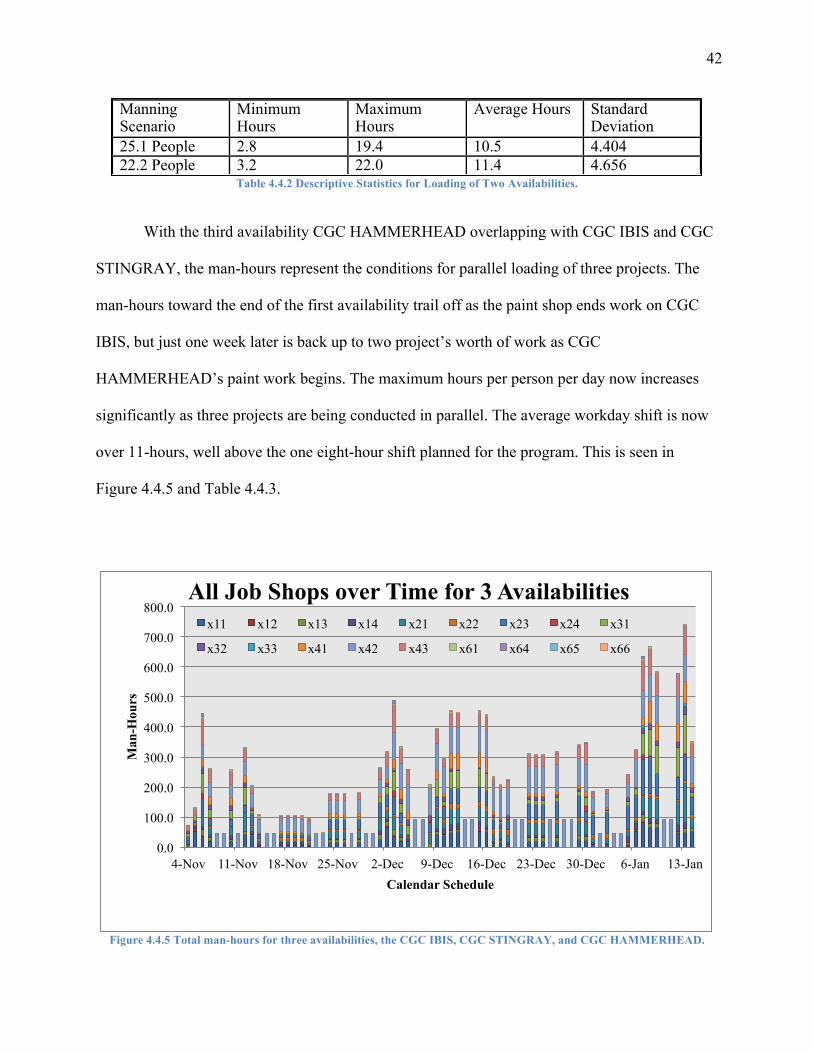
42
Table 4.4.2 Descriptive Statistics for Loading of Two Availabilities.
With the third availability CGC HAMMERHEAD overlapping with CGC IBIS and CGC
STINGRAY, the man-hours represent the conditions for parallel loading of three projects. The
man-hours toward the end of the first availability trail off as the paint shop ends work on CGC
IBIS, but just one week later is back up to two project’s worth of work as CGC
HAMMERHEAD’s paint work begins. The maximum hours per person per day now increases
significantly as three projects are being conducted in parallel. The average workday shift is now
over 11-hours, well above the one eight-hour shift planned for the program. This is seen in
Figure 4.4.5 and Table 4.4.3.
Figure 4.4.5 Total man-hours for three availabilities, the CGC IBIS, CGC STINGRAY, and CGC HAMMERHEAD.
Manning Scenario
Minimum Hours
Maximum Hours
Average Hours Standard Deviation
25.1 People 2.8 19.4 10.5 4.404 22.2 People 3.2 22.0 11.4 4.656 !
0.0
100.0
200.0
300.0
400.0
500.0
600.0
700.0
800.0
4-Nov 11-Nov 18-Nov 25-Nov 2-Dec 9-Dec 16-Dec 23-Dec 30-Dec 6-Jan 13-Jan
Man
-Hou
rs
Calendar Schedule
All Job Shops over Time for 3 Availabilities x11 x12 x13 x14 x21 x22 x23 x24 x31
x32 x33 x41 x42 x43 x61 x64 x65 x66
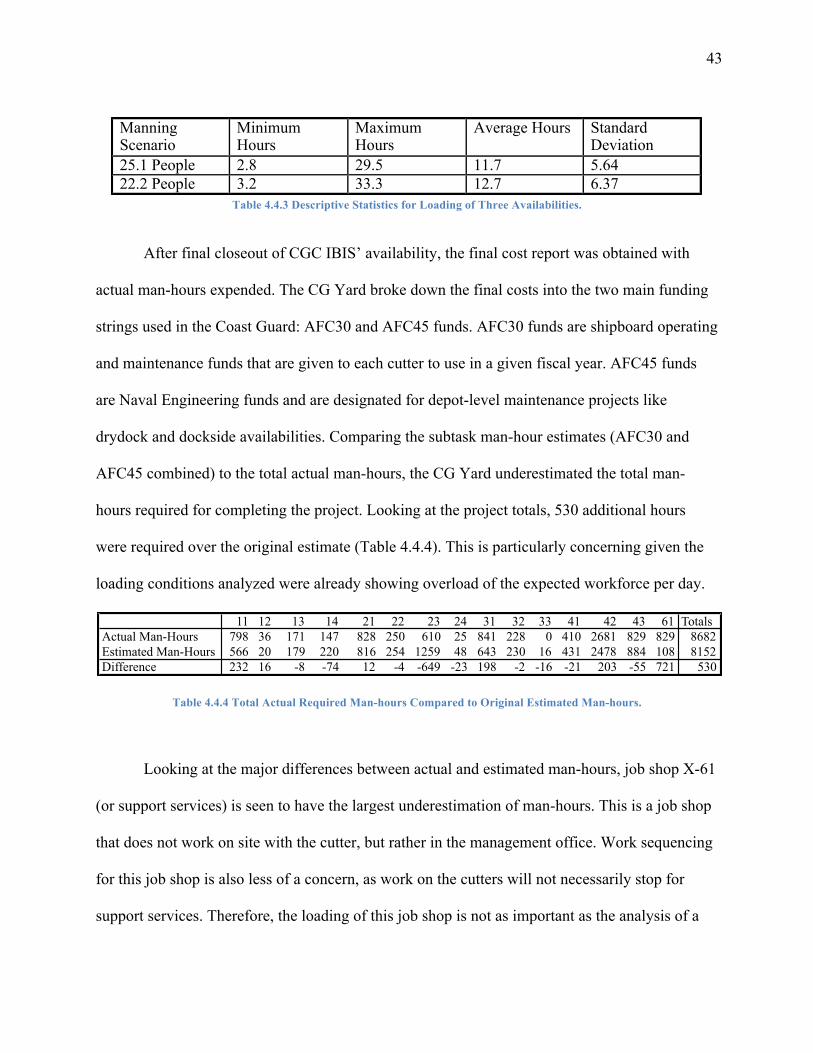
43
Table 4.4.3 Descriptive Statistics for Loading of Three Availabilities.
After final closeout of CGC IBIS’ availability, the final cost report was obtained with
actual man-hours expended. The CG Yard broke down the final costs into the two main funding
strings used in the Coast Guard: AFC30 and AFC45 funds. AFC30 funds are shipboard operating
and maintenance funds that are given to each cutter to use in a given fiscal year. AFC45 funds
are Naval Engineering funds and are designated for depot-level maintenance projects like
drydock and dockside availabilities. Comparing the subtask man-hour estimates (AFC30 and
AFC45 combined) to the total actual man-hours, the CG Yard underestimated the total man-
hours required for completing the project. Looking at the project totals, 530 additional hours
were required over the original estimate (Table 4.4.4). This is particularly concerning given the
loading conditions analyzed were already showing overload of the expected workforce per day.
Table 4.4.4 Total Actual Required Man-hours Compared to Original Estimated Man-hours.
Looking at the major differences between actual and estimated man-hours, job shop X-61
(or support services) is seen to have the largest underestimation of man-hours. This is a job shop
that does not work on site with the cutter, but rather in the management office. Work sequencing
for this job shop is also less of a concern, as work on the cutters will not necessarily stop for
support services. Therefore, the loading of this job shop is not as important as the analysis of a
Manning Scenario
Minimum Hours
Maximum Hours
Average Hours Standard Deviation
25.1 People 2.8 29.5 11.7 5.64 22.2 People 3.2 33.3 12.7 6.37 !
11 12 13 14 21 22 23 24 31 32 33 41 42 43 61 TotalsActual Man-Hours 798 36 171 147 828 250 610 25 841 228 0 410 2681 829 829 8682Estimated Man-Hours 566 20 179 220 816 254 1259 48 643 230 16 431 2478 884 108 8152Difference 232 16 -8 -74 12 -4 -649 -23 198 -2 -16 -21 203 -55 721 530

44
“hands on” job shop. The next largest underestimation of man-hours is in job shop X-11,
shipfitting. Level-loading of a shop can be thought about in multiple ways. The most ideal way
to load a job shop would be to have the same number of hours for a set number of workers for
the entire duration of the project. This would create the most predictable and flexible schedule.
By taking the total number of hours estimated for the X-11 job shop and dividing it by the 48
working days in the project timeline, an 11.8-hour workday can be planned to complete all of the
work for one availability. By overlapping the second and third availabilities, a step-wise
workload is created (Figure 4.4.6). This does not create a level-load of the job shop over the
course of the availability. However, after adding the total number of man-hours given this
overlapping scenario and again dividing by 48 working days, a level-loaded project timeline can
be achieved with a 21-hour workday (Figure 4.4.7).
Figure 4.4.6 Stepwise Loading of Man-Hours after Level Loading One Availability.
0 5
10 15 20 25 30 35 40
4-N
ov
6-N
ov
8-N
ov
10-N
ov
12-N
ov
14-N
ov
16-N
ov
18-N
ov
20-N
ov
22-N
ov
24-N
ov
26-N
ov
28-N
ov
30-N
ov
2-D
ec
4-D
ec
6-D
ec
8-D
ec
10-D
ec
12-D
ec
14-D
ec
16-D
ec
18-D
ec
20-D
ec
22-D
ec
24-D
ec
26-D
ec
28-D
ec
30-D
ec
1-Ja
n 3-
Jan
5-Ja
n 7-
Jan
9-Ja
n 11
-Jan
13
-Jan
Man
-Hou
rs
Calendar Schedule
Equal Loading of Total Man-Hours Per Working Day Per Availability Three Availabilities in Parallel

45
Figure 4.4.7 Equal Loading of Three Availabilities’ Total Hours over Project Timeline.
This equal loading over the project timeline may be realistic for a production line that has one
task, but it is not realistic for sequence dependent work. So in order to attempt to level-load a job
shop that has set deadlines for subtask completion, it is more reasonable to level-load across
shorter periods of time rather than the whole project timeline. A single project was level-loaded
across weekly timelines and then carried across three projects in parallel. The results for level-
loading a shop can be seen below in Figures 4.4.8 and 4.4.9 When compared to the original
sequencing of work, the level-loaded schedule has more moderately loaded workdays and
several consecutive days of equal loading, with the exception of the docking days.
0
5
10
15
20
25
4-N
ov
6-N
ov
8-N
ov
10-N
ov
12-N
ov
14-N
ov
16-N
ov
18-N
ov
20-N
ov
22-N
ov
24-N
ov
26-N
ov
28-N
ov
30-N
ov
2-D
ec
4-D
ec
6-D
ec
8-D
ec
10-D
ec
12-D
ec
14-D
ec
16-D
ec
18-D
ec
20-D
ec
22-D
ec
24-D
ec
26-D
ec
28-D
ec
30-D
ec
1-Ja
n 3-
Jan
5-Ja
n 7-
Jan
9-Ja
n 11
-Jan
13
-Jan
Man
-Hou
rs
Calendar Schedule
Equal Loading of Total Man-Hours Per Working Day Over Project Timeline
Three Availabilities in Parallel
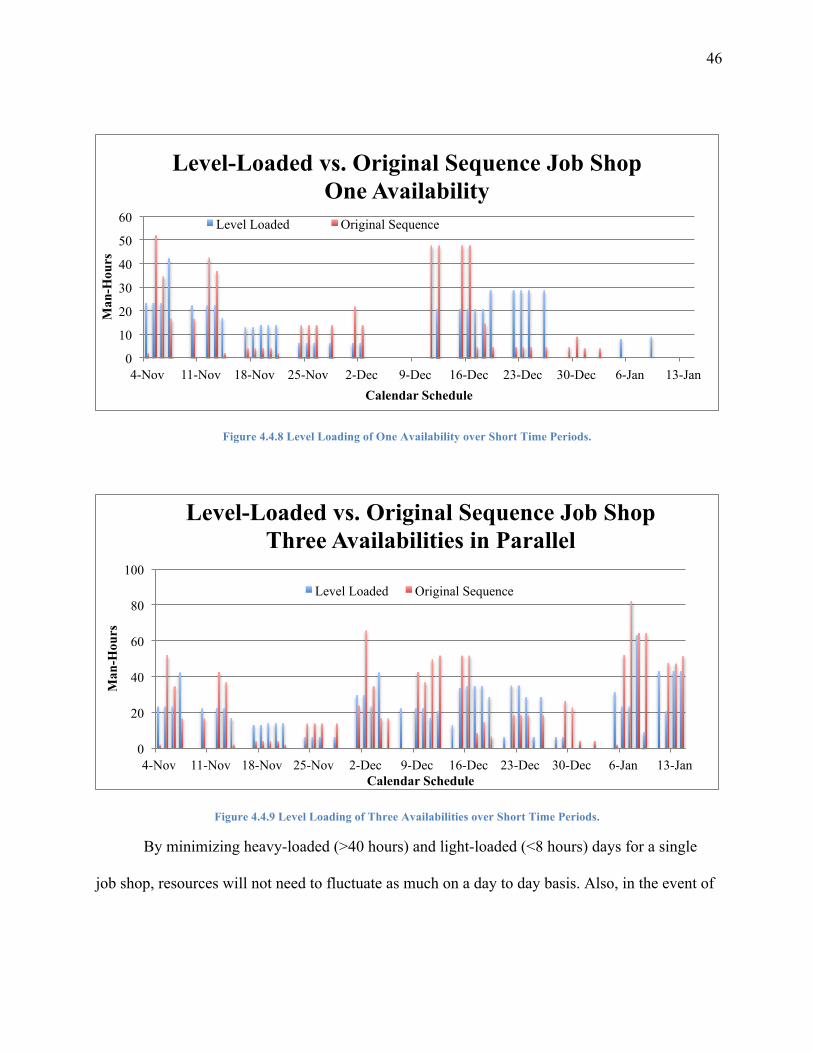
46
Figure 4.4.8 Level Loading of One Availability over Short Time Periods.
Figure 4.4.9 Level Loading of Three Availabilities over Short Time Periods.
By minimizing heavy-loaded (>40 hours) and light-loaded (<8 hours) days for a single
job shop, resources will not need to fluctuate as much on a day to day basis. Also, in the event of
0
10
20
30
40
50
60
4-Nov 11-Nov 18-Nov 25-Nov 2-Dec 9-Dec 16-Dec 23-Dec 30-Dec 6-Jan 13-Jan
Man
-Hou
rs
Calendar Schedule
Level-Loaded vs. Original Sequence Job Shop One Availability
Level Loaded Original Sequence
0
20
40
60
80
100
4-Nov 11-Nov 18-Nov 25-Nov 2-Dec 9-Dec 16-Dec 23-Dec 30-Dec 6-Jan 13-Jan
Man
-Hou
rs
Calendar Schedule
Level-Loaded vs. Original Sequence Job Shop Three Availabilities in Parallel
Level Loaded Original Sequence

47
excess work being added to a single day, the chance of needing overtime or additional laborers is
decreased because of the scheduled moderate workload.
Weekly progress meeting notes from the first five availabilities, along with estimated and
actual completion dates were retrieved from Contract Workbook Database. Actual man-hours for
the second through fifth availabilities were not available from the CG Yard due to long closeout
times. Table 4.4.5 lists the availability actual and estimated start and end dates as well as
problems encountered during the availability.
Table 4.4.5 Progress Notes Detailing Start/End Dates and Problems Encountered for First Five Cutters.
Table 4.4.6 details the newest changes to the WBS for the fifth availability, CGC
POMPANO. The changes or additions compared to CGC IBIS’ WBS are color coded in the full
Cutter Estimated/Actual Start Date
Estimated/Actual End Date (Total # Weeks)
Problems
CGC IBIS 04 November 14 January (10 weeks) -Sequencing Rework -Paint Preparation
CGC STINGRAY 30 November/ 01 December
11 February (10 weeks) -Delay Start due to weekend -Many Holidays -Showed Potential for Delay due to Paint which backed up other shops -Winter Weather issues cause undocking 1 day early
CGC HAMMERHEAD
05 January 24 March (11 weeks) -STINGRAY Delivery & BLUEFIN Arrival Delaying HAMMERHEAD work -Yard Closure due to Weather -Paint Rework (external)
CGC BLUEFIN 01 February 08 April/ 15 April (10 weeks)
-Winter Weather/Wind Delays Docking 1 day -Lost Production Hours & Days due to Winter Weather Yard Closure -Extensive Structural Repairs delay Paint Shop -Higher Priority Cutters Using Labor Resources -Realign Both Main Diesel Engines -Cracked Pipes due to Freezing Weather after Undocking -Damage from Blast Grit (Rework)
CGC POMPANO 09 March 17 May (proposed 10 weeks)
-Paint Rework -Growth Work due to Previous Avail. Improper Sequencing
!

48
WBS in the Appendix (Figure A.24). Several changes were made based on lessons learned and
re-sequencing of work item tasks.
Table 4.4.6 Items Updated on WBS for CGC POMPANO.
4.5 Discussion
The results above show a progression of project complexity both in the planning and
execution stages of the Bow to Stern Program. With the results of the one-availability scenario, it
is easy to see pockets of light and heavy workloads. The daily workload is reasonable, showing
on average a six-hour workday. The minimum workday load is zero which correlates to
weekends when paintwork is not happening. The maximum workday load is 17.6 hours (19.9
hours). This occurs on the day that CGC IBIS is docked. Normally docking days are very long
and require all-hands to be available. A typical docking evolution can take several hours to
prepare the cutter, which includes removing liquid loads, brows, or other unnecessary equipment
like small boats. The docking of an 87’ cutter is done with a cradle and a crane. This specific
type of docking evolution is much faster than other types of docking, but can still take several
hours and delays can occur due to weather conditions like wind and ice or tides and currents.
Pushed Back (Later Date)
Pushed Up (Earlier Date)
New Item Added
Install Lagging Mast Interference Removal Remove Equipment Prior to Docking
Final Walk-Through Mobilize Blast Equipment Clean Grit Blast Material Remove Bilge Interferences Complete Surface
Preparation Installations UT Shots/Hotwork Testing Paint Bilges Clean-Ups All Paint Work Complete Dock/Sea Trials
!

49
Post docking activities include setting up all protective measures, enclosures, scaffolding, and
hooking up services (water/electrical) for tools. Blasting of the underwater body typically begins
the day of docking as well. All of these events added together, with time waiting for everything
to happen sequentially, can add up to an 18-hour day quite easily. Other pockets of heavy
workloads are the week following docking and about a week and a half prior to undocking.
There are approximately five days that have each person working 10-15 hour shifts. Following
docking there are many removals of interferences and also of major components such as
propellers, shafts, rudders, and any other removable parts that will be worked on in an offsite-
shop. During this time, blasting of old paint can take several days or weeks and subcontractors
and CG Yard workers are on the vessel inspecting and cleaning tanks and bilges. Prior to
undocking, all of the pieces must be reassembled and re-inspected prior to acceptance. The
sequencing of these big man-hour consumers are fairly fixed and can only be level-loaded by
adding more resources or using more overtime hours in that time range. Given that only six total
days (out of 72) would require double shifts, this does not seem too difficult to manage.
By adding the CGC STINGRAY’s availability schedule onto CGC IBIS’ schedule, the
scenario becomes much more challenging. The average workday shift per person becomes 10-11
hours. The workload for the job shops is essentially doubled with the entrance of the second
availability and will never be reduced for the remainder of the four-year program. Approximately
30 of the 72 days in the time range would require 10 hours of work per person. Given that many
of the 30 days are consecutive, this does not leave much room for overtime without the risk of
burnout. This situation is only worsened when the third cutter, CGC HAMMERHEAD arrives,
adding yet another layer of man-hours. Approximately 37 of the 72 days require 10 hours of
work per person, with some days requiring up to 20 hours (22 hours for 22.2 people). The

50
additional seven days appear at the end of the time range when CGC IBIS is being delivered. The
delivery of the first availability on time is crucial to the CG Yard’s reputation and all resources
will be pushed into that cutter to make it happen. Many of CGC STINGRAY and CGC
HAMMERHEAD’s hours will likely be used for CGC IBIS’ final push.
As seen with the level loading of job shop X-11, heavy and light loaded workdays are
adjusted to level-loaded and moderate workloads for shorter periods of time (approximately one
week). This is a more reasonable way to level-load sequence dependent work as opposed to level
loading across a project timeline. By creating equal resource loading over multiple days, workers
can adapt to more routine shifts and the crew composition will remain mostly constant. This
reduces the need for overtime as well as overmanning and all the negative effects of introducing
unfamiliar or unskilled workers to a project. Further analysis can be done to improve level
loading if changes are made to milestone activities in the project like docking and undocking
dates. The level loading process could also be used to optimize the time between cutter arrivals.
The 30-day interval may have been chosen arbitrarily for this program, but as seen with cutter
deliveries and arrivals coming within one week of each other, this is not an ideal situation as it
causes surging of resources.
As seen in Table 4.4.5, the first five availabilities have either made the 10-week timeline
or exceeded it by 1 week. CGC IBIS met the 10-week schedule, but did face rework because the
initial sequencing needed to be adjusted to circumstances not accounted for in planning. Some
rework and additional work had to do with paint preparation methods in the lazarette as the space
is extremely small and requires a smaller worker. The grit blast method was not adequate to
prepare all areas, so hand tools (which require more time) had to be utilized. CGC STINGRAY
had to accommodate some of the changes in sequencing discovered in the first availability. They

51
were also the first availability to face issues with weather. Winter weather did not cause issues
within the enclosure, but for getting the cutter back in the water. CGC HAMMERHEAD, being
the third availability, took an extra week to complete due to the weather closing or delaying
production, job shops overcoming their first fully loaded availability (three ships in parallel, 1st
cutter delivery), as well as the inflexibility in the schedule and having to complete paint rework.
Surprisingly, the CG Yard workers were able to complete CGC BLUEFIN in 10 weeks
(scheduled for 9) when this availability was plagued with more issues than CGC
HAMMERHEAD, including reduced priority in the shipyard, growth work due to freezing
temperatures after undocking, and activation of option items (engine alignment and hot work for
structural repairs). The reason for overcoming these obstacles is due in part to new mitigation
strategies like utilizing subcontractors on the engine room and lazarette bilge painting work
items (over 100 hours of preservation given to subcontractor). CGC POMPANO received an
updated WBS that incorporated all of the changes made in sequencing since CGC IBIS (Tables
4.4.6 and Figure A.24).
The current strategies implemented at the CG Yard to mitigate schedule risks include
overtime, overmanning/surging, subcontracting work, improved efficiencies in tools for paint
shop, and updating work sequencing. Scheduling overtime for one job shop for the duration of a
four-year program was not the best course of action for the CG Yard. The scheduled overtime
didn’t even have the added benefit of making the schedule more flexible. The literature shows
that overtime in small doses is not a bad strategy, but to expect a small group of people to work
overtime for four years straight is bound to cause burnout, low morale, and likely injury.
Fluctuating resource loading (Figures 4.4.1, 4.4.3, and 4.4.4) supports the need for better level-
loading of work to reduce the need for overtime and overmanning. The Navy, as well as other

52
government organizations, has a long historical record of accepting ships with major
discrepancies, requiring the shipyards to fix most, but not all issues (U.S. GAO 2013). The CG
Yard also delivers ships to its customers with incomplete work items. The CG Yard, however,
schedules follow up visits to complete the work so as not to delay a cutter’s return to its
operational duties. This added burden of traveling for overtime work would take resources away
from future availabilities, requiring additional mitigation strategies to be implemented.
The CG Yard does not necessarily feel the impacts of the hiring and firing schedule due
to the fixed nature of the workforce, but they may feel similar secondary effects when
subcontracting out work items. Workers unfamiliar with the ship and shipyard personnel will
need to come together to work in the same space, which may cause overcrowding, out of
sequence work, and rework. Management also has less control over subcontractors and must
work through their superintendent to pass along critical information. The positive outcomes of
subcontracting work, particularly paint work for this project, are that it reduces part of the
workload of the paint shop (100 man-hours out of 2,500 man-hours). The trouble with
subcontracting the entire work item or other work item’s coating tasks is that the workers would
either need to work side by side or on alternating shifts. This could result in overcrowding and
quality control issues if workers are trained differently. Due to the competing projects at the CG
Yard and the differing priorities of the missions they carry out, resources are often taken from a
lower priority vessel and given to another. This surging can take resources away from the 87’
Bow to Stern Program or add resources to it when their priority is increased. With the inflexible
schedule and the small size of the 87’ cutter, surging can be difficult to implement properly.
The tools originally used for preparing surfaces in tight spaces like the lazarette and stern
tube were not sufficient to get the quality of bare metal needed to paint. The extension of this

53
process affected the underwater priming of the hull for the very important task of side scanning
the cutter. In order to reduce the process time of this task, a new 90-degree rotating blast head
was used for CGC BLUEFIN. There are also several different techniques for preparing and
coating surfaces. The 87’ Bow to Stern Program uses grit blast as its preparation method. Water
jetting is another technique that is utilized on other cutters. Paint coatings can be applied with a
spray or roll-on technique. The reason for using one technique over another may lie in the cutter
class differences, the environmental regulations, or in the training of the individuals performing
the work. It can be assumed that the first two reasons are not going to change. Learning new
techniques is an option, but also a big challenge at the CG Yard. If the capital to invest in a new
painting tool is available, the laborers may not be willing to learn how to use it or it may take
them a long time to learn how to use it. Due to the long tenure of many of the CG Yard workers,
many do have an unwillingness to try new techniques or technologies. Finding the right
motivational methods in this case is challenging, especially in the middle of a high-tempo
project.
Making changes to a project schedule is a crucial step in project management. Following
the steps of Plan, Do, Check, Act (PDCA) verifies that changes are beneficial. PDCA was
implemented from the start of IBIS’ availability to POMPANO’s availability in the WBS. Some
items were moved up in the schedule, others were moved back, and some tasks were added to the
sequencing because of their importance. Mast and bilge interferences, preparation set-up, and
initial shaft alignments were all moved up in the first part of CGC POMPANO’S schedule.
Putting mast work on the first day was wise as this work can be done when the cutter is still in
the water, freeing up time later for critical path work like paint preparation and coating.
Interference removal and alignments were also pushed up because they are tasks that must be
54
completed prior to painting work items and can be done immediately following docking. Some
new tasks added to the WBS at the beginning of the availability include equipment removals,
technical representative visits, and clean ups needed before another large task can begin. The
addition of these tasks, though they might not seem overly important, probably had valuable
lessons learned in the first four availabilities. For example, the preparation of the lazarette and
stern tube was moved up in the schedule because the dust created by this process needed to be
cleaned up before a prime coat was applied to do the side scan of the cutter. In the middle of the
schedule, the new tasks added are bilge preparation, ultrasonic thickness measurements (UT
shots), all hot work, painting of bilges, installations, more technical representative visits, and
final touch-ups. The big items worth mentioning here are the UT shots, hot work, and bilge paint.
The large extent of structural repairs on the hull and in bilges on the CGC BLUEFIN almost
caused the project to reach its tipping point. By giving more specific dates to tasks, the CG Yard
has better control to adapt to conditions found. The UT shots determine where new steel or weld
patches (clad welding) needs to be added, the hot work must be completely finished before any
painting occurs, and in the event that paint is behind due to structural repairs, the paint
subcontractor will be penciled in to absorb the engine room and lazarette work items. Some
items that were pushed up toward the end of the availability include installations, testing,
cleaning, and trials. These items were likely pushed up because their sequence didn’t impact
other items (some installations/tests) or it was found that they didn’t take as much time as first
estimated (trials). Two items were pushed back at the end of the schedule, lagging installation
and final walk-through because they can be done after undocking when the majority of the
critical path items are complete. The bulk of the moved or added tasks made the schedule more
efficient and less crowded during paint preparations and coatings. It did not however, directly

55
influence the time and labor constraints that the paint shop still has to work around (with the
exception of utilizing subcontractors). The following section will cover the pros and cons of
other potential strategies for improving the schedule, with special attention on the paint shop.
The manning scenarios, utilizing 25.1 (or 22.2) people per day and 6 painters per
weekend/holiday, were used as an estimate for the purposes of looking at the loading of the
project. The CG Yard is very flexible in how they utilize their resources and the total number of
laborers can fluctuate each day and within each job shop. The job shops had the flexibility, in the
case of the Bow to Stern Program, to utilize anywhere between one and ten workers per job shop
in order to complete daily tasks. Considering this large swing in resources, the man-hour results
listed above (per day) could be high or low, but were generally a mid-point estimate based on
project expectations. The results do however, show that level-loading the project given the
current sequencing is not possible without fluctuating labor resources or using additional
strategies to cut down the number of man-hours required to complete the work package. By
conducting the level loading of job shop X-11 over small time windows in the project timeline,
the large variability of resources needed per day can be reduced. Doing a complete level-loading
analysis for this program by hand, let alone for all concurrent shipyard projects, is cumbersome.
The following section will discuss smarter ways for the organization to overcome the challenges
associated with level-loading job shops.
CHAPTER 5
DECISION SUPPORT TOOLS
5.1 Mitigation Strategies

56
The goal of the 87’ Bow to Stern Program is to minimize the total project duration so that
the 87’ mission is not compromised due to long maintenance availabilities. As such, the use of
expensive mitigation strategies is considered appropriate to meet this goal. However, there is a
delicate balance that must be achieved given the nature of the industrial yard, its employees, and
most importantly, the consequences of using mitigation strategies. Rework, the biggest threat to
the schedule, can be caused by out of sequence work, poor workmanship, or a material quality
issue. Change orders are unforeseen tasks added to existent work items. Option items are part of
the original scope of work due to their anticipated activation from known problems, but are not
considered new work. Scope changes add new work items due to technology improvements or
new standards/regulations. Schedule pressure is an immeasurable phenomenon that occurs as a
project nears a milestone or completion deadline.
The CG Yard’s unionized workforce can present challenges to managers when it comes
to utilizing standard mitigation practices found in non-unionized commercial shipyards. The
laborers are government employees, who after one year in the position are guaranteed
employment. Because their employment is fixed, the workers enjoy and may even push for
overtime as it pays time and a half. Everything from overtime hours, the number of new hires,
required breaks and holidays and many other issues require bargaining. It can be difficult for the
management to stay within the union guidelines and motivate the workers. The plan to allow
shop foremen to run the 87’ Bow to Stern sequencing of CGC IBIS gives them this motivation,
as they are given autonomy. However, with this freedom, workers may move too quickly which
can cause rework if done out of sequence. Furthermore, inter-shop disputes over sequencing and
miscommunication about the “plan” could detract from project progress. This forces
57
management to keep a close eye on the proposed WBS schedule and the work progress on the
cutter as well as the actual man-hours expended.
Some different and new mitigation strategies that the CG Yard could consider for
improving paint shop loading and the 87’ Bow to Stern Program include cross training job shops
(multiskilling), implementing Jobshop Lean, acquiring improved scheduling software with
additional capabilities, and adopting better management techniques.
Single skill work within job shops is still the norm at the CG Yard and several of the
assumptions made in the literature do not apply to this organization. However, other job shop
personnel that are less occupied could acquire paint certifications or become painter helpers. This
would be particularly useful for younger hires that are still apprenticing in their trades to acquire
various skills (Burleson 1998). There would be limited additional cost to the CG Yard as they
would be using currently employed personnel, eliminating the delay and familiarization
requirements usually associated with new hires. This would boost the roster so a work rotation
(with fixed shifts) could be established and ultimately reduce overtime for the strapped job shop.
Jobshop Lean can be implemented for all job shops with mobile equipment and tools, but
is ideal for the paint shop. Paint equipment, like grit blast hoses, nozzles, barrels, compressors,
paint, applicators, etc. can be staged at the two enclosures or in collocated structures. This will
eliminate the need for equipment set up and breakdown each day. One major disadvantage to
Lean implementation is the pushback to change, particularly in using smart technology for
communicating (Mayer 2008). Getting each painter or even the lead painter to communicate via
PDA or smart phone with their foremen for tasking and daily work progress would need to be
introduced with some form of motivation.
58
Motivation can be difficult at the CG Yard, because incentives cannot be monetary in
nature for unionized employees. High performance work system (HPWS) is a strategy that could
help with motivating employees by promoting a rewarding work culture. HPWSs have been
studied in large businesses (>100 people) and is a set of employee management practices that has
key objectives of increasing an employee’s control over their jobs and introducing practices to
improve employee welfare through increased involvement and reward practices (Patel and
Conklin 2010). These practices also optimize the utilization of worker’s knowledge, skills, and
abilities for the benefit of the organization. Essentially, HPWS creates human capital within a
firm. The hope for the firm is to be able to select, develop, motivate, and retain these employees.
HPWS is easily implemented and practiced in firms with greater levels of group culture. Group
culture emphasizes the internal qualities of cohesion and trust, teamwork, greater job satisfaction
and environmental flexibility. These qualities will positively influence retention and perceived
labor productivity within the organization.
Figure 5.1.1 is a decision tree for management to use when considering implementation
of strategies in response to (immediate need) or in prevention of (foreseen) schedule risk. In the
event of rework, change orders, scope change or schedule pressure, managers must determine the
number of man-hours and/or resources required to address the issue. If the crashed task duration
exceeds what is available in the schedule, then a schedule extension is imminent. However, if
there is room in the schedule to add work, then a strategy will need to be implemented to account
for unplanned time and resources. For response strategies, overtime and overmanning are
considered. Overtime, if used in moderation and with special attention to laborer fatigue and
workmanship, can work well. If adding a shift becomes necessary, the workers should be
assigned a single shift per day in order to be on a routine to increase job performance (Jamal &

59
Jamal, 1982). Night shifts and rotating shifts should be avoided, as they will negatively impact
productivity. As overtime is implemented, the CG Yard should be recording overtime hours and
the number of people assigned to work overtime. As Singh noted, the calculation of required
personnel to fulfill overtime requirements is only reliable when considering efficiency losses
(Singh 2003). The CG Yard should be tracking the hours of overtime work assigned for each day
of each project (in man-hours), and log actual work completed (in terms of task hours) in an
iterative approach to determine if there are efficiency losses. This data can then be used to better
plan resource loading when overtime becomes necessary.
Overmanning, to include surging and hiring subcontractors, should also be handled with
care. If the additional resources cause any sort of overcrowding, the strategy should be
abandoned. For an 87’ cutter the maximum is 20 people per cutter, but this number could vary by
compartment and by type of work being completed. An experienced foreman or supervisor
should assess these specific details. If an area can accommodate additional resources, the
maximum number should be set, any additional personnel (whether from an outside project or
subcontractor) should be chosen based on experience or familiarization with the cutter, and more
supervision should be added. Supervision could be in the form of data collection or walk-
throughs and does not necessarily have to be on-site, as that would cause overcrowding.
Preventative strategies are best implemented before the schedule risk is a reality and not in the
midst of the project. They include using new tools with decreased processing times, adding
multiskilled workers or helpers, and implementing Jobshop Lean. These strategies require time
to implement due to learning curves, training, or coordination. In the event these strategies are
used in the middle of a project, it must be assumed that an additional amount of time be added to

60
account for lost productivity. A major change is never advisable during a project, so easing new
equipment, people, and procedures in over time is the best method so as to enact PDCA.
Figure 5.1.1 Decision Tree for Selecting Schedule Risk Mitigation Strategies.
Determine # of Hours and/or Resources
Needed
Has work been added with enough time in
the schedule to fit the task's crash duration?
Yes Procede to Strategies
No Negotiate Extension
Strategies
Response (Unforeseen Problem)
Is overtime already being used?
Yes Are workers fatigued?
Yes Create 2nd Shift
(Evening shift 1500-2300)
No
Determine if added work warrants an additional shift or
overtime with reduced manpower
(Reevaluate for fatigue and work
quality often)
No
Determine if added work warrants an additional shift or
overtime with reduced manpower
(Reevaluate for fatigue and work
quality often)
Will overmanning (surging or
subcontractors) cause overcrowding?
Yes Go to other strategy
No
Determine maximum # of people for space,
choose personnel with most experience
or familiarization, add more
supervision
Prevention (Foreseen Problem)
Are advanced tools available to reduce
process time?
Yes Is someone trained/qualified to use it?
Yes Implement
No Adjust resources to account for learning curve and Training.
No Go to other strategy
Is cross training or adding helpers
feasible?
Yes
Set Time Aside for Training. Confirm
that Additional Laborers do not
cause overcrowding.
No Look into policies for implementation: Hire multiskilled laborers.
Can Jobshop Lean be Implemented?
Yes
Cellular Layout (If capital is available)
Virtual Cell (Collocate Tools,
Materials, People)
No Assess Wastes & Limit Where Possible
61
5.2 CG Yard Efficiency Improvements
Investing capital into software improvements through system upgrades or adopting new
software altogether would improve scheduling and hopefully eliminate a good amount of
standard mitigation strategies needed. The CG Yard Schedulers currently use Oracle’s Primavera
P6 scheduling software (Primavera has additional project management software that extends
beyond scheduling). They are also in the process of shifting to Microsoft Project software. Both
software packages have capabilities to schedule projects and manage resources. The CG Yard
uses this software to schedule each individual project. The major component that is lacking in the
CG Yard’s software is the use of an Integrated Master Plan (IMP). The IMP links all projects
together by task, creating a big-picture view of all projects happening at a facility. Without an
IMP linking all of the projects together, coordination and communication between projects is
extremely difficult. This is particularly important for this facility as resources are shared across
all projects. The CG Yard uses Earned Value Management (EVM) to track single project status
throughout an availability, by measuring performance (actual and estimated) and using past data
trends to predict the future impacts. Without a proper IMP in place, EVM data analysis is
inadequate because it doesn’t take into account the larger implications of other projects on the
single project (Anderson and Upton 2012). The IMP replaces crisis management with proactive
planning, establishes an overall critical path based on interdependencies, and allows for better
resource management (Anderson and Upton 2012). Another benefit of the IMP is that it has the
capability of level-loading job shops and can predict how resource movement affects resource
needs in the future.
Another issue that the CG Yard faces with Primavera is the fact that it does not
communicate well with other systems in use. Interfacing with or exporting to estimating
62
databases, excel spreadsheets, or other applications is essential for producing quick results.
Transposing information by hand into or out of software is cumbersome. Spreadsheet modeling
could become a much quicker method of evaluating programs if all of the data can be shared and
viewed across software platforms (namely Primavera’s estimating and schedules with Microsoft
Excel). There are several commercial scheduler software packages available in the marketplace,
but the cost to acquire these is much higher than implementing upgrades or new tools into
existent software. The cost doesn’t just include material costs, it includes labor costs for learning,
set up costs, and potential maintenance/service costs.
Simulation modeling is another computer-based tool in use by major shipyards
throughout the world. Object-oriented simulation models can represent a shipyard’s multitude of
operations, people, and resources. Instead of investing large amounts of capital into untried
strategies, simulation models can compare current and proposed systems to validate a new idea’s
worth. Simulation software, however, comes at a premium cost for the product and its services so
would require an initial investment to get started. Simpler and more accessible simulation, like
Monte Carlo Simulation, can be used for risk analysis. When historical data is not available,
rough estimates of quantitative data can be modeled to produce a range of possible outcomes and
the probabilities that they will occur (most likely, least likely, somewhere in the middle). This
allows the user to see the consequences per risk level for their decisions. When examining the
estimates provided by the CG Yard, one can see the problem with using discrete man-hour
estimates instead of a distribution. Figures 5.2.1 and 5.2.2 show AFC30 and AFC45 work item
man-hours respectively after the CG Yard adjusted their original Section B task duration
estimates. These changes were made during progress on CGC IBIS as the CG Yard realized that

63
many task durations were underestimated. The overall difference between the updated estimates
and actual man-hours for AFC30 work items was only 36.75 man-hours.
The difference between the updated estimates and actual man-hours for AFC45 work items,
however, was much more significant at 1369.5 man-hours. Another important observation is that
the paint shop (X-42) used 137.25 man-hours more than estimated. This is a big red flag because
there is no room given current resources to add more hours.
Table 5.2.1 AFC30 Work Items’ Actual Required Man-hours Compared to Updated Estimated Man-hours.
Table 5.2.2 AFC45 Work Items’ Actual Required Man-hours Compared to Updated Estimated Man-hours.
Looking at the difference between the first set of task duration estimates and the updated
estimates (Table 5.2.3), it is easy to see the uncertainty in the CG Yard’s estimating techniques.
The spreadsheet modeling conducted in Chapter 4 utilized the original estimates that were much
lower than the updated and actual man-hours needed. The results of the spreadsheet model
showed no room for additional hours with their planned resources and schedule, so one can see
the problems the CG Yard will face by increasing their estimated man-hours by almost 24%.
Table 5.2.3 Over- and Underestimations for Project Task Durations and One Data Set for Actual Man-hours for CGC IBIS.
AFC-30 Work Items 11 12 13 14 21 22 23 24 31 32 33 41 42 43 61 TotalsActual Man-Hours 68 16 55 0 10 0 0 0 293 125 0 193 902 82 10 1752.3Estimated Man-Hours 81 28 54 0 16 0 8 0 250 125 0 218 916 83 10 1789Difference -13 -12 1 0 -6 0 -8 0 43 0 0 -25 -14 -2 0 -36.75
AFC-45 Work Items 11 12 13 14 21 22 23 24 31 32 33 41 42 43 61 TotalsActual Man-Hours 730 20 117 147 818 250 610 25 548 103 0 217 1779 748 819 6930Estimated Man-Hours 604 20 308 416 1115 285 1549 48 438 105 16 233 1642 694 826 8299Difference 126 0 -192 -270 -297 -35 -939 -23 110 -2 -16 -16 137 54 -7 -1370
IBIS Availability BreakdownEstimate (Updated) Estimate (Original) Actual
Total 10088 8152 8682
64
Using Monte Carlo Simulation in the estimating department at the CG Yard would be beneficial
prior to inputting task durations into a scheduler. Other simulation modeling techniques and
software referenced within the literature deal exactly with the structure of the 87’ Bow to Stern
Program and interface with Primavera. These methods, once marketed, would be an ideal
addition to the CG Yard’s software tools.
The CG Yard would also benefit greatly from the creation and implementation of a
comprehensive program-grading rubric. This would provide a baseline for capturing a program’s
overall success. Project managers often fail to complete projects on time and on budget. Many do
not realize that their project is no different from any other project; in fact they all run into the
same problems (Cooper 1994). There are four reasons why project managers tend to not learn
from past experiences: 1) belief that every project is different, 2) difficulty in understanding
causes of project performance, 3) projects are transient, and 4) limited span and career path make
transferring lessons learned difficult (Cooper et al 2002). The programs that the CG Yard adopts
are well intentioned, but are usually planned without looking back to historical data to determine
if the same methods succeeded in the past. This is in part due to incomplete data on past projects.
With the high turnover rate of upper management with military transfers, program successes can
be misrepresented. Military performance, particularly for the officers who make up the CG Yard
management team, is measured annually and rarely looks back past the current period. This
incentivizes an amplified assessment of recent years’ initiatives and potential long-term
achievements. Framing the impacts of the initiative as successful works for those initially
involved, but loses its flare once passed onto the next person, resulting in reduced efforts to

65
sustain the program. This could cause a program to look successful or not based on the newness
or creativeness of the idea.
The CG Yard uses Contract Workbook Database, an online project management tool, to
track project performance. The data for each project, if entered properly, includes percent
growth, number of change requests, delays, budget overages and numerous other quantitative
and qualitative descriptors. However, just like the problem with the Integrated Master Plan for
the schedulers, the managers do not have a comprehensive overview of the program as a whole.
Metrics quantify results through evaluation and production optimization. Operations are
managed by adjusting, measuring, or calculating decisions, inputs, outputs, outcomes, and
consequences. In order to collect data, a benchmarking and metrics program needs to be
developed. Benchmarking evaluates the products, services, and work processes in order to help
companies improve their performance by making policy and practice changes (Nasir et al 2012).
Performance is determined by constraints as well as a performance index, or an all-encompassing
view of the key performance indicators. There are three types of project performance: planned,
perceived, and real (Lee et al 2005). Project performance factors must be comprehensive in order
to ensure losses aren’t incurred elsewhere (Moreno 2006). Many project cost improvements
come from processes like teaming experienced people and staffing policies, while the other
improvements come from external conditions such as fewer customer changes, better hiring
conditions, and fewer problems with contractors and materials. Some policies and procedures
that could be considered, and should be verified with past data, include taking on projects with
more realistic timelines or a reduced scope, estimating off of the cutter (within the class) in worst
condition, teaming estimators, schedulers, and foremen together to fine-tune schedules, and
conducting a preemptive availability prior to the program start to get more realistic task duration

66
estimates and work sequencing. This would give the CG Yard the time it needs to adapt its
resources to accommodate the specific needs of the cutter class given the work package prior to
starting the high-tempo program. The ability to model projects using past data creates best
practices and lessons learned that could be brought forward for improved project management of
future projects (Cooper et al 2002).
Applying management techniques or strategies for project improvement without
understanding how they’ve impacted past projects can result in many wasted resources. Having a
clear set of measures of effectiveness for every project and an overall Program Grade will
provide management with a beneficial decision support tool when planning future programs. It
would also reduce a lot of the rework that currently goes into program process guides and
developing strategies for the various cutter classes and their particular needs.
Given the importance of implementing organizational efficiency improvements,
particularly the ones stated in the literature, a priority list has been developed in Table 5.2.4.
While in communication with the management of the CG Yard, they were interested in finding
solutions to two major business obstacles. First, they wanted an analysis of the Critical Chain
Project Management process used at the CG Yard with a recommendation of how to optimize
project management based on the tools and resources that they currently possess. Secondly, they
wanted an analysis of their scheduling processes and how to incorporate an Integrated Master
Plan (B.L. Melvin, personal communication-email/phone conversation March 31, 2014). With
these goals in mind, and understanding that the organization sees a need and is willing to
introduce new management techniques and tools, the list below states the most critical steps for
improved project management with the lowest cost (labor, tools, and time).

67
Table 5.2.4 Prioritized Organizational Efficiency Improvements based upon Feasibility for Implementation at the CG Yard.
CHAPTER 6
GENERAL CONCLUSIONS
6.1 Overall Findings
Through the use of spreadsheet models, the 87’ Bow to Stern Program’s resource loading
with three concurrent projects and a level-loading analysis of job shop X-11 were achieved. The
results of this analysis shows that given available resources (time, infrastructure, tools, people,
etc.), the loading of each availability will be to capacity, particularly within the paint shop, and
will cause or create worry for delay if not mitigated appropriately. For one availability, the 25.1
(22.2) person work crew is not ideal because the shifts are not being filled and the number of
people working in the small space is too high, therefore resources are wasted. Splitting the crew
in half (or some variation to meet the job shop work schedule for each cutter) lowers the people
per workspace, but also increases the majority of the availability’s workload to two shifts per
day. By adding the third cutter, the original crew is spread very thin in trying to complete
consecutive work on three cutters. If not managed appropriately, this could result in movement
waste as workers move from cutter to cutter.
Priority Business Improvements Feasibility For Implementation 1 Create Integrated Master Schedule High-Requires human capital to
develop 2 Implement Risk Management in
Estimating Task Duration High-Need historical data or MC Simulation
3 Verify Program Policies/Procedures with Past Data (If Available)
Medium-Requires Data & Data Analysis
4 Create Program Grading Rubric Medium-Requires Data & Data Analysis
5 Acquire New Software for Simulation Modeling & Schedule Optimization
Low-Large Capital Investment Required Plus Support Services
!

68
The level-loading analysis of job shop X-11 results in moderate man-hour loads over
small ranges of time within the project timeline. This allows for better planning of resources on a
weekly basis as opposed to daily resource adjustment, lower probabilities of needing overtime
and overmanning, and more routine work shifts for the workers. The planning labor required to
level-load all job shops by hand while keeping the integrity of work sequencing is extremely
difficult if not impossible to optimize. By implementing an Integrated Master Plan (IMP) into the
software capabilities of Oracle Primavera, shared resources can be loaded across all concurrent
projects throughout the shipyard. Any movement of resources in order to speed up higher
priority projects will result in adjustments to other projects and the use of other forms of
mitigation strategies.
If mitigation strategies need to be implemented beyond what an IMP can account for,
then the CG Yard needs to better understand how their workforce behaves, particularly at what
point in time fatigue from overtime negatively affects work quality. By conducting work studies
in an iterative fashion, the CG Yard will have better decision control over which responsive
actions to take when schedule risk occurs. Similarly, by adopting newer, preemptive strategies
that improve process cycle times, bolster worker skills, and eliminate common wastes, the
organization will be more flexible to changes in project schedule or resources.
6.2 Future Research
Due to the fact that the majority of the data for the completed and future projects are not
yet available, there are several opportunities in the future to analyze all 87’ Bow to Stern
Program cutter data. The descriptive statistics (mean, standard deviation, etc.) of actual man-
hours required to complete each project (broken down by subtask and job shop) given the

69
parallel work schedule, can be stored as historical estimating data for the CG Yard. This data can
also be compared against previous estimating methods to see how accurate the estimates really
were and then provide a benchmark for future programs. The method for organizing tasks
presented in this paper can be validated against the final iteration of the WBS and Gantt Chart to
determine if the assumptions made and procedures followed are sound. Risk management
techniques in estimating for CPM, like Monte Carlo Simulation, could be applied to determine
how it impacts the critical path. The CG Yard also needs to assess its current scheduling software
to ensure it is adequate enough to support concurrent projects. A cost benefit analysis should be
conducted for a proposal for adding features to current scheduling software and to develop an
Integrated Master Plan. Once created, an evaluation of past (without IMP) versus future project
(with IMP) performance should be made. Furthermore, the cost to develop optimization software
or an algorithm for level-loading projects to be used within existing scheduling software should
be considered. This would reduce the need to relearn new software and just add additional
capabilities for schedule analysis. Simulation modeling could be used in several areas of the CG
Yard to verify schedule risk mitigation strategies on overall production improvements. The
current and proposed scenarios for a single job shop, perhaps the paint shop, could be modeled to
see how adding a new tool or process (like Jobshop Lean or multiskilling) could reduce the
number of man-hours required for the availability prior to physical implementation.
6.3 Contributions
The analysis of the Coast Guard’s 87’ Bow to Stern Program using spreadsheet modeling,
presented an inexpensive, fairly straightforward, and valuable tool to make a detailed analysis of
raw data when dealing with limited software capabilities. The results of the analysis, and the

70
subsequent recommendations, highlight the many challenges government-run shipyards face
today. The limited number of competitive naval shipyards, highly skilled workforces, and capital
to invest in new technologies to improve project management put a strain on project managers to
derive solutions within their means. Furthermore, project managers have the onus to take on
large organizational improvements on top of their regular duties in order to make helpful
changes. Such challenges when faced with a unionized workforce, a military hierarchy, and short
tour lengths require exceptional leadership skills. Customers and workers alike have buy-in for
better work practices, but they need to be confident in the goals and methods of the management
team. The current planning tools at the CG Yard are not capable of providing that level of
confidence without implementation of an Integrated Master Plan and more robust estimating
methods.
This project also highlights the need for more industry-specific overtime studies that
focus more on application and less on theory. In order to avoid overages on budget and schedule,
strategies for compressing task times need to be analyzed to ensure their impact on the feedback
loop is balancing and not reinforcing. Methods for analyzing worker fatigue, the calculations
needed to determine worker efficiency, and the impacts of learning, forgetting, and preemption
all impact the overall capabilities of the workforce. By understanding how workers behave in a
specific industry, project managers can make well thought out decisions in the face of project
crises.

71
REFERENCES
1. Anderson, J. and J. Upton. “Unleashing the Predictive Power of the Integrated Master
Schedule.” Defense At&I. 41.1 (2012). Print.
2. Ash, R. and D.E. Smith-Daniels. “The Effects of Learning, Forgetting, and Relearning on
Decision Rule Performance in Multiproject Scheduling.” Decision Sciences. 30.1 (1999)
47-82. Print.
3. Boucher, T.O. “Some Implications of Learning Theory for Assembly Line Design and
Labor Productivity.” Engineering Costs and Production Economics. 11.1 (1987) 31-38.
Print.
4. Brown, G.G., R.F Dell, R.L. Davis, and R.H. Duff. “Optimizing Plant-Line Schedules
and an Application at Hidden Valley Manufacturing Company.” Interfaces. 32.3 (2002)
1-14. Print.
5. Brunies, R. and Z. Emir. “Calculating loss of productivity due to overtime using
published charts-fact or fiction.” The Revay Report. 20.3 (2001) 1-8. Print.
6. Burleson, R.C., C.T. Haas, R.L. Tucker, and A. Stanley. “Multiskilled Labor Utilization
Strategies in Construction.” Journal of Construction Engineering and Management.
124.6 (1998): 480-489. Print.
7. Coast Guard Yard News. “Yard Begins 87’ ‘Bow-to-Stern’ Dry-Dock Program.” 63.06
November-December 2014. 1-5. Print.
8. Coast Guard Yard Website. Web < http://www.uscg.mil/hq/cg4/yard/Yard-Capabilities-
Oct14.pdf>
9. Cooper, K.G. “The $2000 hour: how managers influence project performance through the
rework cycle.” Project Management Journal. 25.1 (1994) 11-24. Print.

72
10. Cooper, K.G., J.M. Lyneis, and B.J. Bryant. “Learning to Learn, from Past to Future.”
International Journal of Project Management. 20.3 (2002): 213-219. Print.
11. CPM Tutor. 2010. Web < http://www.cpmtutor.com/c08/timecosttradeoff.html>
12. Easa, S.M. “Resource Leveling in Construction by Optimization.” Journal of
Construction Engineering and Management. 115.2 (1989): 302-316. Print.
13. Fondahl, J.W. “Non-Computer Approach to the Critical Path Method for the Construction
Industry.” Report #9, Stanford University, 1961.
14. General Dynamics-NASSCO. “Nested Material Manufacturing Technology
Improvement.” Center for Naval Shipbuilding Technology (CNST) Project Final Report.
(2008) Web < http://www.cnst.us/Documents/Reports/Nested_Matl_Final_Report.pdf>
15. Gokcen, H., K. Agpak, and R. Benzer. “Balancing of Parallel Assembly Lines.”
International Journal of Production Economics. 103.1 (2006) 600-609. Print.
16. Greze, L., R. Pellerin, P. Leclaire, and N. Perrier. “Cigi2011: a Heuristic Method for
Resource-Constrained Project Scheduling with Activity Overlapping.” Journal of
Intelligent Manufacturing. 25.4 (2014): 797-811. Print.
17. Hendricksen, C. and T. Au. Project Management for Construction: Fundamental
Concepts for Owners, Engineers, Architects, and Builders. Englewood Cliffs, NJ:
Prentice Hall, 1989. Print.
18. Heuser, W.A. and B.E. Wynne. “An Application of the Critical Path Method to Job Shop
Scheduling: A Case Study.” Management Science. (1963): 128-144. Print.
19. Hughes, R. and P. Stone. “The Perils of Shift Work: Evening Shift, Night Shift, and
Rotating Shifts: Are They For You?” The American Journal of Nursing. 104.9 (2004):
60-63. Print.

73
20. Jamal, M. and S.M. Jamal. “Work and Nonwork Experiences of Employees on Fixed and
Rotating Shifts: an Empirical Assessment.” Journal of Vocational Behavior. 20.3 (1982):
282-293. Print.
21. Kim, I. and H.L. Seo. “Depreciation and Transfer of Knowledge: An Empirical
Exploration of a Shipbuilding Process.” International Journal of Production Research.
47.7 (2009) 1857-1876. Print.
22. Lagodimos, A.G., and A.N. Mihiotis. “Overtime Vs. Regular Shift Planning Decisions in
Packing Shops.” International Journal of Production Economics. 101.2 (2006): 246-258.
Print.
23. Lee, S., F. Pena-Mora, and M. Park. “Quality and Change Management Model for Large
Scale Concurrent Design and Construction Projects.” Journal of Construction
Engineering and Management. 131.8 (2005): 890-902. Print.
24. Levitt, J. The Handbook of Maintenance Management. Industrial Press Inc., 2009. Print.
25. Liberatore, M.J. “Critical Path Analysis with Fuzzy Activity Times.” IEEE Transactions
on Engineering Management. 55.2 (2008): 329-337. Print.
26. Lim, T.K., C.Y. Yi, D.E. Lee, and D. Arditi. “Concurrent Construction Scheduling
Simulation Algorithm.” Computer-aided Civil and Infrastructure Engineering. 29.6
(2014): 449-463. Print.
27. Linton, J.D., and S.T. Walsh. “Extracting Value from Learning Curves: Integrating
Theory and Practice.” Creativity and Innovation Management. 22.1 (2013) 10-25. Print.
28. Loushine, T.W., P.L.T. Hoonakker, P. Carayon, and M.J. Smith. “Quality and Safety
Management in Construction.” Total Quality Management & Business Excellence. 17.9
(2006): 1171-1212. Print.

74
29. Lyneis, J.M. and D.N. Ford. "System Dynamics Applied to Project Management: a
Survey, Assessment, and Directions for Future Research." System Dynamics Review. 23.2
(2007): 157. Print.
30. Mayer, B., S. Irani, and H. Adra. “Virtual Shop Clusters: A New Layout Concept for a
Ship Repair and Maintenance Facility.” American Society of Naval Engineers. 2.1 (2008)
99-111. Print.
31. Moreno, C.W. “Optimization in Production Operations: Optimal ‘Lean Operations’ in
Manufacturing.” Ultramax Corporation. (2006)
32. Nakoa, G.N. WPB-87 Bow to Stern Specification for Drydock Repairs, Revision 0. 28
Apr. 2014. Raw Data. N.p.
33. Naris, H., C.T. Haas, J.H. Rankin, A.R. Fayek, D. Forgues, and J. Ruwanpura.
“Development and Implementation of a Benchmarking and Metrics Program for
Construction Performance and Productivity Improvement.” Canadian Journal of Civil
Engineering. 39.9 (2012): 957-967. Print.
34. Patel, P.C. and B. Concklin. “Perceived Labor Productivity in Small Firms-The Effects of
High-Performance Work Systems and Group Culture Through Employee Retention.”
Entrepreneurship Theory and Practice. 36.2 (2012): 205-235. Print.
35. Scholl, A., N. Boysen, and M. Fliedner. “The sequence-dependent assembly line
balancing problem.” OR Spectrum. 30.1 (2008) 579-609. Print.
36. Singh, A. “Accelerated work-schedule design considering efficiency losses for overtime
and overmanning.” Engineering, Construction and Architectural Management. 10.5
(2003) 312-321. Print.

75
37. Sonmez, R. “Impact of occasional overtime on construction labor productivity:
quantitative analysis.” Canadian Journal of Civil Engineering. 34.7 (2007) 803. Print.
38. Taylor, T.R.B. and D.N Ford. "Managing Tipping Point Dynamics in Complex
Construction Projects." Journal of Construction Engineering and Management. 134.6
(2008): 421-431. Print.
39. Wang, Y., P. Goodrum, C. Haas, and R. Glover. “Analysis of Observed skill affinity
patterns and motivation for multiskilling among craft workers in the U.S. Industrial
Construction Sector.” Journal of Construction Engineering and Management. 135.10
(2009) 999-1008. Print.
40. Weaver, P. “A Brief History of Scheduling: Back to the Future.” MyPrimavera
Conference. 4-6 April, 2006.
41. United States Coast Guard. Web <www.uscg.mil/datasheet/87wpb.asp> Updated
5/11/2015.
42. U.S. Coast Guard Industrial Yard. WPB-87 Bow to Stern Cumulative Cost Report for
CGC IBIS. 18 Feb. 2015. Raw Data. N.p.
43. U.S. Coast Guard Industrial Yard. WPB-87 Bow to Stern Section B. 18 Sep. 2014. Raw
Data. N.p.
44. U.S. Coast Guard Industrial Yard. WPB-87 Bow to Stern Work Breakdown Structure for
CGC IBIS. 17 Oct. 2014. Raw Data. N.p.
45. U.S. Coast Guard Industrial Yard. WPB-87 Bow to Stern Work Breakdown Structure for
CGC POMPANO. 24 Feb. 2015. Raw Data. N.p.

76
46. U.S. Government Accountability Office. “Navy Shipbuilding: Opportunities Exist to
Improve Practices Affecting Quality.” Report to Congressional Committees GAO-14-
122. November 2013. 1-106. Print.
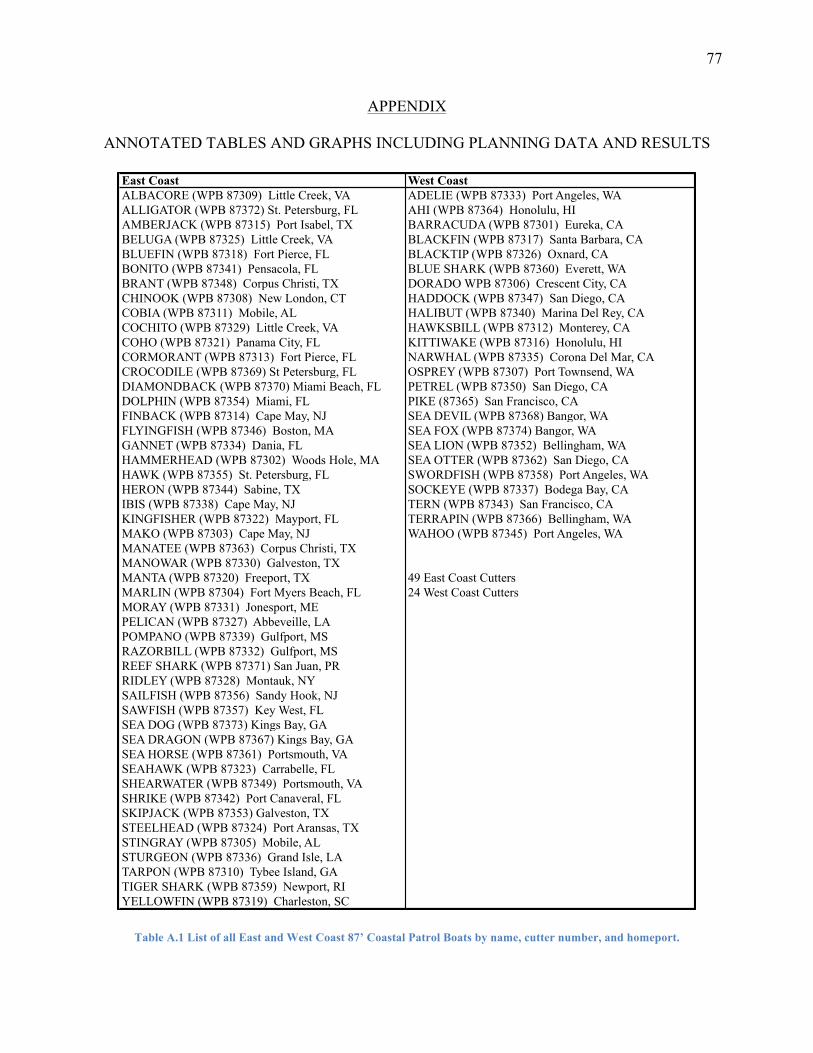
77
APPENDIX
ANNOTATED TABLES AND GRAPHS INCLUDING PLANNING DATA AND RESULTS
Table A.1 List of all East and West Coast 87’ Coastal Patrol Boats by name, cutter number, and homeport.
East Coast West CoastALBACORE (WPB 87309) Little Creek, VA ADELIE (WPB 87333) Port Angeles, WAALLIGATOR (WPB 87372) St. Petersburg, FL AHI (WPB 87364) Honolulu, HIAMBERJACK (WPB 87315) Port Isabel, TX BARRACUDA (WPB 87301) Eureka, CABELUGA (WPB 87325) Little Creek, VA BLACKFIN (WPB 87317) Santa Barbara, CABLUEFIN (WPB 87318) Fort Pierce, FL BLACKTIP (WPB 87326) Oxnard, CABONITO (WPB 87341) Pensacola, FL BLUE SHARK (WPB 87360) Everett, WABRANT (WPB 87348) Corpus Christi, TX DORADO WPB 87306) Crescent City, CACHINOOK (WPB 87308) New London, CT HADDOCK (WPB 87347) San Diego, CACOBIA (WPB 87311) Mobile, AL HALIBUT (WPB 87340) Marina Del Rey, CACOCHITO (WPB 87329) Little Creek, VA HAWKSBILL (WPB 87312) Monterey, CACOHO (WPB 87321) Panama City, FL KITTIWAKE (WPB 87316) Honolulu, HICORMORANT (WPB 87313) Fort Pierce, FL NARWHAL (WPB 87335) Corona Del Mar, CACROCODILE (WPB 87369) St Petersburg, FL OSPREY (WPB 87307) Port Townsend, WADIAMONDBACK (WPB 87370) Miami Beach, FL PETREL (WPB 87350) San Diego, CADOLPHIN (WPB 87354) Miami, FL PIKE (87365) San Francisco, CAFINBACK (WPB 87314) Cape May, NJ SEA DEVIL (WPB 87368) Bangor, WAFLYINGFISH (WPB 87346) Boston, MA SEA FOX (WPB 87374) Bangor, WAGANNET (WPB 87334) Dania, FL SEA LION (WPB 87352) Bellingham, WAHAMMERHEAD (WPB 87302) Woods Hole, MA SEA OTTER (WPB 87362) San Diego, CAHAWK (WPB 87355) St. Petersburg, FL SWORDFISH (WPB 87358) Port Angeles, WAHERON (WPB 87344) Sabine, TX SOCKEYE (WPB 87337) Bodega Bay, CAIBIS (WPB 87338) Cape May, NJ TERN (WPB 87343) San Francisco, CAKINGFISHER (WPB 87322) Mayport, FL TERRAPIN (WPB 87366) Bellingham, WAMAKO (WPB 87303) Cape May, NJ WAHOO (WPB 87345) Port Angeles, WAMANATEE (WPB 87363) Corpus Christi, TXMANOWAR (WPB 87330) Galveston, TXMANTA (WPB 87320) Freeport, TX 49 East Coast CuttersMARLIN (WPB 87304) Fort Myers Beach, FL 24 West Coast CuttersMORAY (WPB 87331) Jonesport, MEPELICAN (WPB 87327) Abbeveille, LAPOMPANO (WPB 87339) Gulfport, MSRAZORBILL (WPB 87332) Gulfport, MSREEF SHARK (WPB 87371) San Juan, PRRIDLEY (WPB 87328) Montauk, NYSAILFISH (WPB 87356) Sandy Hook, NJSAWFISH (WPB 87357) Key West, FLSEA DOG (WPB 87373) Kings Bay, GASEA DRAGON (WPB 87367) Kings Bay, GASEA HORSE (WPB 87361) Portsmouth, VASEAHAWK (WPB 87323) Carrabelle, FLSHEARWATER (WPB 87349) Portsmouth, VASHRIKE (WPB 87342) Port Canaveral, FLSKIPJACK (WPB 87353) Galveston, TXSTEELHEAD (WPB 87324) Port Aransas, TXSTINGRAY (WPB 87305) Mobile, ALSTURGEON (WPB 87336) Grand Isle, LATARPON (WPB 87310) Tybee Island, GATIGER SHARK (WPB 87359) Newport, RIYELLOWFIN (WPB 87319) Charleston, SC

78
Table A.2 Job Shop X-11 Original and Level-Loaded Subtask Breakdown with man-hours and scheduled completion
dates.
Work Item # Description Job Shop Man-Hours Date to Complete Updated WBS Sequencingwi 10 preparation x11 4.00 12/31-1/2 5-Janwi 10 alignment x11 4.00 12/31-1/2 5-Janwi 15 preparation x11 12.00 11/14-11/22 11/14-11/21wi 16 protective meas. x11 2.00 11/6-11/12 7-Novwi 16 remove (propeller) x11 2.00 11/6-11/12 11/7-11/13wi 2 ut shots x11 8.00 1-Dec 11/23-12/2wi 20 visual inspection x11 2.00 4-Nov 11/5-11/6wi 20 remove (stern launch door) x11 10.00 11/6-11/12 11/7-11/13wi 20 install (bracing) x11 4.00 11/6-11/12 11/7-11/13wi 20 install (stern launch door) x11 10.00 18-Dec 12/12-12/26wi 21 open tanks x11 2.00 5-Nov 11/5-11/6wi 21 inspect tanks x11 4.00 12-Nov 13-Novwi 21 final inspect x11 8.00 12/11-12/16 12/12-12/26wi 21 close tanks x11 4.00 12/11-12/16 12/12-12/26wi 22 open tanks x11 2.00 5-Nov 11/5-11/6wi 22 inspect tanks x11 4.00 12-Nov 13-Novwi 22 final inspect x11 8.00 12/11-12/16 12/12-12/26wi 22 close tanks x11 2.00 12/11-12/16 12/12-12/26wi 25 preps/removals x11 10.00 13-Nov 11/7-11/13wi 25 reinstalls x11 10.00 12/11-12/16 12/12-12/26wi 26 preparation x11 14.00 13-Nov 11/7-11/13wi 26 reinstalls x11 10.00 12/11-12/29 12/12-12/26wi 27 preps/removals x11 16.00 11/6-11/12 4-5NOVwi 27 reinstalls x11 19.00 12/17-12/29 12/12-12/26wi 28 preps/removals x11 14.00 11/6-11/13 11/7-11/13wi 28 reinstalls x11 16.00 12/11-12/29 12/12-12/26wi 29 renew zinc anodes x11 34.00 12/11-12/16 12/12-12/18wi 30 dry dock vsl x11 18.00 6-Nov 7-Novwi 30 undock vsl x11 9.00 30-Dec 2-Janwi 33 crop/renew x11 45.00 11/23-12/2 11/23-12/2wi 34 preps/removals x11 10.00 13-Nov 11/7-11/13wi 34 reinstalls x11 6.00 12/11-12/16 12/12-12/26wi 36 protective meas. x11 2.00 11/6-11/12 11/7-11/13wi 36 interferences x11 4.00 11/6-11/12 11/7-11/13wi 36 major misalignment x11 8.00 11/13-12/2 11/17-11/18wi 36 remove (shafts) x11 7.00 11/6-11/12 11/7-11/13wi 36 inspections x11 4.00 11/6-11/12 11/7-11/23wi 3a open tanks x11 18.00 5-Nov 11/5-11/6wi 3a final inspect x11 2.00 12/11-12/16 12/19-12/26wi 3a close tanks x11 18.00 12/11-12/16 12/19-12/26wi 3b remove (framing) x11 10.00 11/24-12/2 11/7-11/23wi 3b cut access holes x11 20.00 11/24-12/2 11/7-11/23wi 3b install (framing) x11 10.00 12/11-12/16 12/19-12/26wi 3b reinstalls x11 16.00 12/11-12/16 12/19-12/26wi 4a open tanks x11 18.00 5-Nov 11/5-11/6wi 4a final inspect x11 2.00 12/11-12/16 12/19-12/26wi 4a close tanks x11 18.00 12/11-12/16 12/19-12/26wi 4b reinstalls x11 8.00 12/11-12/16 12/19-12/26wi 4b preps/removals x11 8.00 11/24-12/2 11/7-11/23wi 5 open tanks x11 2.00 5-Nov 11/5-11/6wi 5 inspect tanks x11 2.00 12-Nov 11/7-11/13wi 5 final inspect x11 6.00 12/11-12/16 12/12-12/26wi 5 close tanks x11 2.00 12/11-12/16 12/12-12/26wi 6 final inspect x11 6.00 12/11-12/16 12/12-12/26wi 6 close tanks x11 2.00 12/11-12/16 12/12-12/26wi 6 open tanks x11 2.00 5-Nov 11/5-11/6wi 6 inspect tanks x11 2.00 12-Nov 11/7-11/13wi 7 open tanks x11 4.00 5-Nov 11/5-11/6wi 7 inspect tanks x11 8.00 12-Nov 11/7-11/13wi 7 final inspect x11 10.00 12/11-12/16 12/12-12/26wi 7 close tanks x11 4.00 12/11-12/16 12/12-12/26wi 8 open tanks x11 4.00 5-Nov 11/5-11/6wi 8 inspect tanks x11 6.00 12-Nov 11/7-11/13wi 8 final inspect x11 4.00 12/11-12/16 12/12-12/26wi 8 close tanks x11 2.00 12/11-12/16 12/12-12/26
wi 9 preps/removals x11 4.00 11/6-11/12 11/7-11/13Total Hours 566.00

79
Figure A.1 Calendar Schedule Representation of Job Shop X-11 Loading over Three Parallel Availabilities.
Table A.3 Job Shop X-12 Subtask Breakdown with man-hours and scheduled completion dates.
Availability Start Date Weekends/Holidays
X-11 4-N
ov
5-N
ov
6-N
ov
7-N
ov
8-N
ov
9-N
ov
10-N
ov
11-N
ov
12-N
ov
13-N
ov
14-N
ov
15-N
ov
16-N
ov
17-N
ov
18-N
ov
19-N
ov
20-N
ov
21-N
ov
22-N
ov
23-N
ov
24-N
ov
25-N
ov
26-N
ov
27-N
ov
28-N
ov
IBIS 2 52 34.6 16.6 16.6 42.6 36.8 2 4 4 4 4 2 13.8 13.8 13.8 13.8STINGRAYHAMMERHEADTOTAL MHs 2 52 34.6 16.6 0 0 16.6 0 42.6 36.8 2 0 0 4 4 4 4 2 0 0 13.8 13.8 13.8 0 13.8
X-11 29-N
ov
30-N
ov
1-D
ec
2-D
ec
3-D
ec
4-D
ec
5-D
ec
6-D
ec
7-D
ec
8-D
ec
9-D
ec
10-D
ec
11-D
ec
12-D
ec
13-D
ec
14-D
ec
15-D
ec
16-D
ec
17-D
ec
18-D
ec
19-D
ec
20-D
ec
21-D
ec
22-D
ec
23-D
ec
IBIS 21.8 13.8 47.7 47.7 47.7 47.7 4.6 14.6 4.6 4.6 4.6STINGRAY 2 52 34.6 16.6 16.6 42.6 36.8 2 4 4 4 4 2 13.8 13.8HAMMERHEADTOTAL MHs 0 0 23.8 65.8 34.6 16.6 16.6 0 0 0 42.6 36.8 49.7 51.7 0 0 51.7 51.7 8.6 14.6 6.6 0 0 18.4 18.4
X-11 24-D
ec
25-D
ec
26-D
ec
27-D
ec
28-D
ec
29-D
ec
30-D
ec
31-D
ec
1-Ja
n
2-Ja
n
3-Ja
n
4-Ja
n
5-Ja
n
6-Ja
n
7-Ja
n
8-Ja
n
9-Ja
n
10-J
an
11-J
an
12-J
an
13-J
an
14-J
an
IBIS 4.6 4.6 4.6 9 4 4STINGRAY 13.8 13.8 21.8 13.8 47.7 47.7 47.7 47.7 4.6 14.6HAMMERHEAD 2 52 34.6 16.6 16.6 42.6 36.8TOTAL MHs 18.4 0 18.4 0 0 26.4 22.8 4 0 4 0 0 2 52 82.3 64.3 64.3 0 0 47.7 47.2 51.4
Work Item # Description Job Shop Man-Hours Date to Completewi 20 remove (stern launch door) x12 4.00 11/6-11/12wi 20 install (bracing) x12 4.00 6-Nov
wi 21 open tanks x12 6.00 5-Novwi 21 final inspect x12 6.00 15-Dec
Total Hours 20.00

80
Figure A.2 Calendar Schedule Representation of Job Shop X-12 Loading over Three Parallel Availabilities.
Availability Start Date Weekends/Holidays
X-12 4-N
ov5-
Nov
6-N
ov7-
Nov
8-N
ov9-
Nov
10-N
ov11
-Nov
12-N
ov13
-Nov
14-N
ov15
-Nov
16-N
ov17
-Nov
18-N
ov19
-Nov
20-N
ov21
-Nov
22-N
ov23
-Nov
24-N
ov25
-Nov
26-N
ov27
-Nov
28-N
ov
IBIS 6 4 4STINGRAYHAMMERHEADTOTAL MHs 0 6 4 4 0 0 0 0 0 0 0 0 0 0 0 0 0 0 0 0 0 0 0 0 0
X-12 29-N
ov30
-Nov
1-D
ec2-
Dec
3-D
ec4-
Dec
5-D
ec6-
Dec
7-D
ec8-
Dec
9-D
ec10
-Dec
11-D
ec12
-Dec
13-D
ec14
-Dec
15-D
ec16
-Dec
17-D
ec18
-Dec
19-D
ec20
-Dec
21-D
ec22
-Dec
23-D
ec
IBIS 6STINGRAY 6 4 4HAMMERHEADTOTAL MHs 0 0 0 6 4 4 0 0 0 0 0 0 0 0 0 0 6 0 0 0 0 0 0 0 0
X-12 24-D
ec25
-Dec
26-D
ec27
-Dec
28-D
ec29
-Dec
30-D
ec31
-Dec
1-Ja
n2-
Jan
3-Ja
n4-
Jan
5-Ja
n6-
Jan
7-Ja
n8-
Jan
9-Ja
n10
-Jan
11-J
an12
-Jan
13-J
an14
-Jan
IBISSTINGRAYHAMMERHEAD 6 4 4TOTAL MHs 0 0 0 0 0 0 0 0 0 0 0 0 0 6 4 4 0 0 0 0 0 0 0 0 0
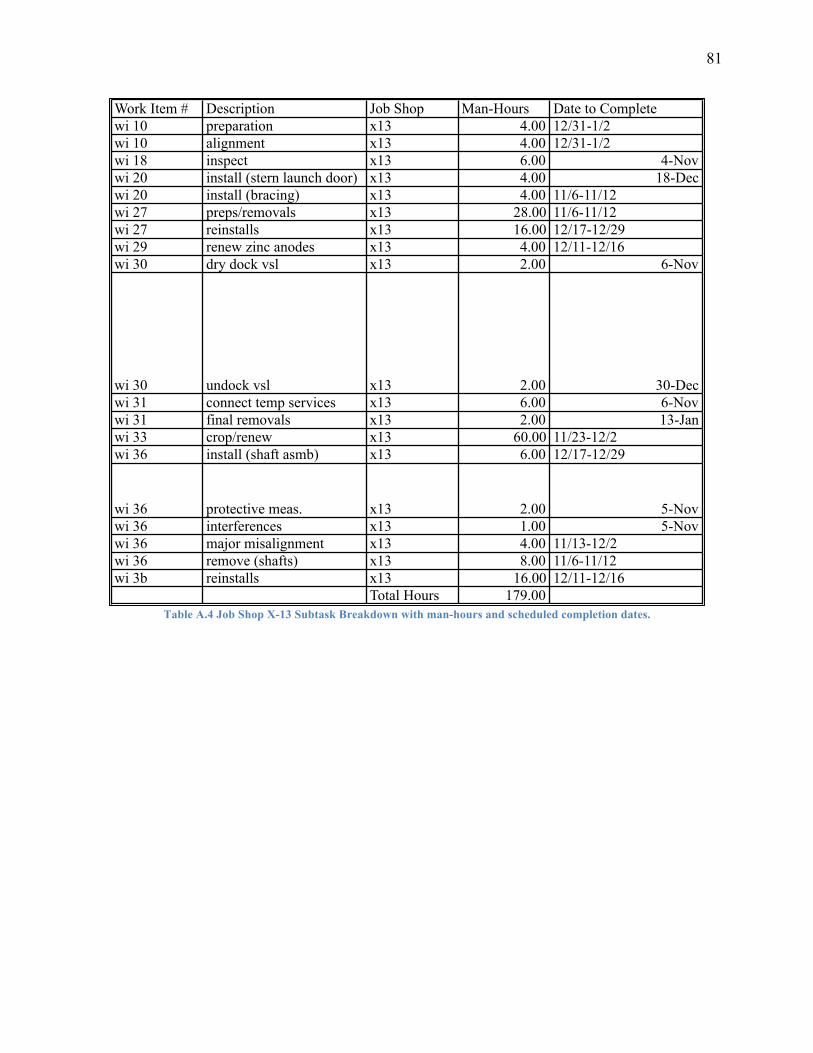
81
Table A.4 Job Shop X-13 Subtask Breakdown with man-hours and scheduled completion dates.
Work Item # Description Job Shop Man-Hours Date to Completewi 10 preparation x13 4.00 12/31-1/2wi 10 alignment x13 4.00 12/31-1/2wi 18 inspect x13 6.00 4-Novwi 20 install (stern launch door) x13 4.00 18-Decwi 20 install (bracing) x13 4.00 11/6-11/12wi 27 preps/removals x13 28.00 11/6-11/12wi 27 reinstalls x13 16.00 12/17-12/29wi 29 renew zinc anodes x13 4.00 12/11-12/16wi 30 dry dock vsl x13 2.00 6-Nov
wi 30 undock vsl x13 2.00 30-Decwi 31 connect temp services x13 6.00 6-Novwi 31 final removals x13 2.00 13-Janwi 33 crop/renew x13 60.00 11/23-12/2wi 36 install (shaft asmb) x13 6.00 12/17-12/29
wi 36 protective meas. x13 2.00 5-Novwi 36 interferences x13 1.00 5-Novwi 36 major misalignment x13 4.00 11/13-12/2wi 36 remove (shafts) x13 8.00 11/6-11/12wi 3b reinstalls x13 16.00 12/11-12/16
Total Hours 179.00

82
Figure A.3 Calendar Schedule Representation of Job Shop X-13 Loading over Three Parallel Availabilities.
Table A.5 Job Shop X-14 Subtask Breakdown with man-hours and scheduled completion dates.
Availability Start Date Weekends/Holidays
X-13 4-N
ov
5-N
ov
6-N
ov
7-N
ov
8-N
ov
9-N
ov
10-N
ov
11-N
ov
12-N
ov
13-N
ov
14-N
ov
15-N
ov
16-N
ov
17-N
ov
18-N
ov
19-N
ov
20-N
ov
21-N
ov
22-N
ov
23-N
ov
24-N
ov
25-N
ov
26-N
ov
27-N
ov
28-N
ov
IBIS 6 3 18 10 10 10 4 10 10 10 10STINGRAYHAMMERHEADTOTAL MHs 6 3 18 10 0 0 10 0 10 4 0 0 0 0 0 0 0 0 0 0 10 10 10 0 10
X-13 29-N
ov
30-N
ov
1-D
ec
2-D
ec
3-D
ec
4-D
ec
5-D
ec
6-D
ec
7-D
ec
8-D
ec
9-D
ec
10-D
ec
11-D
ec
12-D
ec
13-D
ec
14-D
ec
15-D
ec
16-D
ec
17-D
ec
18-D
ec
19-D
ec
20-D
ec
21-D
ec
22-D
ec
23-D
ec
IBIS 10 10 5 5 5 5 2.8 2.8 2.8 2.8 2.8STINGRAY 6 3 18 10 10 10 4 10 10 10HAMMERHEADTOTAL MHs 0 0 16 13 18 10 0 0 10 0 10 4 5 5 0 0 5 5 2.8 2.8 2.8 0 10 13 13
X-13 24-D
ec
25-D
ec
26-D
ec
27-D
ec
28-D
ec
29-D
ec
30-D
ec
31-D
ec
1-Ja
n
2-Ja
n
3-Ja
n
4-Ja
n
5-Ja
n
6-Ja
n
7-Ja
n
8-Ja
n
9-Ja
n
10-J
an
11-J
an
12-J
an
13-J
an
14-J
an
IBIS 2.8 2.8 2.8 2 4 4 2STINGRAY 10 10 0 10 10 0 0 0 0 0 0 0 5 5 0 0 5 5 2.8 6.8HAMMERHEAD 6 3 18 10 10 10 4TOTAL MHs 13 0 13 0 0 13 12 4 0 4 0 0 6 3 23 15 0 0 15 5 15 11
Work Item # Description Job Shop Man-Hours Date to Completewi 10 preparation x14 8.00 12/31-1/2wi 10 alignment x14 8.00 12/31-1/2wi 16 remove (propeller) x14 2.00 11/6-11/12wi 20 install (bracing) x14 8.00 6-Novwi 20 install (stern launch door)x14 8.00 18-Decwi 27 preps/removals x14 14.00 11/6-11/12wi 27 reinstalls x14 14.00 1/9-1/13wi 33 crop/renew x14 60.00 11/14-11/22wi 36 install (shaft asmb) x14 12.00 12/17-12/29wi 36 interferences x14 2.00 PRIOR TO 11/6wi 36 remove (shafts) x14 18.00 11/6-11/12wi 3b cut access holes x14 24.00 11/23-12/2
wi 3b reinstalls x14 42.00 12/11-12/16Total Hours 220.00

83
Figure A.4 Calendar Schedule Representation of Job Shop X-14 Loading over Three Parallel Availabilities.
Availability Start Date Weekends/Holidays
X-14 4-N
ov
5-N
ov
6-N
ov
7-N
ov
8-N
ov
9-N
ov
10-N
ov
11-N
ov
12-N
ov
13-N
ov
14-N
ov
15-N
ov
16-N
ov
17-N
ov
18-N
ov
19-N
ov
20-N
ov
21-N
ov
22-N
ov
23-N
ov
24-N
ov
25-N
ov
26-N
ov
27-N
ov
28-N
ov
IBIS 2 10.5 10.5 10.5 10.5 10 10 10 10 10 10 4 4 4 4 14STINGRAYHAMMERHEADTOTAL MHs 2 10.5 10.5 0 0 10.5 0 10.5 0 10 0 0 10 10 10 10 10 0 0 4 4 4 0 4 14
X-14 29-N
ov
30-N
ov
1-D
ec
2-D
ec
3-D
ec
4-D
ec
5-D
ec
6-D
ec
7-D
ec
8-D
ec
9-D
ec
10-D
ec
11-D
ec
12-D
ec
13-D
ec
14-D
ec
15-D
ec
16-D
ec
17-D
ec
18-D
ec
19-D
ec
20-D
ec
21-D
ec
22-D
ec
23-D
ec
IBIS 4 4 10.5 10.5 10.5 11 1.7 8 2 1.7 1.7STINGRAY 2 10.5 10.5 10.5 10.5 10 10 10 10 10 10 4 4 4HAMMERHEADTOTAL MHs 0 0 6 14.5 10.5 0 0 10.5 0 10.5 0 10 10.5 10.5 10 10 20.5 21 12 8 2 4 4 5.7 1.7
X-14 24-D
ec
25-D
ec
26-D
ec
27-D
ec
28-D
ec
29-D
ec
30-D
ec
31-D
ec
1-Ja
n
2-Ja
n
3-Ja
n
4-Ja
n
5-Ja
n
6-Ja
n
7-Ja
n
8-Ja
n
9-Ja
n
10-J
an
11-J
an
12-J
an
13-J
an
14-J
an
IBIS 1.7 1.7 1.7 8 8 4.67 4.7 5STINGRAY 4 4 4 10.5 10.5 10.5 10.5 1.7 8 1.7HAMMERHEAD 2 10.5 10.5 11 11 10TOTAL MHs 5.7 0 5.7 0 0 5.7 0 8 0 8 0 0 2 21 21 10.5 15.17 11 0 17 13 11.7

84
Table A.6 Job Shop X-21 Subtask Breakdown with man-hours and scheduled completion dates.
Work Item # Description Job Shop Man-Hours Date to Completesupport service per day x21support services x21 45.00 0.9375wi 10 preparation x21 4.00 12/31-1/2wi 10 alignment x21 4.00 12/31-1/2wi 17 remove (exhaust lagging) x21 24.00 12/1-12/16wi 17 install/test x21 32.00 12/17-12/29wi 18 remove (valve/strainer) x21 40.00 11/6-11/12wi 18 clean/inspect x21 36.00 11/13-12/1wi 18 install (valve/strainers) x21 40.00 12/1-12/16wi 18 op test x21 27.00 12/17-12/29wi 18 inspect x21 27.00 11/13-12/1wi 20 interferences x21 6.00 11/6-11/12wi 20 op test x21 2.00 11/4 and 12/22wi 20 visual inspection x21 1.00 4-Novwi 20 install (stern launch door) x21 9.00 18-Decwi 21 inspect tanks x21 6.00 12-Novwi 21 final inspect x21 6.00 12/11-12/16wi 22 inspect tanks x21 10.00 12-Novwi 22 final inspect x21 6.00 12/11-12/16wi 23 install (spool) x21 12.00 12/11-12/16wi 23 inspect x21 6.00 12/17-12/29wi 23 install (tank valves) x21 10.00 12/11-12/29wi 23 op test x21 10.00 11/13 and 12/17-29wi 24 install (spool) x21 10.00 12/11-12/16wi 24 inspect x21 6.00 12/17-12/29wi 24 install (tank valves) x21 6.00 12/11-12/16wi 24 op test x21 8.00 11/13 and 12/17-29wi 25 preps/removals x21 4.00 11/6-11/13wi 26 preparation x21 20.00 11/6-11/13wi 26 reinstalls x21 20.00 12/11-12/16wi 28 preps/removals x21 6.00 11/6-11/13wi 28 reinstalls x21 6.00 12/11-12/16wi 30 dry dock vsl x21 12.00 6-Novwi 30 undock vsl x21 12.00 30-Decwi 31 connect temp services x21 9.00 11/6-11/12wi 31 final removals x21 9.00 13-Janwi 32 sea trials x21 48.00 1/9-1/13wi 32 ride in x21 8.00 4-Novwi 33 crop/renew x21 60.00 11/23-12/2wi 34 preps/removals x21 2.00 11/6-11/13wi 34 reinstalls x21 2.00 12/11-12/16wi 35 remove (shaft seal) x21 18.00 11/6-11/12wi 35 install/test/preserve x21 32.00 12/17-12/29wi 36 remove (shafts) x21 2.00 11/6-11/12wi 37 water hose test x21 2.00 12/17-12/29wi 3b remove (steering) x21 10.00 11/23-12/2wi 3b remove (bilge) x21 4.00 11/23-12/2wi 3b remove (l/o) x21 14.00 11/23-12/2wi 3b install (steering) x21 10.00 12/11-12/16wi 3b install (bilge) x21 4.00 12/11-12/16wi 3b install (l/o) x21 14.00 12/11-12/16wi 4b reinstalls x21 32.00 12/11-12/16wi 4b preps/removals x21 24.00 11/23-12/2wi 5 inspect tanks x21 3.00 12-Novwi 5 final inspect x21 2.00 12/11-12/16wi 6 final inspect x21 2.00 12/11-12/16wi 6 inspect tanks x21 3.00 12-Novwi 7 inspect tanks x21 6.00 12-Novwi 7 final inspect x21 2.00 12/11-12/16wi 8 inspect tanks x21 4.00 12-Novwi 8 final inspect x21 2.00 12/11-12/16wi 8 close tanks x21 15.00 12/11-12/16
Total Hours 816.00

85
Figure A.5 Calendar Schedule Representation of Job Shop X-21 Loading over Three Parallel Availabilities.
Table A.7 Job Shop X-22 Subtask Breakdown with man-hours and scheduled completion dates.
Availability Start Date Weekends/Holidays
X-21 4-N
ov
5-N
ov
6-N
ov
7-N
ov
8-N
ov
9-N
ov
10-N
ov
11-N
ov
12-N
ov
13-N
ov
14-N
ov
15-N
ov
16-N
ov
17-N
ov
18-N
ov
19-N
ov
20-N
ov
21-N
ov
22-N
ov
23-N
ov
24-N
ov
25-N
ov
26-N
ov
27-N
ov
28-N
ov
IBIS 11 0.9 38 26 0 0 26 0 58 15 6.2 0 0 6.2 6.2 6.2 6.2 6.2 0 0 25 25 25 0 25STINGRAYHAMMERHEADTOTAL MHs 11 0.9 38 26 0 0 26 0 58 15 6.2 0 0 6.2 6.2 6.2 6.2 6.2 0 0 25 25 25 0 25
X-21 29-N
ov
30-N
ov
1-D
ec
2-D
ec
3-D
ec
4-D
ec
5-D
ec
6-D
ec
7-D
ec
8-D
ec
9-D
ec
10-D
ec
11-D
ec
12-D
ec
13-D
ec
14-D
ec
15-D
ec
16-D
ec
17-D
ec
18-D
ec
19-D
ec
20-D
ec
21-D
ec
22-D
ec
23-D
ec
IBIS 0 0 30 25 6.2 6.2 6.2 0 0 6.2 6.2 6.2 45 45 0 0 45 45 17 26 17 0 0 18 17STINGRAY 11 0.9 38 26 0 0 26 0 58 15 6.2 0 0 6.2 6.2 6.2 6.2 6.2 0 0 25 25 25HAMMERHEADTOTAL MHs 0 0 41 26 44 32 6.2 0 26 6.2 64 21 51 45 0 6.2 51 51 23 32 17 0 25 43 42
X-21 24-D
ec
25-D
ec
26-D
ec
27-D
ec
28-D
ec
29-D
ec
30-D
ec
31-D
ec
1-Ja
n
2-Ja
n
3-Ja
n
4-Ja
n
5-Ja
n
6-Ja
n
7-Ja
n
8-Ja
n
9-Ja
n
10-J
an
11-J
an
12-J
an
13-J
an
14-J
an
IBIS 17 0 17 0 0 17 13 4.9 0 4.9 0 0 0.9 0.9 0.9 0.9 17 0 0 17 26 0.9STINGRAY 25 25 0 30 25 6.2 12 0 6.2 6.2 6.2 45 45 0 45 45 17HAMMERHEAD 11 0.9 38 26 0 0 26 0 58 15TOTAL MHs 42 0 42 0 0 47 38 11 0 17 0 0 18 8.1 45 72 62 0 26 62 129 32
Work Item # Description Job Shop Man-Hours Date to Completewi 10 alignment x22 18.00 12/31-1/2wi 11 skim cut x22 6.00 12/11-12/16wi 11 measure final x22 2.00 29-Decwi 11 measure x22 2.00 13-Novwi 12 skim cut x22 6.00 12/11-12/16wi 13 alignment x22 25.00 12/17-12/29wi 14 alignment x22 6.00 12/17-12/29wi 16 fit propeller x22 40.00 11/14-11/22wi 16 renew nut anode x22 4.00 29-Decwi 18 install (valve/strainers) x22 4.00 12/17-12/29wi 36 tolerances x22 8.00 5-Novwi 36 inspect shaft seal x22 92.00 11/13-12/16wi 36 install (shaft seal) x22 27.00 12/17-12/29wi 36 remove (shafts) x22 14.00 11/6-11/12
Total Hours 254.00

86
Figure A.6 Calendar Schedule Representation of Job Shop X-22 Loading over Three Parallel Availabilities.
Availability Start Date Weekends/Holidays
X-22 4-N
ov
5-N
ov
6-N
ov
7-N
ov
8-N
ov
9-N
ov
10-N
ov
11-N
ov
12-N
ov
13-N
ov
14-N
ov
15-N
ov
16-N
ov
17-N
ov
18-N
ov
19-N
ov
20-N
ov
21-N
ov
22-N
ov
23-N
ov
24-N
ov
25-N
ov
26-N
ov
27-N
ov
28-N
ov
IBIS 0 8 3.5 3.5 0 0 3.5 0 3.5 6 11 0 0 11 11 11 11 11 0 0 4 4 4 0 4STINGRAYHAMMERHEADTOTAL MHs 0 8 3.5 3.5 0 0 3.5 0 3.5 6 11 0 0 11 11 11 11 11 0 0 4 4 4 0 4
X-22 29-N
ov
30-N
ov
1-D
ec
2-D
ec
3-D
ec
4-D
ec
5-D
ec
6-D
ec
7-D
ec
8-D
ec
9-D
ec
10-D
ec
11-D
ec
12-D
ec
13-D
ec
14-D
ec
15-D
ec
16-D
ec
17-D
ec
18-D
ec
19-D
ec
20-D
ec
21-D
ec
22-D
ec
23-D
ec
IBIS 0 0 4 4 4 4 4 0 0 4 4 4 7 7 0 0 7 7 7.8 7.8 7.8 0 0 7.8 7.8STINGRAY 0 8 3.5 3.5 0 0 3.5 0 3.5 6 11 0 0 11 11 11 11 11 0 0 4 4 4HAMMERHEADTOTAL MHs 0 0 4 12 7.5 7.5 4 0 3.5 4 7.5 10 18 7 0 11 18 18 18 18 7.8 0 4 12 12
X-22 24-D
ec
25-D
ec
26-D
ec
27-D
ec
28-D
ec
29-D
ec
30-D
ec
31-D
ec
1-Ja
n
2-Ja
n
3-Ja
n
4-Ja
n
5-Ja
n
6-Ja
n
7-Ja
n
8-Ja
n
9-Ja
n
10-J
an
11-J
an
12-J
an
13-J
an
14-J
an
IBIS 7.8 0 7.8 0 0 9.8 0 9 0 9 0 0 0 0 0 0 0 0 0 0 0 0STINGRAY 4 4 0 4 4 4 8 0 4 4 4 7 7 0 7 7 7.8HAMMERHEAD 0 8 3.5 3.5 0 0 3.5 0 3.5 6TOTAL MHs 12 0 12 0 0 14 4 13 0 17 0 0 4 12 7.5 11 7 0 3.5 7 11 14
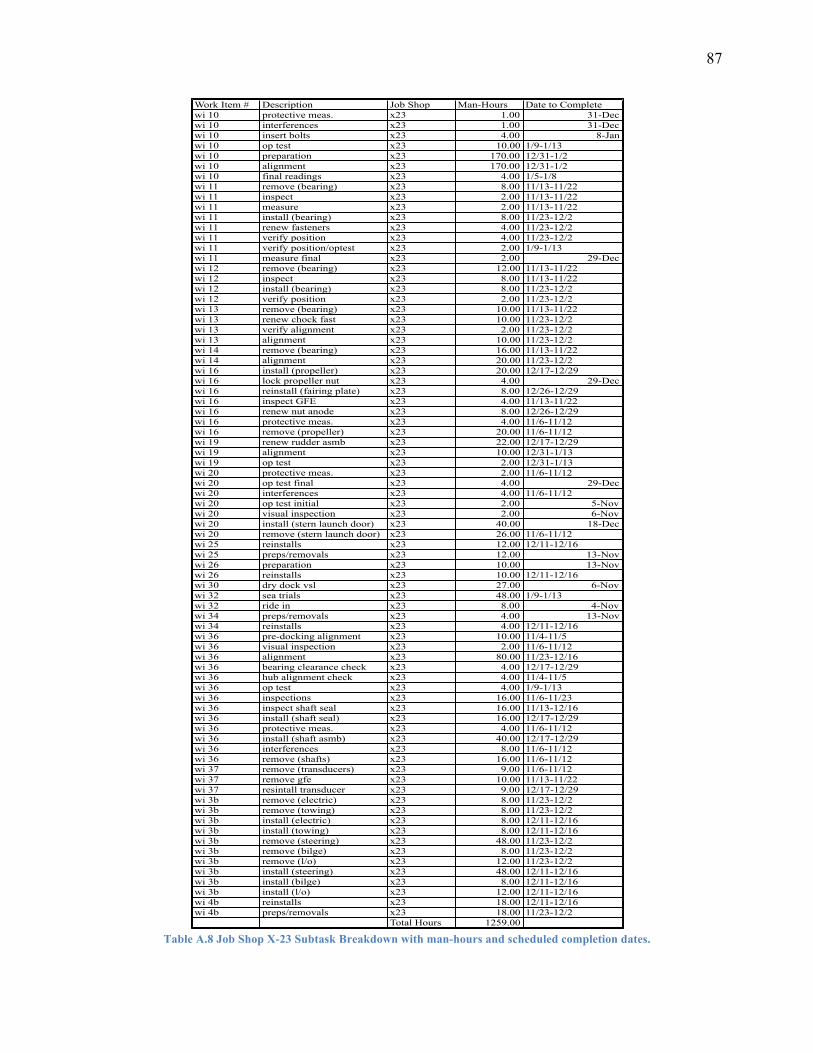
87
Table A.8 Job Shop X-23 Subtask Breakdown with man-hours and scheduled completion dates.
Work Item # Description Job Shop Man-Hours Date to Completewi 10 protective meas. x23 1.00 31-Decwi 10 interferences x23 1.00 31-Decwi 10 insert bolts x23 4.00 8-Janwi 10 op test x23 10.00 1/9-1/13wi 10 preparation x23 170.00 12/31-1/2wi 10 alignment x23 170.00 12/31-1/2wi 10 final readings x23 4.00 1/5-1/8wi 11 remove (bearing) x23 8.00 11/13-11/22wi 11 inspect x23 2.00 11/13-11/22wi 11 measure x23 2.00 11/13-11/22wi 11 install (bearing) x23 8.00 11/23-12/2wi 11 renew fasteners x23 4.00 11/23-12/2wi 11 verify position x23 4.00 11/23-12/2wi 11 verify position/optest x23 2.00 1/9-1/13wi 11 measure final x23 2.00 29-Decwi 12 remove (bearing) x23 12.00 11/13-11/22wi 12 inspect x23 8.00 11/13-11/22wi 12 install (bearing) x23 8.00 11/23-12/2wi 12 verify position x23 2.00 11/23-12/2wi 13 remove (bearing) x23 10.00 11/13-11/22wi 13 renew chock fast x23 10.00 11/23-12/2wi 13 verify alignment x23 2.00 11/23-12/2wi 13 alignment x23 10.00 11/23-12/2wi 14 remove (bearing) x23 16.00 11/13-11/22wi 14 alignment x23 20.00 11/23-12/2wi 16 install (propeller) x23 20.00 12/17-12/29wi 16 lock propeller nut x23 4.00 29-Decwi 16 reinstall (fairing plate) x23 8.00 12/26-12/29wi 16 inspect GFE x23 4.00 11/13-11/22wi 16 renew nut anode x23 8.00 12/26-12/29wi 16 protective meas. x23 4.00 11/6-11/12wi 16 remove (propeller) x23 20.00 11/6-11/12wi 19 renew rudder asmb x23 22.00 12/17-12/29wi 19 alignment x23 10.00 12/31-1/13wi 19 op test x23 2.00 12/31-1/13wi 20 protective meas. x23 2.00 11/6-11/12wi 20 op test final x23 4.00 29-Decwi 20 interferences x23 4.00 11/6-11/12wi 20 op test initial x23 2.00 5-Novwi 20 visual inspection x23 2.00 6-Novwi 20 install (stern launch door) x23 40.00 18-Decwi 20 remove (stern launch door) x23 26.00 11/6-11/12wi 25 reinstalls x23 12.00 12/11-12/16wi 25 preps/removals x23 12.00 13-Novwi 26 preparation x23 10.00 13-Novwi 26 reinstalls x23 10.00 12/11-12/16wi 30 dry dock vsl x23 27.00 6-Novwi 32 sea trials x23 48.00 1/9-1/13wi 32 ride in x23 8.00 4-Novwi 34 preps/removals x23 4.00 13-Novwi 34 reinstalls x23 4.00 12/11-12/16wi 36 pre-docking alignment x23 10.00 11/4-11/5wi 36 visual inspection x23 2.00 11/6-11/12wi 36 alignment x23 80.00 11/23-12/16wi 36 bearing clearance check x23 4.00 12/17-12/29wi 36 hub alignment check x23 4.00 11/4-11/5wi 36 op test x23 4.00 1/9-1/13wi 36 inspections x23 16.00 11/6-11/23wi 36 inspect shaft seal x23 16.00 11/13-12/16wi 36 install (shaft seal) x23 16.00 12/17-12/29wi 36 protective meas. x23 4.00 11/6-11/12wi 36 install (shaft asmb) x23 40.00 12/17-12/29wi 36 interferences x23 8.00 11/6-11/12wi 36 remove (shafts) x23 16.00 11/6-11/12wi 37 remove (transducers) x23 9.00 11/6-11/12wi 37 remove gfe x23 10.00 11/13-11/22wi 37 resintall transducer x23 9.00 12/17-12/29wi 3b remove (electric) x23 8.00 11/23-12/2wi 3b remove (towing) x23 8.00 11/23-12/2wi 3b install (electric) x23 8.00 12/11-12/16wi 3b install (towing) x23 8.00 12/11-12/16wi 3b remove (steering) x23 48.00 11/23-12/2wi 3b remove (bilge) x23 8.00 11/23-12/2wi 3b remove (l/o) x23 12.00 11/23-12/2wi 3b install (steering) x23 48.00 12/11-12/16wi 3b install (bilge) x23 8.00 12/11-12/16wi 3b install (l/o) x23 12.00 12/11-12/16wi 4b reinstalls x23 18.00 12/11-12/16wi 4b preps/removals x23 18.00 11/23-12/2
Total Hours 1259.00
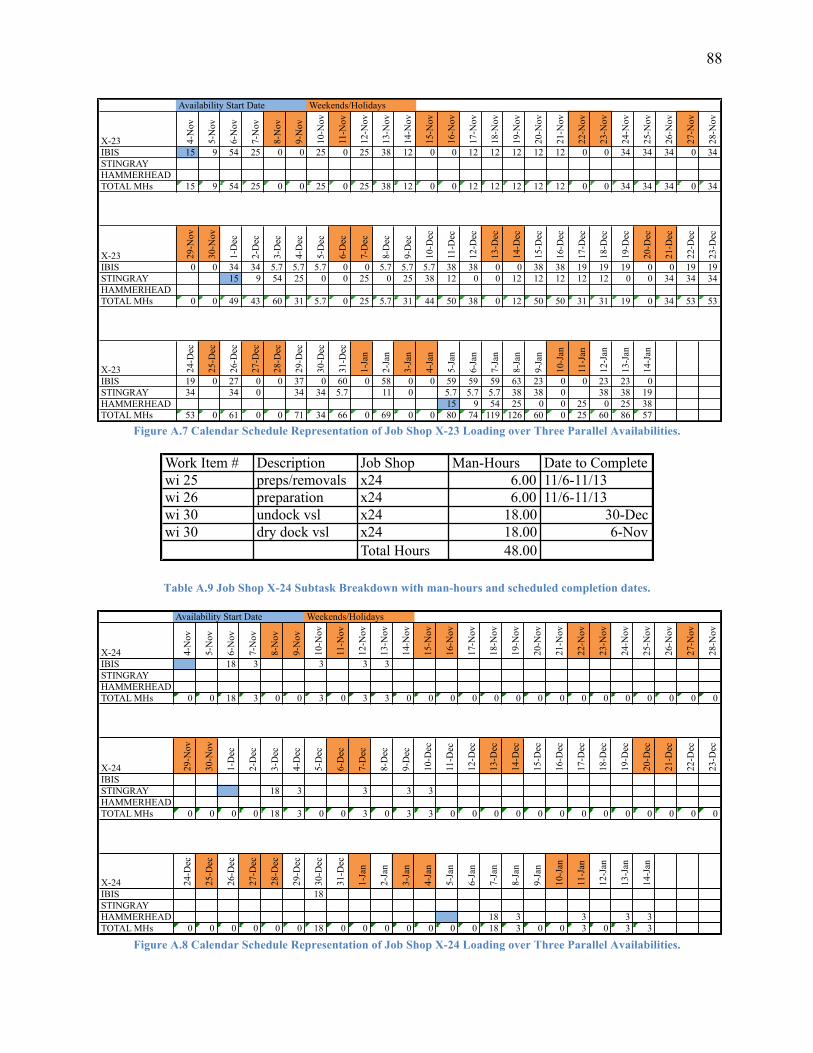
88
Figure A.7 Calendar Schedule Representation of Job Shop X-23 Loading over Three Parallel Availabilities.
Table A.9 Job Shop X-24 Subtask Breakdown with man-hours and scheduled completion dates.
Figure A.8 Calendar Schedule Representation of Job Shop X-24 Loading over Three Parallel Availabilities.
Availability Start Date Weekends/Holidays
X-23 4-N
ov
5-N
ov
6-N
ov
7-N
ov
8-N
ov
9-N
ov
10-N
ov
11-N
ov
12-N
ov
13-N
ov
14-N
ov
15-N
ov
16-N
ov
17-N
ov
18-N
ov
19-N
ov
20-N
ov
21-N
ov
22-N
ov
23-N
ov
24-N
ov
25-N
ov
26-N
ov
27-N
ov
28-N
ov
IBIS 15 9 54 25 0 0 25 0 25 38 12 0 0 12 12 12 12 12 0 0 34 34 34 0 34STINGRAYHAMMERHEADTOTAL MHs 15 9 54 25 0 0 25 0 25 38 12 0 0 12 12 12 12 12 0 0 34 34 34 0 34
X-23 29-N
ov
30-N
ov
1-D
ec
2-D
ec
3-D
ec
4-D
ec
5-D
ec
6-D
ec
7-D
ec
8-D
ec
9-D
ec
10-D
ec
11-D
ec
12-D
ec
13-D
ec
14-D
ec
15-D
ec
16-D
ec
17-D
ec
18-D
ec
19-D
ec
20-D
ec
21-D
ec
22-D
ec
23-D
ec
IBIS 0 0 34 34 5.7 5.7 5.7 0 0 5.7 5.7 5.7 38 38 0 0 38 38 19 19 19 0 0 19 19STINGRAY 15 9 54 25 0 0 25 0 25 38 12 0 0 12 12 12 12 12 0 0 34 34 34HAMMERHEADTOTAL MHs 0 0 49 43 60 31 5.7 0 25 5.7 31 44 50 38 0 12 50 50 31 31 19 0 34 53 53
X-23 24-D
ec
25-D
ec
26-D
ec
27-D
ec
28-D
ec
29-D
ec
30-D
ec
31-D
ec
1-Ja
n
2-Ja
n
3-Ja
n
4-Ja
n
5-Ja
n
6-Ja
n
7-Ja
n
8-Ja
n
9-Ja
n
10-J
an
11-J
an
12-J
an
13-J
an
14-J
an
IBIS 19 0 27 0 0 37 0 60 0 58 0 0 59 59 59 63 23 0 0 23 23 0STINGRAY 34 34 0 34 34 5.7 11 0 5.7 5.7 5.7 38 38 0 38 38 19HAMMERHEAD 15 9 54 25 0 0 25 0 25 38TOTAL MHs 53 0 61 0 0 71 34 66 0 69 0 0 80 74 119 126 60 0 25 60 86 57
Work Item # Description Job Shop Man-Hours Date to Completewi 25 preps/removals x24 6.00 11/6-11/13wi 26 preparation x24 6.00 11/6-11/13wi 30 undock vsl x24 18.00 30-Decwi 30 dry dock vsl x24 18.00 6-Nov
Total Hours 48.00
Availability Start Date Weekends/Holidays
X-24 4-N
ov
5-N
ov
6-N
ov
7-N
ov
8-N
ov
9-N
ov
10-N
ov
11-N
ov
12-N
ov
13-N
ov
14-N
ov
15-N
ov
16-N
ov
17-N
ov
18-N
ov
19-N
ov
20-N
ov
21-N
ov
22-N
ov
23-N
ov
24-N
ov
25-N
ov
26-N
ov
27-N
ov
28-N
ov
IBIS 18 3 3 3 3STINGRAYHAMMERHEADTOTAL MHs 0 0 18 3 0 0 3 0 3 3 0 0 0 0 0 0 0 0 0 0 0 0 0 0 0
X-24 29-N
ov
30-N
ov
1-D
ec
2-D
ec
3-D
ec
4-D
ec
5-D
ec
6-D
ec
7-D
ec
8-D
ec
9-D
ec
10-D
ec
11-D
ec
12-D
ec
13-D
ec
14-D
ec
15-D
ec
16-D
ec
17-D
ec
18-D
ec
19-D
ec
20-D
ec
21-D
ec
22-D
ec
23-D
ec
IBISSTINGRAY 18 3 3 3 3HAMMERHEADTOTAL MHs 0 0 0 0 18 3 0 0 3 0 3 3 0 0 0 0 0 0 0 0 0 0 0 0 0
X-24 24-D
ec
25-D
ec
26-D
ec
27-D
ec
28-D
ec
29-D
ec
30-D
ec
31-D
ec
1-Ja
n
2-Ja
n
3-Ja
n
4-Ja
n
5-Ja
n
6-Ja
n
7-Ja
n
8-Ja
n
9-Ja
n
10-J
an
11-J
an
12-J
an
13-J
an
14-J
an
IBIS 18STINGRAYHAMMERHEAD 18 3 3 3 3TOTAL MHs 0 0 0 0 0 0 18 0 0 0 0 0 0 0 18 3 0 0 3 0 3 3

89
Table A.10 Job Shop X-31 Subtask Breakdown with man-hours and scheduled completion dates.
Work Item # Description Job Shop Man-Hours Date to Completesupport service per day x31support services x31 80.00 1.7wi 17 remove (exhaust lagging) x31 8.00 12/1-12/16wi 17 install/test x31 8.00 12/17-12/29wi 19 renew rudder asmb x31 2.00 12/17-12/29wi 19 alignment x31 2.00 12/31-1/13wi 19 op test x31 2.00 12/31-1/13wi 20 op test x31 2.00 5-Novwi 20 visual inspection x31 1.00 6-Novwi 20 remove (stern launch door) x31 3.00 11/6-11/12wi 20 install (stern launch door) x31 6.00 18-Decwi 21 close tanks x31 6.00 12/11-12/16wi 21 open tanks x31 2.00 5-Novwi 21 inspect tanks x31 6.00 12-Novwi 21 final inspect x31 3.00 12/11-12/16wi 22 open tanks x31 2.00 5-Novwi 22 close tanks x31 6.00 12/11-12/16wi 22 inspect tanks x31 6.00 12-Novwi 22 final inspect x31 3.00 12/11-12/16wi 23 install (spool) x31 3.00 12/11-12/16wi 23 install (tank valves) x31 3.00 12/11-12/16wi 24 install (spool) x31 3.00 12/11-12/16wi 24 install (tank valves) x31 3.00 12/11-12/16wi 26 reinstalls x31 6.00 12/11-12/16wi 27 preps/removals x31 80.00 11/6-11/12wi 27 reinstalls x31 100.00 12/11-12/16wi 28 preps/removals x31 16.00 11/6-11/13wi 28 reinstalls x31 16.00 12/11-12/16wi 29 renew zinc anodes x31 6.00 12/11-12/16wi 30 undock vsl x31 18.00 30-Decwi 30 dry dock vsl x31 27.00 6-Novwi 31 connect temp services x31 9.00 6-Novwi 31 final removals x31 9.00 13-Janwi 32 sea trials x31 48.00 1/9-1/13wi 32 ride in x31 8.00 4-Novwi 33 crop/renew x31 6.00 11/23-12/2wi 34 preps/removals x31 4.00 13-Novwi 34 reinstalls x31 4.00 12/11-12/16wi 36 op test x31 4.00 1/9-1/13wi 36 protective meas. x31 2.00 11/6-11/12wi 36 interferences x31 2.00 11/6-11/12wi 3b remove (electric) x31 8.00 11/23-12/2wi 3b install (electric) x31 8.00 12/11-12/16wi 3b remove (steering) x31 3.00 11/23-12/2wi 3b remove (bilge) x31 8.00 11/23-12/2wi 3b install (steering) x31 3.00 12/11-12/16wi 3b install (bilge) x31 8.00 12/11-12/16wi 4b reinstalls x31 16.00 12/11-12/16wi 4b preps/removals x31 16.00 11/23-12/2wi 5 open tanks x31 2.00 5-Novwi 5 close tanks x31 2.00 12/11-12/16wi 5 inspect tanks x31 3.00 12-Novwi 5 final inspect x31 3.00 12/11-12/16wi 6 close tanks x31 2.00 12/11-12/16wi 6 final inspect x31 3.00 12/11-12/16wi 6 open tanks x31 2.00 5-Novwi 6 inspect tanks x31 3.00 12-Novwi 7 open tanks x31 4.00 5-Novwi 7 close tanks x31 2.00 12/11-12/16wi 7 inspect tanks x31 6.00 12-Novwi 7 final inspect x31 6.00 12/11-12/16wi 8 open tanks x31 2.00 5-Novwi 8 inspect tanks x31 4.00 12-Novwi 8 final inspect x31 2.00 12/11-12/16wi 8 close tanks x31 2.00 12/11-12/16
Total Hours 643.00

90
Figure A.9 Calendar Schedule Representation of Job Shop X-31 Loading over Three Parallel Availabilities.
Table A.11 Job Shop X-32 Subtask Breakdown with man-hours and scheduled completion dates.
X-31 4-N
ov
5-N
ov
6-N
ov
7-N
ov
8-N
ov
9-N
ov
10-N
ov
11-N
ov
12-N
ov
13-N
ov
14-N
ov
15-N
ov
16-N
ov
17-N
ov
18-N
ov
19-N
ov
20-N
ov
21-N
ov
22-N
ov
23-N
ov
24-N
ov
25-N
ov
26-N
ov
27-N
ov
28-N
ov
IBIS 9.7 18 64 27 0 0 27 0 55 8.9 1.7 0 0 1.7 1.7 1.7 1.7 1.7 0 0 8.5 8.5 8.5 0 8.5STINGRAYHAMMERHEADTOTAL MHs 9.7 18 64 27 0 0 27 0 55 8.9 1.7 0 0 1.7 1.7 1.7 1.7 1.7 0 0 8.5 8.5 8.5 0 8.5
X-31 29-N
ov
30-N
ov
1-D
ec
2-D
ec
3-D
ec
4-D
ec
5-D
ec
6-D
ec
7-D
ec
8-D
ec
9-D
ec
10-D
ec
11-D
ec
12-D
ec
13-D
ec
14-D
ec
15-D
ec
16-D
ec
17-D
ec
18-D
ec
19-D
ec
20-D
ec
21-D
ec
22-D
ec
23-D
ec
IBIS 0 0 9.2 9.2 2.4 2.4 2.4 0 0 2.4 2.4 2.4 57 57 0 0 57 57 3.7 3.7 3.7 0 0 3.7 3.7STINGRAY 9.7 18 64 27 0 0 27 0 55 8.9 1.7 0 0 1.7 1.7 1.7 1.7 1.7 0 0 8.5 8.5 8.5HAMMERHEADTOTAL MHs 0 0 19 27 66 29 2.4 0 27 2.4 57 11 59 57 0 1.7 59 59 5.4 5.4 3.7 0 8.5 12 12
X-31 24-D
ec
25-D
ec
26-D
ec
27-D
ec
28-D
ec
29-D
ec
30-D
ec
31-D
ec
1-Ja
n
2-Ja
n
3-Ja
n
4-Ja
n
5-Ja
n
6-Ja
n
7-Ja
n
8-Ja
n
9-Ja
n
10-J
an
11-J
an
12-J
an
13-J
an
14-J
an
IBIS 3.7 0 3.7 0 0 3.7 20 2.1 0 2.1 0 0 2.1 2.1 2.1 2.1 28 0 0 19 19 1.7STINGRAY 8.5 8.5 0 9.2 9.2 2.4 4.8 0 2.4 2.4 2.4 57 57 0 57 57 3.7HAMMERHEAD 9.7 18 64 27 0 0 27 0 55 8.9TOTAL MHs 12 0 12 0 0 13 29 4.5 0 6.9 0 0 14 22 68 86 86 0 27 77 131 14
Work Item # Description Job Shop Man-Hours Date to Completewi 19 renew rudder asmb x32 2.00 12/17-12/29wi 19 alignment x32 2.00 12/31-1/13wi 19 op test x32 2.00 12/31-1/13wi 27 preps/removals x32 36.00 11/6-11/12wi 27 reinstalls x32 45.00 12/17-12/29wi 28 preps/removals x32 22.00 11/6-11/13wi 28 reinstalls x32 22.00 12/11-12/29wi 31 ekms services x32 45.00wi 32 sea trials x32 24.00 1/9-1/13wi 32 ride in x32 8.00 4-Novwi 37 inspect speed log asmb x32 2.00 11/6-11/12wi 37 op test x32 2.00 12/31-1/2wi 37 remove (transducers) x32 9.00 11/6-11/12
wi 37 resintall transducer x32 9.00 12/17-12/29Total Hours 230.00

91
Figure A.10 Calendar Schedule Representation of Job Shop X-32 Loading over Three Parallel Availabilities.
Table A.12 Job Shop X-33 Subtask Breakdown with man-hours and scheduled completion dates.
Figure A.11 Calendar Schedule Representation of Job Shop X-33 Loading over Three Parallel Availabilities.
Availability Start Date Weekends/Holidays
X-32 4-N
ov
5-N
ov
6-N
ov
7-N
ov
8-N
ov
9-N
ov
10-N
ov
11-N
ov
12-N
ov
13-N
ov
14-N
ov
15-N
ov
16-N
ov
17-N
ov
18-N
ov
19-N
ov
20-N
ov
21-N
ov
22-N
ov
23-N
ov
24-N
ov
25-N
ov
26-N
ov
27-N
ov
28-N
ov
IBIS 8.9 0.9 17 17 0 0 17 0 17 5.3 0.9 0 0 0.9 0.9 0.9 0.9 0.9 0 0 0.9 0.9 0.9 0 0.9STINGRAYHAMMERHEADTOTAL MHs 8.9 0.9 17 17 0 0 17 0 17 5.3 0.9 0 0 0.9 0.9 0.9 0.9 0.9 0 0 0.9 0.9 0.9 0 0.9
X-32 29-N
ov
30-N
ov
1-D
ec
2-D
ec
3-D
ec
4-D
ec
5-D
ec
6-D
ec
7-D
ec
8-D
ec
9-D
ec
10-D
ec
11-D
ec
12-D
ec
13-D
ec
14-D
ec
15-D
ec
16-D
ec
17-D
ec
18-D
ec
19-D
ec
20-D
ec
21-D
ec
22-D
ec
23-D
ec
IBIS 0 0 0.9 0.9 0.9 0.9 0.9 0 0 0.9 0.9 0.9 2.7 2.7 0 0 2.7 2.7 9.7 9.7 9.7 0 0 9.7 9.7STINGRAY 8.9 0.9 17 17 0 0 17 0 17 5.3 0.9 0 0 0.9 0.9 0.9 0.9 0.9 0 0 0.9 0.9 0.9HAMMERHEADTOTAL MHs 0 0 9.8 1.8 18 18 0.9 0 17 0.9 18 6.2 3.6 2.7 0 0.9 3.6 3.6 11 11 9.7 0 0.9 11 11
X-32 24-D
ec
25-D
ec
26-D
ec
27-D
ec
28-D
ec
29-D
ec
30-D
ec
31-D
ec
1-Ja
n
2-Ja
n
3-Ja
n
4-Ja
n
5-Ja
n
6-Ja
n
7-Ja
n
8-Ja
n
9-Ja
n
10-J
an
11-J
an
12-J
an
13-J
an
14-J
an
IBIS 9.7 0 9.7 0 0 9.7 0.9 2.9 0 2.9 0 0 2.9 0.9 0.9 0.9 8.9 0 0 8.9 8.9 0.9STINGRAY 0.9 0 0.9 0 0 0.9 0.9 0.9 0.9 0.9 0 0 0.9 0.9 0.9 2.7 2.7 0 0 2.7 2.7 9.7HAMMERHEAD 8.9 0.9 17 17 0 0 17 0 17 5.3TOTAL MHs 11 0 11 0 0 11 1.8 3.8 0.9 3.8 0 0 13 2.7 19 21 12 0 17 12 29 16
Work Item # Description Job Shop Man-Hours Date to Completewi 31 connect temp services x33 8.00 6-Novwi 31 final removals x33 8.00 13-Jan
Total Hours 16.00
Availability Start Date Weekends/Holidays
X-33 4-N
ov
5-N
ov
6-N
ov
7-N
ov
8-N
ov
9-N
ov
10-N
ov
11-N
ov
12-N
ov
13-N
ov
14-N
ov
15-N
ov
16-N
ov
17-N
ov
18-N
ov
19-N
ov
20-N
ov
21-N
ov
22-N
ov
23-N
ov
24-N
ov
25-N
ov
26-N
ov
27-N
ov
28-N
ov
IBIS 8STINGRAYHAMMERHEADTOTAL MHs 0 0 8 0 0 0 0 0 0 0 0 0 0 0 0 0 0 0 0 0 0 0 0 0 0
X-33 29-N
ov
30-N
ov
1-D
ec
2-D
ec
3-D
ec
4-D
ec
5-D
ec
6-D
ec
7-D
ec
8-D
ec
9-D
ec
10-D
ec
11-D
ec
12-D
ec
13-D
ec
14-D
ec
15-D
ec
16-D
ec
17-D
ec
18-D
ec
19-D
ec
20-D
ec
21-D
ec
22-D
ec
23-D
ec
IBISSTINGRAY 8HAMMERHEADTOTAL MHs 0 0 0 0 8 0 0 0 0 0 0 0 0 0 0 0 0 0 0 0 0 0 0 0 0
X-33 24-D
ec
25-D
ec
26-D
ec
27-D
ec
28-D
ec
29-D
ec
30-D
ec
31-D
ec
1-Ja
n
2-Ja
n
3-Ja
n
4-Ja
n
5-Ja
n
6-Ja
n
7-Ja
n
8-Ja
n
9-Ja
n
10-J
an
11-J
an
12-J
an
13-J
an
14-J
an
IBIS 8STINGRAYHAMMERHEAD 8TOTAL MHs 0 0 0 0 0 0 0 0 0 0 0 0 0 0 8 0 0 0 0 0 8 0
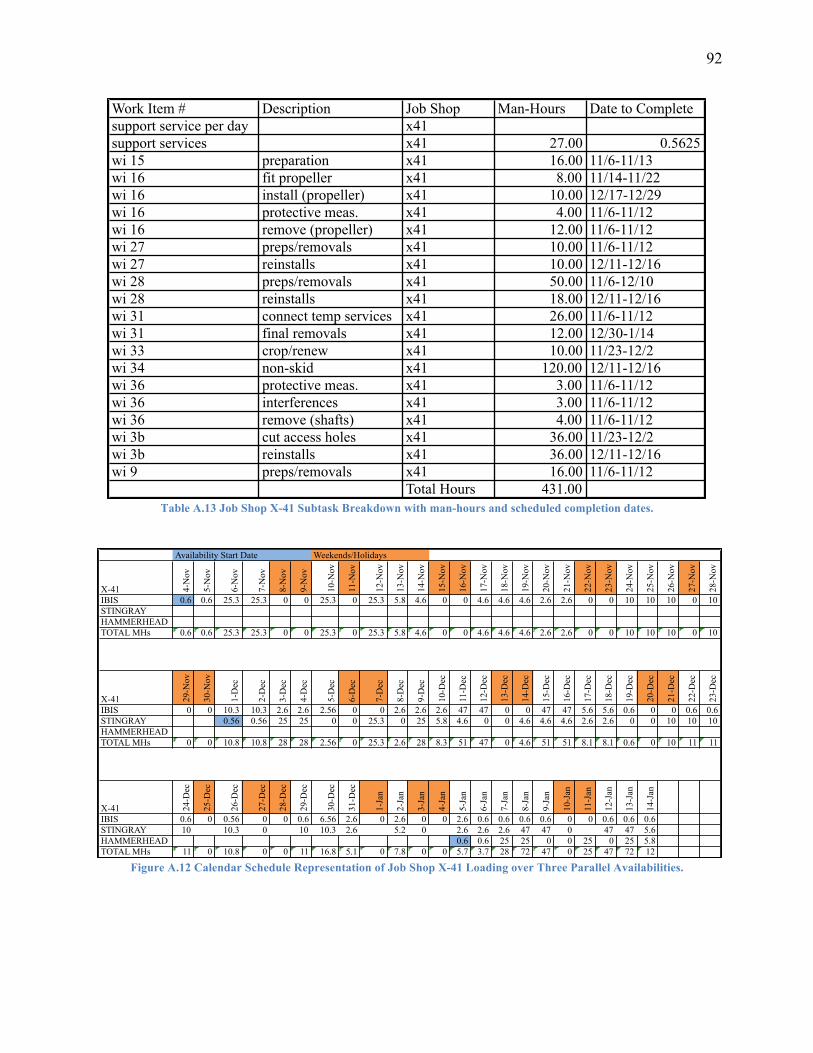
92
Table A.13 Job Shop X-41 Subtask Breakdown with man-hours and scheduled completion dates.
Figure A.12 Calendar Schedule Representation of Job Shop X-41 Loading over Three Parallel Availabilities.
Work Item # Description Job Shop Man-Hours Date to Completesupport service per day x41support services x41 27.00 0.5625wi 15 preparation x41 16.00 11/6-11/13wi 16 fit propeller x41 8.00 11/14-11/22wi 16 install (propeller) x41 10.00 12/17-12/29wi 16 protective meas. x41 4.00 11/6-11/12wi 16 remove (propeller) x41 12.00 11/6-11/12wi 27 preps/removals x41 10.00 11/6-11/12wi 27 reinstalls x41 10.00 12/11-12/16wi 28 preps/removals x41 50.00 11/6-12/10wi 28 reinstalls x41 18.00 12/11-12/16wi 31 connect temp services x41 26.00 11/6-11/12wi 31 final removals x41 12.00 12/30-1/14wi 33 crop/renew x41 10.00 11/23-12/2wi 34 non-skid x41 120.00 12/11-12/16wi 36 protective meas. x41 3.00 11/6-11/12wi 36 interferences x41 3.00 11/6-11/12wi 36 remove (shafts) x41 4.00 11/6-11/12wi 3b cut access holes x41 36.00 11/23-12/2wi 3b reinstalls x41 36.00 12/11-12/16wi 9 preps/removals x41 16.00 11/6-11/12
Total Hours 431.00
Availability Start Date Weekends/Holidays
X-41 4-N
ov
5-N
ov
6-N
ov
7-N
ov
8-N
ov
9-N
ov
10-N
ov
11-N
ov
12-N
ov
13-N
ov
14-N
ov
15-N
ov
16-N
ov
17-N
ov
18-N
ov
19-N
ov
20-N
ov
21-N
ov
22-N
ov
23-N
ov
24-N
ov
25-N
ov
26-N
ov
27-N
ov
28-N
ov
IBIS 0.6 0.6 25.3 25.3 0 0 25.3 0 25.3 5.8 4.6 0 0 4.6 4.6 4.6 2.6 2.6 0 0 10 10 10 0 10STINGRAYHAMMERHEADTOTAL MHs 0.6 0.6 25.3 25.3 0 0 25.3 0 25.3 5.8 4.6 0 0 4.6 4.6 4.6 2.6 2.6 0 0 10 10 10 0 10
X-41 29-N
ov
30-N
ov
1-D
ec
2-D
ec
3-D
ec
4-D
ec
5-D
ec
6-D
ec
7-D
ec
8-D
ec
9-D
ec
10-D
ec
11-D
ec
12-D
ec
13-D
ec
14-D
ec
15-D
ec
16-D
ec
17-D
ec
18-D
ec
19-D
ec
20-D
ec
21-D
ec
22-D
ec
23-D
ecIBIS 0 0 10.3 10.3 2.6 2.6 2.56 0 0 2.6 2.6 2.6 47 47 0 0 47 47 5.6 5.6 0.6 0 0 0.6 0.6STINGRAY 0.56 0.56 25 25 0 0 25.3 0 25 5.8 4.6 0 0 4.6 4.6 4.6 2.6 2.6 0 0 10 10 10HAMMERHEADTOTAL MHs 0 0 10.8 10.8 28 28 2.56 0 25.3 2.6 28 8.3 51 47 0 4.6 51 51 8.1 8.1 0.6 0 10 11 11
X-41 24-D
ec
25-D
ec
26-D
ec
27-D
ec
28-D
ec
29-D
ec
30-D
ec
31-D
ec
1-Ja
n
2-Ja
n
3-Ja
n
4-Ja
n
5-Ja
n
6-Ja
n
7-Ja
n
8-Ja
n
9-Ja
n
10-J
an
11-J
an
12-J
an
13-J
an
14-J
an
IBIS 0.6 0 0.56 0 0 0.6 6.56 2.6 0 2.6 0 0 2.6 0.6 0.6 0.6 0.6 0 0 0.6 0.6 0.6STINGRAY 10 10.3 0 10 10.3 2.6 5.2 0 2.6 2.6 2.6 47 47 0 47 47 5.6HAMMERHEAD 0.6 0.6 25 25 0 0 25 0 25 5.8TOTAL MHs 11 0 10.8 0 0 11 16.8 5.1 0 7.8 0 0 5.7 3.7 28 72 47 0 25 47 72 12

93
Table A.14 Job Shop X-42 Subtask Breakdown with man-hours and scheduled completion dates.
Work Item # Description Job Shop Man-Hours Date to Completewi 1 prime coat x42 24.00 11/14-11/22wi 10 op test x42 4.00 5-Janwi 15 grit blast x42 16.00 11/14-11/22wi 15 coatings x42 12.00 11/14-11/22wi 15 preparation x42 16.00 11/6-11/12wi 18 clean/inspect x42 24.00 11/13-12/1wi 20 prep/coat x42 16.00 12/22-12/24wi 21 final inspect x42 2.00 12/11-12/16wi 22 final inspect x42 2.00 12/11-12/16wi 25 blast x42 280.00 11/14-11/22wi 25 coatings x42 118.00 12/1-12/10wi 25 reinstalls x42 42.00 12/11-12/16wi 25 preps/removals x42 108.00 13-Novwi 26 coatings x42 142.00 12/1-12/10wi 26 decals x42 16.00 12/11-12/16wi 26 preparation x42 250.00 13-Novwi 26 reinstalls x42 6.00 12/11-12/16wi 27 coatings x42 90.00 12/1-12/10wi 27 reinstalls x42 8.00 12/11-12/16wi 28 coatings x42 160.00 12/1-12/10wi 28 preps/removals x42 196.00 11/6-11/13wi 28 reinstalls x42 16.00 12/11-12/16wi 29 renew zinc anodes x42 8.00 12/11-12/16wi 30 undock vsl x42 21.00 30-Decwi 30 dry dock vsl x42 42.00 6-Novwi 33 crop/renew x42 18.00 11/23-12/2wi 34 jet blast x42 240.00 11/14-11/22wi 34 coatings x42 154.00 12/1-12/10wi 34 non-skid x42 14.00 12/11-12/16wi 34 preps/removals x42 16.00 11/6-11/13wi 34 reinstalls x42 16.00 12/11-12/16wi 35 install/test/preserve x42 12.00 12/17-12/29wi 36 inspections x42 2.00 11/6-11/12wi 3b blast x42 60.00 11/14-11/22wi 3b powertool x42 20.00 11/23-12/2wi 3b coatings x42 48.00 12/1-12/10wi 3b cut access holes x42 24.00 11/23-12/2wi 3b reinstalls x42 24.00 12/11-12/16wi 4b powertool x42 78.00 11/23-12/2
wi 4b coatings x42 60.00 12/1-12/10wi 4b preps/removals x42 16.00 11/23-12/2wi 5 final inspect x42 2.00 12/11-12/16wi 6 final inspect x42 2.00 12/11-12/16wi 6 inspect tanks x42 3.00 12-Novwi 7 final inspect x42 4.00 12/11-12/16
wi 8 final inspect x42 2.00 12/11-12/16wi 9 grit blast x42 16.00 11/14-11/22wi 9 coatings x42 12.00 12/1-12/10wi 9 preps/removals x42 16.00 11/6-11/12
Total Hours 2478.00

94
Figure A.13 Calendar Schedule Representation of Job Shop X-42 Loading over Three Parallel Availabilities.
Weekends/Holidays
4-N
ov
5-N
ov
6-N
ov
7-N
ov
8-N
ov
9-N
ov
10-N
ov
11-N
ov
12-N
ov
13-N
ov
14-N
ov
15-N
ov
16-N
ov
17-N
ov
18-N
ov
19-N
ov
20-N
ov
21-N
ov
22-N
ov
23-N
ov
24-N
ov
25-N
ov
26-N
ov
27-N
ov
28-N
ov
x42 total hours/55 days 0 0 45 45 45 45 45 45 45 45 45 45 45 45 45 45 45 45 45 45 45 45 45 45 452nd availtotal sum 0 0 45 45 45 45 45 45 45 45 45 45 45 45 45 45 45 45 45 45 45 45 45 45 453rd availtotal sum 0 0 45 45 45 45 45 45 45 45 45 45 45 45 45 45 45 45 45 45 45 45 45 45 45Divided by 6 ppd (total hours each person must work) 0 0 7.5 7.5 7.5 7.5 7.5 7.5 7.5 7.5 7.5 7.5 7.5 7.5 7.5 7.5 7.5 7.5 7.5 7.5 7.5 7.5 7.5 7.5 7.5
29-N
ov
30-N
ov
1-D
ec
2-D
ec
3-D
ec
4-D
ec
5-D
ec
6-D
ec
7-D
ec
8-D
ec
9-D
ec
10-D
ec
11-D
ec
12-D
ec
13-D
ec
14-D
ec
15-D
ec
16-D
ec
17-D
ec
18-D
ec
19-D
ec
20-D
ec
21-D
ec
x42 total hours/55 days 45 45 45 45 45 45 45 45 45 45 45 45 45 45 45 45 45 45 45 45 45 45 452nd avail 0 0 45 45 45 45 45 45 45 45 45 45 45 45 45 45 45 45 45 45 45total sum 45 45 45 45 90 90 90 90 90 90 90 90 90 90 90 90 90 90 90 90 90 90 903rd availtotal sum 45 45 45 45 90 90 90 90 90 90 90 90 90 90 90 90 90 90 90 90 90 90 90Divided by 6 ppd (total hours each person must work) 7.5 7.5 7.5 7.5 15 15 15 15 15 15 15 15 15 15 15 15 15 15 15 15 15 15 15
22-D
ec
23-D
ec
24-D
ec
25-D
ec
26-D
ec
27-D
ec
28-D
ec
29-D
ec
30-D
ec
31-D
ec
1-Ja
n
2-Ja
n
3-Ja
n
4-Ja
n
5-Ja
n
6-Ja
n
7-Ja
n
8-Ja
n
9-Ja
n
10-J
an
11-J
an
12-J
an
13-J
an
14-J
an
x42 total hours/55 days 45 45 45 45 45 45 45 45 452nd avail 45 45 45 45 45 45 45 45 45 45 45 45 45 45 45 45 45 45 45 45 45 45 45 45total sum 90 90 90 90 90 90 90 90 90 45 45 45 45 45 45 45 45 45 45 45 45 45 45 453rd avail 0 0 45 45 45 45 45 45 45 45 45total sum 90 90 90 90 90 90 90 90 90 45 45 45 45 45 45 90 90 90 90 90 90 90 90 90Divided by 6 ppd (total hours each person must work) 15 15 15 15 15 15 15 15 15 7.5 7.5 7.5 7.5 7.5 7.5 15 15 15 15 15 15 15 15 15

95
Table A.15 Job Shop X-43 Subtask Breakdown with man-hours and scheduled completion dates.
Work Item # Description Job Shop Man-Hours Date to Completewi 9 preps/removals x43 4.00 11/6-11/12support service per day x43support services x43 81.00 1.7wi 15 preparation x43 8.00 11/6-11/12wi 16 install (propeller) x43 20.00 12/17-12/29wi 16 remove (propeller) x43 20.00 11/6-11/12wi 18 remove (valve/strainer) x43 16.00 11/6-11/12wi 18 install (valve/strainers) x43 16.00 12/17-12/29wi 19 renew rudder asmb x43 14.00 12/17-12/29wi 20 interferences x43 8.00 11/6-11/12wi 20 op test final x43 2.00 29-Decwi 20 remove (stern launch door) x43 20.00 11/6-11/12wi 20 install (bracing) x43 3.00 11/6-11/12wi 20 install (stern launch door) x43 30.00 18-Decwi 20 op test initial x43 3.00 5-Novwi 21 open tanks x43 2.00 5-Novwi 22 open tanks x43 2.00 5-Novwi 25 blast x43 8.00 11/14-11/22wi 25 preps/removals x43 8.00 13-Novwi 26 preparation x43 6.00 13-Novwi 26 reinstalls x43 6.00 12/11-12/16wi 27 preps/removals x43 20.00 11/6-11/12wi 27 reinstalls x43 20.00 12/11-12/16wi 28 coatings x43 9.00 12/1-12/10wi 28 preps/removals x43 13.00 11/6-11/13wi 28 reinstalls x43 13.00 12/11-12/16wi 30 undock vsl x43 45.00 30-Decwi 30 dry dock vsl x43 45.00 6-Novwi 31 rigging services x43 96.00 2wi 31 connect temp services x43 27.00 11/6-11/12wi 31 final removals x43 18.00 12/30-1/14wi 32 sea trials x43 27.00 1/9-1/13wi 32 ride in x43 8.00 4-Novwi 34 preps/removals x43 4.00 11/6-11/13wi 34 reinstalls x43 4.00 12/11-12/16wi 36 pre-docking alignment x43 4.00 4-Novwi 36 install (shaft asmb) x43 30.00 12/17-12/29wi 36 protective meas. x43 2.00 11/6-11/12wi 36 interferences x43 2.00 11/6-11/12wi 36 remove (shafts) x43 18.00 11/6-11/12wi 3b remove (towing) x43 6.00 11/23-12/2wi 3b remove (framing) x43 10.00 11/23-12/2wi 3b install (towing) x43 6.00 12/11-12/16wi 3b install (framing) x43 10.00 12/11-12/16wi 3b remove (electric) x43 4.00 11/23-12/2wi 3b remove (l/o) x43 6.00 11/23-12/2wi 3b install (electric) x43 4.00 12/11-12/16wi 3b install (l/o) x43 6.00 12/11-12/16wi 3b remove (steering) x43 48.00 11/23-12/2wi 3b remove (bilge) x43 4.00 11/23-12/2wi 3b install (steering) x43 48.00 12/11-12/16wi 3b install (bilge) x43 4.00 12/11-12/16wi 3b cut access holes x43 12.00 11/23-12/2wi 3b reinstalls x43 8.00 12/11-12/16wi 4b reinstalls x43 8.00 12/11-12/16wi 4b preps/removals x43 8.00 11/23-12/2wi 5 open tanks x43 2.00 5-Novwi 6 open tanks x43 2.00 5-Novwi 7 open tanks x43 4.00 5-Novwi 8 open tanks x43 2.00 5-Nov
Total Hours 884.00

96
Figure A.14 Calendar Schedule Representation of Job Shop X-43 Loading over Three Parallel Availabilities.
Availability Start Date Weekends/Holidays
X-43 4-N
ov
5-N
ov
6-N
ov
7-N
ov
8-N
ov
9-N
ov
10-N
ov
11-N
ov
12-N
ov
13-N
ov
14-N
ov
15-N
ov
16-N
ov
17-N
ov
18-N
ov
19-N
ov
20-N
ov
21-N
ov
22-N
ov
23-N
ov
24-N
ov
25-N
ov
26-N
ov
27-N
ov
28-N
ov
IBIS 16 21 89 44 0 0 44 0 44 21 5 0 0 5 5 5 5 5 0 0 20 20 20 0 20STINGRAYHAMMERHEADTOTAL MHs 16 21 89 44 0 0 44 0 44 21 5 0 0 5 5 5 5 5 0 0 20 20 20 0 20
X-43 29-N
ov
30-N
ov
1-D
ec
2-D
ec
3-D
ec
4-D
ec
5-D
ec
6-D
ec
7-D
ec
8-D
ec
9-D
ec
10-D
ec
11-D
ec
12-D
ec
13-D
ec
14-D
ec
15-D
ec
16-D
ec
17-D
ec
18-D
ec
19-D
ec
20-D
ec
21-D
ec
22-D
ec
23-D
ec
IBIS 0 0 21 21 4.8 4.8 4.8 0 0 4.8 4.8 4.8 38 38 0 0 38 38 17 17 17 0 0 17 17STINGRAY 16 21 89 44 0 0 44 0 44 21 5 0 0 5 5 5 5 5 0 0 20 20 20HAMMERHEADTOTAL MHs 0 0 37 42 94 49 4.8 0 44 4.8 49 26 43 38 0 5 43 43 22 22 17 0 20 37 37
X-43 24-D
ec
25-D
ec
26-D
ec
27-D
ec
28-D
ec
29-D
ec
30-D
ec
31-D
ec
1-Ja
n
2-Ja
n
3-Ja
n
4-Ja
n
5-Ja
n
6-Ja
n
7-Ja
n
8-Ja
n
9-Ja
n
10-J
an
11-J
an
12-J
an
13-J
an
14-J
an
IBIS 17 0 17 0 0 19 50 5.3 0 5.3 0 0 5.3 5.3 5.3 5.3 14 0 0 14 14 5.3STINGRAY 20 20 0 21 21 4.8 4.8 4.8 0 4.8 4.8 4.8 38 38 0 38 38 17HAMMERHEAD 16 21 89 44 0 0 44 0 44 21TOTAL MHs 37 0 37 0 0 41 71 10 4.8 10 0 0 26 31 99 87 52 0 44 52 96 44

97
Table A.16 Job Shops X-61-66 Subtask Breakdown with man-hours and scheduled completion dates.
Figure A.15 Calendar Schedule Representation of Job Shop X-61 Loading over Three Parallel Availabilities.
Work Item # Description Job Shop Man-Hours Date to Completewi 1 contractor x61 2.00 23-Novwi 21 contractor x61 2.00 11/5-11/12wi 22 contractor x61 2.00 11/5-11/12wi 25 preps/removals x61 4.00 11/13-11/22wi 26 preparation x61 6.00 11/13-11/22wi 28 preps/removals x61 6.00 11/13-11/22wi 34 jet blast x61 4.00 14-Novwi 3a contractor x61 2.00 11/5-11/12wi 4a contractor x61 2.00 11/5-11/12wi 4b preps/removals x61 2.00 11/5-11/12wi 5 contractor x61 2.00 11/6-11/12wi 6 contractor x61 2.00 11/6-11/12wi 7 contractor x61 4.00 11/6-11/12
wi 8 contractor x61 4.00 11/6-11/12wi 30 undock vsl x64 8.00 30-Decwi 30 dry dock vsl x64 8.00 6-Novwi 36 major misalignment x64 16.00 11/13-12/2wi 36 major misalignment x65 16.00 11/13-12/2
wi 36 major misalignment x66 16.00 11/13-12/2Total Hours 108.00
Availability Start Date Weekends/Holidays
X-61 4-N
ov
5-N
ov
6-N
ov
7-N
ov
8-N
ov
9-N
ov
10-N
ov
11-N
ov
12-N
ov
13-N
ov
14-N
ov
15-N
ov
16-N
ov
17-N
ov
18-N
ov
19-N
ov
20-N
ov
21-N
ov
22-N
ov
23-N
ov
24-N
ov
25-N
ov
26-N
ov
27-N
ov
28-N
ovIBIS 2.5 5.5 5.5 5.5 3 2.3 6.3 2.3 2.3 2.3 2.3 2.3 2STINGRAYHAMMERHEADTOTAL MHs 0 2.5 5.5 5.5 0 0 5.5 0 3 2.3 6.3 0 0 2.3 2.3 2.3 2.3 2.3 0 2 0 0 0 0 0
X-61 29-N
ov
30-N
ov
1-D
ec
2-D
ec
3-D
ec
4-D
ec
5-D
ec
6-D
ec
7-D
ec
8-D
ec
9-D
ec
10-D
ec
11-D
ec
12-D
ec
13-D
ec
14-D
ec
15-D
ec
16-D
ec
17-D
ec
18-D
ec
19-D
ec
20-D
ec
21-D
ec
22-D
ec
23-D
ec
IBISSTINGRAY 2.5 5.5 5.5 5.5 3 2.3 6.3 2.3 2.3 2.3 2.3 2.3 2HAMMERHEADTOTAL MHs 0 0 0 2.5 5.5 5.5 0 0 5.5 0 3 2.3 6.3 0 0 2.3 2.3 2.3 2.3 2.3 0 2 0 0 0
X-61 24-D
ec
25-D
ec
26-D
ec
27-D
ec
28-D
ec
29-D
ec
30-D
ec
31-D
ec
1-Ja
n
2-Ja
n
3-Ja
n
4-Ja
n
5-Ja
n
6-Ja
n
7-Ja
n
8-Ja
n
9-Ja
n
10-J
an
11-J
an
12-J
an
13-J
an
14-J
an
IBISSTINGRAYHAMMERHEAD 2.5 5.5 5.5 5.5 3 2.3TOTAL MHs 0 0 0 0 0 0 0 0 0 0 0 0 0 2.5 5.5 5.5 0 0 5.5 0 3 2.3

98
Figure A.16 Calendar Schedule Representation of Job Shop X-64 Loading over Three Parallel Availabilities.
Figure A.17 Calendar Schedule Representation of Job Shop X-65 Loading over Three Parallel Availabilities.
Availability Start Date Weekends/Holidays
X-64 4-N
ov
5-N
ov
6-N
ov
7-N
ov
8-N
ov
9-N
ov
10-N
ov
11-N
ov
12-N
ov
13-N
ov
14-N
ov
15-N
ov
16-N
ov
17-N
ov
18-N
ov
19-N
ov
20-N
ov
21-N
ov
22-N
ov
23-N
ov
24-N
ov
25-N
ov
26-N
ov
27-N
ov
28-N
ov
IBIS 8 1.2 1.2 1.2 1.2 1.2 1.2 1.2 1.2 1.2 1.2 1.2STINGRAYHAMMERHEADTOTAL MHs 0 0 8 0 0 0 0 0 0 1.2 1.2 0 0 1.2 1.2 1.2 1.2 1.2 0 0 1.2 1.2 1.2 0 1.2
X-64 29-N
ov
30-N
ov
1-D
ec
2-D
ec
3-D
ec
4-D
ec
5-D
ec
6-D
ec
7-D
ec
8-D
ec
9-D
ec
10-D
ec
11-D
ec
12-D
ec
13-D
ec
14-D
ec
15-D
ec
16-D
ec
17-D
ec
18-D
ec
19-D
ec
20-D
ec
21-D
ec
22-D
ec
23-D
ec
IBIS 1.2 1.2STINGRAY 8 1.2 1.2 1.2 1.2 1.2 1.2 1.2 1.2 1.2 1.2HAMMERHEADTOTAL MHs 0 0 1.2 1.2 8 0 0 0 0 0 0 1.2 1.2 0 0 1.2 1.2 1.2 1.2 1.2 0 0 1.2 1.2 1.2
X-64 24-D
ec
25-D
ec
26-D
ec
27-D
ec
28-D
ec
29-D
ec
30-D
ec
31-D
ec
1-Ja
n
2-Ja
n
3-Ja
n
4-Ja
n
5-Ja
n
6-Ja
n
7-Ja
n
8-Ja
n
9-Ja
n
10-J
an
11-J
an
12-J
an
13-J
an
14-J
an
IBIS 8STINGRAY 1.2 1.2 1.2 1.2HAMMERHEAD 8 1.2TOTAL MHs 1.2 0 1.2 0 0 1.2 1.2 8 0 0 0 0 0 0 8 0 0 0 0 0 0 1.2
Availability Start Date Weekends/Holidays
X-65 4-N
ov
5-N
ov
6-N
ov
7-N
ov
8-N
ov
9-N
ov
10-N
ov
11-N
ov
12-N
ov
13-N
ov
14-N
ov
15-N
ov
16-N
ov
17-N
ov
18-N
ov
19-N
ov
20-N
ov
21-N
ov
22-N
ov
23-N
ov
24-N
ov
25-N
ov
26-N
ov
27-N
ov
28-N
ov
IBIS 1.2 1.2 1.2 1.2 1.2 1.2 1.2 1.2 1.2 1.2 1.2STINGRAYHAMMERHEADTOTAL MHs 0 0 0 0 0 0 0 0 0 1.2 1.2 0 0 1.2 1.2 1.2 1.2 1.2 0 0 1.2 1.2 1.2 0 1.2
X-65 29-N
ov
30-N
ov
1-D
ec
2-D
ec
3-D
ec
4-D
ec
5-D
ec
6-D
ec
7-D
ec
8-D
ec
9-D
ec
10-D
ec
11-D
ec
12-D
ec
13-D
ec
14-D
ec
15-D
ec
16-D
ec
17-D
ec
18-D
ec
19-D
ec
20-D
ec
21-D
ec
22-D
ec
23-D
ec
IBIS 1.2 1.2STINGRAY 1.2 1.2 1.2 1.2 1.2 1.2 1.2 1.2 1.2 1.2HAMMERHEADTOTAL MHs 0 0 1.2 1.2 0 0 0 0 0 0 0 1.2 1.2 0 0 1.2 1.2 1.2 1.2 1.2 0 0 1.2 1.2 1.2
X-65 24-D
ec
25-D
ec
26-D
ec
27-D
ec
28-D
ec
29-D
ec
30-D
ec
31-D
ec
1-Ja
n
2-Ja
n
3-Ja
n
4-Ja
n
5-Ja
n
6-Ja
n
7-Ja
n
8-Ja
n
9-Ja
n
10-J
an
11-J
an
12-J
an
13-J
an
14-J
an
IBISSTINGRAY 1.2 1.2 1.2 1.2HAMMERHEAD 1.2TOTAL MHs 1.2 0 1.2 0 0 1.2 1.2 0 0 0 0 0 0 0 0 0 0 0 0 0 0 1.2

99
Figure A.18 Calendar Schedule Representation of Job Shop X-66 Loading over Three Parallel Availabilities.
Figure A.19 Loading of one project with all job shop man-hours combined.
Availability Start Date Weekends/Holidays
X-66 4-N
ov
5-N
ov
6-N
ov
7-N
ov
8-N
ov
9-N
ov
10-N
ov
11-N
ov
12-N
ov
13-N
ov
14-N
ov
15-N
ov
16-N
ov
17-N
ov
18-N
ov
19-N
ov
20-N
ov
21-N
ov
22-N
ov
23-N
ov
24-N
ov
25-N
ov
26-N
ov
27-N
ov
28-N
ov
IBIS 1.2 1.2 1.2 1.2 1.2 1.2 1.2 1.2 1.2 1.2 1.2STINGRAYHAMMERHEADTOTAL MHs 0 0 0 0 0 0 0 0 0 1.2 1.2 0 0 1.2 1.2 1.2 1.2 1.2 0 0 1.2 1.2 1.2 0 1.2
X-66 29-N
ov
30-N
ov
1-D
ec
2-D
ec
3-D
ec
4-D
ec
5-D
ec
6-D
ec
7-D
ec
8-D
ec
9-D
ec
10-D
ec
11-D
ec
12-D
ec
13-D
ec
14-D
ec
15-D
ec
16-D
ec
17-D
ec
18-D
ec
19-D
ec
20-D
ec
21-D
ec
22-D
ec
23-D
ec
IBIS 1.2 1.2STINGRAY 1.2 1.2 1.2 1.2 1.2 1.2 1.2 1.2 1.2 1.2HAMMERHEADTOTAL MHs 0 0 1.2 1.2 0 0 0 0 0 0 0 1.2 1.2 0 0 1.2 1.2 1.2 1.2 1.2 0 0 1.2 1.2 1.2
X-66 24-D
ec
25-D
ec
26-D
ec
27-D
ec
28-D
ec
29-D
ec
30-D
ec
31-D
ec
1-Ja
n
2-Ja
n
3-Ja
n
4-Ja
n
5-Ja
n
6-Ja
n
7-Ja
n
8-Ja
n
9-Ja
n
10-J
an
11-J
an
12-J
an
13-J
an
14-J
an
IBISSTINGRAY 1.2 1.2 1.2HAMMERHEAD 1.2TOTAL MHs 0 1.2 0 0 1.2 1.2 0 0 0 0 0 0 0 0 0 0 0 0 0 0 0 1.2
ONE AVAILABILITY ONLY CGC IBIS
4-N
ov
5-N
ov
6-N
ov
7-N
ov
8-N
ov
9-N
ov
10-N
ov
11-N
ov
12-N
ov
13-N
ov
14-N
ov
15-N
ov
16-N
ov
17-N
ov
18-N
ov
19-N
ov
20-N
ov
21-N
ov
22-N
ov
23-N
ov
24-N
ov
25-N
ov
26-N
ov
27-N
ov
28-N
ov
Total 70.8 132 443 262.5 45.1 45.1 258.6 45.1 331.6 204.9 109 45.1 45.1 107 107 107 105 97 45.1 45.1 181.1 179.1 179.1 45.1 179.1/25 ppd 2.821 5.25 17.6 10.46 7.52 7.517 10.3 7.52 13.21 8.163 4.32 7.52 7.52 4.24 4.24 4.24 4.16 3.8 7.52 7.52 7.216 7.136 7.136 7.52 7.136/22.2ppd 3.189 5.94 19.9 11.82 7.52 7.517 11.65 7.52 14.93 9.23 4.89 7.52 7.52 4.8 4.8 4.8 4.71 4.3 7.52 7.52 8.158 8.068 8.068 7.52 8.068
29-N
ov
30-N
ov
1-D
ec
2-D
ec
3-D
ec
4-D
ec
5-D
ec
6-D
ec
7-D
ec
8-D
ec
9-D
ec
10-D
ec
11-D
ec
12-D
ec
13-D
ec
14-D
ec
15-D
ec
16-D
ec
17-D
ec
18-D
ec
19-D
ec
20-D
ec
21-D
ec
22-D
ec
23-D
ec
Total 0 0 24.7 80.99 53.4 53.39 53.39 45.1 45.1 53.39 53.4 82.2 342 342 45.1 45.1 348 333 140 157 129.1 45.1 45.1 130 129.1/25 ppd 0 0 0.99 3.226 2.13 2.127 2.127 7.52 7.517 2.127 2.13 3.27 13.6 13.6 7.52 7.52 13.9 13 5.59 6.26 5.145 7.517 7.517 5.18 5.145/22.2ppd 0 0 1.11 3.648 2.4 2.405 2.405 7.52 7.517 2.405 2.4 3.7 15.4 15.4 7.52 7.52 15.7 15 6.33 7.08 5.817 7.517 7.517 5.86 5.817
24-D
ec
25-D
ec
26-D
ec
27-D
ec
28-D
ec
29-D
ec
30-D
ec
31-D
ec
1-Ja
n
2-Ja
n
3-Ja
n
4-Ja
n
5-Ja
n
6-Ja
n
7-Ja
n
8-Ja
n
9-Ja
n
10-J
an
11-J
an
12-J
an
13-J
an
14-J
an
Total 129.1 45.1 137 45.1 45.1 149.4 172.5 111 0 92.88 0 0 72.9 68.9 68.9 77.6 96.6 0 0 87.6 101.9 9.44/25 ppd 5.145 7.52 5.46 7.517 7.52 5.953 6.874 4.42 0 3.7 0 0 2.9 2.74 2.74 3.09 3.85 0 0 3.49 4.059 0.376/22.2ppd 5.817 7.52 6.18 7.517 7.52 6.731 7.772 4.99 0 4.184 0 0 3.28 3.1 3.1 3.49 4.35 0 0 3.94 4.589 0.425
Weekends/Holidays

100
Figure A.20 Loading of two parallel projects with all job shop man-hours combined.
Figure A.21 Manning Scenario Comparative Graph for Two Availabilities.
TWO AVAILABILITIES CGC IBIS & CGC STINGRAY
4-N
ov
5-N
ov
6-N
ov
7-N
ov
8-N
ov
9-N
ov
10-N
ov
11-N
ov
12-N
ov
13-N
ov
14-N
ov
15-N
ov
16-N
ov
17-N
ov
18-N
ov
19-N
ov
20-N
ov
21-N
ov
22-N
ov
23-N
ov
24-N
ov
25-N
ov
26-N
ov
27-N
ov
28-N
ov
Total 70.8 131.8 442.6 252.0 45.1 45.1 258.6 45.1 342.1 204.9 108.5 45.1 45.1 106.5 106.5 106.5 104.5 96.5 45.1 47.1 179.1 179.1 179.1 45.1 181.1/25 ppd 2.8 5.3 17.6 10.0 7.5 7.5 10.3 7.5 13.6 8.2 4.3 7.5 7.5 4.2 4.2 4.2 4.2 3.8 7.5 7.9 7.1 7.1 7.1 7.5 7.2/22.2ppd 3.2 5.9 19.9 11.4 7.5 7.5 11.6 7.5 15.4 9.2 4.9 7.5 7.5 4.8 4.8 4.8 4.7 4.3 7.5 7.9 8.1 8.1 8.1 7.5 8.2
29-N
ov
30-N
ov
1-D
ec
2-D
ec
3-D
ec
4-D
ec
5-D
ec
6-D
ec
7-D
ec
8-D
ec
9-D
ec
10-D
ec
11-D
ec
12-D
ec
13-D
ec
14-D
ec
15-D
ec
16-D
ec
17-D
ec
18-D
ec
19-D
ec
20-D
ec
21-D
ec
22-D
ec
23-D
ec
Total 45.1 45.1 264.6 316.8 487.6 334.2 257.0 90.2 90.2 207.1 396.2 298.8 455.1 448.7 90.2 90.2 454.7 439.9 235.0 207.4 226.6 90.2 90.2 311.2 308.2/25 ppd 7.5 7.5 10.5 12.6 19.4 13.3 10.2 15.0 15.0 8.3 15.8 11.9 18.1 17.9 15.0 15.0 18.1 17.5 9.4 8.3 9.0 15.0 15.0 12.4 12.3/22.2ppd 7.5 7.5 11.9 14.3 22.0 15.1 11.6 15.0 15.0 9.3 17.8 13.5 20.5 20.2 15.0 15.0 20.5 19.8 10.6 9.3 10.2 15.0 15.0 14.0 13.9
24-D
ec
25-D
ec
26-D
ec
27-D
ec
28-D
ec
29-D
ec
30-D
ec
31-D
ec
1-Ja
n
2-Ja
n
3-Ja
n
4-Ja
n
5-Ja
n
6-Ja
n
7-Ja
n
8-Ja
n
9-Ja
n
10-J
an
11-J
an
12-J
an
13-J
an
14-J
an
Total 302.5 90.2 316.2 90.2 90.2 345.3 348.3 185.5 45.1 188.3 45.1 45.1 155.1 151.1 203.8 419.7 429.9 45.1 45.1 427.2 389.9 155.9/25 ppd 12.1 15.0 12.6 15.0 15.0 13.8 13.9 7.4 7.5 7.5 7.5 7.5 6.2 6.0 8.1 16.7 17.1 7.5 7.5 17.0 15.5 6.2/22.2ppd 13.6 15.0 14.2 15.0 15.0 15.6 15.7 8.4 7.5 8.5 7.5 7.5 7.0 6.8 9.2 18.9 19.4 7.5 7.5 19.2 17.6 7.0
Weekends/Holidays CGC IBIS

101
Figure A.22 Loading of three parallel projects with all job shop man-hours combined.
Figure A.23 Manning Scenario Comparative Graph for Three Availabilities.
THREE AVAILABILITIES
4-N
ov
5-N
ov
6-N
ov
7-N
ov
8-N
ov
9-N
ov
10-N
ov
11-N
ov
12-N
ov
13-N
ov
14-N
ov
15-N
ov
16-N
ov
17-N
ov
18-N
ov
19-N
ov
20-N
ov
21-N
ov
22-N
ov
23-N
ov
24-N
ov
25-N
ov
26-N
ov
27-N
ov
28-N
ov
Total 70.8 131.8 442.6 262.5 45.1 45.1 258.6 45.1 331.6 204.9 108.5 45.1 45.1 106.5 106.5 106.5 104.5 96.5 45.1 47.1 179.1 179.1 179.1 45.1 181.1/25 ppd 2.8 5.3 17.6 10.5 7.5 7.5 10.3 7.5 13.2 8.2 4.3 7.5 7.5 4.2 4.2 4.2 4.2 3.8 7.5 7.9 7.1 7.1 7.1 7.5 7.2/22.2ppd 3.2 5.9 19.9 11.8 7.5 7.5 11.6 7.5 14.9 9.2 4.9 7.5 7.5 4.8 4.8 4.8 4.7 4.3 7.5 7.9 8.1 8.1 8.1 7.5 8.2
29-N
ov
30-N
ov
1-D
ec
2-D
ec
3-D
ec
4-D
ec
5-D
ec
6-D
ec
7-D
ec
8-D
ec
9-D
ec
10-D
ec
11-D
ec
12-D
ec
13-D
ec
14-D
ec
15-D
ec
16-D
ec
17-D
ec
18-D
ec
19-D
ec
20-D
ec
21-D
ec
22-D
ec
23-D
ec
Total 45.1 45.1 264.6 316.8 487.6 334.2 257.0 90.2 90.2 207.1 396.2 298.8 455.1 448.7 90.2 90.2 454.7 439.9 235.0 207.4 226.6 90.2 90.2 311.2 308.2/25 ppd 7.5 7.5 10.5 12.6 19.4 13.3 10.2 15.0 15.0 8.3 15.8 11.9 18.1 17.9 15.0 15.0 18.1 17.5 9.4 8.3 9.0 15.0 15.0 12.4 12.3/22.2ppd 7.5 7.5 11.9 14.3 22.0 15.1 11.6 15.0 15.0 9.3 17.8 13.5 20.5 20.2 15.0 15.0 20.5 19.8 10.6 9.3 10.2 15.0 15.0 14.0 13.9
24-D
ec
25-D
ec
26-D
ec
27-D
ec
28-D
ec
29-D
ec
30-D
ec
31-D
ec
1-Ja
n
2-Ja
n
3-Ja
n
4-Ja
n
5-Ja
n
6-Ja
n
7-Ja
n
8-Ja
n
9-Ja
n
10-J
an
11-J
an
12-J
an
13-J
an
14-J
an
Total 308.2 90.2 316.2 90.2 90.2 339.6 348.3 185.0 46.0 189.9 45.1 45.1 240.4 326.0 635.8 667.7 585.3 90.2 90.2 576.7 739.9 350.8/25 ppd 12.3 15.0 12.6 15.0 15.0 13.5 13.9 7.4 7.7 7.6 7.5 7.5 9.6 13.0 25.3 26.6 23.3 15.0 15.0 23.0 29.5 14.0/22.2ppd 13.9 15.0 14.2 15.0 15.0 15.3 15.7 8.3 7.7 8.6 7.5 7.5 10.8 14.7 28.6 30.1 26.4 15.0 15.0 26.0 33.3 15.8
Weekends/Holidays CGC IBISCGC IBIS & CGC STINGRAY
CGC IBIS,CGC STINGRAY, & CGC HAMMERHEAD

102
Figure A.24 Color Coded WBS for CGC POMPANO.
Monday 3/2 Tues 3/3 - Wed 3/4 Thurs 3/5-COB Wed3/11 Thu 3/12- COB 3/20 Sat 3/21- Sun 3/22 Mon 3/23 - Wed 4/1 Thu 4/2-Sun 4/12
Ride in and Pre-op Test
Measures propulsion shaft shims and pre-docking propulsion shaft hub
**Drydock Cutter / Seal Enclosure Install Temp Services 3/5**
100% Blast hull, Stern tubes, Laz, s/s & Prime Hull for side scan Commence Side Scan
Gray Water & Sewage Pipe Flush Prime & Paint CutterRemove mast interferences,
coil up cables, protect coiled up cables Remove liquid loads (CTR)
Clean Bilges/Tanks (CTR) Marine Chemist/ Gas Free Cert. Blue Fit Props
Finish Blasting of Laz, & Prep Eng Room for substrate inspection Capastic Fairing
Pull TLIs Remove Sea Valves & Speed Log Valve Prep Sea Valves for Install Install Shaft bearings All HotworkOpen Fuel, Sewage, Dirty
Oil, Waste Oil, and Grey Water Tanks
Remove underwater appendages Rudders/Shafts/Props Complete Mast Mods Perform UT shots
Remove HPU Remove Notch Pads Tech Rep - shaft seals
Remove Small Boat Mobilize Blast EquipmentRemove grit from floor of enclosure (CTR)
Remove Mast Optical AlignmentRemove Bilge and Lazarette interferences
Remove Stern DoorMon 4/13-Sun 4/19 Mon 4/20- Fri 4/24 Sat 4/25- Wed 4/29 Thurs 4/30 Fri 5/1 Mon 5/4-Tues 5/5 Wed 5/6
Install Interferences** 4/23- Open Structure for mast install** Elex Testing *4/30 Undock Vessel* Take Final Face Readings Sea Trials Final Walk-Thru
Load Sea Valves Install Mast Clean Vessel (CTR) Boom/Refuel Vessel Crew arrives Cutter Departs
Notify crew of report date Install stern gate Final touch-ups Fill P/W Tanks Outfit Onload
Install Hull Zincs Tech Rep - shaft seals Install Lagging Dock Trials
Lay Deck Pads Install U/W Appendages Load Small BoatInstall Sea Valves and Speed Log Valve
Shaft Seal Piping Install
Paint ER Bilge & Lazarette
Comparisons to IBIS WBS Pushed Back (Later Date) Pushed Up (Earlier Date) New Item on WBS
POMPANO WBS