the urban co-benefits approach: methods and tools urban co-benefits approach: methods and tools...
TRANSCRIPT

The Urban Co-benefits approach:
Methods and tools
Christopher Doll Research Fellow
United Nations University
Institute for the Advanced Study of Sustainability
Quantifying the Environmental, Social, Economic Benefits from
Bus Rapid Transit (BRT) Systems
SPAD & Asia-LEDS Workshop
Kuala Lumpur - 25 June 2014
1

Outline
• Introduction to UNU, urbanisation and urban
systems
• Urban development with co-benefits
– How much (quantification)
– ASI framework and transport tool
• Case study: Delhi Metro
– How come (dimensions of decision
making)
• Results of survey
• Back to systems thinking
2

The UNU and its Institutes
3
UNU-CRIS
[regional integration]
UNU-EHS
[environment & human security]
UNU-FLORES
[material fluxes & resources]
UNU-IAS
[advanced study for
sustainability]
UNU-IIAOC
[alliance of civilizations]
UNU-IIGH
[global health]
UNU-IIST
[software technology]
UNU-INRA
[Africa's natural resources]
UNU-INWEH
[water, environment, health]
UNU-MERIT
[society, economy, innovation]
UNU-WIDER
[development economics]
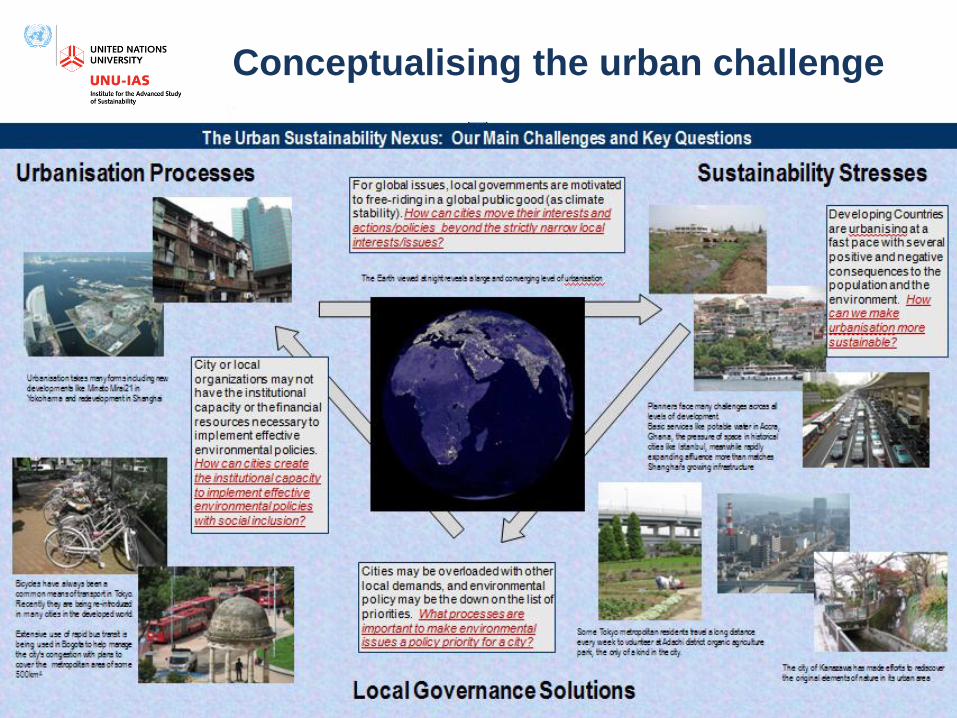
Conceptualising the urban challenge
4


Global urbanisation trends
• Since around 2007, more than 50% of the world’s
population live in cities
• Around 75% GDP, but only 2-3% of the Earth’s land surface
6 Grimm et al. 2008 Science (319)
• Human population growing (1911:
1.75bn - 2011: 7bn)
• Asia added 754 million people in
cities between 1990-2010
(US+EU). The trend will continue
in the next decades
• Africa still well below 50% urban
• Africa’s global share of urban
population is projected to rise from
11.3% in 2010 to 20.2% by 2050.
(1bn in 2010 – 2bn in 2040)

Only 8% live in clean air, 37 % (3/4 billion people) live
outside minimum WHO target
7 Doll, 2009; IPCC WGIII, Fig 12.23

8

Private transport and density
9

Greening the sectors
Transforming space and movement
10
• Compact urban development
increases density, which promotes
all kinds of efficiencies in terms of
energy use and reduced travel
– 20-40% reduction in private
vehicle kilometres driven
• Combined with mixed land-use and
increased public transport
– Green buildings
– Enhanced urbanism
• Sustainable transport initiatives
– Avoid, shift, improve
– Equity in mobility

Why does mode share matter?
11

12

Urban Development with co-benefits
13

Urban development with co-benefits
approach
14
• Urban climate co-benefits are the contribution of one
city to the reduction of global environmental
degradation and achievement of local sustainable
development goals at the same time.
• Here, it refers to policies which simultaneously address
global and local environmental problems; GHG and air
pollution reductions
• Particularly pertinent for developing
countries
• Case study approach
to evaluate:
• How much?
• How come?
• Develop support tools

The vicious cycle of urban
transport
15

The virtuous cycle of urban
transport
16

The tools
• Excel based: Transport; Energy; Waste, Governance
(for transport)
• Designed to evaluate co-benefits of interventions into
respective sectors for first order policy screening
• Four basic steps to the tools:
– Input data
– Examine initial baseline/results
– Apply changes to the sector (Avoid, Shift, Improve)
– Calculate co-benefits
• GHG emissions
• Local Air pollution, fuel saving etc
17

Governance & co-benefits evaluation:
Transport
18
• Initial conceptual framework presented in Doll et al.
(2011)
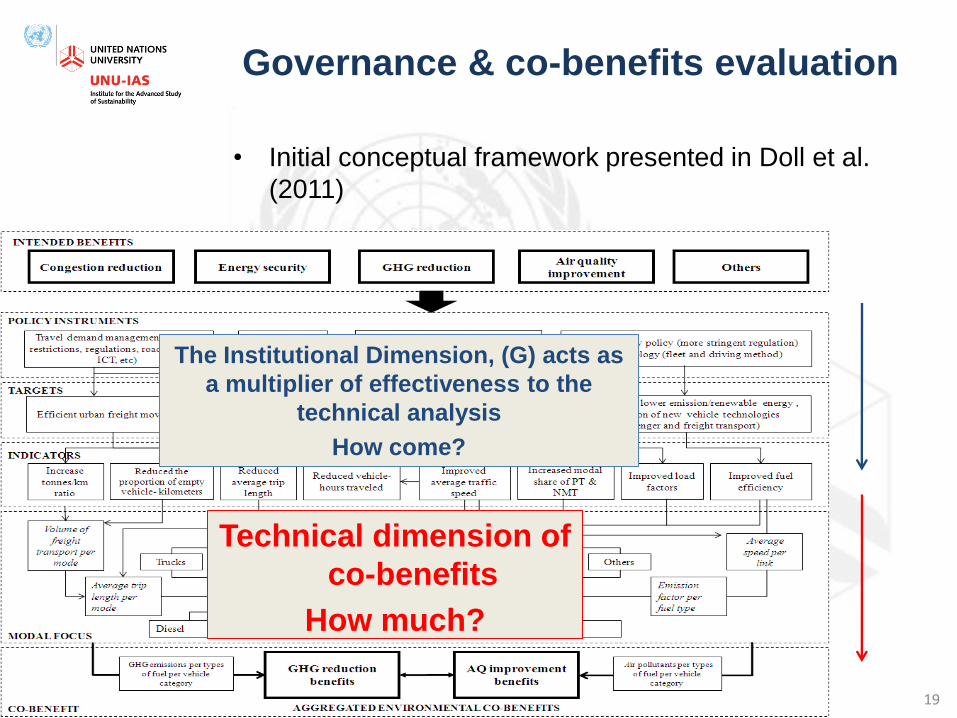
Governance & co-benefits evaluation
19
• Initial conceptual framework presented in Doll et al.
(2011)
Technical dimension of
co-benefits
How much?
The Institutional Dimension, (G) acts as
a multiplier of effectiveness to the
technical analysis
How come?

Governance & co-benefits evaluation
20
• Initial conceptual framework presented in Doll et al.
(2011)
Technical dimension of
co-benefits
How much?
The Institutional Dimension, (G) acts as
a multiplier of effectiveness to the
technical analysis
How come?

Transport tool structure
• Bottom up assessments of GHG emissions and air
pollution in each sector based on local information
– Transport
• Fleet size (number of vehicles)
• Activity (annual distance - km)
• Occupancy ( persons/vehicle)
• Fuel efficiencies (km/litre)
• Fuel emission factors (gram/litre)
21

Policy variables
• Activity
– Fleet (number of vehicles)
– Activity (distance travelled)
• Share
– Mode share of different vehicles
• Intensity
– Fuel efficiency
• Fuel switch
– Changing fuel efficiency
22

Transport tool
• Step 1. Mode selection
23

Step 2: Data input
• Step 2. Data input by Mode
24

Policy scenario sheet
25
Transport Activity (A)
Fuel Efficiency (I)
Fuel share (F) below
Mode Share (S)
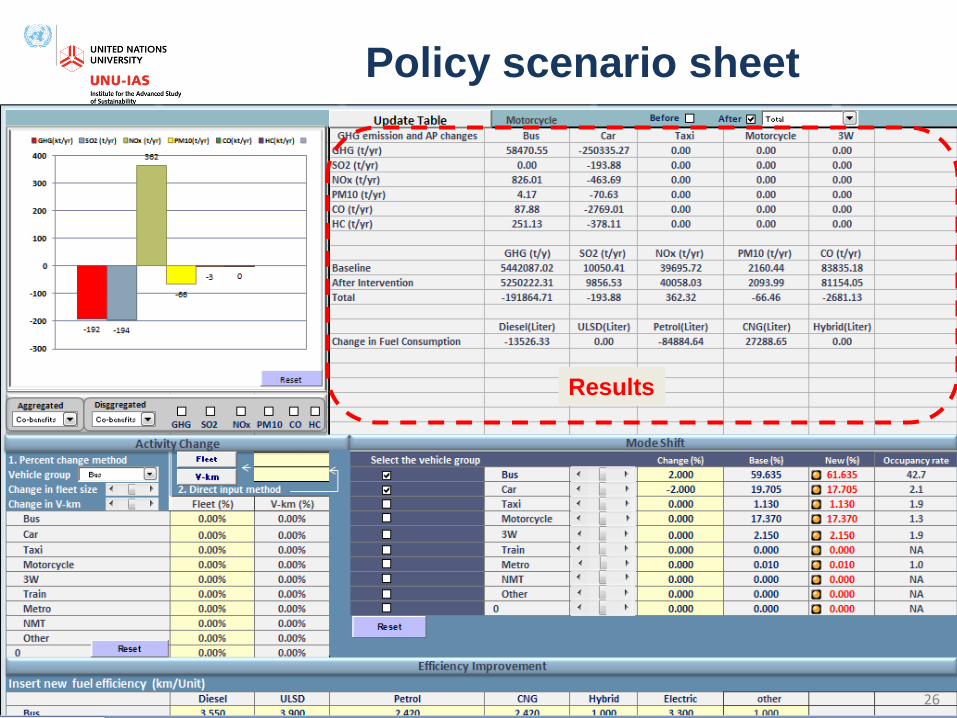
Policy scenario sheet
26
Results

Policy scenario sheet
27
Dynamic Graph

Co-benefits over time
28

Extending ASI to other sectors
29

Avoid, shift, improve in other
sectors
• ASI framework is applied to the tools in each sector
– Transport
• Travel activity (fleet size & distance)
• Mode share
• Fuel efficiency
• Fuel Type
– Energy
• Dwelling sizes
• Building management
• Energy sources (local generation)
– Waste
• Waste generation, waste composition
• Waste processing method (compost, incineration..)
• Technology used within a processing method
30

Case Study: Delhi Metro
31

Mode shift to the metro
• Mode shift revealed from interview
data and corroborated with the
literature
• Future scenarios looked at varying
proportion of car vs. bus
contribution at 22:44; 33:33; 44:22
• Other modes kept constant even
for greater ridership levels
• Current ridership calculated
1.8million/day - around 50% of
capacity ≈ 6% total demand
• Calculations also made for 75%
and 100% capacity (≈ 12% total
Delhi travel demand)
32
Bus 44%
Car 22%
Taxi 4.5%
Motorcycle 25%
3-wheelers 4.5%
Mode shift to the Metro

Carbon(eq) reductions by
ridership and mode contribution
33
-18%
-16%
-14%
-12%
-10%
-8%
-6%
-4%
-2%
0%
Current 75% 100%
Bus 44; Car 22
Bus 33; Car 33
Bus 22; Car 44
Percentage of potential metro capacity use C
O2
(e
q)
em
issi
on
s re
du
ctio
ns

Co-benefits by pollutant
34

Co-benefits by pollutant
35

Summary
• Gives general idea of the range of co-benefits
achievable under different scenarios
• Co-benefits mainly come from three areas:
– Ridership of metro
– Mode shift to the metro
– Electricity generation of metro
• Currently, marginal co-benefits with large potential
• Discussion focuses on means of attaining such shifts
– Better integration with other modes to use access
the metro stations
– Improved and enforced parking regulations
• More detailed modelling required to fully understand
tradeoffs
36

Urban development with co-benefits
approach
37
• The Co-benefits approach is a means of achieving
multiple outcomes with one policy initiative
• Here, it refers to policies which simultaneously address
global and local environmental problems; GHG and air
pollution reductions
• Particularly pertinent
for developing
countries
• Case study approach
to evaluate:
• How much?
• How come?
• Develop support tools

Flexible framework for extension
to other sectors
• Context
– Ranks relative importance of 11 factors
upon which AHP is used to determine
priorities
38
Specific
Policies
(e.g.
transport)

Governance Tool structure
39
General Governance Specific
Policies
(e.g.
transport)

Governance indicators
• Developed currently for the transport sector to aid
decision making about what changes to make in the
tool
• Self assessment of context indicators to determine
capacities and most implementable projects
– Cultural/Lifestyle
– Legal
– Orgainisational
– Coordination
– Political
• The key question is what is your ability to change
one variable relative to another?
40
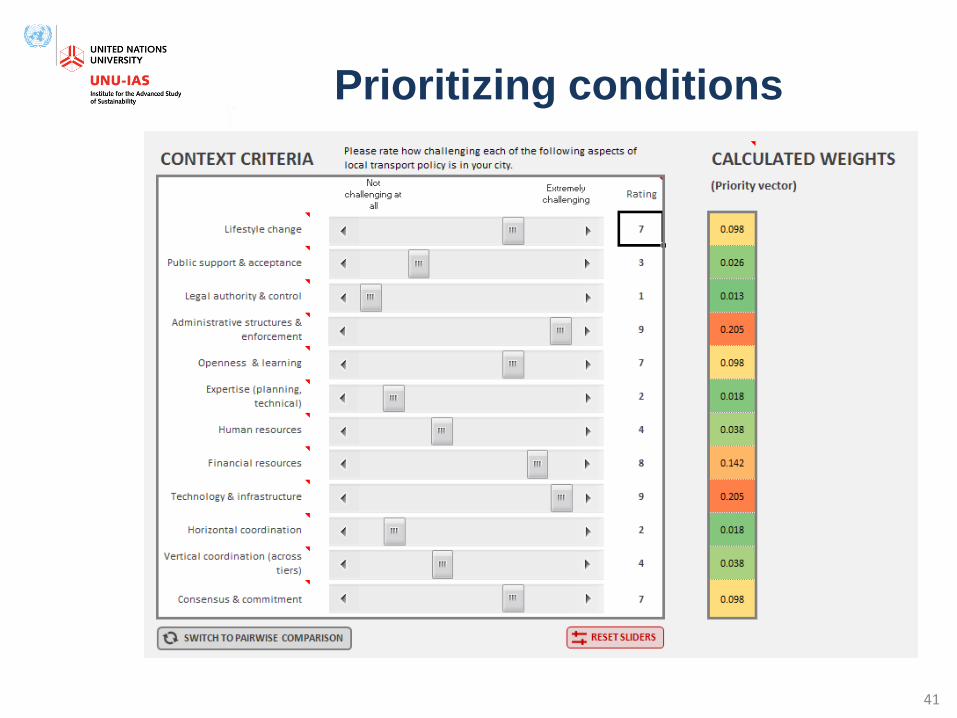
Prioritizing conditions
41
(partial screenshot)

Ranked policy measures

Link to Transport Tool

Two modes of usage
If no policies under consideration:
• Assess context
– Determine governance abilities (AHP)
• Determine most implementable options
• Determine coherent policy package
• Set parameter sensitivity of change for transport tool
If policies are in mind:
• Determine policy coherence
• Run self assessment
• Identify which areas of governance need strengthening/addressing

Users from outside
Access to local server
Registration
&
Fill in the input form
Submit and save
Input data
Download excel-based Tool
Run the tool
Access to tools: Tool-Server Interaction

https://tools.ias.unu.edu
46

Guidebooks for Evaluation tools
and Governance tools
47

Results from yesterday
48

0 1 2 3 4 5 6 7
Lifestyle change
Public support and acceptance
Legal authority and legislation
Administrative structures and enforcement
Openness and learning
Expertise
Human resources
Financial resources
Technology and infrastructure
Horizontal coordination
Vertical coordination
Consensus and commitment
Relative Governance Challenges
Mean rating

2.2
2.26
2.35
2.4
2.67
2.7
2.78
2.85
2.86
2.88
3.05
3.37
1.018
0.921
0.978
1.033
1.344
1.043
1.121
0.893
1.058
1.187
0.986
0.852
0 0.5 1 1.5 2 2.5 3 3.5 4
Public support and acceptance
Consensus and commitment
Horizontal coordination
Expertise
Openness and learning
Human resources
Legal authority and legislation
Financial resources
Vertical coordination
Lifestyle change
Administrative structures and enforcement
Technology and infrastructure
Absolute Governance Challenges
Std. Deviation
Mean score

Governance aspect N Kuala Lumpur
Minimum rating Kuala Lumpur
Maximum rating Kuala Lumpur Sub-
Sample Mean Kuala Lumpur Sub-
Sample S.D. Non-KL Sub-Sample
mean Non-KL Sub-Sample
S.D.
Lifestyle change 18 2 9 6.61 1.852 5.58 2.469
Public support and acceptance 18 1 8 5.61 2.146 5.27 2.127
Legal authority and legislation 18 2 9 5.83 2.503 5.27 2.070
Administrative structures and enforcement
18 2 9 5.83 2.121 5.62 1.813
Openness and learning 18 1 8 4.39 1.720 4.54 1.726
Expertise 18 1 9 4.83 2.383 4.73 2.108
Human resources 18 1 9 4.39 2.033 4.84 2.173
Financial resources 18 2 9 5.39 1.754 5.27 2.736
Technology and infrastructure 18 2 9 5.17 2.550 5.38 2.118
Horizontal coordination 18 2 9 5.50 1.823 5.19 1.960
Vertical coordination 18 3 8 5.44 1.688 5.64 1.846
Consensus and commitment 18 2 9 6.06 1.893 5.81 2.191
Consistency of relative rating scores
(Kuala Lumpur vs. rest)

Governance aspect N Minimum Maximum Kuala Lumpur Mean Kuala Lumpur S.D. Non-KL Mean Non-KL S.D.
Lifestyle change 17 2 5 3.06 1.249 2.75 1.152
Public support and acceptance 16 1 3 1.94 0.772 2.38 1.135
Legal authority and legislation 16 1 4 2.44 1.094 3.00 1.103
Administrative structures and enforcement
16 1 4 2.88 0.806 3.17 1.090
Openness and learning 16 1 4 2.69 1.302 2.65 1.402
Expertise 16 1 4 2.31 1.014 2.46 1.062
Human resources 16 1 4 2.25 0.856 3.00 1.063
Financial resources 16 1 4 2.81 0.655 2.88 1.035
Technology and infrastructure 15 2 4 3.20 0.676 3.48 0.947
Horizontal coordination 15 1 4 2.33 0.816 2.36 1.093
Vertical coordination 15 1 4 2.47 1.125 3.14 0.941
Consensus and commitment 15 1 3 2.00 0.655 2.43 1.037
Consistency of absolute scores (Kuala Lumpur vs. rest)

Capacity Assessment in KL
54
Average Absolute Capacity
Resp
on
den
ts
City Hall SPAD Construction/
M.Pub.Works
0
1
2
3
4
5
6
0 0.25 0.5 0.75 1 1.25 1.5 1.75 2 2.25 2.5 2.75 3 3.25 3.5 3.75

Concluding remarks
• Simple way of looking at assessing a range
of transport policies
• From an objective view, a city has a certain
capacity in these factors
• Helps generate different perspectives
• Look at sensitivities, get a feel for the policy
landscape
• One element of the multi-criteria approach
to be evaluated with other co-benefits such
as health, safety, environment, travel time
– Or.., as an aid to implementation
55

Co-benefits in Health Links
56
Source: Woodcock et al., 2009

57

OPPORTUNITIES FOR PROMOTING URBAN CO-
BENEFITS
• Discussions of Co-benefits has emerged in several organizations: Opportunities in the Policy Arena
• Short Term- Straight forward initiatives using simple technologies
E.g., waste management, 3R.
• Medium Term: require larger investments and the projects can have a high institutional complexity, and consequently high risks and transaction costs
E.g., transportation, and industry and energy sector.
• Long Term – Areas with slow changing paths and involving a larger set of integrated initiatives and standards
E.g.,: building and land-use sectors, consumption
58

Climate Change and Cities
• Mitigation and Adaptation
– Sectoral issues (energy, transportation)
– Physical issues (buildings)
– Land use issues (urban form, heat islands)
– Regional issues (effects on economy of the
region)
– Green Agenda issues (consumption)
Co
mp
lexi
ty i
ncr
ease

Discussion items
• Is the tool useful in an operational sense?
– If so, by whom?
• What is the best level to discuss
governance?
• Are we missing any important dimensions?
– Is anything irrelevant
60

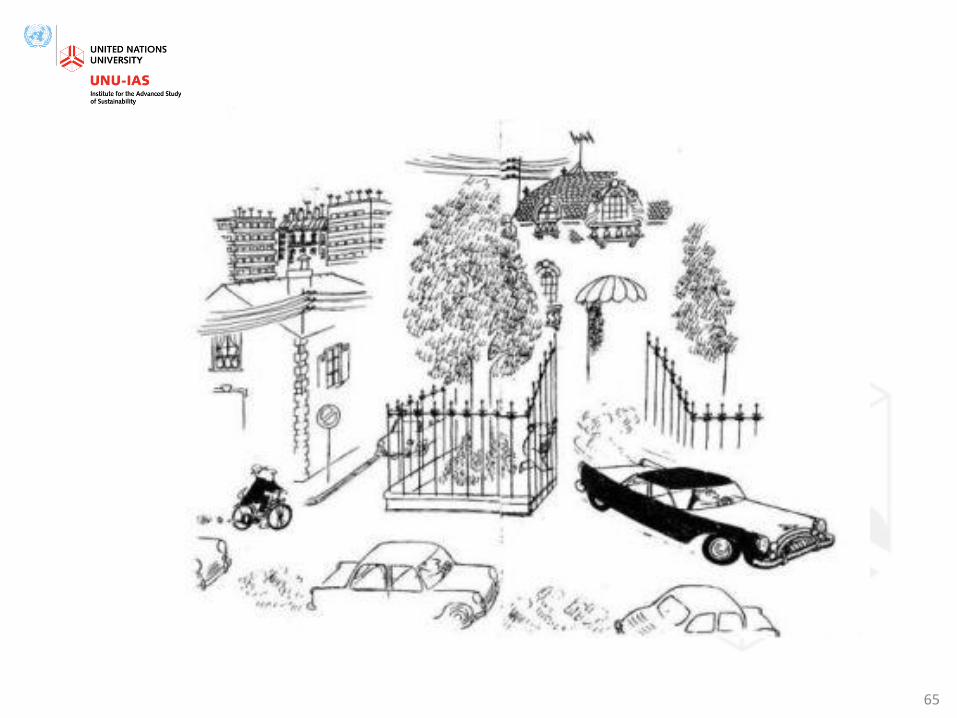
Brève histoire de la mobilité
(A brief history of mobility)
Sempé, Rien n’est simple (1962)
61

62

63

64
65

66