the urban and regional dimension of europe...
TRANSCRIPT
EN
The urban and regional dimension of Europe 2020Seventh progress report on economic, social and territorial cohesion
November 2011Report from the Commission

Europe Direct is a service to help you find answers to your questions about the European Union.
Freephone number (*):
00 800 6 7 8 9 10 11(*) Certain mobile telephone operators do not allow access to 00 800 numbers
or these calls may be billed.
More information on the European Union is available on the Internet (http://europa.eu).
Cataloguing data can be found at the end of this publication.
Luxembourg: Publications Office of the European Union, 2011
ISBN 978-92-79-21727-2doi:10.2776/50938
Cover Picture: © Directorate-general for Regional Policy
© European Union, 2011Reproduction is authorised provided the source is acknowledged.
Printed in Belgium
Printed on elemental chlorine-free bleached PaPer (ecf)
The urban and regional dimension of Europe 2020Seventh progress report on economic, social and territorial cohesion
1. Introduction. . . . . . . . . . . . . . . . . . . . . . . . . . . . . . . . . . . . . . . . . . . . . . . . . . . . . . . . . . . . . . . . . . . . . . . . . . . . . . . . . . . . . . . . . . . . . . . . . . . . . . . . . . . . . . . . . . . . . . . . . . . . . . . . . . . . . . . . . . . . . . . . . . . . . . . . . . . . . . . . . . . . . . .6
2. Smartgrowth.....................................................................................................................................................................7 2.1. Educationandtraining. . . . . . . . . . . . . . . . . . . . . . . . . . . . . . . . . . . . . . . . . . . . . . . . . . . . . . . . . . . . . . . . . . . . . . . . . . . . . . . . . . . . . . . . . . . . . . . . . . . . . . . . . . . . . . . . . . . . . . . . . . . . . . . . . . . . . . . . . . . . . . 7 2.2. ResearchandInnovation. . . . . . . . . . . . . . . . . . . . . . . . . . . . . . . . . . . . . . . . . . . . . . . . . . . . . . . . . . . . . . . . . . . . . . . . . . . . . . . . . . . . . . . . . . . . . . . . . . . . . . . . . . . . . . . . . . . . . . . . . . . . . . . . . . . . . . . . . . 7 2.3. Digitalsociety. . . . . . . . . . . . . . . . . . . . . . . . . . . . . . . . . . . . . . . . . . . . . . . . . . . . . . . . . . . . . . . . . . . . . . . . . . . . . . . . . . . . . . . . . . . . . . . . . . . . . . . . . . . . . . . . . . . . . . . . . . . . . . . . . . . . . . . . . . . . . . . . . . . . . . . . . . . . . . . . 9 2.4. Creativecities:Hubsofinnovation. . . . . . . . . . . . . . . . . . . . . . . . . . . . . . . . . . . . . . . . . . . . . . . . . . . . . . . . . . . . . . . . . . . . . . . . . . . . . . . . . . . . . . . . . . . . . . . . . . . . . . . . . . . . . . . . . . . . . . . 9
3. Sustainablegrowth. . . . . . . . . . . . . . . . . . . . . . . . . . . . . . . . . . . . . . . . . . . . . . . . . . . . . . . . . . . . . . . . . . . . . . . . . . . . . . . . . . . . . . . . . . . . . . . . . . . . . . . . . . . . . . . . . . . . . . . . . . . . . . . . . . . . . . . . . . . . . . . . . 10 3.1. ResourceefficientEurope.......................................................................................................................................10 3.2. Sustainablecities. . . . . . . . . . . . . . . . . . . . . . . . . . . . . . . . . . . . . . . . . . . . . . . . . . . . . . . . . . . . . . . . . . . . . . . . . . . . . . . . . . . . . . . . . . . . . . . . . . . . . . . . . . . . . . . . . . . . . . . . . . . . . . . . . . . . . . . . . . . . . . . . . . . . . . . 11
4. Inclusivegrowth . . . . . . . . . . . . . . . . . . . . . . . . . . . . . . . . . . . . . . . . . . . . . . . . . . . . . . . . . . . . . . . . . . . . . . . . . . . . . . . . . . . . . . . . . . . . . . . . . . . . . . . . . . . . . . . . . . . . . . . . . . . . . . . . . . . . . . . . . . . . . . . . . . . . . . . . . 13 4.1. Employment. . . . . . . . . . . . . . . . . . . . . . . . . . . . . . . . . . . . . . . . . . . . . . . . . . . . . . . . . . . . . . . . . . . . . . . . . . . . . . . . . . . . . . . . . . . . . . . . . . . . . . . . . . . . . . . . . . . . . . . . . . . . . . . . . . . . . . . . . . . . . . . . . . . . . . . . . . . . . . . . . 13 4.2. Povertyandexclusion. . . . . . . . . . . . . . . . . . . . . . . . . . . . . . . . . . . . . . . . . . . . . . . . . . . . . . . . . . . . . . . . . . . . . . . . . . . . . . . . . . . . . . . . . . . . . . . . . . . . . . . . . . . . . . . . . . . . . . . . . . . . . . . . . . . . . . . . . . . . . . 13 4.3. Inclusivecities:theurbanparadox. . . . . . . . . . . . . . . . . . . . . . . . . . . . . . . . . . . . . . . . . . . . . . . . . . . . . . . . . . . . . . . . . . . . . . . . . . . . . . . . . . . . . . . . . . . . . . . . . . . . . . . . . . . . . . . . . . . . . 14
5. Conclusion. . . . . . . . . . . . . . . . . . . . . . . . . . . . . . . . . . . . . . . . . . . . . . . . . . . . . . . . . . . . . . . . . . . . . . . . . . . . . . . . . . . . . . . . . . . . . . . . . . . . . . . . . . . . . . . . . . . . . . . . . . . . . . . . . . . . . . . . . . . . . . . . . . . . . . . . . . . . . . . . . . . . . . . . . 17
Annexes. . . . . . . . . . . . . . . . . . . . . . . . . . . . . . . . . . . . . . . . . . . . . . . . . . . . . . . . . . . . . . . . . . . . . . . . . . . . . . . . . . . . . . . . . . . . . . . . . . . . . . . . . . . . . . . . . . . . . . . . . . . . . . . . . . . . . . . . . . . . . . . . . . . . . . . . . . . . . . . . . . . . . . . . . . . . . . . . . . . . . . . . . . 18
Table of contents
All the data behind the maps and charts of the 7th Progress Report can be downloaded here:
https://circabc.europa.eu/d/d/workspace/SpacesStore/f1da14ce-c104-416a-8819-f3e841f4e504/7PR_data_map_charts.xls
Please note that this link may not work with certain versions of Internet Explorer.
Please try Chrome, Opera or Firefox if you encounter problems.

5Report from the Commission to the European Parliament and the CouncilSeventh progress report on economic, social and territorial cohesion
The seventh progress report on economic, social and territorial cohesion highlights the urban and regional dimension of the Europe 2020 strategy. This report was adopted shortly after the publication of legislative proposals for the cohesion policy period 2014 to 2020. These proposals underline the critical contribution cohesion policy will make to smart, sustainable and inclusive growth and the Europe 2020 headline targets.
This report shows that cities and regions are faced with different combinations of development problems and growth potential. This is one of the main reasons cohesion policy uses an integrated approach that can be adjusted to local needs and opportunities.
Cities contain some of the biggest contradictions. Cities are highly productive, yet productivity growth in most cities was below the national average. Living and working in cities is less polluting, but city dwellers are exposed to more pollution. Cities offer the greatest concentration of employment opportunities, but in many Member States cities have the highest share of jobless households.
To support the preparation of the new cohesion policy programmes, this report measures the distance of EU regions to their national 2020 targets. This provides each region with a baseline, which can be used in regional development strategies, programme monitoring and evaluations.
This analysis does not imply that all regions can or should reach the national 2020 targets. This is neither real-istic nor desirable. The clustering of R&D, for example, can generate strong, positive spillovers. The concentra-tion of poverty and exclusion, however, can intensify deprivation, making it even more difficult to address. The real challenge is to identify how cohesion policy can make the biggest contribution to positive change.
In conclusion, for the next round of cohesion policy, programmes should select their investment priorities taking into account their baseline and concentrate on domains where investments will make the biggest contribution to smart, sustainable and inclusive growth. In this way, cohesion policy will become the efficient, results-oriented, integrated policy that the Union needs to realise its Europe 2020 strategy.
Foreword
Johannes HahnMember of the European Commission in charge of Regional Policy
László AndorMember of the European Commission in charge of Employment, Social Affairs and Inclusion

6 Report from the Commission to the European Parliament and the CouncilSeventh progress report on economic, social and territorial cohesion
Introduction
In June 2010, the European Council approved the Europe
2020 strategy, the EU’s strategy for smart, sustainable and
inclusive growth. Regional and local authorities can make
a key contribution to this strategy through the actions that
fall within their responsibility. This is particularly critical in
more decentralised or federal Member States.
Involving regional authorities in European policies can
increase the efficiency of these policies, as highlighted by
a number of recent studies (1). An integrated regional, or
place-based, approach can be more efficient for policies
with marked externalities and in countries with substantial
internal disparities. Such an approach, however, requires
a strong administrative and institutional capacity and the
right national framework conditions.
In the fifth Cohesion Report (2), the Commission proposed
to further strengthen the regional and urban dimension of
cohesion policy and its partnership principle. The following
public debate showed clear support for these changes (3).
The regulations for the period 2014-2020 put forward by the
Commission on 6 October 2011 show how these changes
will be implemented (4).
Cohesion Policy is a key delivery mechanism for Europe
2020 (5), with a long tradition of designing and implementing
integrated regional and urban programmes in partnership
with regional and local authorities, economic actors, social
partners and civil society. It can provide Europe 2020 with
the active support of regional and local authorities it needs
to succeed.
This progress report assesses how, in the context of cohe-
sion policy, regions and cities can contribute to three types
of growth of the Europe 2020 strategy. It measures the distance
of cities and regions to the national 2020 targets proposed
in the national reform programmes. This distance to target
depends on the disparities with the country, the ambition of
the NRP and expected speed of change.
This analysis does not imply that all regions can or should
reach all their national or the EU targets. For some regions,
the distance to the target is simply too great. Furthermore,
for some issues it is not realistic or desirable that all regions
reach the same target. For example, R&D is highly concen-
trated in part due to benefits of clustering research. The
concentration of poverty and exclusion, however, has a lot
of negative effects.
In short, cohesion policy programmes should select their
investment priorities taking into account the starting position
of a region or city in relation to the national 2020 targets and
identify the concentrations to promote and the ones to fight.
1
1. An Agenda for a Reformed Cohesion Policy, F. Barca, 2009. http://ec.europa.eu/regional_policy/archive/policy/future/barca_en.htm
and The balance between sectoral and integrated approaches and the involvement of sub-national levels in EU Member States.
http://ec.europa.eu/regional_policy/information/studies/index_en.cfm#2
2. Fifth Report on economic, social and territorial cohesion, 2011.
http://ec.europa.eu/regional_policy/sources/docoffic/official/reports/cohesion5/index_en.cfm
3. SEC(2011) 590 http://ec.europa.eu/regional_policy/consultation/5cr/pdf/5cr_result_sec2011590.pdf
4. See COM(2011) 615 http://ec.europa.eu/regional_policy/what/future/proposals_2014_2020_en.cfm#1
5. See: A strategy for smart, sustainable and inclusive growth, COM(2010) 2020.
http://ec.europa.eu/europe2020/documents/related-document-type/index_en.htm

7Report from the Commission to the European Parliament and the CouncilSeventh progress report on economic, social and territorial cohesion
Smart growth
The smart growth objective is to improve education, promote
R&D and innovation and move towards a digital society.
Through investments in education, training, research and
innovation, the EU economy can become more productive
and maintain or increase its global market share. This can
in turn help to increase the number of jobs and improve
their quality.
2.1. Education and training
Human capital is one of the key determinants of regional
growth (6). High levels of education attainment favour inno-
vation as it facilitates the rapid diffusion and absorption of
new knowledge and techniques. Regional development
is therefore closely linked to the capacity to create, retain
and attract human capital, which is linked to the quality of
education institutions and life-long learning opportunities.
Investment in education and training should go hand in hand
with policy reforms, such as those included in the education
and training strategy ET 2020.
Developing and attracting (entrepreneurial) talent (7) has
become a key source of growth as this can boost the inno-
vative milieu and can lead to more innovative, high-growth
firms (8) in a region.
The Europe 2020 target is to increase the share of people
aged 30-34 with a tertiary degree to 40 % by 2020. Currently,
only one in five EU regions has reached this target. Member
States have set themselves targets ranging from 26 % to 60 %.
The regions eligible under the regional competitiveness
and employment (RCE) objective score the best with (one in
three), the transition (9) regions score average (one in four),
while the convergence regions score poorly (one in twenty).
The share of tertiary educated tends to be higher in capitals
and adjoining regions, several of which have already reached
the Europe 2020 target. The distance to the national target
is significant for many regions in Portugal, Slovakia and
Germany (see annex 1).
The variation in human capital between regions within
a Member State is often larger than between Member States.
Therefore, the national strategies need to be complemented
by regional policies. A recent report suggests that delegating
more human capital development decisions to the regions (10)
can be more effective.
Europe 2020 aims to reduce the share of early school leav-
ers to less than 10 %. The share is significantly higher in most
southern European regions. In contrast, it is much lower in
Poland, Slovenia, Slovakia, Austria and the Czech Republic.
The distance to the national target is highest in Spanish
and Portuguese regions and some regions in Greece, Italy
and Bulgaria. For this target, the convergence regions score
better than the other regions, with almost half respecting
this target compared to only one in four for the RCE and
transition regions (see annex 2).
2.2. Research and Innovation
The Innovation Union flagship underlines the role of research
and innovation boosting job creation and economic growth.
Regions are playing a more important role in innovation pol-
icy for two reasons: the recognition of the regional and local
dimensions in national innovation strategies and the increas-
ing role of innovation in regional development strategies.
Research and innovation tends to be concentrated in a few
economically successful regions, but a large range of develop-
ment paths exist across Europe. Also the institutional frame-
works for innovation policies are extremely varied, in terms
of the competences of regional governments, the match
between administrative and functional regions, and cross-
regional relationships.
2
6. See Regional Outlook, Paris, OECD, 2011.
7. See Sixth Progress Report: Creative and innovative regions. COM(2009) 295.
8. This is the new Europe 2020 innovation indicator.
9. Phasing In and Phasing Out regions are grouped as Transition regions since both receive transitional support.
10. Human Capital Leading Indicators. Policy Brief, Vol. V, No. 1, P. Ederer et al. Lisbon Council, Brussels, 2011.
http://www.lisboncouncil.net/publication/publication/64-leadingindicators.html
8 Report from the Commission to the European Parliament and the CouncilSeventh progress report on economic, social and territorial cohesion
Some regional innovation policies focus too narrowly on
science and technology, which need a certain scale or criti-
cal mass of activities not present in all regions. Innovation,
however, goes far beyond science and technology and also
includes organisational and process innovation, creativity
and design.
A regional innovation strategy should involve a rigorous
assessment of a region’s strengths and weaknesses and
benchmarking with other similar regions. The strategy
should cover all dimensions of innovation and involve key
regional actors to identify targets and the appropriate policy
mix. Human capital is a key source of innovation.
The level of technological innovation and the speed of its
diffusion and absorption differ widely between EU regions (11).
Regions with the highest innovative capabilities can be
found in northern Europe, typically in the most innovative
countries. However, a few regions outperform their national
levels also in less developed countries, providing a general
picture of high concentration of technological capabilities
in few regions across Europe.
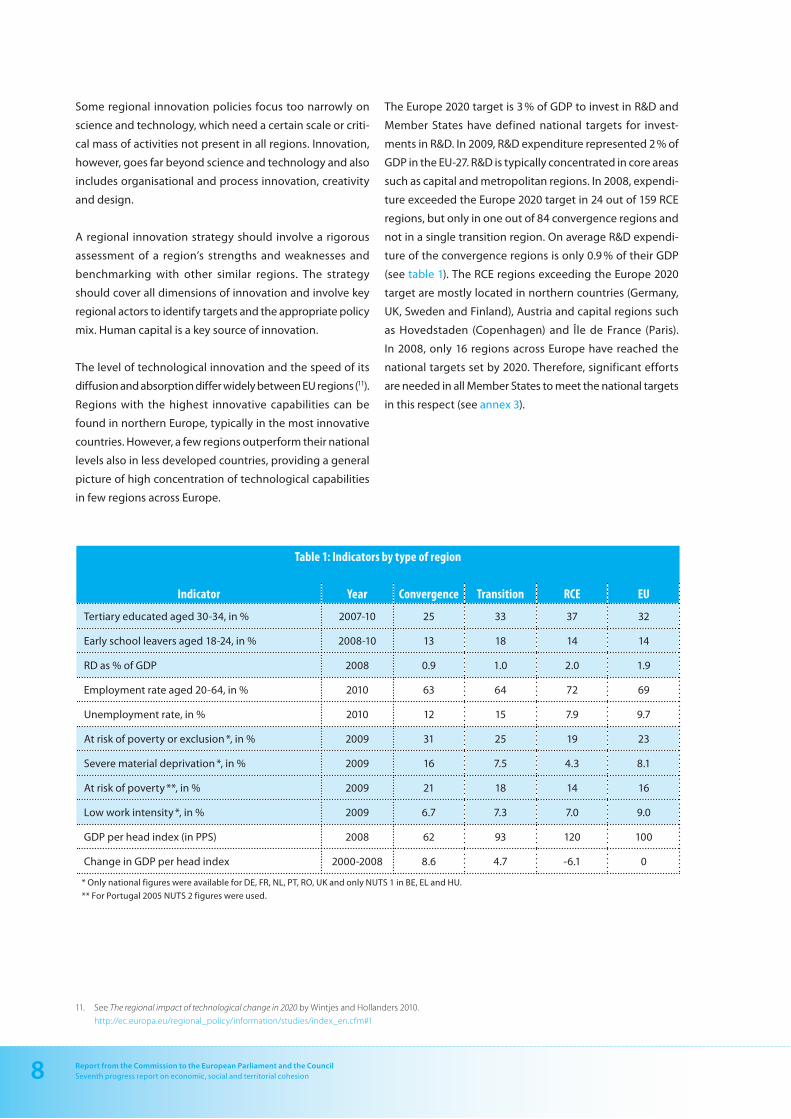
The Europe 2020 target is 3 % of GDP to invest in R&D and
Member States have defined national targets for invest-
ments in R&D. In 2009, R&D expenditure represented 2 % of
GDP in the EU-27. R&D is typically concentrated in core areas
such as capital and metropolitan regions. In 2008, expendi-
ture exceeded the Europe 2020 target in 24 out of 159 RCE
regions, but only in one out of 84 convergence regions and
not in a single transition region. On average R&D expendi-
ture of the convergence regions is only 0.9 % of their GDP
(see table 1). The RCE regions exceeding the Europe 2020
target are mostly located in northern countries (Germany,
UK, Sweden and Finland), Austria and capital regions such
as Hovedstaden (Copenhagen) and Île de France (Paris).
In 2008, only 16 regions across Europe have reached the
national targets set by 2020. Therefore, significant efforts
are needed in all Member States to meet the national targets
in this respect (see annex 3).
11. See The regional impact of technological change in 2020 by Wintjes and Hollanders 2010.
http://ec.europa.eu/regional_policy/information/studies/index_en.cfm#1
Table1:Indicatorsbytypeofregion
Indicator Year Convergence Transition RCE EU
Tertiary educated aged 30-34, in % 2007-10 25 33 37 32
Early school leavers aged 18-24, in % 2008-10 13 18 14 14
RD as % of GDP 2008 0.9 1.0 2.0 1.9
Employment rate aged 20-64, in % 2010 63 64 72 69
Unemployment rate, in % 2010 12 15 7.9 9.7
At risk of poverty or exclusion *, in % 2009 31 25 19 23
Severe material deprivation *, in % 2009 16 7.5 4.3 8.1
At risk of poverty **, in % 2009 21 18 14 16
Low work intensity *, in % 2009 6.7 7.3 7.0 9.0
GDP per head index (in PPS) 2008 62 93 120 100
Change in GDP per head index 2000-2008 8.6 4.7 -6.1 0
* Only national figures were available for DE, FR, NL, PT, RO, UK and only NUTS 1 in BE, EL and HU.
** For Portugal 2005 NUTS 2 figures were used.

9Report from the Commission to the European Parliament and the CouncilSeventh progress report on economic, social and territorial cohesion
2.3. Digital society
The Digital Agenda for Europe (12) promotes the fast develop-
ment of digital technologies and an inclusive digital society.
The availability of high-speed networks is a key factor for
competitiveness, as it determines the capacity of regions to
compete in and benefit from the global knowledge-based
economy, technology and market.
According to the 2011 digital agenda scoreboard, broad-
band (DSL) coverage in 2010 reached 95 % of the total pop-
ulation. Coverage in rural areas is significantly lower (83 %)
and represents a challenge for a number of countries where
less than 60 % of the rural population has access to broad-
band (Bulgaria, Slovakia, Poland and Romania). Nevertheless,
the gap between urban and rural areas (13) has been reduced
in the recent years (e.g. Romania and Cyprus). Still further
investments are needed to reach the broadband targets.
The utilisation of the networks for private and public e-services
is also growing but still involves a relatively limited share of
the European population. In 2010, only 41 % of the population
interacted online with public authorities and only 40 %
ordered goods or services online. The percentage of turn-
over of enterprises generated online rose from 8.6 % in 2004
to almost 14 % in 2010, confirming a trend of increasingly
dynamic growth in this area. However, important barriers
to the digital single market remain to be addressed.
2.4. Creative cities: Hubs of innovation
Cities have always been centres of specialisation and inno-
vation. For example, patenting is highly concentrated in a few
metro regions (14) (see annex 4). Given the high concentra-
tion of innovative activities in cities, the full utilisation of
their potential represents one of the main resources for
strengthening regional innovation in both convergence
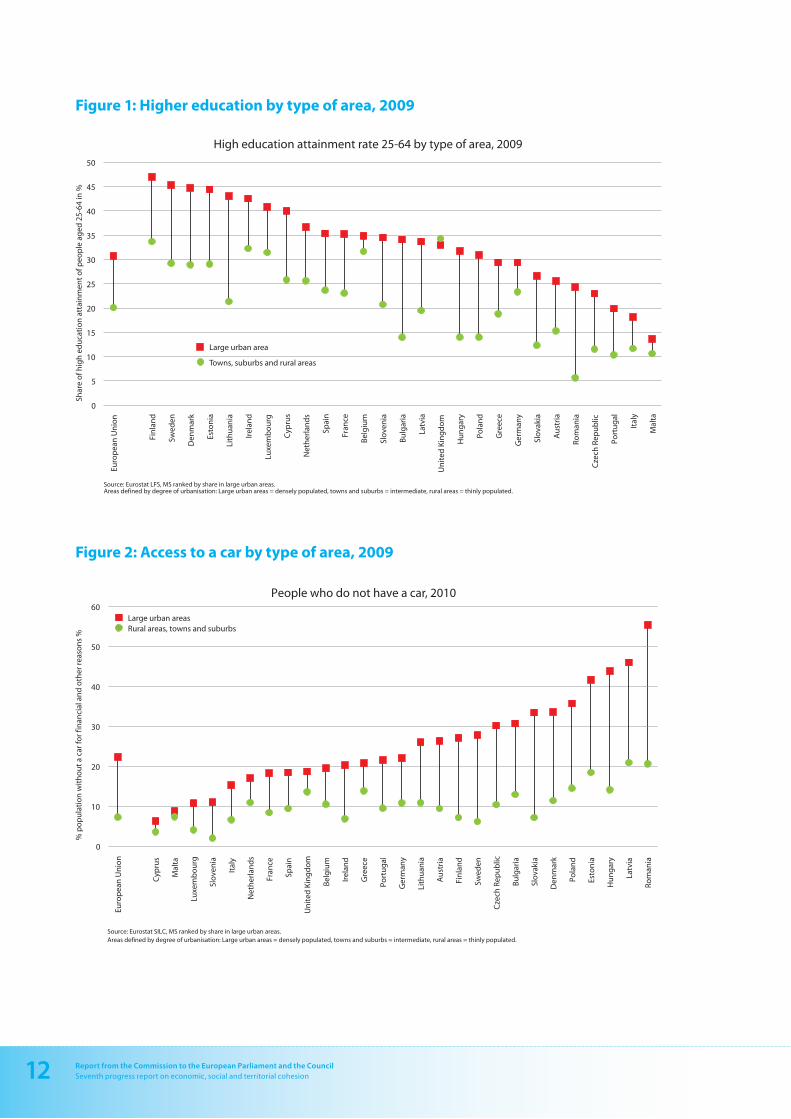
and RCE regions. In virtually all Member States, the share of
tertiary educated aged 25-64 is higher in cities than in other
areas. In 22 Member States, the share is between 10 and 25
percentage points (pp) higher in cities (see Figure 1).
The coverage and use of broadband internet tends to be
higher in urban areas (15) than in rural areas, but in countries
with high share of broadband coverage this gap has almost
disappeared. The ultra fast next generation access networks
are also expected to be rolled out in large cities first.
The innovative capacity of cities can also be demonstrated
through their productivity. Three out of four metropolitan
areas in the EU have a higher level of productivity than the
other regions in their country. But higher productivity
should not be equated with higher productivity growth.
Between 2000 and 2008, only two out of five metropolitan
areas experienced higher productivity growth than the other
regions in their country.
The comparative advantage of metro regions is strongest in
the Member States of central and eastern Europe, where
metropolitan areas often have a level of productivity more
than 50 % higher than in the rest of the country. However,
this often only applies to the capital region, while the pro-
ductivity of secondary growth poles (16) lags further behind
the capital region than in more developed Member States.
12. http://ec.europa.eu/information_society/digital-agenda/publications/index_en.htm
13. In the EU, 47 % of the population lives in urban areas or cities, 25 % in towns and suburbs and 28 % in rural areas
based on the degree of urbanisation classification.
14. Metro regions are one or more NUTS 3 regions that represent an agglomeration of more than 250 000 inhabitants.
For more detail see Regional Focus 01/2011. L. Dijkstra and H. Poelman, 2011. http://ec.europa.eu/regional_policy/information/focus/index_en.cfm
15. See Eurostat Regional Yearbook 2011, chapter 16.
16. See ESPON interim report of Secondary Growth Poles.
10 Report from the Commission to the European Parliament and the CouncilSeventh progress report on economic, social and territorial cohesion
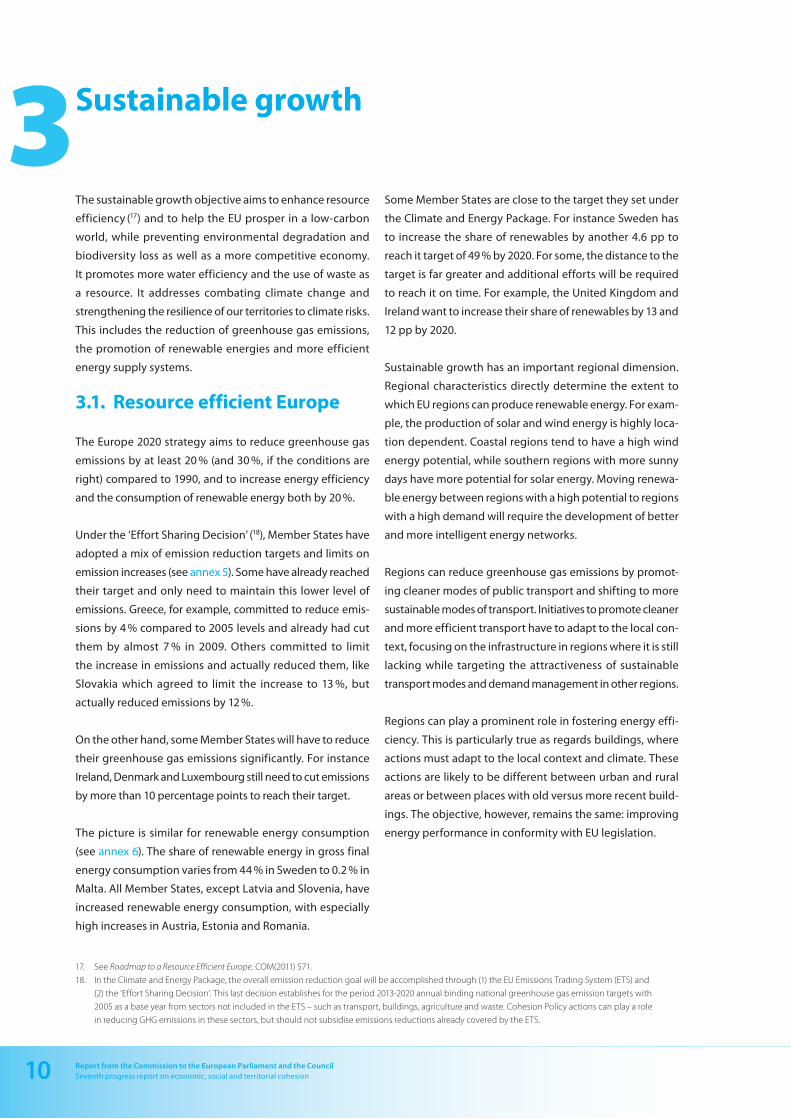
Sustainable growth
The sustainable growth objective aims to enhance resource
efficiency (17) and to help the EU prosper in a low-carbon
world, while preventing environmental degradation and
biodiversity loss as well as a more competitive economy.
It promotes more water efficiency and the use of waste as
a resource. It addresses combating climate change and
strengthening the resilience of our territories to climate risks.
This includes the reduction of greenhouse gas emissions,
the promotion of renewable energies and more efficient
energy supply systems.
3.1. Resource efficient Europe
The Europe 2020 strategy aims to reduce greenhouse gas
emissions by at least 20 % (and 30 %, if the conditions are
right) compared to 1990, and to increase energy efficiency
and the consumption of renewable energy both by 20 %.
Under the ‘Effort Sharing Decision’ (18), Member States have
adopted a mix of emission reduction targets and limits on
emission increases (see annex 5). Some have already reached
their target and only need to maintain this lower level of
emissions. Greece, for example, committed to reduce emis-
sions by 4 % compared to 2005 levels and already had cut
them by almost 7 % in 2009. Others committed to limit
the increase in emissions and actually reduced them, like
Slovakia which agreed to limit the increase to 13 %, but
actually reduced emissions by 12 %.
On the other hand, some Member States will have to reduce
their greenhouse gas emissions significantly. For instance
Ireland, Denmark and Luxembourg still need to cut emissions
by more than 10 percentage points to reach their target.
The picture is similar for renewable energy consumption
(see annex 6). The share of renewable energy in gross final
energy consumption varies from 44 % in Sweden to 0.2 % in
Malta. All Member States, except Latvia and Slovenia, have
increased renewable energy consumption, with especially
high increases in Austria, Estonia and Romania.
Some Member States are close to the target they set under
the Climate and Energy Package. For instance Sweden has
to increase the share of renewables by another 4.6 pp to
reach it target of 49 % by 2020. For some, the distance to the
target is far greater and additional efforts will be required
to reach it on time. For example, the United Kingdom and
Ireland want to increase their share of renewables by 13 and
12 pp by 2020.
Sustainable growth has an important regional dimension.
Regional characteristics directly determine the extent to
which EU regions can produce renewable energy. For exam-
ple, the production of solar and wind energy is highly loca-
tion dependent. Coastal regions tend to have a high wind
energy potential, while southern regions with more sunny
days have more potential for solar energy. Moving renewa-
ble energy between regions with a high potential to regions
with a high demand will require the development of better
and more intelligent energy networks.
Regions can reduce greenhouse gas emissions by promot-
ing cleaner modes of public transport and shifting to more
sustainable modes of transport. Initiatives to promote cleaner
and more efficient transport have to adapt to the local con-
text, focusing on the infrastructure in regions where it is still
lacking while targeting the attractiveness of sustainable
transport modes and demand management in other regions.
Regions can play a prominent role in fostering energy effi-
ciency. This is particularly true as regards buildings, where
actions must adapt to the local context and climate. These
actions are likely to be different between urban and rural
areas or between places with old versus more recent build-
ings. The objective, however, remains the same: improving
energy performance in conformity with EU legislation.
17. See Roadmap to a Resource Efficient Europe. COM(2011) 571.
18. In the Climate and Energy Package, the overall emission reduction goal will be accomplished through (1) the EU Emissions Trading System (ETS) and
(2) the ‘Effort Sharing Decision’. This last decision establishes for the period 2013-2020 annual binding national greenhouse gas emission targets with
2005 as a base year from sectors not included in the ETS – such as transport, buildings, agriculture and waste. Cohesion Policy actions can play a role
in reducing GHG emissions in these sectors, but should not subsidise emissions reductions already covered by the ETS.
3

11Report from the Commission to the European Parliament and the CouncilSeventh progress report on economic, social and territorial cohesion
19. World Energy Outlook 2008, IEA, Paris, 2008.
20. The remaining difference may be due to a higher share of energy-intensive manufacturing located in rural areas.
21. The green metropolis, D. Owen. Riverhead, 2009. and Triumph of the City, E. Glaeser. The Penguin Press, 2011.
3.2. Sustainable cities
Cities are at the forefront of the fight against climate change,
not only because they host a high share of the population
and an even higher share of economic activities, but
because working and living in cities is more resource effi-
cient. People living in cities take shorter trips to get to work
and are more likely to walk, cycle or take public transport.
In the EU, for example, households living in urban areas are
three times more likely to use only public transport, walking
or cycling for their transport needs (see Figure 2). They tend
to live in flats or townhouses which require less energy to
heat and cool. In addition, district heating systems are more
efficient in dense urban neighbourhoods.
In the EU, final energy demand per capita was 40 % higher
in rural areas than in urban areas (19). A large share of that
difference is due to the higher efficiency of cities (20). From
an energy efficiency point of view, policies that enhance the
appeal of urban living and working should be promoted.
As a high share of CO2 emissions occur in cities, the resource-
efficiency of cities should be further enhanced. It is there-
fore essential to make cities an integral part of the solution
in the fight against climate change. Policies should aim to
reduce congestion, promote non-motorized transport and
improve the energy performance of buildings (21). This would
also improve air quality, which is lower in cities, and increase
the health of city dwellers. However, care should be taken
that these measures do not lead to urban sprawl by shifting
jobs and residents to the outskirts of the city.
The Covenant of Mayors commits cities to reduce their
greenhouse gas emissions by more than 20 % by 2020 and
has been signed by more than 2500 mayors in Europe rep-
resenting over 125 million inhabitants. The Smart Cities and
Communities Initiative, which builds among others on this
covenant, will develop a more comprehensive approach to
urban challenges around energy, transport and ICT.
12 Report from the Commission to the European Parliament and the CouncilSeventh progress report on economic, social and territorial cohesion
0
5
10
15
20
25
30
35
40
45
50
Euro
pea
n U
nio
n
Fin
lan
d
Swed
en
Den
mar
k
Esto
nia
Lith
uan
ia
Irel
and
Luxe
mb
ou
rg
Cyp
rus
Net
her
lan
ds
Spai
n
Fran
ce
Bel
giu
m
Slo
ven
ia
Bu
lgar
ia
Latv
ia
Un
ited
Kin
gd
om
Hu
ng
ary
Pola
nd
Gre
ece
Ger
man
y
Slo
vaki
a
Au
stri
a
Rom
ania
Cze
ch R
epu
blic
Port
ug
al
Ital
y
Mal
ta
Shar
e o
f hig
h e
du
cati
on
att
ain
men
t o
f peo
ple
ag
ed 2
5-64
in %
High education attainment rate 25-64 by type of area, 2009
Large urban area
Towns, suburbs and rural areas
Source: Eurostat LFS, MS ranked by share in large urban areas. Areas defined by degree of urbanisation: Large urban areas = densely populated, towns and suburbs = intermediate, rural areas = thinly populated.
0
10
20
30
40
50
60
Euro
pea
n U
nio
n
Cyp
rus
Mal
ta
Luxe
mb
ou
rg
Slo
ven
ia
Ital
y
Net
her
lan
ds
Fran
ce
Spai
n
Un
ited
Kin
gd
om
Bel
giu
m
Irel
and
Gre
ece
Port
ug
al
Ger
man
y
Lith
uan
ia
Au
stri
a
Fin
lan
d
Swed
en
Cze
ch R
epu
blic
Bu
lgar
ia
Slo
vaki
a
Den
mar
k
Pola
nd
Esto
nia
Hu
ng
ary
Latv
ia
Rom
ania
% p
op
ula
tio
n w
ith
ou
t a
car f
or f
inan
cial
an
d o
ther
reas
on
s %
People who do not have a car, 2010
Large urban areas Rural areas, towns and suburbs
Source: Eurostat SILC, MS ranked by share in large urban areas. Areas defined by degree of urbanisation: Large urban areas = densely populated, towns and suburbs = intermediate, rural areas = thinly populated.
Figure 1: Higher education by type of area, 2009
Figure 2: Access to a car by type of area, 2009

13Report from the Commission to the European Parliament and the CouncilSeventh progress report on economic, social and territorial cohesion
Inclusive growth
The Europe 2020 strategy has a strong focus on employ-
ment creation, skills and labour market reform and explicitly
targets reducing poverty and exclusion. It aims to increase
employment rates and the quality of jobs, especially for
women, young people and older workers. It also wants to
better integrate migrants in the labour force. Furthermore,
it will help people anticipate and manage change by invest-
ing in skills and training and modernising labour markets and
welfare systems.
4.1. Employment
The Europe 2020 strategy aims to increase the employment
rate to 75 % for the population aged 20-64 by 2020. Member
States have set national targets varying from 62.9 % in Malta
to 80 % in Denmark and Sweden.
Not all Regions are expected to reach the EU or national
employment targets, as they face very different starting
positions. The employment rate in convergence regions in
2010 was only 63 % after a decline due to the economic crisis.
Only two convergence regions have reached the EU target
of 75 % in 2010. If the goal was to reach the 2020 target in all
convergence regions, 11 million people (22) would have to
find a job. The transition regions also have a low employ-
ment rate of 64 % and would need 3 million jobs to reach
the EU target in all these regions. The RCE regions have
a considerably higher employment rate of 72 %, but because
60 % of the EU working age population lives in these regions,
they would still need 9.4 million jobs to reach this target
in each of these regions (23).
Employment rates below 60 % can be found in regions in
southern Spain and southern Italy and some regions
in Romania and Hungary (see annex 7). Many regions
in Germany, the UK, the Netherlands, Denmark, Sweden
and Austria have already reached 75 %. To ensure that the
EU reaches 75 % by 2020, especially those countries and
regions where employment rates are currently low will have
to make significant progress but the contribution from
countries and regions already close to or above 75 % will
also be needed.
The recent crisis also led to rapid increases in unemploy-
ment rates (see annex 8). In the three Baltic States and seven
Spanish regions unemployment rates increased by between
10 and 18 pp. Unemployment increased least (1.8 pp) in the
RCE regions. The convergence regions witnessed a more
substantial increase (2.8 pp). The sharpest increase, however,
occurred in the transition regions (6.4 pp). Despite the overall
increases, unemployment decreased in 52 regions, mostly
in Germany but also in some regions in Poland, France,
Finland and Austria.
4.2. Poverty and exclusion
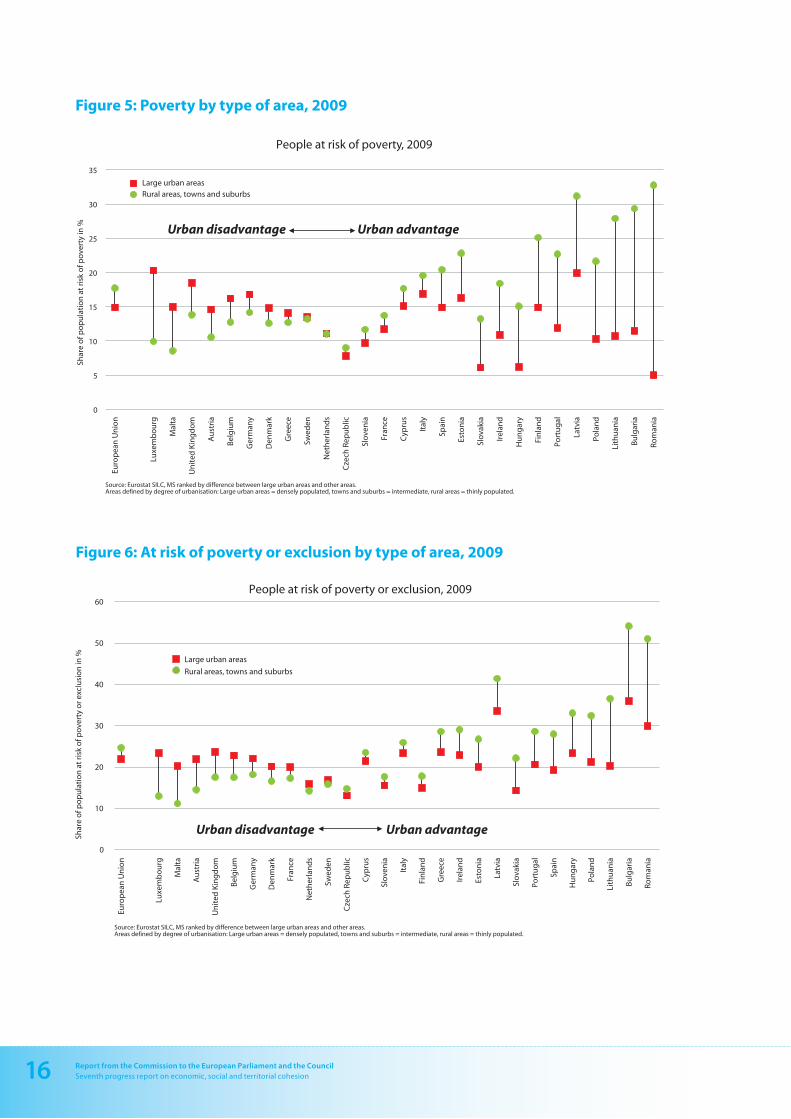
The Europe 2020 strategy aims to reduce the number of
people at risk of poverty or exclusion by 20 million by 2020,
corresponding to a reduction from 23 % of the EU popula-
tion to 19 %. The share of population at risk of poverty or
exclusion is over 50 % in three Bulgarian regions and is 49 %
in Sicily (see annex 9). The lowest rates can be found in
Åland, Trento, Navarra and Praha, where is it 10 % or lower.
The at-risk-of-poverty-or-exclusion rate is composed of
three indicators: (1) having an income below the national
poverty income threshold after social transfers (2) severe
material deprivation and (3) living in household with a low
work intensity (see annex 9 for the full definition). The first
indicator is a relative poverty indicator because it measures
the share of people with an income below 60 % of the
national median income. As a result, someone who is consid-
ered at risk of poverty in the UK would probably not be con-
sidered poor in Bulgaria with the same income. The second
indicator is an absolute measure of poverty as it measures
access to nine essential items in the same way in all Member
States. This indicator is closely correlated to the level of
development of a country. In 2009, it ranged from 32 % in
22. This shows the number of jobs required for all convergence regions to have an employment rate of 75 % or higher. The jobs required to reach 75 % in all
EU regions is 23 million. The number required to reach this target at the EU level is lower (17.6 million), as regions with employment rates above 75 % can
compensate for regions with lower rates.
23. Estimates based on current number of jobs and the Eurostat regional population forecast.
4
14 Report from the Commission to the European Parliament and the CouncilSeventh progress report on economic, social and territorial cohesion
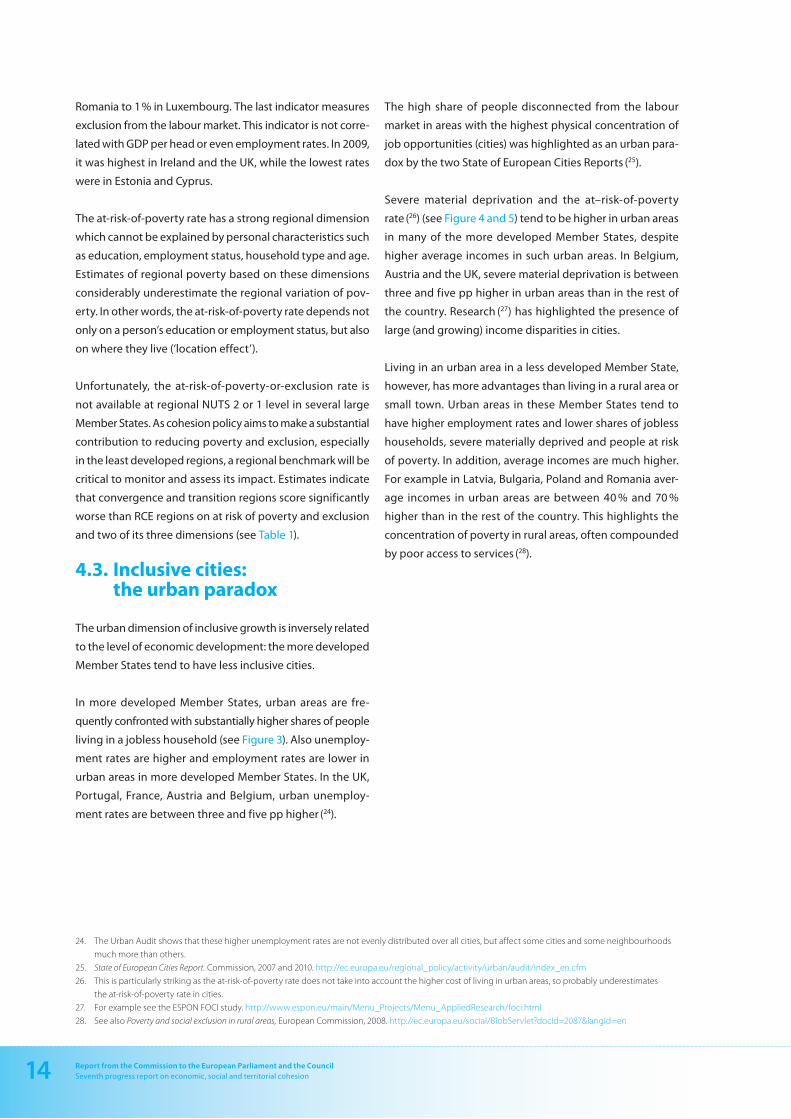
Romania to 1 % in Luxembourg. The last indicator measures
exclusion from the labour market. This indicator is not corre-
lated with GDP per head or even employment rates. In 2009,
it was highest in Ireland and the UK, while the lowest rates
were in Estonia and Cyprus.
The at-risk-of-poverty rate has a strong regional dimension
which cannot be explained by personal characteristics such
as education, employment status, household type and age.
Estimates of regional poverty based on these dimensions
considerably underestimate the regional variation of pov-
erty. In other words, the at-risk-of-poverty rate depends not
only on a person’s education or employment status, but also
on where they live (‘location effect’).
Unfortunately, the at-risk-of-poverty-or-exclusion rate is
not available at regional NUTS 2 or 1 level in several large
Member States. As cohesion policy aims to make a substantial
contribution to reducing poverty and exclusion, especially
in the least developed regions, a regional benchmark will be
critical to monitor and assess its impact. Estimates indicate
that convergence and transition regions score significantly
worse than RCE regions on at risk of poverty and exclusion
and two of its three dimensions (see Table 1).
4.3. Inclusive cities: the urban paradox
The urban dimension of inclusive growth is inversely related
to the level of economic development: the more developed
Member States tend to have less inclusive cities.
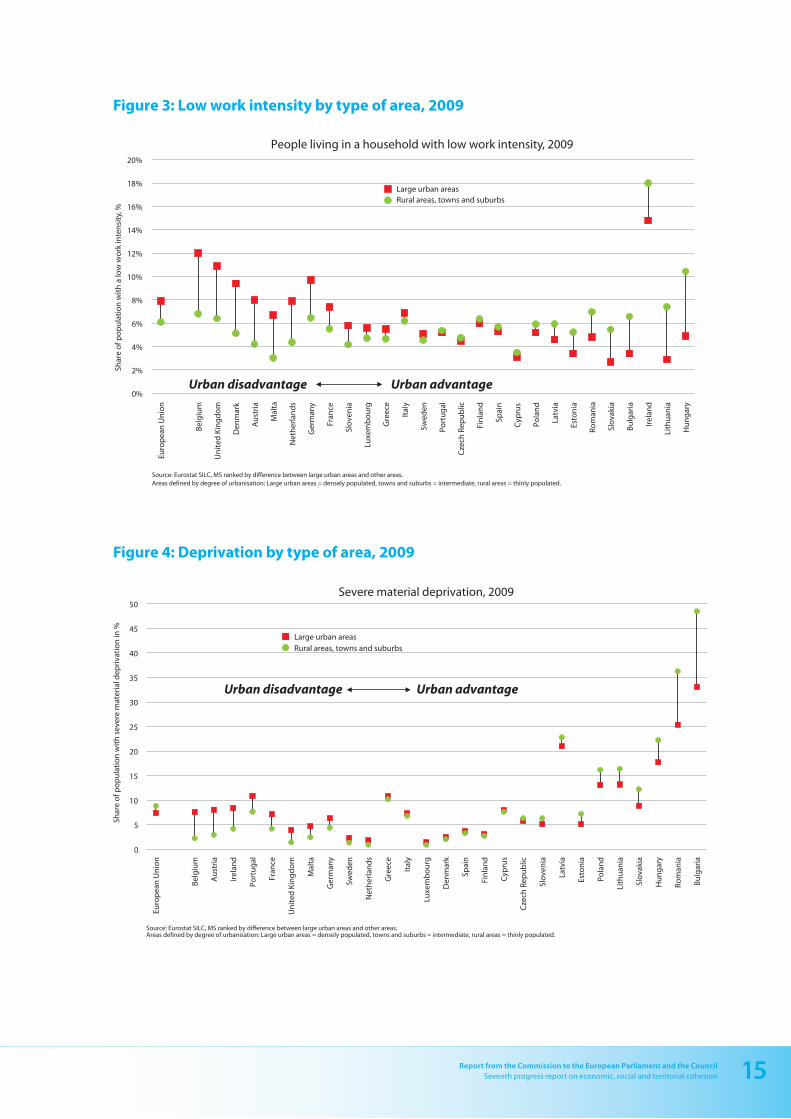
In more developed Member States, urban areas are fre-
quently confronted with substantially higher shares of people
living in a jobless household (see Figure 3). Also unemploy-
ment rates are higher and employment rates are lower in
urban areas in more developed Member States. In the UK,
Portugal, France, Austria and Belgium, urban unemploy-
ment rates are between three and five pp higher (24).
The high share of people disconnected from the labour
market in areas with the highest physical concentration of
job opportunities (cities) was highlighted as an urban para-
dox by the two State of European Cities Reports (25).
Severe material deprivation and the at–risk-of-poverty
rate (26) (see Figure 4 and 5) tend to be higher in urban areas
in many of the more developed Member States, despite
higher average incomes in such urban areas. In Belgium,
Austria and the UK, severe material deprivation is between
three and five pp higher in urban areas than in the rest of
the country. Research (27) has highlighted the presence of
large (and growing) income disparities in cities.
Living in an urban area in a less developed Member State,
however, has more advantages than living in a rural area or
small town. Urban areas in these Member States tend to
have higher employment rates and lower shares of jobless
households, severe materially deprived and people at risk
of poverty. In addition, average incomes are much higher.
For example in Latvia, Bulgaria, Poland and Romania aver-
age incomes in urban areas are between 40 % and 70 %
higher than in the rest of the country. This highlights the
concentration of poverty in rural areas, often compounded
by poor access to services (28).
24. The Urban Audit shows that these higher unemployment rates are not evenly distributed over all cities, but affect some cities and some neighbourhoods
much more than others.
25. State of European Cities Report. Commission, 2007 and 2010. http://ec.europa.eu/regional_policy/activity/urban/audit/index_en.cfm
26. This is particularly striking as the at-risk-of-poverty rate does not take into account the higher cost of living in urban areas, so probably underestimates
the at-risk-of-poverty rate in cities.
27. For example see the ESPON FOCI study. http://www.espon.eu/main/Menu_Projects/Menu_AppliedResearch/foci.html
28. See also Poverty and social exclusion in rural areas, European Commission, 2008. http://ec.europa.eu/social/BlobServlet?docId=2087&langId=en
15Report from the Commission to the European Parliament and the CouncilSeventh progress report on economic, social and territorial cohesion
0%
2%
4%
6%
8%
10%
12%
14%
16%
18%
20% Eu
rop
ean
Un
ion
Bel
giu
m
Un
ited
Kin
gd
om
Den
mar
k
Au
stri
a
Mal
ta
Net
her
lan
ds
Ger
man
y
Fran
ce
Slo
ven
ia
Luxe
mb
ou
rg
Gre
ece
Ital
y
Swed
en
Port
ug
al
Cze
ch R
epu
blic
Fin
lan
d
Spai
n
Cyp
rus
Pola
nd
Latv
ia
Esto
nia
Rom
ania
Slo
vaki
a
Bu
lgar
ia
Irel
and
Lith
uan
ia
Hu
ng
ary
Shar
e o
f po
pu
lati
on
wit
h a
low
wo
rk in
ten
sity
, %
People living in a household with low work intensity, 2009
Large urban areas Rural areas, towns and suburbs
Source: Eurostat SILC, MS ranked by difference between large urban areas and other areas. Areas defined by degree of urbanisation: Large urban areas = densely populated, towns and suburbs = intermediate, rural areas = thinly populated.
Urban disadvantage Urban advantage
0
5
10
15
20
25
30
35
40
45
50
Euro
pea
n U
nio
n
Bel
giu
m
Au
stri
a
Irel
and
Port
ug
al
Fran
ce
Un
ited
Kin
gd
om
Mal
ta
Ger
man
y
Swed
en
Net
her
lan
ds
Gre
ece
Ital
y
Luxe
mb
ou
rg
Den
mar
k
Spai
n
Fin
lan
d
Cyp
rus
Cze
ch R
epu
blic
Slo
ven
ia
Latv
ia
Esto
nia
Pola
nd
Lith
uan
ia
Slo
vaki
a
Hu
ng
ary
Rom
ania
Bu
lgar
ia
Shar
e o
f po
pu
lati
on
wit
h s
ever
e m
ater
ial d
epri
vati
on
in %
Severe material deprivation, 2009
Large urban areas Rural areas, towns and suburbs
Source: Eurostat SILC, MS ranked by difference between large urban areas and other areas. Areas defined by degree of urbanisation: Large urban areas = densely populated, towns and suburbs = intermediate, rural areas = thinly populated.
Urban disadvantage Urban advantage
Figure 3: Low work intensity by type of area, 2009
Figure 4: Deprivation by type of area, 2009
16 Report from the Commission to the European Parliament and the CouncilSeventh progress report on economic, social and territorial cohesion
0
5
10
15
20
25
30
35
Euro
pea
n U
nio
n
Luxe
mb
ou
rg
Mal
ta
Un
ited
Kin
gd
om
Au
stri
a
Bel
giu
m
Ger
man
y
Den
mar
k
Gre
ece
Swed
en
Net
her
lan
ds
Cze
ch R
epu
blic
Slo
ven
ia
Fran
ce
Cyp
rus
Ital
y
Spai
n
Esto
nia
Slo
vaki
a
Irel
and
Hu
ng
ary
Fin
lan
d
Port
ug
al
Latv
ia
Pola
nd
Lith
uan
ia
Bu
lgar
ia
Rom
ania
Shar
e o
f po
pu
lati
on
at
risk
of p
ove
rty
in %
People at risk of poverty, 2009
Large urban areas Rural areas, towns and suburbs
Source: Eurostat SILC, MS ranked by difference between large urban areas and other areas. Areas defined by degree of urbanisation: Large urban areas = densely populated, towns and suburbs = intermediate, rural areas = thinly populated.
Urban disadvantage Urban advantage
0
10
20
30
40
50
60
Euro
pea
n U
nio
n
Luxe
mb
ou
rg
Mal
ta
Au
stri
a
Un
ited
Kin
gd
om
Bel
giu
m
Ger
man
y
Den
mar
k
Fran
ce
Net
her
lan
ds
Swed
en
Cze
ch R
epu
blic
Cyp
rus
Slo
ven
ia
Ital
y
Fin
lan
d
Gre
ece
Irel
and
Esto
nia
Latv
ia
Slo
vaki
a
Port
ug
al
Spai
n
Hu
ng
ary
Pola
nd
Lith
uan
ia
Bu
lgar
ia
Rom
ania
Shar
e o
f po
pu
lati
on
at
risk
of p
ove
rty
or e
xclu
sio
n in
%
People at risk of poverty or exclusion, 2009
Large urban areas
Rural areas, towns and suburbs
Source: Eurostat SILC, MS ranked by difference between large urban areas and other areas. Areas defined by degree of urbanisation: Large urban areas = densely populated, towns and suburbs = intermediate, rural areas = thinly populated.
Urban disadvantage Urban advantage
Figure 5: Poverty by type of area, 2009
Figure 6: At risk of poverty or exclusion by type of area, 2009
17Report from the Commission to the European Parliament and the CouncilSeventh progress report on economic, social and territorial cohesion
Conclusion
This report has highlighted the regional and urban dimen-
sion of the Europe 2020 strategy. It shows that significant
efforts and investments are needed in all Europe’s regions
to achieve the smart, sustainable and inclusive growth
objectives. It argues that those needs differ between
regions and between cities and that policies should take
these needs into account.
Given cohesion policy’s key role in Europe 2020, particular
attention needs to be paid to the convergence regions,
but improvements are also necessary in the transition and
RCE regions.
The convergence regions score poorly on the smart growth
front with low levels of R&D, low shares of higher educated
and low productivity. Many also display low levels of employ-
ment and high unemployment levels. The risk of poverty
and exclusion is also higher in the convergence regions.
Although transition regions and RCE regions score better on
these issues, they also need to improve their performance
to reach the Europe 2020 targets. The crisis has reduced
employment in RCE regions and revealed a lack of competi-
tiveness in some of them. Unemployment has risen in more
than 100 RCE regions and 36 have an unemployment rate
above the EU average.
The challenge of sustainable growth is present in all regions.
The energy efficiency of existing and new buildings has to
increase everywhere. Increasing renewable energy will
require more investment in efficient locations and in the
network connecting supply with demand.
When designing regional growth strategies, cities should
play an active role. Cities are uniquely placed to promote
innovation by offering firms of all sizes the dynamic envi-
ronments they need to succeed. They are at the forefront in
the fight against climate change, creating new models of
urban development with even higher resource efficiency.
Last but not least, cities have a disproportionate share of
social problems and poverty. As the Europe 2020 targets
aims to increase employment and reduce poverty and
exclusion, cities need to address urban deprivation and
the disconnection from the labour market, especially in the
EU-15.
This report provides an important input as strategies for the
future 2014-2020 cohesion policy programmes are being
prepared. In essence, it sets out the baseline situation to be
addressed in relation to the EU2020 targets and the distance
to the national targets. Future cohesion policy programme
must articulate how they will contribute to this catching up
process in concrete terms. How will the investment pro-
grammes contribute to change in these indicators? Are
there intermediate steps or indicators which can capture
positive progress? Cohesion policy programmes provide an
opportunity to design strategies in an integrated way –
focused on the specific needs of each territory – and reflect-
ing the trade-offs and synergies between different types of
investments.
5

18 Report from the Commission to the European Parliament and the CouncilSeventh progress report on economic, social and territorial cohesion
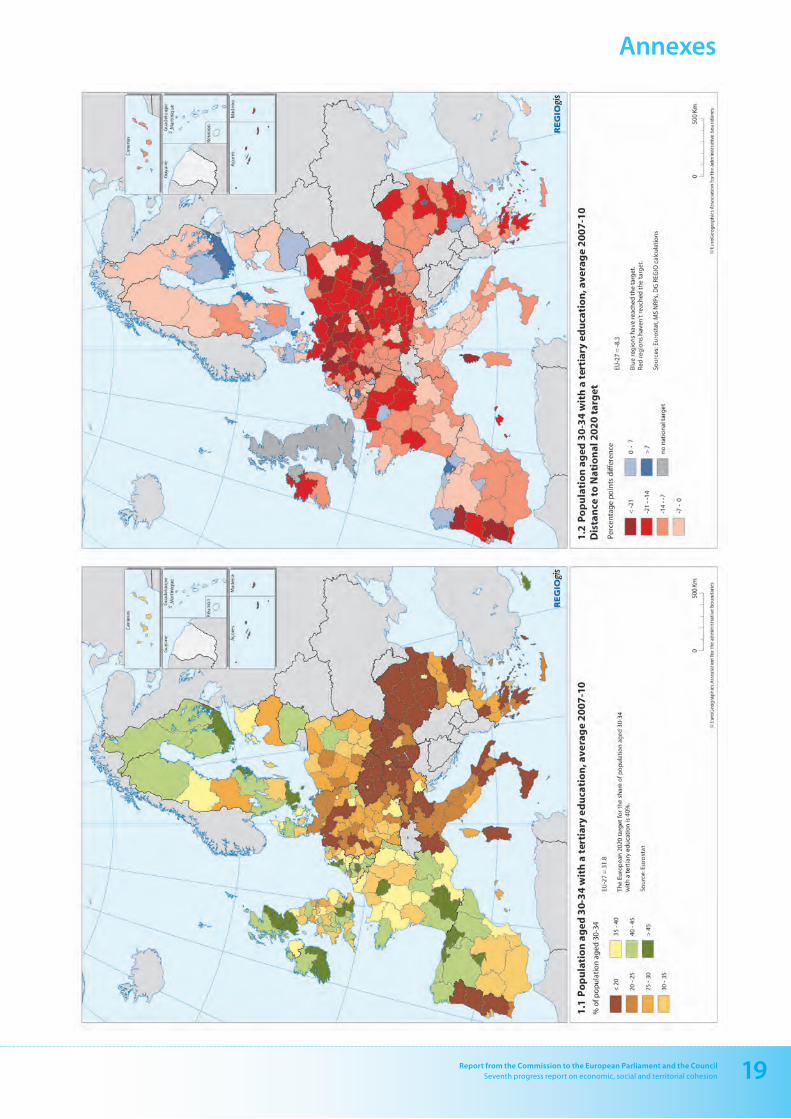
This indicator shows the proportion of population aged
30-34 with tertiary education to the total population 30-34
of the same age group.
Why does this matter?
Educational attainment of the population is one of the most
important factors of economic growth. People with tertiary
education are more likely to get a job, have a higher income
and have higher life expectancy. Increasing employment
rate of tertiary educated people is also likely to have posi-
tive effects on productivity. Most of the increase in the share
of the tertiary-educated working-age population comes
from those under 35. Therefore, the Europe 2020 strategy
has set the target for the share of population aged 30-34 with
tertiary education at 40 %. The EU share in 2010 was 34 %.
The national 2020 targets range between 60 % (Ireland) and
26 % (Italy).
How do the EU regions score?
As well as in the case of other educational attainment indi-
cators, the share of tertiary educated aged 30-34 varies
widely in Europe. Considering the average levels for the
years 2007-2010, one region in five has reached the EU 2020
target. The top ten regions have shares significantly above
the EU 2020 targets and are mostly capital regions or adjoin
capital regions. The bottom ten are located in the Czech
Republic, Romania, Portugal and Italy (see map 1.1). Other
regions lagging behind the European target are located in
Greece, Bulgaria, Hungary, Slovakia and Germany.
The distance to the national target is particularly significant
for Açores and for some regions located in Slovakia, the
Czech Republic, Poland and Germany. Overall, only 25 regions
across Europe have reached the national target in the 2007-
2010 average, mainly in capital regions, in northern Spain and
in south Finland and Sweden (see map 1.2).
This table shows the ten regions with the highest share of population aged 30-34 with tertiary education – Average 2007-2010
MS Region tertiaryeducation%
ES País Vasco 60
UK Inner London 59
DK Hovedstaden 56
BE Prov. Brabant Wallon 56
BE Prov. Vlaams-Brabant 55
FR Île de France 52
SE Stockholm 51
NL Utrecht 51
UK North Eastern Scotland 51
ES Comunidad de Madrid 49
This table shows the ten regions that are most distant from their national 2020 tertiary education target in percentage points
MS Region distancetonationaltarget,inpp
PT Região Autónoma dos Açores -29
SK Západné Slovensko -26
SK Východné Slovensko -25
CZ Severozápad -24
PL Kujawsko-Pomorskie -24
DE Lüneburg -23
PT Alentejo -23
FR Corse -23
DE Sachsen-Anhalt -23
PL Opolskie -23
1. Population aged 30-34 with tertiary education, 2007-2010
1919Report from the Commission to the European Parliament and the CouncilSeventh progress report on economic, social and territorial cohesion
Annexes

20 Report from the Commission to the European Parliament and the CouncilSeventh progress report on economic, social and territorial cohesion
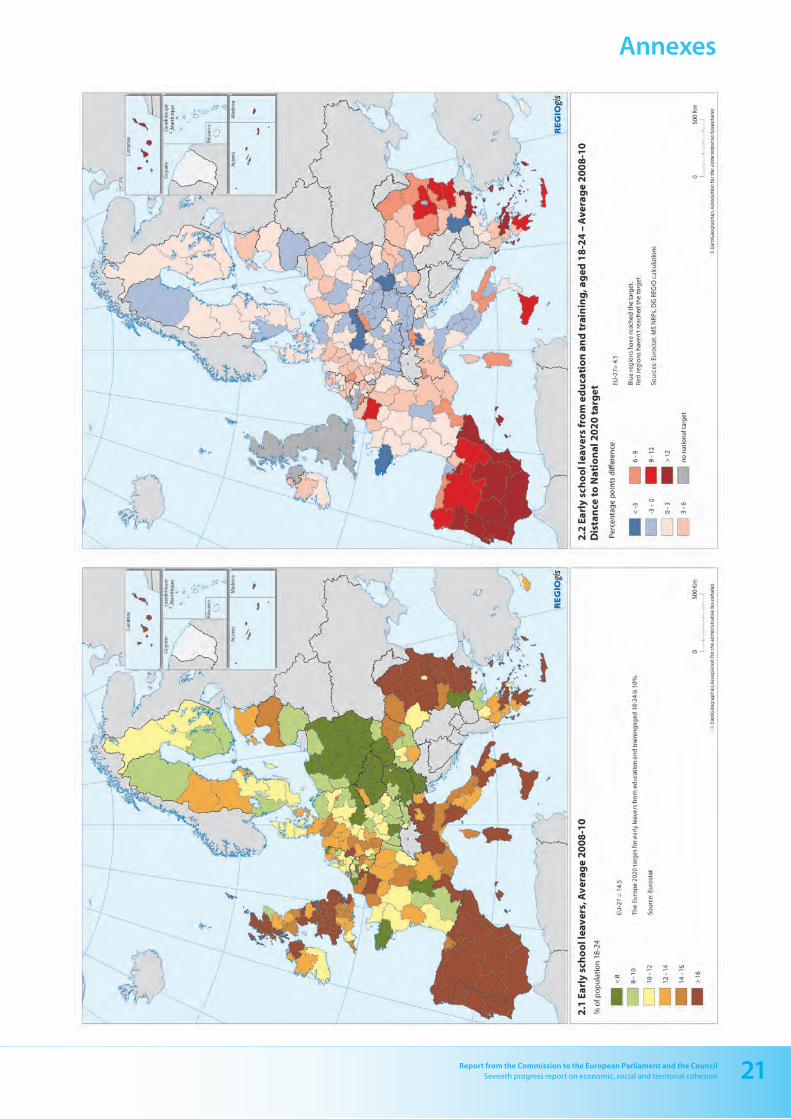
2. Early leavers from education and training, 2008-2010The share of early leavers from education and training meas-
ures the number of people aged 18-24 with at most lower
secondary education and not attending any further education
or training, divided by the total population aged 18-24.
Why does this matter?
The reduction of early school leavers and the increase of
educational attainment of the population are key targets of
Europe 2020. These two strategies can provide vital support
to Europe’s employment and growth objectives. Education
contributes to productivity of an individual and can lead
to increases in employment, personal income and ones’
overall life satisfaction. People without a complete second-
ary education are much more likely to be unemployed.
The Europe 2020 target is to reduce the early leaving from
education and training below 10 % by 2020, while the 2008-
2010 average is 14.5 %. National targets for this strategy
range between 4.5 % (Poland) and 29 % (Malta).
How do the EU regions score?
Regional differences in early school leaving are high.
Considering a three year average (2008-2010), the Europe
2020 target has been reached in 74 NUTS 2 regions, around
one in four, requiring then a substantial effort in many
regions to be achieved. Overall, the regions with the high-
est shares of early school leavers (above 30 %) are located in
Spain and Portugal. Also Malta is in the top ten regions in
this indicator. Regions with high shares (between 20 % and
30 %) are also located in Greece, Italy, Bulgaria, Romania and
United Kingdom (see map 2.1). In contrast, the lowest rates
of early leavers from education and train ing are registered
in particular in Slovakia, the Czech Republic and Poland.
The distance to the national target is significant in regions
of Spain and Portugal, as well as in Greece, Bulgaria and
Southern Italy. Instead, several regions of Austria, Germany,
Italy, the Czech Republic and Slovakia have already reached
the national target (see map 2.2).
This table shows the ten regions with the lowest share of early leavers from education and training aged 18-24 – Average 2008-2010
MS Region %ofearlyschoolleavers
SK Bratislavský kraj 2
CZ Jihovýchod 3
CZ Praha 3
SK Západné Slovensko 3
PL Małopolskie 3
PL Podkarpackie 4
CZ Střední Morava 4
PL Świętokrzyskie 4
PL Podlaskie 4
PL Wielkopolskie 4
This table shows the ten regions that are most distant from their national 2020 early school leavers target in percentage points
MS Region distancetonationaltarget,inpp
PT Região Autónoma dos Açores 39
PT Região Autónoma da Madeira 31
ES Ciudad Autónoma de Ceuta 26
PT Norte 25
ES Illes Balears 25
PT Algarve 23
ES Región de Murcia 23
ES Ciudad Autónoma de Melilla 23
ES Andalucía 22
ES Castilla-La Mancha 20
2121Report from the Commission to the European Parliament and the CouncilSeventh progress report on economic, social and territorial cohesion
Annexes
22 Report from the Commission to the European Parliament and the CouncilSeventh progress report on economic, social and territorial cohesion
3. General expenditure on R&D (GERD), 2008
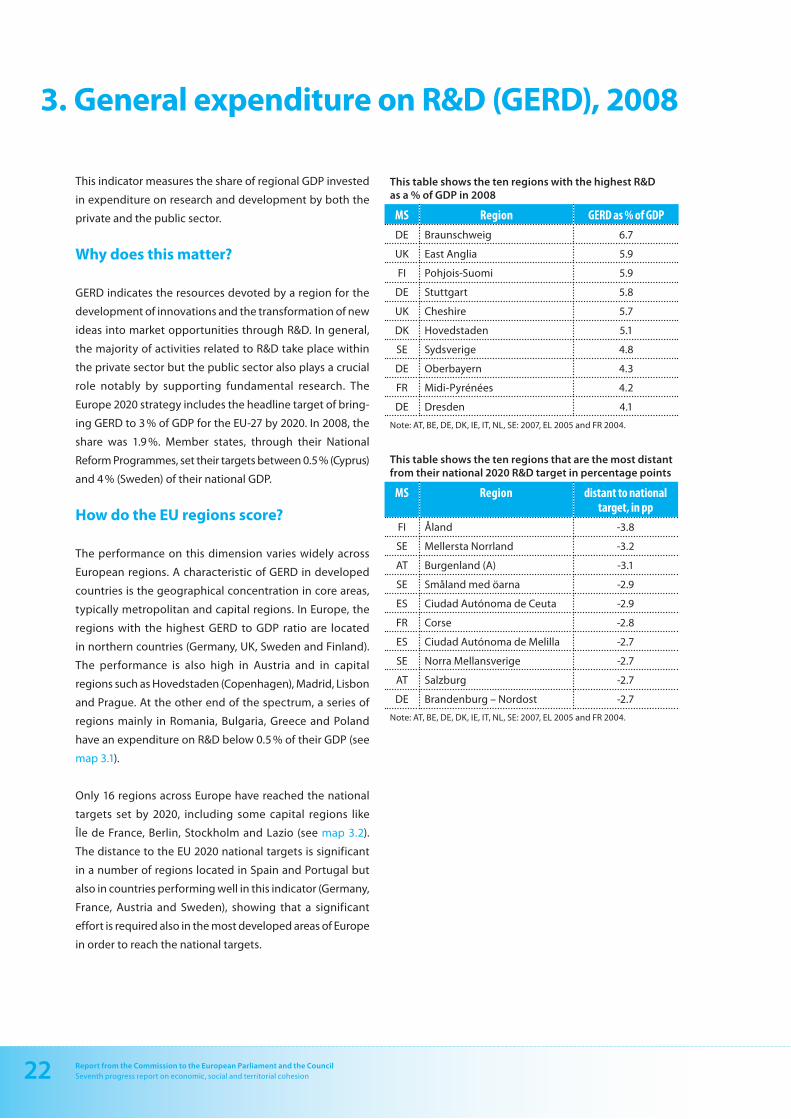
This indicator measures the share of regional GDP invested
in expenditure on research and development by both the
private and the public sector.
Why does this matter?
GERD indicates the resources devoted by a region for the
development of innovations and the transformation of new
ideas into market opportunities through R&D. In general,
the majority of activities related to R&D take place within
the private sector but the public sector also plays a crucial
role notably by supporting fundamental research. The
Europe 2020 strategy includes the headline target of bring-
ing GERD to 3 % of GDP for the EU-27 by 2020. In 2008, the
share was 1.9 %. Member states, through their National
Reform Programmes, set their targets between 0.5 % (Cyprus)
and 4 % (Sweden) of their national GDP.
How do the EU regions score?
The performance on this dimension varies widely across
European regions. A characteristic of GERD in developed
countries is the geographical concentration in core areas,
typically metropolitan and capital regions. In Europe, the
regions with the highest GERD to GDP ratio are located
in northern countries (Germany, UK, Sweden and Finland).
The performance is also high in Austria and in capital
regions such as Hovedstaden (Copenhagen), Madrid, Lisbon
and Prague. At the other end of the spectrum, a series of
regions mainly in Romania, Bulgaria, Greece and Poland
have an expenditure on R&D below 0.5 % of their GDP (see
map 3.1).
Only 16 regions across Europe have reached the national
targets set by 2020, including some capital regions like
Île de France, Berlin, Stockholm and Lazio (see map 3.2).
The distance to the EU 2020 national targets is significant
in a number of regions located in Spain and Portugal but
also in countries performing well in this indicator (Germany,
France, Austria and Sweden), showing that a significant
effort is required also in the most developed areas of Europe
in order to reach the national targets.
This table shows the ten regions with the highest R&D as a % of GDP in 2008
MS Region GERDas%ofGDP
DE Braunschweig 6.7
UK East Anglia 5.9
FI Pohjois-Suomi 5.9
DE Stuttgart 5.8
UK Cheshire 5.7
DK Hovedstaden 5.1
SE Sydsverige 4.8
DE Oberbayern 4.3
FR Midi-Pyrénées 4.2
DE Dresden 4.1
Note: AT, BE, DE, DK, IE, IT, NL, SE: 2007, EL 2005 and FR 2004.
This table shows the ten regions that are the most distant from their national 2020 R&D target in percentage points
MS Region distanttonationaltarget,inpp
FI Åland -3.8
SE Mellersta Norrland -3.2
AT Burgenland (A) -3.1
SE Småland med öarna -2.9
ES Ciudad Autónoma de Ceuta -2.9
FR Corse -2.8
ES Ciudad Autónoma de Melilla -2.7
SE Norra Mellansverige -2.7
AT Salzburg -2.7
DE Brandenburg – Nordost -2.7
Note: AT, BE, DE, DK, IE, IT, NL, SE: 2007, EL 2005 and FR 2004.

2323Report from the Commission to the European Parliament and the CouncilSeventh progress report on economic, social and territorial cohesion
Annexes
24 Report from the Commission to the European Parliament and the CouncilSeventh progress report on economic, social and territorial cohesion
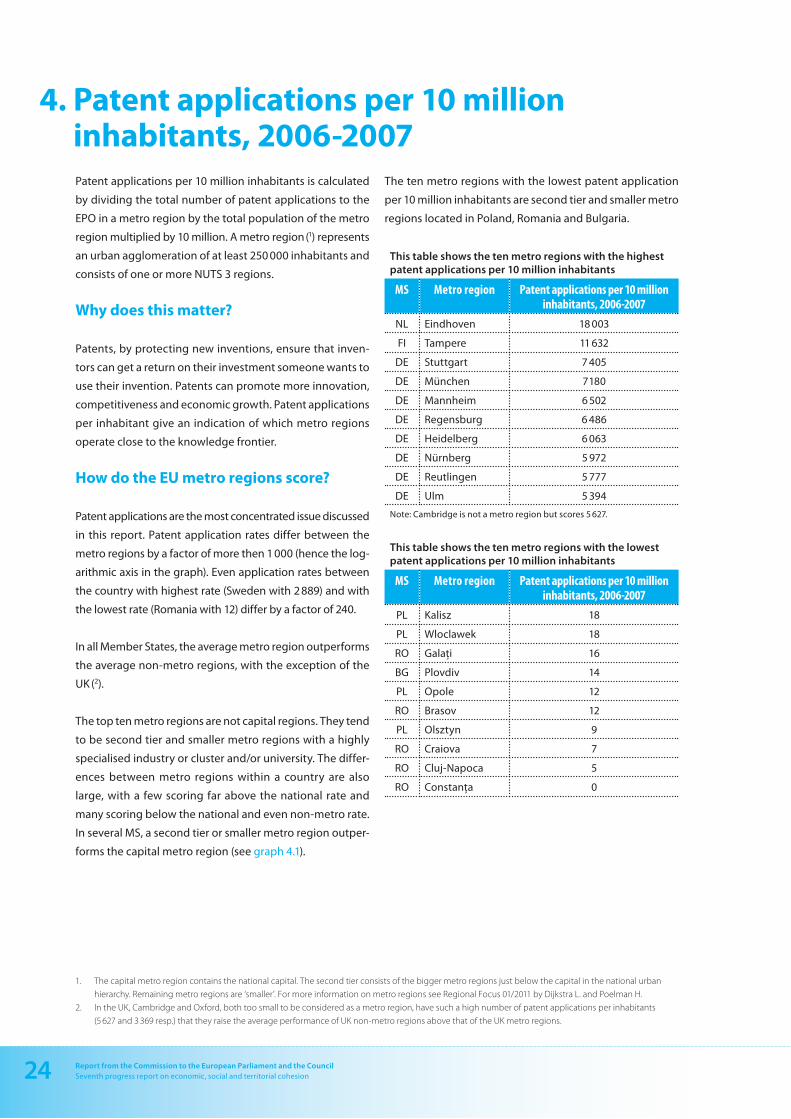
4. Patent applications per 10 million inhabitants, 2006-2007Patent applications per 10 million inhabitants is calculated
by dividing the total number of patent applications to the
EPO in a metro region by the total population of the metro
region multiplied by 10 million. A metro region (1) represents
an urban agglomeration of at least 250 000 inhabitants and
consists of one or more NUTS 3 regions.
Why does this matter?
Patents, by protecting new inventions, ensure that inven-
tors can get a return on their investment someone wants to
use their invention. Patents can promote more innovation,
competitiveness and economic growth. Patent applications
per inhabitant give an indication of which metro regions
operate close to the knowledge frontier.
How do the EU metro regions score?
Patent applications are the most concentrated issue discussed
in this report. Patent application rates differ between the
metro regions by a factor of more then 1 000 (hence the log-
arithmic axis in the graph). Even application rates between
the country with highest rate (Sweden with 2 889) and with
the lowest rate (Romania with 12) differ by a factor of 240.
In all Member States, the average metro region outperforms
the average non-metro regions, with the exception of the
UK (2).
The top ten metro regions are not capital regions. They tend
to be second tier and smaller metro regions with a highly
specialised industry or cluster and/or university. The differ-
ences between metro regions within a country are also
large, with a few scoring far above the national rate and
many scoring below the national and even non-metro rate.
In several MS, a second tier or smaller metro region outper-
forms the capital metro region (see graph 4.1).
The ten metro regions with the lowest patent application
per 10 million inhabitants are second tier and smaller metro
regions located in Poland, Romania and Bulgaria.
This table shows the ten metro regions with the highest patent applications per 10 million inhabitants
MS Metroregion Patentapplicationsper10millioninhabitants,2006-2007
NL Eindhoven 18 003
FI Tampere 11 632
DE Stuttgart 7 405
DE München 7 180
DE Mannheim 6 502
DE Regensburg 6 486
DE Heidelberg 6 063
DE Nürnberg 5 972
DE Reutlingen 5 777
DE Ulm 5 394
Note: Cambridge is not a metro region but scores 5 627.
This table shows the ten metro regions with the lowest patent applications per 10 million inhabitants
MS Metroregion Patentapplicationsper10millioninhabitants,2006-2007
PL Kalisz 18
PL Wloclawek 18
RO Galaţi 16
BG Plovdiv 14
PL Opole 12
RO Brasov 12
PL Olsztyn 9
RO Craiova 7
RO Cluj-Napoca 5
RO Constanţa 0
1. The capital metro region contains the national capital. The second tier consists of the bigger metro regions just below the capital in the national urban
hierarchy. Remaining metro regions are ‘smaller’. For more information on metro regions see Regional Focus 01/2011 by Dijkstra L. and Poelman H.
2. In the UK, Cambridge and Oxford, both too small to be considered as a metro region, have such a high number of patent applications per inhabitants
(5 627 and 3 369 resp.) that they raise the average performance of UK non-metro regions above that of the UK metro regions.

2525Report from the Commission to the European Parliament and the CouncilSeventh progress report on economic, social and territorial cohesion
Annexes
RO
BG
LT
PL
SK LV
EL P
T C
Z H
U EE
ES
SI
IE
IT
UK
FR
BE
AT
NL
DK
FI
DE
SE
1
10
100
1.00
0
10.0
00
100.
000
Patent applications per ten millions inhabitants, logarithmic scale
4.1
Pat
ent
app
licat
ion
s to
th
e EP
O, a
vera
ge
20
06
-20
07
Cap
ital
met
ro re
gio
n
Seco
nd
tie
r met
ro re
gio
n
Smal
ler m
etro
reg
ion
No
n-m
etro
reg
ion
s co
mb
ined
Nat
ion
al
Sou
rce:
Euro
stat

26 Report from the Commission to the European Parliament and the CouncilSeventh progress report on economic, social and territorial cohesion
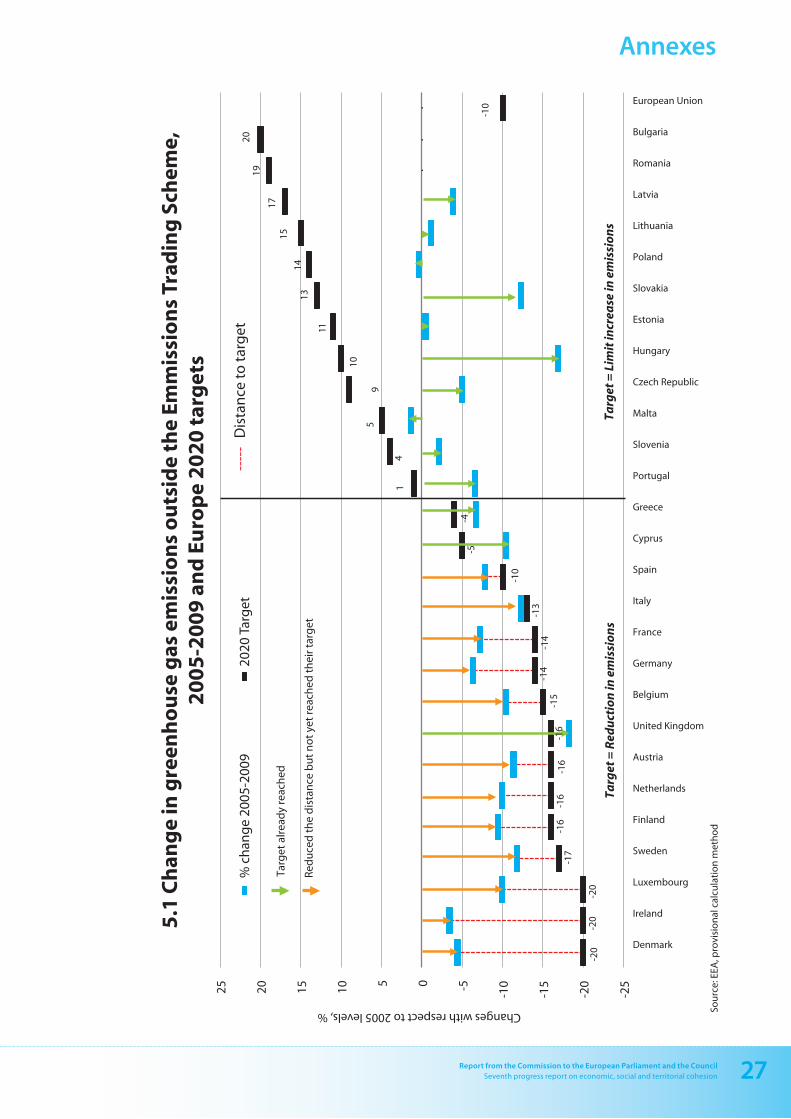
5. Green House Gas emissions 2005-2009
Change in GHG emissions outside the Emissions Trading
Scheme and distance to national 2020 targets (national).
Why does this matter?
This indicator shows trends in total man-made emissions of
greenhouse gases by sectors included in the so-called ‘Effort
Sharing Decision’. The EU as a whole is committed to achiev-
ing at least a 20 % reduction of its greenhouse gas emissions
by 2020 compared to 1990. This objective implies a 21 %
reduction in emissions from sectors covered by the EU emis-
sion trading scheme (ETS) compared to 2005 by 2020; and
a reduction of 10 % in emissions for sectors outside the
EU ETS. To achieve this 10 % overall target each Member
State has agreed country-specific greenhouse gas emission
reduction or limits for 2020 compared to 2005 from sectors
included in the ‘Effort Sharing Decision’: transport, buildings,
agriculture and waste.
This table shows the five countries with the highest GHG emissions reduction outside ETS in 2009
MS ChangeinGHGemissions,2005-2009(%)
UK -18.2
HU -16.9
SK -12.3
IT -12.2
SE -11.8
How do the EU Member States score?
The reduction of GHG emissions in sectors included in the
Effort Sharing Mechanism has been very high is some
Member States. In the United-Kingdom emissions were
reduced by 18.2 % while in Hungary, they fell by almost
17 %. For most new Member States, the decrease is more
modest which reflects the very high level of economic
growth these countries have experienced. Emissions even
increased in some countries, like for instance in Malta (+1.4 %)
or Poland (+0.3 %).
The distance to the target to which Member States have com-
mitted also strongly varies from one country to the other.
A number of countries are way ahead of their target, like for
instance Hungary and Slovakia which commit to limit their
emissions to no more than 10 % and 13 % respectively and
where emissions actually decreased significantly.
This table shows the five countries that are most distant to their national target in 2009
MS Distancetotarget,percentagepoint
IE 16.6
DK 15.6
LU 10.1
DE 7.7
FR 6.8
In other countries, the target for emission reduction is not
yet reached but the emissions have started to reduce, like
for instance in Sweden where the target was set to a reduc-
tion of 17 % and emissions decreased by 11.8 % compared
to levels of 2005. Among the Member States which have not
reached their target, the distance to target is the highest in
Ireland, Denmark and Luxemburg. It is the lowest in Italy,
Spain and Belgium where additional reduction of 0.7 %,
2.2 % and 4.5 % are required to meet the objectives.
The share of GHG emissions outside ETS was based on data
on the total emissions and emissions within ETS from the
European Environmental Agency.
2727Report from the Commission to the European Parliament and the CouncilSeventh progress report on economic, social and territorial cohesion
Annexes
-20
-20
-20
-17
-16
-16
-16
-15
-14
-14
-13
-10
-5
-4
1 4
5 9
10
11
13
14
15
17
19
20
-10
-25
-20
-15
-10 -5
0 5
10
15
20
25
Denmark
Ireland
Luxembourg
Sweden
Finland
Netherlands
Austria
United Kingdom
Belgium
Germany
France
Italy
Spain
Cyprus
Greece
Portugal
Slovenia
Malta
Czech Republic
Hungary
Estonia
Slovakia
Poland
Lithuania
Latvia
Romania
Bulgaria
European Union Changes with respect to 2005 levels, %
5.1
Ch
ang
e in
gre
enh
ou
se g
as e
mis
sio
ns
ou
tsid
e th
e Em
mis
sio
ns
Trad
ing
Sch
eme,
2
00
5-2
00
9 a
nd
Eu
rop
e 2
02
0 t
arg
ets
% c
han
ge
2005
-200
9
202
0 Ta
rget
--
---
Dis
tan
ce t
o t
arg
et
Sou
rce:
EEA
, pro
visi
on
al c
alcu
lati
on
met
ho
d
Targ
et a
lrea
dy
reac
hed
Red
uce
d t
he
dis
tan
ce b
ut
no
t ye
t re
ach
ed t
hei
r tar
get
-16
Targ
et =
Red
uct
ion
in e
mis
sio
ns
Targ
et =
Lim
it in
crea
se in
em
issi
on
s

28 Report from the Commission to the European Parliament and the CouncilSeventh progress report on economic, social and territorial cohesion
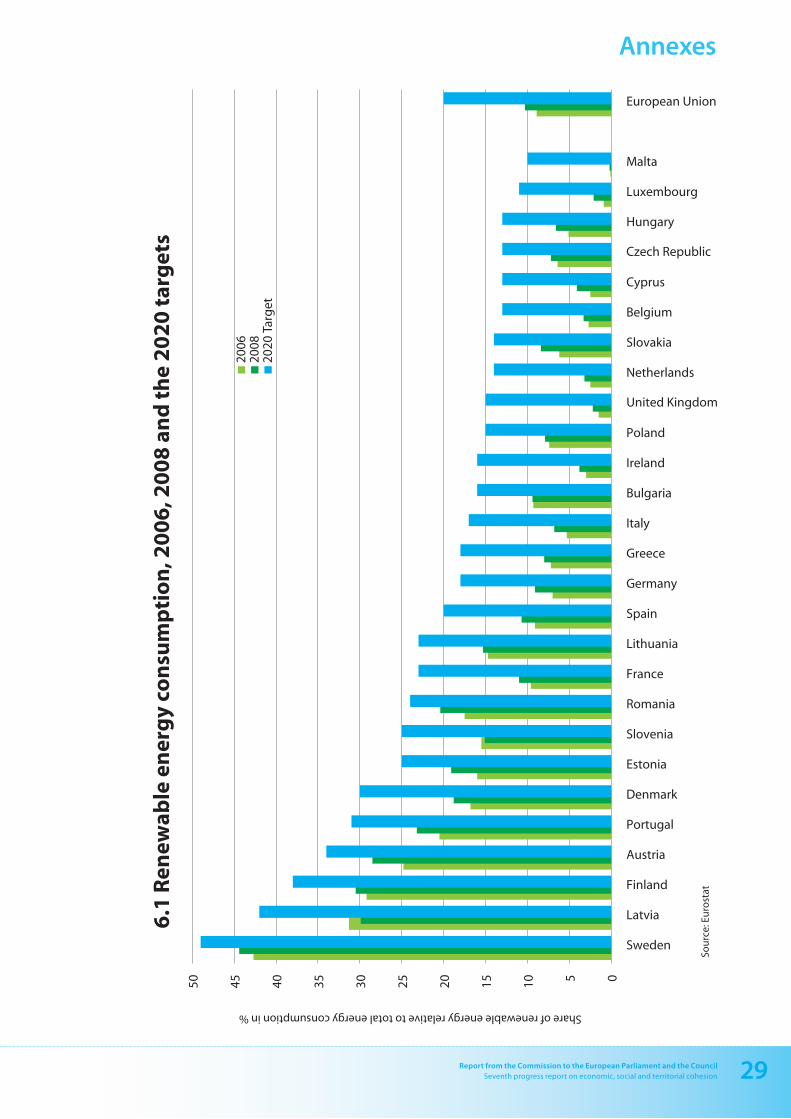
6. Renewable energy 2008
Consumption of renewable energy and distance to national
2020 targets (national).
Why does this matter?
This indicator shows the share of renewable energy in
gross final energy consumption of Member States. Sources
of renewable energy are wind power, solar power (thermal,
photovoltaic and concentrated), hydro-electric power, tidal
power, geothermal energy and biomass. They constitute
alternatives to fossil fuels and hence contribute to reducing
greenhouse gas emissions as well as diversifying the EU
energy supply.
Renewable energy is also a sector which offers interesting
perspective for the development of new technologies and
of new employment opportunities. The EU Directive on
renewable energy has set targets for all Member States,
such that the EU should reach a 20 % share of energy from
renewable sources by 2020 and a 10 % share of renewable
energy specifically in the transport sector. The share of
renewable energy consumption in the EU in 2008 was 10 %.
How do the EU Member States score?
The share of renewable energy in gross final energy con-
sumption is already high in some Member States. It accounts
for more than 44 % of energy consumption in Sweden and
more than 30 % in Finland. On the contrary, it is extremely
low in other countries like for instance Malta, Luxemburg or
the United Kingdom where renewable energy represents
respectively 0.2 %, 2.1 % and 2.2 % of gross final energy
consumption.
This table shows the five countries with the highest share of renewable energy in gross final energy consumption in 2008
MS Shareofrenewableenergyingrossfinalenergyconsumption,2008(%)
SE 44.4
FI 30.5
LV 29.9
AT 28.5
PT 23.2
However, it is generally in the Member States where the use
of renewables is particularly low that it is also growing the
fastest. For instance, between 2006 and 2008, the share of
renewable energy in gross final energy consumption has
grown by 133 % in Luxemburg, by 100 % in Malta and 64 %
in Cyprus. The growth in the share of renewables in consump-
tion is above 20 % in all Member States where it is currently
lower than 5 %.
This table shows the five countries that are most distant to their national target in 2008
MS Distancetotarget,percentagepoint
UK 12.8
IE 12.2
LV 12.1
FR 12.0
DK 11.2
The situation of Member States also widely varies regarding
the distance to the target they have committed. Some coun-
tries like the United Kingdom, Ireland, Latvia or France must
increase the use of renewables by more than 12 percentage
points to reach their targets. Other countries are already
close to their 2020 objective, like for instance Romania,
Sweden or Austria which must respectively add another 3.6,
4.6 and 5.5 percentage points of renewables into final energy
consumption for reaching their targets.
2929Report from the Commission to the European Parliament and the CouncilSeventh progress report on economic, social and territorial cohesion
Annexes
0 5 10
15
20
25
30
35
40
45
50
Sweden
Latvia
Finland
Austria
Portugal
Denmark
Estonia
Slovenia
Romania
France
Lithuania
Spain
Germany
Greece
Italy
Bulgaria
Ireland
Poland
United Kingdom
Netherlands
Slovakia
Belgium
Cyprus
Czech Republic
Hungary
Luxembourg
Malta
European Union
Share of renewable energy relative to total energy consumption in %
6.1
Ren
ewab
le e
ner
gy
con
sum
pti
on
, 20
06
, 20
08
an
d t
he
20
20
tar
get
s
2006
20
08
2020
Tar
get
Sou
rce:
Eu
rost
at
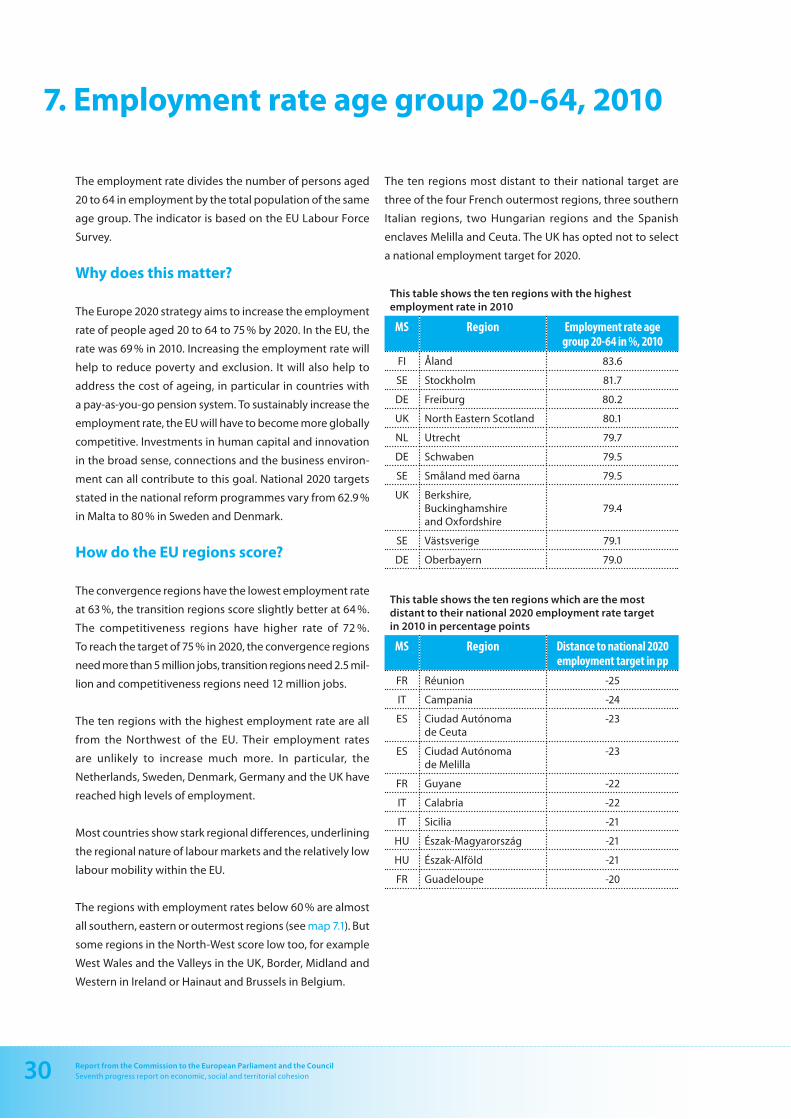
30 Report from the Commission to the European Parliament and the CouncilSeventh progress report on economic, social and territorial cohesion
7. Employment rate age group 20-64, 2010
The employment rate divides the number of persons aged
20 to 64 in employment by the total population of the same
age group. The indicator is based on the EU Labour Force
Survey.
Why does this matter?
The Europe 2020 strategy aims to increase the employment
rate of people aged 20 to 64 to 75 % by 2020. In the EU, the
rate was 69 % in 2010. Increasing the employment rate will
help to reduce poverty and exclusion. It will also help to
address the cost of ageing, in particular in countries with
a pay-as-you-go pension system. To sustainably increase the
employment rate, the EU will have to become more globally
competitive. Investments in human capital and innovation
in the broad sense, connections and the business environ-
ment can all contribute to this goal. National 2020 targets
stated in the national reform programmes vary from 62.9 %
in Malta to 80 % in Sweden and Denmark.
How do the EU regions score?
The convergence regions have the lowest employment rate
at 63 %, the transition regions score slightly better at 64 %.
The competitiveness regions have higher rate of 72 %.
To reach the target of 75 % in 2020, the convergence regions
need more than 5 million jobs, transition regions need 2.5 mil-
lion and competitiveness regions need 12 million jobs.
The ten regions with the highest employment rate are all
from the Northwest of the EU. Their employment rates
are unlikely to increase much more. In particular, the
Netherlands, Sweden, Denmark, Germany and the UK have
reached high levels of employment.
Most countries show stark regional differences, underlining
the regional nature of labour markets and the relatively low
labour mobility within the EU.
The regions with employment rates below 60 % are almost
all southern, eastern or outermost regions (see map 7.1). But
some regions in the North-West score low too, for example
West Wales and the Valleys in the UK, Border, Midland and
Western in Ireland or Hainaut and Brussels in Belgium.
The ten regions most distant to their national target are
three of the four French outermost regions, three southern
Italian regions, two Hungarian regions and the Spanish
enclaves Melilla and Ceuta. The UK has opted not to select
a national employment target for 2020.
This table shows the ten regions with the highest employment rate in 2010
MS Region Employmentrateagegroup20-64in%,2010
FI Åland 83.6
SE Stockholm 81.7
DE Freiburg 80.2
UK North Eastern Scotland 80.1
NL Utrecht 79.7
DE Schwaben 79.5
SE Småland med öarna 79.5
UK Berkshire, Buckinghamshire and Oxfordshire
79.4
SE Västsverige 79.1
DE Oberbayern 79.0
This table shows the ten regions which are the most distant to their national 2020 employment rate target in 2010 in percentage points
MS Region Distancetonational2020employmenttargetinpp
FR Réunion -25
IT Campania -24
ES Ciudad Autónoma de Ceuta
-23
ES Ciudad Autónoma de Melilla
-23
FR Guyane -22
IT Calabria -22
IT Sicilia -21
HU Észak-Magyarország -21
HU Észak-Alföld -21
FR Guadeloupe -20

3131Report from the Commission to the European Parliament and the CouncilSeventh progress report on economic, social and territorial cohesion
Annexes
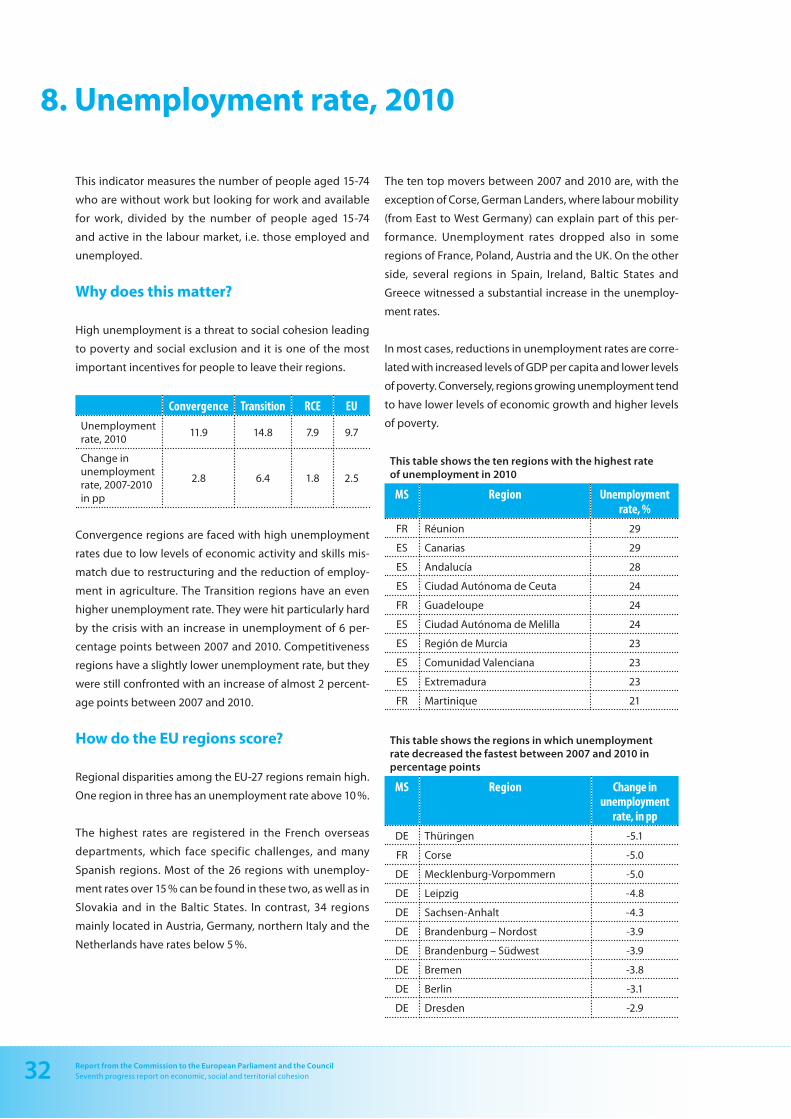
32 Report from the Commission to the European Parliament and the CouncilSeventh progress report on economic, social and territorial cohesion
8. Unemployment rate, 2010
This indicator measures the number of people aged 15-74
who are without work but looking for work and available
for work, divided by the number of people aged 15-74
and active in the labour market, i.e. those employed and
unemployed.
Why does this matter?
High unemployment is a threat to social cohesion leading
to poverty and social exclusion and it is one of the most
important incentives for people to leave their regions.
Convergence Transition RCE EU
Unemployment rate, 2010
11.9 14.8 7.9 9.7
Change in unemployment rate, 2007-2010 in pp
2.8 6.4 1.8 2.5
Convergence regions are faced with high unemployment
rates due to low levels of economic activity and skills mis-
match due to restructuring and the reduction of employ-
ment in agriculture. The Transition regions have an even
higher unemployment rate. They were hit particularly hard
by the crisis with an increase in unemployment of 6 per-
centage points between 2007 and 2010. Competitiveness
regions have a slightly lower unemployment rate, but they
were still confronted with an increase of almost 2 percent-
age points between 2007 and 2010.
How do the EU regions score?
Regional disparities among the EU-27 regions remain high.
One region in three has an unemployment rate above 10 %.
The highest rates are registered in the French overseas
departments, which face specific challenges, and many
Spanish regions. Most of the 26 regions with unemploy-
ment rates over 15 % can be found in these two, as well as in
Slovakia and in the Baltic States. In contrast, 34 regions
mainly located in Austria, Germany, northern Italy and the
Netherlands have rates below 5 %.
The ten top movers between 2007 and 2010 are, with the
exception of Corse, German Landers, where labour mobility
(from East to West Germany) can explain part of this per-
formance. Unemployment rates dropped also in some
regions of France, Poland, Austria and the UK. On the other
side, several regions in Spain, Ireland, Baltic States and
Greece witnessed a substantial increase in the unemploy-
ment rates.
In most cases, reductions in unemployment rates are corre-
lated with increased levels of GDP per capita and lower levels
of poverty. Conversely, regions growing unemployment tend
to have lower levels of economic growth and higher levels
of poverty.
This table shows the ten regions with the highest rate of unemployment in 2010
MS Region Unemploymentrate,%
FR Réunion 29
ES Canarias 29
ES Andalucía 28
ES Ciudad Autónoma de Ceuta 24
FR Guadeloupe 24
ES Ciudad Autónoma de Melilla 24
ES Región de Murcia 23
ES Comunidad Valenciana 23
ES Extremadura 23
FR Martinique 21
This table shows the regions in which unemployment rate decreased the fastest between 2007 and 2010 in percentage points
MS Region Changeinunemployment
rate,inpp
DE Thüringen -5.1
FR Corse -5.0
DE Mecklenburg-Vorpommern -5.0
DE Leipzig -4.8
DE Sachsen-Anhalt -4.3
DE Brandenburg – Nordost -3.9
DE Brandenburg – Südwest -3.9
DE Bremen -3.8
DE Berlin -3.1
DE Dresden -2.9
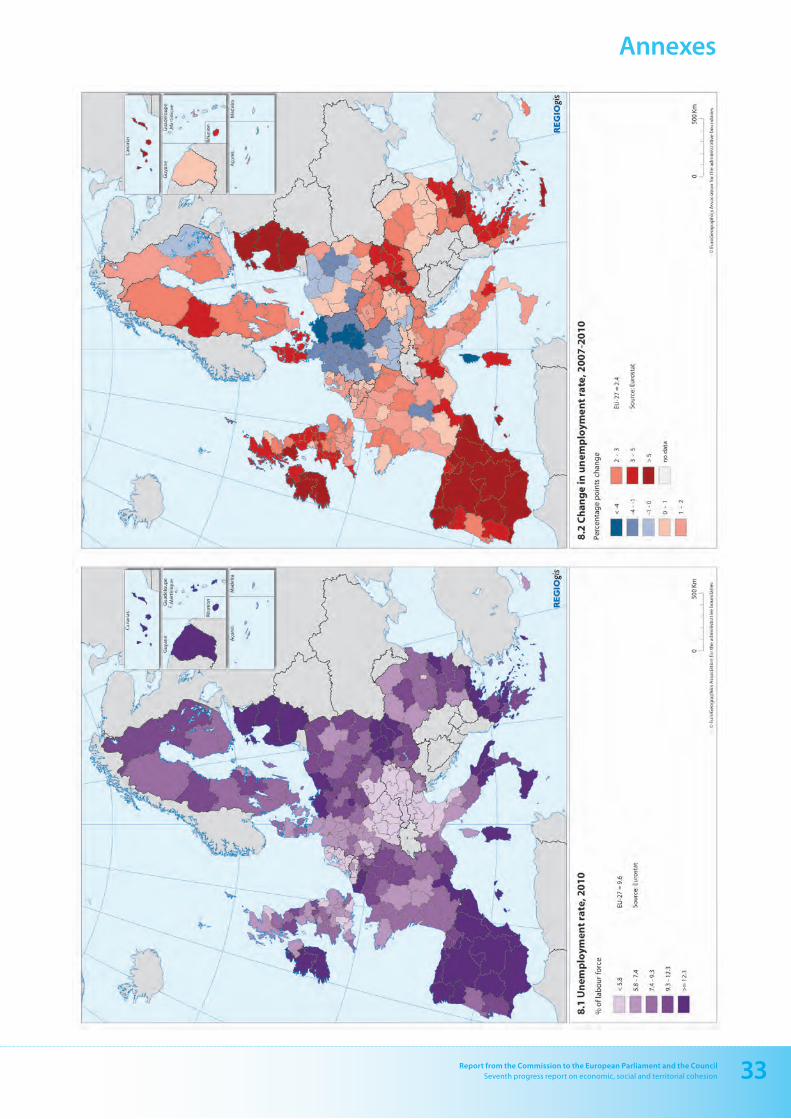
3333Report from the Commission to the European Parliament and the CouncilSeventh progress report on economic, social and territorial cohesion
Annexes
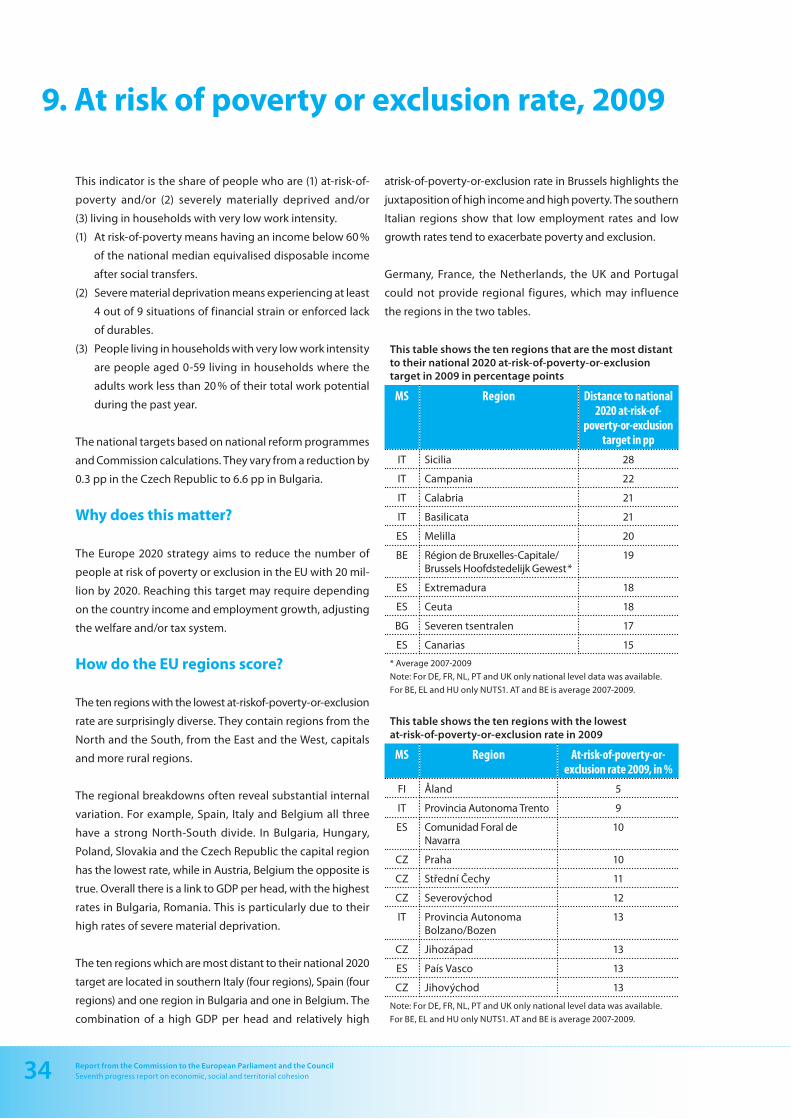
34 Report from the Commission to the European Parliament and the CouncilSeventh progress report on economic, social and territorial cohesion
9. At risk of poverty or exclusion rate, 2009
This indicator is the share of people who are (1) at-risk-of-
poverty and/or (2) severely materially deprived and/or
(3) living in households with very low work intensity.
(1) At risk-of-poverty means having an income below 60 %
of the national median equivalised disposable income
after social transfers.
(2) Severe material deprivation means experiencing at least
4 out of 9 situations of financial strain or enforced lack
of durables.
(3) People living in households with very low work intensity
are people aged 0-59 living in households where the
adults work less than 20 % of their total work potential
during the past year.
The national targets based on national reform programmes
and Commission calculations. They vary from a reduction by
0.3 pp in the Czech Republic to 6.6 pp in Bulgaria.
Why does this matter?
The Europe 2020 strategy aims to reduce the number of
people at risk of poverty or exclusion in the EU with 20 mil-
lion by 2020. Reaching this target may require depending
on the country income and employment growth, adjusting
the welfare and/or tax system.
How do the EU regions score?
The ten regions with the lowest at-riskof-poverty-or-exclusion
rate are surprisingly diverse. They contain regions from the
North and the South, from the East and the West, capitals
and more rural regions.
The regional breakdowns often reveal substantial internal
variation. For example, Spain, Italy and Belgium all three
have a strong North-South divide. In Bulgaria, Hungary,
Poland, Slovakia and the Czech Republic the capital region
has the lowest rate, while in Austria, Belgium the opposite is
true. Overall there is a link to GDP per head, with the highest
rates in Bulgaria, Romania. This is particularly due to their
high rates of severe material deprivation.
The ten regions which are most distant to their national 2020
target are located in southern Italy (four regions), Spain (four
regions) and one region in Bulgaria and one in Belgium. The
combination of a high GDP per head and relatively high
atrisk-of-poverty-or-exclusion rate in Brussels highlights the
juxtaposition of high income and high poverty. The southern
Italian regions show that low employment rates and low
growth rates tend to exacerbate poverty and exclusion.
Germany, France, the Netherlands, the UK and Portugal
could not provide regional figures, which may influence
the regions in the two tables.
This table shows the ten regions that are the most distant to their national 2020 at-risk-of-poverty-or-exclusion target in 2009 in percentage points
MS Region Distancetonational2020at-risk-of-
poverty-or-exclusiontargetinpp
IT Sicilia 28
IT Campania 22
IT Calabria 21
IT Basilicata 21
ES Melilla 20
BE Région de Bruxelles-Capitale/Brussels Hoofdstedelijk Gewest *
19
ES Extremadura 18
ES Ceuta 18
BG Severen tsentralen 17
ES Canarias 15
* Average 2007-2009
Note: For DE, FR, NL, PT and UK only national level data was available.
For BE, EL and HU only NUTS1. AT and BE is average 2007-2009.
This table shows the ten regions with the lowestat-risk-of-poverty-or-exclusion rate in 2009
MS Region At-risk-of-poverty-or-exclusionrate2009,in%
FI Åland 5
IT Provincia Autonoma Trento 9
ES Comunidad Foral de Navarra
10
CZ Praha 10
CZ Střední Čechy 11
CZ Severovýchod 12
IT Provincia Autonoma Bolzano/Bozen
13
CZ Jihozápad 13
ES País Vasco 13
CZ Jihovýchod 13
Note: For DE, FR, NL, PT and UK only national level data was available.
For BE, EL and HU only NUTS1. AT and BE is average 2007-2009.
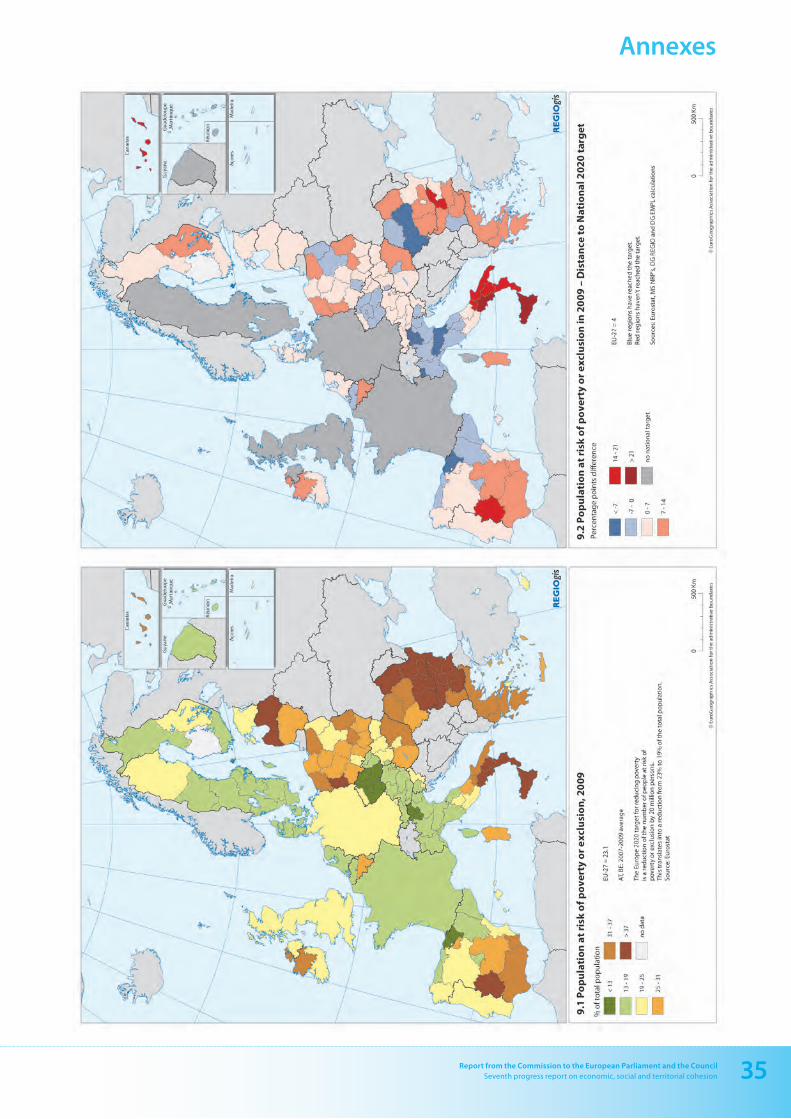
3535Report from the Commission to the European Parliament and the CouncilSeventh progress report on economic, social and territorial cohesion
Annexes
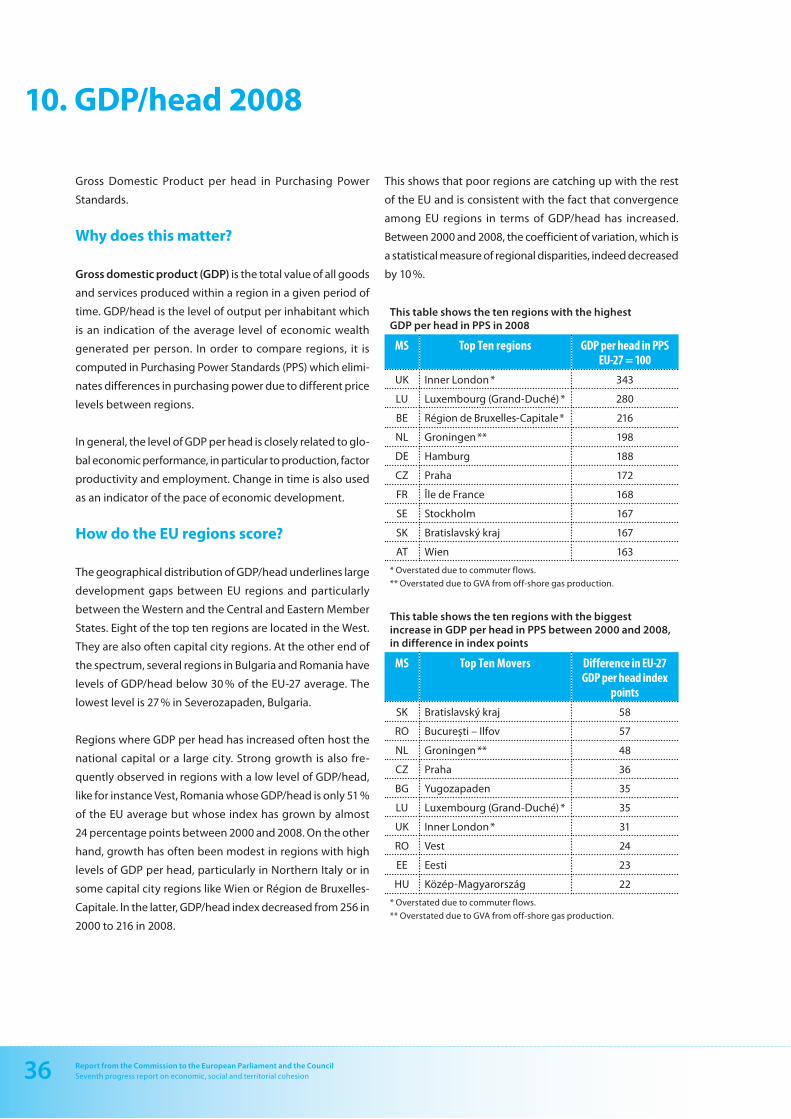
36 Report from the Commission to the European Parliament and the CouncilSeventh progress report on economic, social and territorial cohesion
10. GDP/head 2008
Gross Domestic Product per head in Purchasing Power
Standards.
Why does this matter?
Gross domestic product (GDP) is the total value of all goods
and services produced within a region in a given period of
time. GDP/head is the level of output per inhabitant which
is an indication of the average level of economic wealth
generated per person. In order to compare regions, it is
computed in Purchasing Power Standards (PPS) which elimi-
nates differences in purchasing power due to different price
levels between regions.
In general, the level of GDP per head is closely related to glo-
bal economic performance, in particular to production, factor
productivity and employment. Change in time is also used
as an indicator of the pace of economic development.
How do the EU regions score?
The geographical distribution of GDP/head underlines large
development gaps between EU regions and particularly
between the Western and the Central and Eastern Member
States. Eight of the top ten regions are located in the West.
They are also often capital city regions. At the other end of
the spectrum, several regions in Bulgaria and Romania have
levels of GDP/head below 30 % of the EU-27 average. The
lowest level is 27 % in Severozapaden, Bulgaria.
Regions where GDP per head has increased often host the
national capital or a large city. Strong growth is also fre-
quently observed in regions with a low level of GDP/head,
like for instance Vest, Romania whose GDP/head is only 51 %
of the EU average but whose index has grown by almost
24 percentage points between 2000 and 2008. On the other
hand, growth has often been modest in regions with high
levels of GDP per head, particularly in Northern Italy or in
some capital city regions like Wien or Région de Bruxelles-
Capitale. In the latter, GDP/head index decreased from 256 in
2000 to 216 in 2008.
This shows that poor regions are catching up with the rest
of the EU and is consistent with the fact that convergence
among EU regions in terms of GDP/head has increased.
Between 2000 and 2008, the coefficient of variation, which is
a statistical measure of regional disparities, indeed decreased
by 10 %.
This table shows the ten regions with the highest GDP per head in PPS in 2008
MS TopTenregions GDPperheadinPPSEU-27=100
UK Inner London * 343
LU Luxembourg (Grand-Duché) * 280
BE Région de Bruxelles-Capitale * 216
NL Groningen ** 198
DE Hamburg 188
CZ Praha 172
FR Île de France 168
SE Stockholm 167
SK Bratislavský kraj 167
AT Wien 163
* Overstated due to commuter flows.
** Overstated due to GVA from off-shore gas production.
This table shows the ten regions with the biggest increase in GDP per head in PPS between 2000 and 2008, in difference in index points
MS TopTenMovers DifferenceinEU-27GDPperheadindex
points
SK Bratislavský kraj 58
RO Bucureşti – Ilfov 57
NL Groningen ** 48
CZ Praha 36
BG Yugozapaden 35
LU Luxembourg (Grand-Duché) * 35
UK Inner London * 31
RO Vest 24
EE Eesti 23
HU Közép-Magyarország 22
* Overstated due to commuter flows.
** Overstated due to GVA from off-shore gas production.

3737Report from the Commission to the European Parliament and the CouncilSeventh progress report on economic, social and territorial cohesion
Annexes


European Commission
The urban and regional dimension of Europe 2020Seventh progress report on economic, social and territorial cohesion
2011 — 37 pp. — 21.0 × 29.7 cm
ISBN 978-92-79-21727-2doi:10.2776/50938
HOW TO OBTAIN EU PUBLICATIONS
Free publications:• via EU Bookshop (http://bookshop.europa.eu);• at the European Commission’s representations or delegations. You can obtain their contact
details on the Internet (http://ec.europa.eu) or by sending a fax to +352 2929-42758.
Priced publications:• via EU Bookshop (http://bookshop.europa.eu).
Priced subscriptions (e.g. annual series of the Official Journal of the European Union and reports of cases before the Court of Justice of the European Union):• via one of the sales agents of the Publications Office of the European Union
(http://publications.europa.eu/others/agents/index_en.htm).

KN-31-11-359-EN
-C