the untapped potential of california’s water supply: effi ... · years, disputes over water are...
TRANSCRIPT

California is suffering from a third year of drought, with near-record-low reservoirs, mountain snowpack, soil moisture, and river runoff. As a direct result, far less water than usual is available for cities, farms, and natural ecosystems. There are far-reaching effects that will intensify if dry conditions persist. Several response strategies are available that will provide both near-term relief and long-term benefi ts. This report examines the signifi cant potential contributions available from four priority opportunities: improved effi ciency in urban and agricultural water use, reuse and recycling of water, and increased capture of local rain water.
The Untapped Potential of California’s Water Supply: Effi ciency, Reuse, and Stormwater
ISSUE BRIEF JuNE 2014 IB:14-05-C
© Ron Kroetz Flickr Creative Commons
NRDC-4

PAGE 2 | California Drought Capstone
California is a land of hydrological extremes, from water-rich mountains and redwood forests in the north to some of the driest deserts in North America in the south. It suffers both epic floods and persistent droughts. The existing water infrastructure and management systems reflect these extremes, with massive dams, canals, and pumping stations to store and transfer water, and hundreds of intertwined laws, institutions, and organizations promoting overlapping and sometimes conflicting water interests. The drought could end next year or it could continue, with even greater consequences in the coming years. But even during good years, disputes over water are common and claims of water shortages rampant. Dry years magnify disagreements over allocation, management, and use of California’s water resources.
For much of the 20th century, California’s water supply strategy has meant building reservoirs and conveyance systems to store and divert surface waters, and drilling groundwater wells to tap our aquifers. Hundreds of billions of federal, state, and local dollars have been invested in these supply options, allowing the state to grow to nearly 40 million people with a $2 trillion economy (LAO, 2013; Hanak et al., 2012). But traditional supply options are tapped out. Rivers are over-allocated even in wet years. There is a dearth of new options for surface reservoirs, and those that exist are expensive, politically controversial, and offer only modest improvements in water supply for a relatively few users. Groundwater is so severely overdrafted that there are growing tensions among neighbors and damage to public roads, structures, and, ironically, water delivery canals from the land subsiding over depleted aquifers.
The good news is that solutions to our water problem exist. They are being implemented to varying degrees around the state with good results, but a lot more can be done. During a drought as severe as the current one, the incentives to work cooperatively and aggressively to implement solutions are even greater. In this report, we examine the opportunities for four cost-effective and technically feasible strategies—urban and agricultural water conservation and efficiency, water reuse, and stormwater capture—to improve the ability of cities, farmers, homeowners, and businesses to cope with drought and address longstanding water challenges in California. We conclude that these strategies can provide 10.8 million to 13.7 million acre-feet per year of water in new supplies and demand reductions, improving the reliability of our current system and reducing the risks of shortages and water conflicts.
NAturE of thE ChAllENGE: thE “GAP”California’s water system is out of balance. The current water use pattern is unsustainable, and there is a large and growing gap between the water desired and the water made available by nature. Human demands for water in the form of water rights claims, agricultural irrigation, and growing cities and suburbs greatly exceed—even in wet years—volumes that can be sustainably extracted from natural river flows and
groundwater aquifers. Major rivers, such as the San Joaquin, have been entirely de-watered. Declines in groundwater levels in some areas due to overpumping of groundwater are measured in hundreds of vertical feet and millions of acre-feet.
Estimates of the overall “gap” are difficult because large volumes of water use are not measured or reported, California’s natural water supply varies greatly between wet and dry years, and because water “demand” can be artificially inflated by over-allocation of rivers, inefficient use, price subsidies, the failure to prevent groundwater overdraft, and other hard limits on supply. But there are a wide variety of signs of the gap:
Sacramento-San Joaquin river DeltaThe Sacramento-San Joaquin River Delta illustrates the unsustainable gap between how much water we take from our rivers and how much those rivers can provide. The Delta is vitally important to California. It is the primary hub for moving water from north to south. It is home to hundreds of species of birds, fish, and wildlife (DSC, 2013), including two-thirds of the state’s salmon and at least half of the Pacific Flyway migratory water birds (USFWS, 2001). It is also a vibrant farming community. But excessive water diversions have contributed to a crisis that threatens the Delta’s ability to perform any of these functions. In response to this crisis, in 2009, the State Legislature directed the State Water Resources Control Board (State Board) to determine how much water the Delta would need to fully protect public trust resources in the Delta.1 For an average weather year, the State Board found that substantially increased flows from the Sacramento and San Joaquin River basins through the Delta into San Francisco Bay are needed to restore and maintain viable populations of fish and wildlife under existing conditions.2 The Board’s findings indicate that we currently divert almost 5 million acre-feet more water in an average year from the Delta than is compatible with a healthy Delta.3 While these findings were designed to inform future planning decisions without considering other changes to the system or balancing other beneficial uses, the State Board’s determination illustrates the yawning gap between our water demands in California and how much our surface waters can supply.
Groundwater overdraftGroundwater is a vital resource for California. In average years, it provides nearly 40 percent of the state’s water supply. That number goes up to 45 percent in dry years and close to 60 percent in a drought (DWR, 2014a). Moreover, many small- and medium-sized communities, such as Lodi, are completely dependent on groundwater. A clear indicator of the gap between water supply and water use in California is the extensive and unsustainable overdraft of groundwater, i.e., groundwater extracted beyond the natural recharge rate of the aquifer. Chronic overdraft has led to falling groundwater levels, dry wells, land subsidence, decreased groundwater storage capacity, decreased water quality, and stream depletion (Borchers et al., 2014).
NRDC-4

PAGE 3 | California Drought Capstone
As shown in Figure 1, groundwater levels are declining across major parts of the state. According to the Department of Water Resources (2014a), since spring 2008, groundwater levels have dropped to all-time lows in most areas of the state and especially in the northern portion of the San Francisco Bay hydrologic region, the southern San Joaquin Valley, and the South Lahontan and South Coast hydrologic regions. In many areas of the San Joaquin Valley, recent groundwater levels are more than 100 feet below previous historic lows. While some groundwater recharge occurs in wet years, that recharge is more than offset by pumping in dry and even average years, with over 50 million acre-feet of groundwater having been lost over the last half century (UCCHM, 2014). A comprehensive statewide assessment of groundwater overdraft has not been conducted since 1980, and there are major gaps in groundwater monitoring.4 DWR has been estimating with considerable uncertainty that overdraft is between 1 million and 2 million acre-feet per year (DWR, 2003).
There are strong indications, however, that groundwater overdraft is worsening. Recent data indicates that the Sacramento and San Joaquin River Basins collectively lost over 16 million acre-feet of groundwater between October 2003 and March 2010, or about 2.5 million acre-feet per year (Famiglietti, 2014). This period captured a moderate drought, and thus we would expect overdraft to be higher than in non-drought periods. But while groundwater levels increased in 2011 and 2012, they did not fully recover to pre-drought levels, resulting in a net loss in groundwater storage at time when California enters a far more severe drought.
The gap between water supply and use from the state’s groundwater basins and from the Sacramento-San Joaquin Delta alone exceeds 6 million acre-feet of water per year. We know that this underestimates the gap, as numerous studies have identified considerable unmet environmental flow objectives in other parts of the state (Hayden and Rosekrans, 2004). Moreover, we know that these “gaps” are expected to grow with the increasing challenges posed by population growth and climate change (DWR, 2013a).
Note: Cumulative groundwater losses (cubic km and million acre-ft) in California’s Central Valley since 1962 from USGS and NASA GRACE data. Figure from UCCHM (2014) and extends figure B9 from Faunt [2009]. The red line shows data from USGS calibrated groundwater model simulations [Faunt, 2009] from 1962-2003. The green line shows GRACE-based estimates of groundwater storage losses from Famiglietti et al. [2011] and updated for UCCHM(2014). Background colors represent periods of drought (white), of variable to dry conditions (grey), of variable to wet conditions (light blue) and wet conditions (blue). Groundwater depletion mostly occurs during drought; and progressive droughts are lowering groundwater storage to unsustainable levels.
Source: UC Center for Hydrologic Modeling (UCCHM), 2014. Water Storage Changes in California’s Sacramento and San Joaquin River Basins From GRACE: Preliminary Updated Results for 2003-2013. University of California, Irvine UCCHM Water Advisory #1, February 3, 2014. Available at https://webfiles.uci.edu/jfamigli/Advisory/UCCHM_Water_Advisory_1.pdf.
Figure courtesy of Jay Famiglietti, UCCHM, UC Irvine
figure 1. Cumulative groundwater loss (in km3 and million acre-feet) for California’s Central Valley since 1962
NRDC-4

PAGE 4 | California Drought Capstone
oPPortuNitiESThe good news is that California can fill the gaps between water supply and use with a wide range of strategies that are cost-effective, technically feasible, more resistant to drought than the current system, and compatible with healthy river and groundwater basins. New supply options include greatly expanded water reuse and stormwater capture. Demand-management options include the adoption of more comprehensive efficiency improvements for cities and farms that allow us to continue to provide the goods and services we want, with less water. Efforts in these areas have been underway in California for decades, and laudable progress has been made, but much more can be done.
Efficiency, water reuse, and stormwater capture can provide effective drought responses in the near-term and permanent water-supply reliability benefits for the state. Moreover, by reducing reliance on imported water supplies and groundwater pumping, they can cut energy use and greenhouse emissions, reduce the need to develop costly new water and wastewater infrastructure, and eliminate pollution from stormwater and wastewater discharges. Finally, these strategies can also generate new jobs and provide new business opportunities.
To better understand the extent to which these alternatives could reduce pressure on the state’s rivers and groundwater basins, the Pacific Institute, Natural Resources Defense Council, and Professor Robert Wilkinson from the University of California, Santa Barbara undertook a series of assessments of the potential for urban and agricultural water conservation and efficiency, water reuse, and stormwater capture. In particular, we evaluated the technical potential, i.e., the total water supplies and demand reductions that are feasible given current technologies and practices.5 These measures are already being adopted in California and have been shown to be cost-effective compared to other water supply alternatives (Cooley et al. 2010; DWR, 2013b). The next section provides a short summary of the additional technical potential for each of these strategies.
improving Agricultural Water-use EfficiencyAgriculture uses approximately 80 percent of California’s developed water supply (DWR, 2014b). As such a large user, it is heavily impacted by the availability and reliability of California’s water resources. Moreover, agriculture can play an important role in helping the state achieve a more sustainable water future. California irrigators have already made progress in modernizing irrigation practices, but more can be done to promote long-term sustainable water use and ensure that agricultural communities remain healthy and competitive. Since 2000, several research studies—including two sponsored by the CALFED Bay-Delta Program and a third by the nonprofit Pacific Institute—have shown that there is significant untapped agricultural water-use efficiency potential in California (CALFED, 2000 and 2006; Cooley et al., 2009). Although the studies varied in their geographic
scope and in their approach, the researchers came up with remarkably similar numbers, finding that agricultural water use could be reduced by 5.6 million to 6.6 million acre-feet per year, or by about 17 to 22 percent, while maintaining current irrigated acreage and mix of crops. As much as 0.6 million to 2.0 million acre-feet per year represent savings in consumptive use, which can then be allocated to other uses. The rest of the savings reflect reductions in the amount of water taken from rivers, streams, and groundwater, leading to improvements in water quality, instream flow, and energy savings, among other benefits. Additional water savings could be achieved by temporarily or permanently fallowing land or switching crop types, but these options were not evaluated here.
improving urban Water-use EfficiencyGreater urban water conservation and efficiency can reduce unnecessary and excessive demands for water, save energy, reduce water and wastewater treatment costs, and eliminate the need for costly new infrastructure. Between 2001 and 2010, California’s urban water use averaged 9.1 million acre-feet per year, accounting for about one-fifth of the state’s developed water use (DWR, 2014b). By adopting proven technologies and practices, businesses can improve water-use efficiency by 30 to 60 percent. Residential users can improve home water-use efficiency by 40 to 60 percent by repairing leaks, installing the most efficient appliances and fixtures, and adopting landscape designs with less turf grass and more native and drought tolerant plants. In addition, water utilities can expand their efforts to identify and cut leaks and losses in underground pipes and other components of their distribution systems. Together, these savings could reduce urban water use by 2.9 million to 5.2 million acre-feet per year.
Greater Water reuseWater reuse is a reliable, local water supply that reduces vulnerability to droughts and other water-supply constraints. It can also provide economic and environmental benefits by reducing energy use, diversions from rivers and streams, and pollution from wastewater discharges. There is significant opportunity to expand water reuse in California. An estimated 670,000 acre-feet of municipal wastewater is already beneficially reused in the state each year (SWRCB and DWR, 2012). Onsite reuse—including the use of graywater—is also practiced across California, although data are not available to estimate the extent of reuse. We estimate that the water reuse potential in California, beyond current levels, ranges from 1.2 million to 1.8 million acre-feet per year, after taking into account efficiency opportunities. Approximately two-thirds of the reuse potential is in coastal areas where wastewater is discharged into the ocean or into streams that drain into the ocean. In these areas, expanding water reuse can provide both water-supply and water-quality benefits.
NRDC-4

PAGE 5 | California Drought Capstone
Expanding Stormwater Capture and useMunicipalities used to manage stormwater by channeling it away from developed land and urban centers as quickly as possible. This approach reduces the amount of freshwater available for groundwater recharge and use, and it creates tremendous pollution problems with stormwater discharges to rivers, lakes, and ocean waters. As water resources have become increasingly constrained, there is new interest in capturing stormwater runoff as a sustainable source of supply (CNRA, 2014). In California, there are substantial opportunities to use stormwater beneficially to recharge groundwater supplies or for direct use for non-potable applications. Our assessment indicates that capturing stormwater from paved surfaces and rooftops in urbanized Southern California and the San Francisco Bay Area can increase average annual water supplies by 420,000 to 630,000 acre-feet or more each year, while also reducing both flooding and a leading cause of surface water pollution in the state.
Combined Water Supply and Demand reductionsTogether, these improvements in water conservation and efficiency, water reuse, and stormwater capture can provide 10.8 – 13.7 million acre-feet in new supplies and demand reductions. As shown in Figure 2, these savings can be realized throughout the state. There are, however, important regional differences. In the Central Valley and the Colorado River hydrologic region, for example, the majority of savings are from agriculture, although savings from other strategies are also available. In coastal areas, the majority of savings are in urban areas. Statewide, urban conservation and efficiency combined with water reuse and stormwater capture provide the equivalent in new supplies and demand reductions as agricultural efficiency (Table 1).
Along the coast and in areas that drain into a salt sink, these measures provide water supply and water quality benefits. In inland areas, some portion of the yield of these measures may already be used by a downstream user and thus do not constitute “new” supply. However, even in such locations, the measures described here can improve the reliability of water supplies, leave water instream for use by ecosystems, replace the need for potable water, and reduce pressure on the state’s overtaxed rivers and ground-water basins.
figure 2. total water supply and demand changes with four drought response strategies, in thousand acre-feet per year, by hydrologic region
Note: Stormwater capture was only examined in the San Francisco Bay Area and the South Coast. There is additional potential to capture stormwater in other regions of the state, although we did not evaluate that here. The values shown in this figure represent the midpoint of the ranges for each strategy.
table 1. Statewide water supply and demand changes with four drought response strategies
Strategy Water Savings (million acre-feet per year)
Agricultural water conservation and efficiency
5.6 – 6.6
Urban water conservation and efficiency
2.9 – 5.2
Water reuse 1.2 – 1.8
Stormwater capture 0.4 – 0.6
NRDC-4

PAGE 6 | California Drought Capstone
CoNCluSioNSWe conclude that there is tremendous untapped potential to improve efficiency and augment supplies in California. Water efficiency, water reuse, and stormwater capture can provide 10.8 million – 13.7 million acre-feet of water in new supplies and demand reductions. These alternatives can provide both effective drought responses in the near-term and permanent water-supply reliability benefits for the state. Additionally, they can reduce energy use and greenhouse emissions, lower environmental impacts, and create new business and employment opportunities. Given the large potential and broad agreement about these strategies, state, federal, and local water agencies should move much more rapidly to implement policies to capture this potential.
California is reaching, and in many cases has exceeded, the physical, economic, ecological, and social limits of traditional supply options. We must expand the way we think about both “supply” and “demand”—away from costly old approaches and toward more sustainable options for expanding supply, including water reuse and stormwater capture, and improving water use efficiency. There is no “silver bullet” solution to our water problems, as all rational observers acknowledge. Instead, we need a diverse portfolio of sustainable solutions. But the need to do many things does not mean we must, or can afford, to do everything. We must do the most effective things first.
Identifying the technical potential to expand non-traditional supply options and increase water-use efficiency savings is just the first step in tackling California’s water problems. Equally, if not more, important is adopting policies and developing programs to achieve those savings. A substantial body of law and policy already points the way to a more sustainable future for our state. For example, the California Constitution prohibits the waste of water. Likewise, the Brown Administration’s California Water Action Plan supports local water projects that increase regional self-reliance and result in integrated, multi-benefit solutions. Many of these themes are also expressed in policy documents and recommendations from the California Urban Water Conservation Council, the Pacific Institute, the Association of California Water Agencies, the Delta Stewardship Council, the California Council on Science and Technology, the California Water Foundation, and others.
There is broad agreement on the value of improved efficiency, water reuse, and stormwater capture. The challenge is not a lack of knowledge or vision about what to do, but rather the urgent need for more effective implementation of strategies already known to work. Many innovative policymakers around the state have proposed new approaches to promote more widespread implementation of these strategies. We look forward to working with the Governor, agency heads, legislative leaders, water suppliers, and civic and business leaders to follow up with more specific actions for bringing the supply and demand for water in California into a sustainable balance.
NRDC-4

PAGE 7 | California Drought Capstone
references
Borchers, J.W., V. Kretsinger Grabert, M. Carpenter, B. Dalgish, and D. Cannon. 2014. Land Subsidence from Groundwater Use in California. Prepared by Luhdorff & Scalmanini Consulting Engineers.
California Natural Resources Agency (CNRA). (2014). California Water Action Plan: Actions for Reliability, Restoration, and Resilience. Final Draft. Sacramento, CA.
Cooley, H., J. Christian-Smith, P.H. Gleick, M.J. Cohen, M. Heberger. 2010. California’s Next Million Acre-Feet: Saving Water, Energy, and Money. Pacific Institute, Oakland, California. 27 pages.
Delta Stewardship Council (DSC). (2013). The Delta Plan. Sacramento, CA. Accessed on 25 May 2014 at http://deltacouncil.ca.gov/sites/default/files/documents/files/DeltaPlan_2013_CHAPTERS_COMBINED.pdf.
Department of Water Resources (DWR). (2003). California’s Groundwater. Bulletin 118. Sacramento, CA.
Department of Water Resources (DWR). (2013a). Managing an Uncertain Future. Volume 1, Chapter 5 of the California Water Plan Update. Bulletin 160. Sacramento, CA.
Department of Water Resources (DWR). (2013b). Introduction. Volume 3, Chapter 1 of the California Water Plan Update. Bulletin 160. Sacramento, CA.
Department of Water Resources (DWR). (2014a). Groundwater Basins with Potential Water Shortages and Gaps in Groundwater Monitoring. Public Update for Drought Response. Sacramento, CA.
Department of Water Resources (DWR). (2014b). California Water Balances, 1998-2010. California Department of Water Resources. Emailed to the author by Evelyn Tipton.
Famiglietti, J. (2014). Epic California drought and groundwater: where do we go from here? Water Currents. National Geographic Blog.
Hanak, Ellen, Jay Lund, Barton “Buzz” Thompson, W. Bowman Cutter, Brian Gray, David Houston, Richard Howitt, Katrina Jessoe, Gary Libecap, Josué Medellín-Azuara, Sheila Olmstead, Daniel Sumner, David Sunding, Brian Thomas, and Robert Wilkinson, 2012. Water and the California Economy. Public Policy Institute of California. http://www.ppic.org/main/publication.asp?i=1015
Hayden, A. and S. Rosekrans. 2004. Quantification of Unmet Environmental Objectives in State Water Plan 2003 using actual flow data for 1998, 2000, and 2001. California Water Plan Update. Accessed on 15 May 2014 at http://www.waterplan.water.ca.gov/docs/cwpu2009/0310final/v4c10a07_cwp2009.pdf.
Legislative Analyst’s Office (LAO). (2013). Cal Facts 2013. Sacramento, California. Accessed on 8 May 2014 at http://www.lao.ca.gov/reports/2013/calfacts/calfacts_010213.aspx#Californias_Economy.
State Water Resources Control Board (SWRCB) and California Environmental Protection Agency (Cal EPA). (2010a). Development of Flow Criteria for the Sacramento-San Joaquin Delta Ecosystem. Prepared Pursuant to the Sacramento-San Joaquin Delta Reform Act of 2009. Accessed on 6 May 2014 at http://www.waterboards.ca.gov/waterrights/water_issues/programs/bay_delta/deltaflow/docs/final_rpt080310.pdf.
State Water Resources Control Board (SWRCB) and California Environmental Protection Agency (Cal EPA). (2010b). Appendix B. Draft Development of Flow Criteria for the Sacramento-San Joaquin Delta Ecosystem. Prepared Pursuant to the Sacramento-San Joaquin Delta Reform Act of 2009. Accessed on 6 May 2014 at http://www.waterboards.ca.gov/waterrights/water_issues/programs/bay_delta/deltaflow/docs/draft_report072010.pdf.
UC Center for Hydrologic Modeling (UCCHM). (2014). Water Storage Changes in California’s Sacramento and San Joaquin River Basins from GRACE: Preliminary Updated Results for 2003-2013. UCCHM Water Advisory #1.
United States Fish & Wildlife Service (USFWS). (2001). Tissue Residues and Hazards of Waterborne Pesticides for Federally Listed and Candidate Fishes of the Sacramento-San Joaquin River Delta. Accessed on 28 May 2014 at http://www.fws.gov/pacific/ecoservices/envicon/pim/reports/Sacramento/SacramentoDelta.htm.
footnotes
1 Water Code section 85086(c)(1): “For the purpose of informing planning decisions for the Delta Plan and the Bay Delta Conservation Plan, the board shall, pursuant to its public trust obligations, develop new flow criteria for the Delta ecosystem necessary to protect public trust resources.”
2 See, e.g., page 5 of SWRCB and California EPA (2010a), recommending the general magnitude and timing of 75 percent of unimpaired Delta outflow from January through June, from approximately 30 percent in drier years to almost 100 percent in wetter years; 75 percent of unimpaired Sacramento River inflow from November through June, from an average of about 50 percent from April through June; and 60 percent of unimpaired San Joaquin River inflow from February through June, from approximately 20 percent in drier years to almost 50 percent in wetter years.
3 SWRCB and California EPA (2010b) at 180, Scenario B (2,258 thousand acre-feet (TAF) north-of-Delta delivery difference + 1,031 TAF south-of-Delta delivery difference = 1,609 TAF Vernalis flow difference = 4,898 TAF).
4 Of California’s 515 alluvial groundwater basins, 169 are fully or partially monitored under the CASGEM Program and 40 of the 126 High and Medium priority basins are not monitored under CASGEM. The greatest groundwater monitoring data gaps are in the Sacramento, San Joaquin River, Tulare Lake, Central Coast, and South Lahontan hydrologic regions (DWR 2014a).
5 The technical potential estimated in these analyses is based on current use patterns and does not include population and economic growth, or changes in the total acreage or types of crops grown in the state. Increased population can result in increased demand, and these tools can help offset that growth. We do not examine the economic or market potential of these alternatives.
Authors and Acknowledgements
The lead author of this report is Peter Gleick, with additional contributions by Heather Cooley, Kate Poole and Ed Osann. Support for this work was provided by the Pisces Foundation. Numerous individuals provided comments on this report; we thank them for their input.
NRDC-4

Natural resources Defense Council40 West 20th StreetNew York, NY 10011212 727-2700Fax 212 727-1773
Beijing
Chicago
Los Angeles
Bozeman
San Francisco
Washington, D.C.
www.nrdc.org
www.nrdc.org/policywww.facebook.com/nrdc.orgwww.twitter.com/nrdc
Pacifi c institute654 13th Street, Preservation ParkOakland, CA 94612, USAPhone: 510-251-1600Fax: 510-251-2203
www.pacinst.orgwww.californiadrought.org
www.facebook.com/Pacifi cInstitutewww.twitter.com/Pacifi cInstitut
Printed on recycled paper
NRDC-4

Agriculture uses about 80 percent of California’s developed water supply. As such a large user, it is heavily impacted by the availability and reliability of California’s water resources. Agriculture can also play an important role in helping the state achieve a more sustainable water future. The challenge is to transition to an agricultural sector that supplies food and fiber to California and the world and supports rural livelihoods and long-term sustainable water use.
Water efficiency—defined as measures that reduce water use without affecting the benefits water provides—has been shown to be a cost-effective and flexible tool to adapt to drought as well as to address longstanding water challenges in California. Moreover, today’s investments in efficiency will provide a competitive advantage in the future and ensure the ongoing strength of the agriculture sector in California. California farmers have already made progress in updating and modernizing irrigation practices. More can and should be done.
Agricultural Water Conservation and Efficiency Potential in California
issue brief june 2014 ib:14-05-f
© usDA NrCs
NRDC-4

PAGe 2 | Agricultural Water Conservation and efficiency Potential in California
Since 2000, several research studies—including two sponsored by the CALFED Bay-Delta Program and a third by the nonprofit Pacific Institute—have shown that there is significant untapped agricultural efficiency potential in California (CALFED, 2000 and 2006; Cooley et al., 2009). Although the studies varied in their geographic scope and in their approach, the researchers came up with remarkably similar numbers: Agricultural water use could be reduced by 5.6 million to 6.6 million acre-feet per year, or by about 17 to 22 percent, while maintaining productivity and total acreage irrigated. Part of these savings are reductions in consumptive use, ranging from 0.6 million to 2 million acre-feet per year, which represents additional supply that can be allocated to other beneficial uses. The rest of the savings reflect a reduction in water required to be taken from rivers, streams, and groundwater, with improvements in water quality, instream flow, and energy savings, among other benefits. Additional water savings could be achieved by temporarily or permanently fallowing land or switching crop types, although we do not include them in this analysis.
CAliforniA AGriCulture todAyCalifornia is one of the most productive agricultural regions in the world, producing more than 400 different farm products. The state is the nation’s largest agricultural producer, supplying both U.S. and international markets. In 2012, California farm output was valued at a record $45 billion, or about one-tenth of the total for the entire nation. Additionally, California is the nation’s largest agricultural exporter, with exports reaching a record $18.2 billion in 2012 (CDFA, 2013). California’s rich agricultural production has been made possible in part by irrigation supplied by a vast water infrastructure network; however, much of that infrastructure is not easily compatible with efficient on-farm irrigation technology and needs to be updated. For example, in some areas, water is not available to farmers on demand, making it difficult to implement some efficiency measures.
AGriCulturAl WAter useWater managers use a variety of terms to describe agricultural water use, including water use, water withdrawals, and consumptive use. Water use and withdrawals are used synonymously here to refer to water taken from a source and used for agricultural purposes, such as crop irrigation, frost protection, and leaching salts from soil. It includes conveyance losses, i.e., seepage or evaporation from reservoirs and canals. Water sources include local groundwater and surface water as well as water imported via large infrastructure projects like the federal Central Valley Project and State Water Project.
Sources: DWr (1964, 1970, 1974, 1983, 1987, 1993, and 2014) and Orang et al. (2013).
figure 1. Agricultural water use, 1960–2010
50
45
40
35
30
25
20
15
10
5
0
Ann
ual W
ater
Use
(mill
ion
acre
-fee
t)
1970 1975 1980 1985 1990 1995 2000 2005 2010
Agricultural Water Use
Urban Water Use
New DWR data DWR Bulletin 160 data
NRDC-4

PAGe 3 | Agricultural Water Conservation and efficiency Potential in California
Agricultural water use can be further divided into two water-use categories, consumptive and non-consumptive. Consumptive use is sometimes referred to as irretrievable or irrecoverable loss. The term consumptive use or consumption typically refers to water that is unavailable for reuse in the basin from which it was extracted, due to evaporation from soils and standing water, plant transpiration, incorporation into plant biomass, seepage to a saline sink, or contamination. Non-consumptive use, on the other hand, refers to water available for reuse within the basin from which it was extracted, such as through return flows. Non-consumptive use is sometimes referred to as recoverable loss. This water usually has elevated levels of salts and other pollutants.
There are large uncertainties regarding actual water use in the agricultural sector due to a lack of consistent measurement and reporting of water use.1 Estimates are produced by the Department of Water Resources (DWR) and are used in long-term planning efforts. According to data from the DWR’s water plan update (Bulletin 160), agricultural water use steadily increased during the 1960s and 1970s. Since the mid-1960s, agricultural water use has generally ranged from about 30 to 37 million acre-feet per year (Figure 1). More recent estimates, also produced by DWR and described in Orang et al. (2013), suggest that agricultural water use may be 20 to 30 percent higher than previous estimates, ranging from 35 million and 45 million acre-feet per year between 1998 and 2010, but the same general trends apply.2 Agricultural water use is variable, and this variability is driven by several factors, including weather, the types of crops grown, water costs, and total crop acreage.
AGriCulturAl effiCienCy imProvementsOver the past 50 years, California agriculture has made significant water-use efficiency improvements. There are a variety of ways to evaluate these efficiency improvements. As one example, we analyzed the economic productivity of water. Figure 2 shows the value added to the U.S. economy for crop production in California per acre-foot of water between 1960 and 2010.3 All values have been adjusted for inflation and are shown in year 2009 dollars. During the 1960s, the economic productivity of water averaged $420 per acre-foot. Economic productivity increased considerably in the 1970s and 1980s but remained consistently below $700 per acre-foot. In every year since 2003, however, it has exceeded $700 per acre-foot. This trend was driven by several factors, including a shift toward higher-value crops and the increased adoption of more-efficient irrigation technologies and practices (see Box 1 for a description of some of these efficiency measures). For example, the total and percentage of cropland using flood irrigation has steadily declined, replaced by precision drip and micro-sprinkler irrigation systems (Figure 3).
Note: All values shown in year 2009 dollars.
Source: Crop production values are based on figures from u.s. Department of Agriculture (2014). Values for agricultural water use for 1960 – 1995 are based on estimates from DWr bulletin 160 (DWr 1964, 1970, 1974, 1983, 1987, and 1993). Water use values for 1998 – 2010 are based on DWr statewide Water balances data (DWr, 2014).
figure 2. economic productivity of water in California agriculture, 1960–2010
900
800
700
600
500
400
300
200
100
0
Crop
Pro
duct
ion
Per U
nit W
ater
($ p
er a
cre-
foot
)
1960 1965 1970 1975 1980 1985 1990 1995 2000 2005 2010
NRDC-4

PAGe 4 | Agricultural Water Conservation and efficiency Potential in California
AGriCulturAl effiCienCy PotentiAlWater efficiency improvements can provide a number of important benefits to farmers. In particular, they can increase yields and improve crop quality while at the same time reducing fertilizer, water, and in some cases, energy costs, resulting in higher profits. Additionally, efficiency can improve the reliability of existing supplies and reduce vulnerability to drought and other water-supply constraints.
Water efficiency improvements can result in reductions in both consumptive and non-consumptive water use. Reductions in consumptive use provide additional water supply that can become available for other uses, but there
are also compelling reasons to seek reductions in non-consumptive use. In particular, any reduction in demand lessens the amount of water taken from ecosystems or pumped out of the ground, and the need for investment in new infrastructure to capture, store, and distribute that water. It can also allow greater flexibility in managing water deliveries and reduce vulnerability to drought. Furthermore, improvements in water use efficiency can improve the timing and maximize the amount of water left in the natural environment, providing benefits to downstream water quality, the environment, recreation, and even upstream use.
Over the past 15 years, several studies have quantified the agricultural efficiency potential in California, including
Note: These data do not include rice acreage, which is grown using flood irrigation. if rice acreage were included, the percent of crop land using flood irrigation would be higher.
Source: Tindula et al. (2013).
figure 3. irrigation methods for irrigated crops grown in California in 1991, 2001, and 2010
Many options are available for improving the efficiency of water use in California agriculture, including efficient irrigation technologies, improved irrigation scheduling, regulated deficit irrigation, and practices that enhance soil moisture. for example, weather-based irrigation scheduling uses data about local weather conditions to determine how much water a crop needs. The California Department of Water resources maintains the California irrigation Management information system (CiMis) to provide this information to growers. This service is free and available online to the
public, but other kinds of weather-based systems are also available from irrigation consultants who may set up additional weather stations to provide even more precise local information.
Additionally, regulated deficit irrigation imposes water stress on certain crops that have drought-tolerant life stages, e.g., wine grapes and some nuts. This approach is widely practiced in many Mediterranean and semi-arid climates around the world, including more and more applications in California, providing improvements in crop quality and/or yield along with significant water savings (Cooley et al. 2009). furthermore, certain irrigation technologies, such as sprinkler and drip irrigation systems, tend to have higher distribution uniformities and water-use efficiencies than traditional flood, or gravity, irrigation systems. Drip irrigation, for example, slowly releases low-pressure water from plastic tubing placed near the plant’s root zone, allowing for the precise application of water and fertilizer to meet crop needs. realizing the full water savings from these irrigation technologies requires proper management and maintenance.
80%
70%
60%
50%
40%
30%
20%
10%
0
Perc
enta
ge o
f Irr
igat
ed C
rop
Are
a
1990 1995 2000 2005 2010
2%
16%
33%
49%
67% Flood Microsprinkler and Drip Sprinkler Subsurface
17%
15%1%
43%38%
15%
3%
!"%,*&++#%,)
NRDC-4

PAGe 5 | Agricultural Water Conservation and efficiency Potential in California
7
6
5
4
3
2
1
0
App
lied
Wat
er S
avin
gs (m
illio
n ac
re-f
eet p
er y
ear)
Wet Year
0.9
2.7
0.9
1.1
3.4
1.1
1.2
3.6
1.2
Dry YearAverage Year
■ E�cient Irrigation Technology ■ Improved Irrigation Scheduling ■ Regulated De�cit Irrigation
two studies in support of the CALFED Bay-Delta Program and a third study by the Pacific Institute. All of these studies examined efficiency improvements, i.e., measures that reduce water use without affecting the benefits water provides, and did not include any changes in crop type or irrigated acreage. The first of these, the CALFED Water Use Efficiency Program Plan, was released in 2000; it had a limited geographic scope, including only those areas that would affect Bay-Delta water supplies. Further, the analysis was designed to capture 70 percent of the efficiency potential in the region and to include only those efficiency practices that were “locally cost-effective” or for which CALFED could provide financial incentives. The study found that on-farm and district-level efficiency measures could reduce agricultural water use by 4.3 million acre-feet per year. Of that amount, 0.4 million acre-feet were reductions in consumptive use that could be available to other uses. Expanding this analysis to the entire state and including opportunities to capture the full percent of the efficiency potential, we estimate that the technical efficiency potential is 6.6 million acre-feet per year, of which 0.6 million acre-feet is a reduction in consumptive use.4
In 2006, CALFED released its Water Use Efficiency Comprehensive Evaluation. This study focused on the entire state and evaluated efficiency actions under different
policies and investment levels. One scenario examined the statewide technical potential in agriculture, defined as all of the technically demonstrated practices that could be implemented regardless of cost. The authors estimated that irrigation water use in California could be reduced by 6.3 million acre-feet per year, of which 2.0 million acre-feet per year would be reductions in consumptive use, freeing up water that could be available to other uses. In 2009, the Pacific Institute released Sustaining California Agriculture in an Uncertain Future, a comprehensive analysis of the water savings potential of increased adoption of three on-farm technology and management practices:
n irrigation technology: shifting nearly 1.1 million acres of land currently irrigated by flood to drip and 2.2 million acres of land irrigated by flood to sprinklers;
n irrigation scheduling: expanding to all California farms the application of irrigation scheduling, using local climate and soil information to determine crop water requirements.
n regulated deficit irrigation: applying less water to all wine grape, raisin, almond, and pistachio acreage in California during drought-tolerant growth stages to save water and improve crop quality.
Source: Cooley et al. (2009).
figure 4. Potential reductions in agricultural water use (in million acre-feet) in wet, average, and dry years
NRDC-4

PAGe 6 | Agricultural Water Conservation and efficiency Potential in California
The authors did not examine the full technical efficiency potential (e.g., a scenario in which all farmers use drip irrigation), but used assumptions consistent with a more rapid uptake of proven efficiency measures. The combined potential savings from these three technology and management scenarios was between 4.5 million acre-feet in a wet year and 6.0 million acre-feet in a dry year (Figure 4). In total, these scenarios would reduce agricultural water use by 17 percent in all year types. While all practices produced considerable water savings, the greatest savings were associated with better irrigation scheduling (2.7 to 3.6 million acre-feet per year). The authors did not distinguish between reductions in consumptive and non-consumptive use due to data limitations, but there is evidence that significant consumptive savings are possible, especially with regulated deficit irrigation. Adopting this practice on California’s entire wine grape, almond, and pistachio acreage would reduce consumptive use by 1.1 million acre-feet per year. Reductions in consumptive use would also result from the other practices.
ConClusionsAgriculture can significantly improve water-use efficiency while maintaining or even increasing productivity. Improved technology and management practices are already contributing to a trend toward improved efficiency, but much more can be done. On the basis of a review of previous efficiency studies, we estimate that agricultural water use could be reduced by 5.6 million to 6.6 million acre-feet per year, or by about 17 to 22 percent, while maintaining productivity and total irrigated acreage.5 Part of these savings are reductions in consumptive use, ranging from 0.6 million to 2.0 million acre-feet per year, which represents additional supply that can become available for other beneficial uses. The rest reflect a reduction in water required to be taken from rivers, streams, and groundwater, with improvements in water quality, instream flow, and energy savings, among other benefits. In addition to reducing water use, efficiency improvements can increase crop yield and quality while reducing input costs, resulting in higher profits.
NRDC-4

PAGe 7 | Agricultural Water Conservation and efficiency Potential in California
references
California Department of food and Agriculture (CDfA). 2013. California Agricultural Statistics Review: 2013–2014.
CALfeD bay-Delta Program. 2000. Water Use Efficiency Program Plan. final Programmatic eis/eir Technical Appendix.
CALfeD bay-Delta Program. 2006. Water Use Efficiency Comprehensive Evaluation. CALfeD bay-Delta Program Water use efficiency element.
H. Cooley, J. Christian-smith, and P.H. Gleick. 2009. Sustaining California Agriculture in an Uncertain Future. Pacific institute.
California Department of Water resources (DWr). 1964. California Water Plan Update, bulletin 160-64.
Department of Water resources (DWr). 1970. California Water Plan Update, bulletin 160-70.
Department of Water resources (DWr). 1974. California Water Plan Update, bulletin 160-74.
Department of Water resources (DWr). 1983. California Water Plan Update, bulletin 160-83.
Department of Water resources (DWr). 1993. California Water Plan Update, bulletin 160-93..
Department of Water resources (DWr). 1998. California Water Plan Update, bulletin 160-93.
Department of Water resources (DWr). 2014. Statewide Water Balances, 1998–2010.
M.N. Orang et al. 2013. “California simulation of evapotranspiration of Applied Water and Agricultural energy use in California,” J Integr Agric 12: 1371–1388. doi: 10.1016/s2095-3119(13)60742-X.
G.N. Tindula, M.N. Orang, and r.L. snyder. 2013. “survey of irrigation Methods in California in 2010,” ASCE Journal of Irrigation and Drainage Engineering 139: 233-238.
u.s. Department of Agriculture. 2014. U.S. and State Farm Income and Wealth Statistics, www.ers.usda.gov/data-products/farm-income-and-wealth-statistics.aspx#.u1cAf1e41Tu (accessed April 22, 2014).
endnotes
1 under state legislation passed in 2009, referred to as sbx7-7, agricultural water suppliers providing water to 25,000 irrigated acres or more (excluding acres that receive only recycled water) are required to measure the volume of water delivered to their customers. While these requirements went into effect on July 1, 2012, many water districts are not yet providing that information to the state.
2 Note that all studies described in this paper developed examined the efficiency potential based on the DWr bulletin 160 water use estimates and thus percent reductions are based on these data.
3 The value of crop production is the gross value of the commodities produced within a year.
4 The CALfeD record of Decision examined the potential to capture 70 percent of the efficiency potential in a region that accounted for approximately 93 percent of the state’s agricultural water use. We estimated the full technical potential (100 percent efficiency potential for the entire state) for reducing agricultural water according to the following: 4.3 million acre-feet/(0.7*0.93) (or 6.6 million acre-feet). Likewise, we estimate the full technical potential to reduce consumptive use by the following: 0.4/(0.7*0.93) (or 0.6 million acre-feet).
5 Additional water savings could be achieved by temporarily or permanently fallowing land or switching crop types.
Authors and Acknowledgements
The lead author of this report is Heather Cooley, with additional contributions by Peter Gleick and robert Wilkinson. support for this work was provided by the Pisces foundation. Numerous individuals provided comments on this report; we thank them for their input.
NRDC-4

natural resources defense Council40 West 20th streetNew York, NY 10011212 727-2700fax 212 727-1773
beijing
Chicago
Los Angeles
bozeman
san francisco
Washington, D.C.
www.nrdc.org
www.nrdc.org/policy www.facebook.com/nrdc.org www.twitter.com/nrdc
Pacific institute654 13th street, Preservation ParkOakland, CA 94612, usAPhone: 510-251-1600fax: 510-251-2203
www.pacinst.orgwww.californiadrought.org
www.facebook.com/Pacificinstitutewww.twitter.com/Pacificinstitut
Printed on recycled paper
NRDC-4

Improving urban water-use efficiency is a key solution to California’s short-term and long-term water challenges: from drought to unsustainable groundwater use to growing tensions over limited supplies. Reducing unnecessary water withdrawals leaves more water in reservoirs and aquifers for future use and has tangible benefits to fish and other wildlife in our rivers and estuaries. In addition, improving water-use efficiency and reducing waste can save energy, lower water and wastewater treatment costs, and eliminate the need for costly new infrastructure.
Urban Water Conservation and Efficiency Potential in California
Issue bRIef june 2014 Ib:14-05-D
Californians across the state are replacing their lawns with beautiful, low water-use, environmentally-friendly gardens. © 2011 J.A. Howard-Gibbon, reused with permission. http://namethatplant.wordpress.com/
NRDC-4

PAGe 2 | urban Water Conservation and efficiency Potential in California
Between 2001 and 2010, California’s urban water use averaged 9.1 million acre-feet per year, accounting for about one-fifth of the state’s developed water use (DWR 2014). Based on our analysis, we found that businesses and industry can improve their water-use efficiency by 30 to 60 percent by adopting proven water-efficient technologies and practices. Residents can improve their home water efficiency by 40 to 60 percent by repairing leaks, installing the most efficient appliances and fixtures, and by replacing lawns and other water-intensive landscaping with plants requiring less water. In addition, water utilities can expand their efforts to identify and cut leaks and losses in underground pipes and other components of their distribution systems. Together, these measures could reduce urban water use by 2.9 million to 5.2 million acre-feet per year. All of this could be accomplished through more widespread adoption of technology and practices that are readily available and in use in California and around the world.
urbAn WAter use in CAliforniAAccording to the most recent estimates from the California Department of Water Resources (DWR), water use in cities and suburbs accounts for one-fifth of water withdrawals in most years. Between 2001 and 2010, urban water use ranged from 8.3 million to 9.6 million acre-feet per year, and averaged 9.1 million acre-feet per year (DWR 2014). Of the
water delivered to urban areas each year, most is used in and around our homes, with residential water use accounting for 64 percent of total urban use. Together, institutions (such as schools, prisons, and hospitals) and commercial businesses (such as hotels, restaurants, and office buildings) account for about 23 percent of California’s urban water use. Another 6 percent is used by industry to manufacture a wide range of products, from chemicals and electronics to food and beverages. About 2 percent of water withdrawals for urban use are lost in conveyance, through seepage or evaporation from canals, another 2 percent is used for energy production, and another 3 percent is used to replenish groundwater aquifers (DWR 2014). The majority of the state’s urban water use is in the South Coast hydrologic region, home to over half of the state’s population (Figure 2). The second highest user is the 9-county San Francisco Bay region, home to over 6 million people.
About half of California’s urban water use, equivalent to 4.2 million acre-feet per year, is outdoors, largely for watering landscapes, but also for such uses as washing cars or sidewalks, and filling pools or spas. About 70 percent of outdoor use is residential, representing both single- and multi-family homes. Commercial businesses and institutions account for the remaining 30 percent of outdoor water use. The highest rates of outdoor use are in the hot, dry areas of the state and in communities where water is inexpensive. In these areas, outdoor water use can account for up to 80 percent of the total (Hanak and Davis 2006).
figure 1. California’s population and urban water use from 1970 to 2010
Source: urban water use estimates from DWR spreadsheet statewide Water balance (1998-2010) (DWR 2014). Population estimates from California Department of finance spreadsheet e-7. California Population estimates (DOf 2013).
Population
Urban Water Use
45
40
35
30
25
20
15
10
0
10
8
6
4
2
0
1970 1980 1990 2000 2010
Popu
lati
on (m
illio
ns)
Urban W
ater Use (m
afy)
NRDC-4

PAGe 3 | urban Water Conservation and efficiency Potential in California
According to DWR estimates, on a statewide basis, urban water use has grown roughly in proportion to population since 1970 (Figure 1). Per-capita urban use averaged 220 gallons per capita per day (gpcd) in the 1980s, declined to 200 gpcd in the 1990s, and rose to 230 gpcd in the first decade of the 2000s. While a number of urban areas have mounted aggressive water conservation campaigns and lowered per-capita use, this has been offset by rapid population growth occurring in hot, dry inland areas with higher outdoor water use. California’s urban water use showed a steady decline in the last three years for which data is available, in the years 2008, 2009, and 2010. This decline can be explained by a combination of the economic slowdown and drought restrictions in place at the time, and it remains to be seen whether, on a statewide basis, urban use has continued to decline since 2010 or whether water use has “rebounded” as the economy improved and drought restrictions were lifted beginning around 2011.
The intensity of water use varies by region. Between 2001 and 2010, per capita water use for all urban uses averaged 230 gpcd, but varied widely around the state, ranging from 170 gpcd in the San Francisco Bay area to over 300 gpcd or more in some hot, dry inland areas of Southern California (Figure
2).1 The rate of per-capita use is lower in the coastal regions than in the mountain counties of the Lahontan region, or in the inland valley regions. However, the coastal regions have much larger populations, and thus higher total water use.
QuAntifyinG the urbAn effiCienCy PotentiAlWhat is the technical potential for improving the efficiency of water use in urban California? In 2003, the Pacific Institute conducted the first comprehensive assessment of the statewide urban water efficiency potential (Gleick et al. 2003), and found that technologies available at the time could reduce urban water use by one-third at lower cost than developing new supplies and with fewer social and environmental impacts. Today, some of the potential identified in 2003 has been captured, although newer, more efficient technologies and practices have also been introduced into the marketplace. For example, today’s Energy Star clothes washers use only 15 gallons of water per load, a significant savings over standard machines and even those manufactured 10 years ago (Energy Star 2013).
figure 2. urban per capita water use (in gallons per capita per day) and total water use (in thousand acre-feet per year) by hydrologic region, averaged for the years 2001–2010
Source: DWR Water use balances for Planning Areas, 1998–2010 (DWR 2014) and us Census bureau (2010 population by Census Tract).
Yuba CityYuba City
TulareTulareLakeLake SouthSouth
LahontanLahontan
ColoradoColoradoRiverRiver
SacramentoSacramentoRiverRiver
NorthNorthCoastCoast
South CoastSouth Coast
CentralCentralCoastCoast
NorthNorthLahontanLahontan
SanSanJoaquinJoaquinRiverRiverSan San
FranciscoFranciscoBayBay
MercedMerced
EurekaEureka
FresnoFresno
ModestoModesto
ReddingRedding
San JoseSan Jose
StocktonStockton
LancasterLancaster
SacramentoSacramento
Santa MariaSanta Maria
BakersfieldBakersfield
Los AngelesLos AngelesPalm SpringsPalm Springs
Santa BarbaraSanta Barbara
San DiegoSan Diego
VictorvilleVictorville
San FranciscoSan Francisco
SanSanBernardinoBernardino
320 300
300170
290
390210
190 810
180
Population Density1 Dot = 1,000 people
Per Capita Uban Water Useby Hydrologic Region, in gallons per capita per day (gpcd)
100
250
500
TulareTulareLakeLake SouthSouth
LahontanLahontan
ColoradoColoradoRiverRiver
SacramentoSacramentoRiverRiver
NorthNorthCoastCoast
SouthSouthCoastCoast
CentralCentralCoastCoast
NorthNorthLahontanLahontan
San JoaquinSan JoaquinRiverRiverSanSan
FranciscoFranciscoBayBay
740740 280280
670670
900900
160160
630630
4343
300300
1,2001,200
4,2004,200
Total Urban Water Useby Hydrologic Region, in thousand acre-feet per year (tafy)
Per Capita Use (gpcd)
Total UrbanUse (tafy)
NRDC-4

PAGe 4 | urban Water Conservation and efficiency Potential in California
To inform ongoing discussions in California about the drought and longstanding challenges facing the water sector, we have updated the 2003 estimates of the urban water conservation and efficiency potential using new data from state agencies to model the effect of increased deployment of water-efficient technologies. We based our estimates on water use and demographic data averaged over the period 2001 – 2010, the most recent time period for which reliable information is available. Our focus here is on technological solutions for using water more efficiently, rather than on behavioral changes, such as shorter showers. However, decades of experience show that educational campaigns and economic incentives can also influence people’s behavior and reduce waste. We did not examine the potential water savings in the areas of conveyance, energy production, and groundwater recharge, which account for an average 8 percent of withdrawals for urban water use in California.
indoorFor this analysis, we examined the potential to reduce indoor and outdoor water use in urban areas in California. For indoor use, we estimated how much water could be saved by retrofitting homes with the latest models of water-efficient appliances and fixtures. We estimated the efficiency potential using two different methods. For the first method, we focused on individual end uses of water and estimated how much water would be saved if every household in California were upgraded to more efficient fixtures. To do this, we used estimates of the current “market penetration” of various types of appliances and fixtures in California homes, for example, the average flow volume of toilets in homes today. We also used information on average use, such as the number of times an average person flushes the toilet. This type of information is highly variable, but averages can help us to model water use and potential savings. We drew upon information from several recent surveys and studies, including the California Single-Family Water Use Efficiency Study (DeOreo et al. 2011), which reports detailed
information on water use in more than 700 homes. Additional information on household water use came from a journal article that summarized statistical studies of the showering and bathing behaviors of Americans (Wilkes, Mason, and Hern 2005).
Staying with our toilet example, data indicate that an average Californian flushes 4.8 times per day, and that the average flush volume is 2.8 gallons per flush. Upgrading an old, inefficient toilet to a 1.28-gallon-per-flush model would save 7.3 gallons per person per day. Multiplying this by the average population over the study period (36 million people) gives us a potential savings of 260 million gallons per day, or 0.29 million acre-feet per year. 2 We performed similar calculations for all the major end uses of water where a conserving technology is available—clothes washers, showers, bath and kitchen faucets, and dishwashers. In each case, we estimated the savings by upgrading to the latest widely-available water-efficient model with an Energy Star or EPA Water Sense label. We also calculated the effect of eliminating water loss from leaky pipes and fixtures; while most residents are unaware of leaks, studies show that they are present in the majority of homes (Mayer et al. 1999; DeOreo et al. 2011). We found a total potential statewide indoor water savings of 33 gpcd, or 1.3 million acre-feet per year.
We used a second method to estimate residential indoor water savings potential, an approach based on a “water budget” for a typical home using water-efficient appliances and fixtures. Table 1 shows our theoretical per capita water budget for an “average” California household that uses widely-available water-efficient appliances and fixtures, such as Water Sense-labeled toilets and showerheads, and an Energy Star clothes washer. We estimate than an average California resident living in a highly-efficient home would use about 32 gallons per day indoors. We calculated the potential savings by comparing this with official estimates of water use in each hydrologic region (DWR 2014). For example, residential indoor use in the Central Coast Hydrologic Region averaged 55 gpcd. This means that the average Central Coast
table 1. Water budget for one person using efficient appliances and fixtures
end use Assumptions Gallons per person per day
Leaks Reduced to zero 0
Toilets 4.8 flushes per day @ 1.28 gallons per flush 6.1
Clothes washer 2.3 loads per week @ 14.4 gallons per load 4.7
shower 4.7 showers per week for 8.7 minutes each with conserving showerhead rated at 2.0 gpm and throttle factor of 72% for actual flow rate of 1.44 gpm
8.4
bath 2.24 baths per week @ 18 gallons each 5.8
faucets 10.1 minutes per day at an average flow rate of 0.64 gpm 6.5
Dishwasher 0.85 times per week @ 3.5 gallons per load 0.4
total efficient household Water budget 32
Note: Average duration and frequency of usage were derived from the California Single Family Water Use Efficiency Study (DeOreo et al. 2011) and a 2005 article in the journal Risk Analysis whose authors summarized statistical studies of the showering and bathing behavior of Americans (Wilkes, Mason, and Hern 2005).
NRDC-4

PAGe 5 | urban Water Conservation and efficiency Potential in California
household, by lowering indoor water use to 32 gpcd, would save 20 gallons per person per day. Using the water-budget based method, we found average statewide indoor water savings potential of 40 gpcd, or 1.6 million acre-feet per year.
Each of these methods has advantages and disadvantages. The first method does not consider regional variation in water use, and so does not take into account the significant progress that has already been made in improving water efficiency in some regions. The second, water-budget-based approach looks only at typical water uses and does not take into account some of the other ways that people use water at home, such as water softeners or water treatment systems that increase water use, medical devices, or a hobby or home business. However, each of these methods gives us a theoretical efficiency potential. While we do not expect 100 percent saturation of these solutions in the real world, these calculations highlight the total savings possible through the adoption of more efficient appliances and fixtures.
Significant indoor water savings are also available in the commercial, industrial, and institutional sectors. Limited data are available on water use and the potential efficiency savings for these sectors. The most recent quantitative assessment of commercial and industrial water conservation and efficiency potential in California was done by the
Pacific Institute in 2003 (Gleick et al. 2003), and the authors’ estimates have been adopted by state water planners. Using the estimates from this report, along with updated data on water use, we estimated that commercial indoor water efficiency could be improved by 30 to 50 percent, and industrial efficiency could be improved by 25 to 50 percent.
outdoorTo estimate the potential to reduce outdoor water use, we used the landscape water budget method, where plant species are classified by their water needs and assigned a “water-use factor.” The water-use factor is the ratio of the plant’s water needs to that of a well-watered grass crop, or “reference evapotranspiration” and varies with location, weather, and other factors (Costello et al. 2000). High water-demand plants, such as cool-season grass or vegetable gardens, have water-use factors of 1 or more, while low water-use plants may have factors as low as 0.1 and require little or no supplemental irrigation. Recent studies have found that residential landscapes in California have an average water use factor of around 1.0, as many homeowners have lawns, and medium water-use trees, shrubs, and perennials (DeOreo et al. 2011, 161). For this analysis, we calculated the potential
figure 3. California’s urban water conservation potential by sector
Note: We did not evaluate water savings in the areas of conveyance, energy production, and groundwater recharge, which account for 8 percent of withdrawals for urban water use in California.
ResidentialIndoor
ResidentialOutdoor
Commercial & Institutional
Landscapes
Commercial& Institutional
Indoor
Industrial Conveyance Losses,Energy Production, andGroundwater Recharge
Thou
sand
acr
e-fe
et p
er y
ear (
tafy
0
500
1,000
1,500
2,000
2,500
3,000
2,900 2,900
530
1,600
2,000
900
550
400270 ? ?
360380
880
1,300
690780
1,300
■ Estimated Current Water Use
■ E�cient Water Use
■ Highly-E�cient Water Use
NRDC-4

PAGe 6 | urban Water Conservation and efficiency Potential in California
water savings of converting to water-efficient landscapes with an average water-use factor of 0.7, the maximum level allowed under the state’s Model Water Efficient Landscape Ordinance and is required for new large and commercial landscapes in California (A.B. 1881, the Water Conservation in Landscaping Act of 2006). We also modeled the impact of a more extensive landscape conversion alternative, where landscapes are re-planted with low water-use plants with an average water-use factor of 0.3. This level of water use encompasses a broad range of California-native and Mediterranean plants (for example, the garden on page 1). Besides having colorful blooms that attract birds and pollinators, these plants have other benefits, such as ease of maintenance and less need for fertilizers and pesticides. We estimated that moderate landscape conversions could reduce outdoor water use by 30 percent, while more extensive conversions could reduce outdoor use by 70 percent.
system lossesFor every water utility, a certain amount of high-quality water is lost from the system of underground pipes that distributes water to homes and businesses. This is a national problem, with an average of 17 percent of water pumped by utilities
South Coast1,400–2,400 tafy
Central Coast110–160 tafy
San FranciscoBay
440–600 tafy
North Coast49–86 tafy
Tulare Lake210–500 tafy
North Lahontan12–26 tafy
South Lahontan90–150 tafy
Colorado River150–310 tafy
Sacramento River300–560 tafy
San Joaquin River180–430 tafy
Potential Urban Water Savingsby Hydrologic Region, in thousand acre-feet per year (tafy)
Residential IndoorResidential OutdoorCommercial & Institutional LandscapesCommercial & Institutional IndoorIndustrial
figure 4. Potential urban water savings by hydrologic region, in thousands of acre-feet per year (tafy)
in the United States lost to leaks (Baird 2011). A 2009 study found that California water utilities lose an estimated total of 0.87 million acre-feet per year (Water Systems Optimization Inc. 2009), equivalent to about 21 gallons per capita per day. The authors estimated that 40 percent of that lost water, or 0.35 million acre-feet per year, could be recovered economically. Some California utilities are making progress in identifying and reducing water losses. For example, the Los Angeles Department of Water and Power, which provides water to four million people, has implemented a program to conduct water system audits; replace old, inaccurate meters; install fire hydrant shutoffs; and detect and repair distribution system leaks (LADWP 2011). Continued efforts to reduce losses should be a priority for utilities, as investments in finding and repairing these leaks can pay for themselves in terms of reduced costs in just a few years (Dickinson 2005). While there is strong evidence for the water savings associated with utility-scale leak reduction, we have not incorporated these estimates into the totals presented in this paper.
urbAn effiCienCy PotentiAlMany water utilities have made considerable progress in improving water-use efficiency over the past few decades, holding their total water use at or near constant levels even while population has increased. For example, water use in the city of Long Beach has held steady since 1970, despite the fact that population has grown by 40 percent. In San Francisco, water use has decreased since the 1970s despite population gains. Both cases can be explained by decreasing per-capita water use—San Francisco’s water use averaged nearly 140 gpcd in the 1980s, and decreased to 86 gpcd by 2010 (SFPUC 2011, 33). More can be done—as has been shown in many other industrialized countries, where per capita water use is significantly lower than in California.
We estimate that existing technologies and policies can reduce current urban water use in California by 2.9 million to 5.2 million-acre-feet per year. Between 70 and 75 percent of the potential savings, or 2.2 million to 3.6 million acre-feet per year, are in the residential sector, which includes all types of residences, from detached single-family homes to high-rise apartment buildings (Figure 3). The remainder of the savings potential (0.74 million to 1.6 million acre-feet) comes from efforts to improve efficiency among commercial, institutional, and industrial users. The greatest savings potential is in the South Coast region, due to its large population, but significant water savings are available in all 10 of California’s hydrologic regions (Figure 4). In the following sections, we provide additional detail on the savings potential for each sector.
NRDC-4

PAGe 7 | urban Water Conservation and efficiency Potential in California
residential Water savingsThere are many ways to reduce water waste and improve efficiency at home. Over the past several decades, many Californians have lowered their water use by installing efficient showerheads, toilets, and washing machines, or by replacing their lawn with low water-use plants. However, there is still considerable room for improvement. For example, recent in-home measurements indicate that nearly half of California’s households still use old, inefficient toilets that waste water with every flush (DeOreo et al. 2011, 137–138). Additionally, many homeowners and commercial developments still have large expanses of lawn, and the result is that outdoor water use accounts for nearly half of urban water use in California.
The residential sector is the largest urban water-use sector, using an average of 5.8 million acre-feet per year, and it offers the largest volume of potential savings. We estimated that widespread adoption of water-efficient appliances and fixtures in California homes, combined with replacement of lawns with low-water landscapes, could reduce total residential water use by 40 to 60 percent, saving 2.2 million to 3.6 million-acre-feet per year. We found that the average Californian could cut home water use by 50 to 90 gpcd (Figure 5). Repairing leaks could reduce home water use by 11 gpcd, while installing efficient toilets and clothes washers could each reduce home water use by about 7 gpcd. Additional savings are available by installing more efficient showerheads, faucets, and dishwashers. But the biggest savings come from reducing outdoor water use. Moderate landscape conversions could lower outdoor water use by 30 percent, and more comprehensive conversions could save 70 percent. Much of the outdoor savings potential is in Central and Southern California, which has a hot, dry climate, and is home to two-thirds of the state’s population (Figure 4).
Based on the our calculations above, a Californian living in an efficient home would use 50 to 90 gpcd, down from the current average of 140 gpcd. Is such a dramatic reduction possible in the Golden State? International experience demonstrates that these savings are feasible. Australian households use an average of 54 gpcd (for both indoor and outdoor uses), and residents of the Australian state of Victoria use only 40 gpcd (Australian Bureau of Statistics 2013). Australians have not always been water misers—a few decades ago their water use looked much like California’s—but they have lowered their consumption dramatically over the past decade in response to their unprecedented Millennium Drought by adopting new water-efficient technologies and water-saving habits (Heberger 2011). For example, dual-flush toilets are now found in nine out of ten Australian homes.
CommerCiAl, industriAl, And institutionAl WAter sAvinGsAbout a quarter of all California’s urban water use is in the commercial and institutional sectors, and about 6 percent is used for industry. There are many ways that these sectors can save water, reflecting the diversity of ways in which water is used. Some of these measures mirror residential water conservation efforts, such as installing efficient toilets and urinals, while others are customized to meet a particular industry’s needs. For example, restaurants have lowered water and energy bills by installing water-efficient pre-rinse spray valves, ice machines, dishwashers, and food steamers (CII Task Force 2013, Vol III, p. 74–133). One of the biggest areas for potential savings is in the cooling water used in many industrial processes and in large air conditioning systems. Methods are available to cycle water longer in cooling towers by carefully adjusting its chemistry and limiting the amount of “make-up” water needed (Koeller et al. 2007). Using efficiency estimates from previous assessments, along with updated data on water use, we estimated that
figure 5. residential water conservation potential in California, in gallons per capita per day (gpcd)
Conveyance Losses,Energy Production, andGroundwater Recharge
33–40gpcd
Indoor
Outdoor/Landscapes
Dishwashers
Faucets
Showers
Clothes Washers
Toilets
Leak Repair
0.3 gpcd
4.0 gpcd
4.1 gpcd
6.8 gpcd
7.3 gpcd
11 gpcd
20–50gpcd
■ Estimated Current Water Use
■ E�cient Water Use
■ Highly-E�cient Water Use
household savings
savings inside the home
Note: The white line for household savings represents the low end of the range.
NRDC-4

PAGe 8 | urban Water Conservation and efficiency Potential in California
commercial water use can be reduced by 30 percent to 50 percent, and industrial use reduced by 25 percent to 50 percent (Gleick et al. 2003), saving an estimated 0.74 to 1.6 million acre-feet per year. Increasing water efficiency means that businesses can continue to provide the same products and services while using less water.
An expert panel recently convened by the state recommended several practices to reduce water use in the commercial, industrial, and institutional sectors (CII Task Force 2013, Vol. II). First, companies should fix leaks and make adjustments or repairs to control water loss. Second, old or inefficient equipment should be retrofitted or, third, replaced. Fourth, industrial water users should investigate the feasibility of treating and reusing water onsite or using recycled municipal wastewater or other non-potable supplies. Fifth, some industries can replace existing equipment with waterless processes, for example, by replacing cooling towers with air-cooling or geothermal cooling systems, or by installing dry vacuum pumps in laboratories and medical facilities (CII Task Force 2013, Vol. II, 69). In many cases, businesses that invest in water efficiency can improve their own bottom line through lower water and energy bills and reduced costs for chemicals and water purification.
ConClusionsThere remains a tremendous untapped potential to increase water-use efficiency at home, in businesses, and in government. In the commercial, institutional, and industrial sectors, prior analysis has demonstrated that efficiency could be increased 30 to 60 percent. This would save an estimated 0.74 million to 1.6 million acre-feet per year. At home, widespread adoption of water-saving appliances and fixtures, along with replacement of lawns with water-efficient landscapes, could reduce total residential water use by 40 to 60 percent, saving 2.2 million to 3.6 million acre-feet per year. Altogether, these efficiency improvements could save 2.9 million to 5.2 million acre-feet per year. Improving water-use efficiency makes our cities more resilient to drought, saves energy and reduces greenhouse gas emissions, lowers the cost of water treatment and new infrastructure, and frees up water to flow in our rivers and estuaries to benefit fish, wildlife, and recreational users.
outdoor Conservation PotentialHalf of all water used in California’s urban areas is for outdoor use. some of this is used for washing cars or sidewalks, or for filling pools and spas, but the vast majority is for landscape irrigation. big savings are possible in outdoor water conservation in homes, businesses, and institutions (Table 2). We estimate that moderate landscape conversions could save 1.3 million acre-feet per year, equivalent to a statewide per capita water use of 30 gpcd. More extensive landscape conversion, i.e., converting to all low water-use plants, could save a total of 2.9 million acre-feet per year, reducing per capita water use by 72 gpcd. The largest outdoor savings potential is at residences (0.9 million to 2 million acre-feet per year). An additional 0.4 million to 0.9 million acre-feet per year can be saved by commercial and institutional landscapes. The greatest potential savings are in the south Coast hydrologic region, followed by the san francisco and sacramento River hydrologic regions.
table 2. urban outdoor water conservation potential by hydrologic region, in thousand acre-feet per year (tafy)
hydrologic regionmoderate Conversions
extensive Conversions
North Coast 15 34
san francisco 140 330
Central Coast 42 97
south Coast 560 1,300
sacramento River 150 340
san Joaquin River 81 190
Tulare Lake 100 240
North Lahontan 4 9
south Lahontan 57 130
Colorado River 110 260
California statewide 1,300 2,900
NRDC-4

PAGe 9 | urban Water Conservation and efficiency Potential in California
references
Australian bureau of statistics. 2013. “Water,” chapter 2 in Information Paper: Towards the Australian Environmental-Economic Accounts, Canberra: Commonwealth of Australia, www.abs.gov.au/ausstats/[email protected]/Latestproducts/4655.0.55.002Main%20features42013?opendocument&tabname=summary&prodno=4655.0.55.002&issue=2013&num=&view=.
baird, G.M. 2011. “Money Matters–Who stole My Water? The Case for Water Loss Control and Annual Water Audits,” Journal-American Water Works Association 103 (10): 22–30.
CII Task force. 2013. Commercial, Industrial and Institutional Task Force: Water Use Best Management Practices, Report to the Legislature, California Department of Water Resources, www.water.ca.gov/wateruseefficiency/sb7/committees/urban/u1/.
Costello, L.R., N.P. Matheny, J.R. Clark, and K.s. Jones. 2000. A Guide to Estimating Irrigation Water Needs of Landscape Plantings in California: The Landscape Coefficient Method and WUCOLS III, university of California Cooperative extension and California Department of Water Resources, www.water.ca.gov/wateruseefficiency/docs/wucols00.pdf.
DeOreo, W.b., P.W. Mayer, L. Martien, M. Hayden, A. funk, M. Kramer-Duffield, R. Davis, et al. 2011. California Single Family Water Use Efficiency Study, California Department of Water Resources/u.s. bureau of Reclamation Calfed bay-Delta Program, http://www.aquacraft.com/sites/default/files/pub/Calsf%20Water%20study%20%20Report%20body%20120811.pdf
Department of finance (DOf). 2013. “P-3, Population Projections by Race / ethnicity, Gender and Age for California and Its Counties 2010–2060.” California Department finance. http://www.dof.ca.gov/research/demographic/reports/projections/p-3/.
Dickinson, M.A. 2005. “Redesigning Water Loss standards in California using the New IWA Methodology.” In Proceedings of the Leakage 2005 Con-ference. Halifax, Nova scotia: The World bank Institute. http://rash.apanela.com/tf/leakage/Redesigning%20Water%20Loss%20standards%20in%20California%20using%20the%20New%20IWA%20Methodology.pdf.
DWR. 2014. “CA Water use_year_balances_1998-2010.xlsx”. California Department of Water Resources. emailed to the author by evelyn Tipton.
energy star. 2013. energy Star Clothes Washers for Consumers, u.s. environmental Protection Agency and us Department of energy, www.energys-tar.gov/certified-products/detail/clothes_washers.
Gleick, P.H., D. Haasz, C. Henges-Jeck, V. srinivasan, G. Wolff, K.K. Cushing, and A. Mann. 2003. Waste Not, Want Not: The Potential for Urban Water Conservation in California, Pacific Institute for studies in Development environment and security, www.pacinst.org/reports/urban_usage/.
Hanak, e., and M. Davis. 2006. “Lawns and Water Demand in California,” California Economic Policy 2, No. 2, www.ppic.org/content/pubs/cep/ep_706ehep.pdf.
Heberger, M. 2011. “Australia’s Millennium Drought: Impacts and Responses,” in The World’s Water, Volume 7: The Biennial Report on Freshwater Resources, Peter H. Gleick, ed., 97–126. Washington, DC: Island Press.
Koeller, J., C. brown, A. bamezai, and G. Klein. 2007. Potential Best Management Practices, Annual Report, Year Three, California urban Water Conser-vation Council, www.cuwcc.org/products/pbmp-reports.aspx.
LADWP. 2011. urban Water Management Plan 2010, Los Angeles Department of Water and Power, www.water.ca.gov/urbanwatermanagement/2010uwmps/Los%20Angeles%20Department%20of%20Water%20and%20Power/LADWP%20uWMP_2010_LowRes.pdf.
Mayer, P. W., W. b. DeOreo, e.M. Opitz, J.C. Kiefer, W.Y. Davis, b. Dziegielewski, and J.O. Nelson. 1999. Residential End Uses of Water. American Water Works Association. http://www.waterrf.org/PublicReportLibrary/RfR90781_1999_241A.pdf.
sfPuC. 2011. 2010 Urban Water Management Plan for the City and County of San Francisco, san francisco Public utilities Commission, sfwater.org/modules/showdocument.aspx?documentid=1055.
Water systems Optimization Inc. 2009. secondary Research for Water Leak Detection Program and Water System Loss Control Study, southern Cali-fornia edison, docs.nrdc.org/water/files/wat_14021401a.pdf.
Wilkes, C.R., A.D. Mason, and s. C. Hern. 2005. “Probability Distributions for showering and bathing Water-use behavior for Various us subpopula-tions,” Risk Analysis 25 (2): 317–37.
footnotes
1 We have estimated state and regional water use and per capita consumption from data provided by DWR (Land and Water use balances 1998-2010). because water use varies from year to year due to a variety of factors (e.g., climate, economic conditions, and drought restrictions), we averaged water use for the years 2001 to 2010. because of this, our estimates vary slightly from those in the “20 x 2020” report published by the state Water Resources Control board in 2010, which used 2005 as its base year. The lack of consistent, reliable, and up-to-date data on flows and water use is a persistent problem for analysts of California water policy.
2 The average population in California over the time period for our analysis 2001-2010 was 36 million, according to Census bureau data, California’s population in April 2013 was 38.3 million.
Authors and Acknowledgements
The lead author of this report is Matthew Heberger, with additional contributions by Heather Cooley and Peter Gleick. support for this work was provided by the Pisces foundation. Numerous individuals provided comments on this report; we thank them for their input.
NRDC-4

PAGe 10 | urban Water Conservation and efficiency Potential in California
NRDC-4

NRDC-4

natural resources defense Council40 West 20th streetNew York, NY 10011212 727-2700fax 212 727-1773
beijing
Chicago
Los Angeles
bozeman
san francisco
Washington, D.C.
www.nrdc.org
www.nrdc.org/policy www.facebook.com/nrdc.org www.twitter.com/nrdc
Pacific institute654 13th street, Preservation ParkOakland, CA 94612, usAPhone: 510-251-1600fax: 510-251-2203
www.pacinst.orgwww.californiadrought.org
www.facebook.com/PacificInstitutewww.twitter.com/PacificInstitut
Printed on recycled paper
NRDC-4

There is tremendous opportunity to expand water reuse in California. In most urban areas, water is used once, treated, and disposed of as waste. Reuse provides a reliable, local water supply that reduces vulnerability to droughts and other water-supply constraints. It can also provide economic and environmental benefits, for example, by reducing energy use, diversions from rivers and streams, and pollution from wastewater discharges. Some progress is being made. An estimated 670,000 acre-feet of municipal wastewater is already beneficially reused in the state each year (SWRCB and DWR 2012). Onsite reuse—including the use of graywater—is also practiced in communities across California, although data are not available to estimate these volumes. More can and should be done.
Water Reuse Potential in California
ISSue BRIef june 2014 IB:14-05-e
NRDC-4

PAGe 2 | Water Reuse Potential in California
WAteR ReuseA variety of terms are used to describe water reuse, including water reclamation and water recycling. In some cases, wastewater is collected and conveyed to a nearby facility, where it undergoes treatment before being distributed to customers for reuse. This is commonly referred to as recycled water (or municipal recycled water). In other cases, wastewater is reused on site with little or no treatment, referred to as onsite reuse. For example, a home may be equipped with a graywater system that collects wastewater from a clothes washer and uses it to irrigate a garden.1 Likewise, an office building may be equipped with a system that treats wastewater and reuses a portion for flushing toilets and other non-potable applications. In this analysis, we use the term water reuse to refer broadly to wastewater that is intentionally captured and used for another beneficial purpose, such as for irrigation, industrial processes, or augmentation of drinking-water supplies. It includes onsite reuse as well as municipal recycled water.
WAteR ReCyClinG And Reuse tRends in CAlifoRniACalifornians have been reusing water for more than 100 years. In 1910, recycled water was used for agriculture at nearly three dozen sites, and by the 1950s, more than 100 California communities were using recycled water for agricultural and landscape irrigation (SWRCB and DWR 2012). The earliest
recycled water survey, conducted in 1970, found that an estimated 175,000 acre-feet of municipal wastewater was beneficially reused annually, about two-thirds of which was for agriculture (SWRCB 1990). The most recent statewide recycled water survey identified the annual reuse of 670,000 acre-feet of municipal wastewater, representing approximately 13 percent of the 5 million acre-feet of municipal wastewater produced each year in California (SWRCB and DWR, 2012). While the earliest uses of recycled water were for agriculture, there is currently a broader set of recycled water applications, including geothermal energy production, groundwater recharge, landscape irrigation, and industrial use (see Figure 1). Recycled water is used in nearly every county in the state but is concentrated in Southern California, with 60 percent of statewide recycled water use taking place south of the Tehachapi Mountains. Additionally, onsite reuse—including the use of graywater—is practiced in communities across California, although data are not available to estimate these volumes.
Water reuse is expanding, driven in part by the drought but also by efforts to develop a more reliable, local water supply. Water utilities in Northern and Southern California have already made investments in recycled water, and many are seeking to expand their recycled water supplies. For example, in Northern California, the city of Santa Rosa currently recycles between 90 and 100 percent of the 23,000 acre-feet of wastewater it produces each year (City of Santa Rosa 2011). In Southern California, the Inland Empire Utilities Agency currently recycles 50 percent of the nearly 60,000
figure 1. Recycled water trends in California, 1970–2009, and (inset) recycled water use by end use in 2009
Source: SWRCB and DWR (2012)
Note: urban irrigation includes the use of recycled water for irrigating large landscapes and golf courses. Groundwater recharge includes the use of recycled water for that purpose and as a seawater intrusion barrier.
800
700
600
500
400
300
200
100
0
Recy
cled
Wat
er U
se (t
hous
and
acre
-fee
t)
1970 1975 1980 1985 1990 1995 2000 2005 2010
Urban Irrigation 23%
Agricultural Irrigation 37%Commercial and
Industrial 9%
Geothermal Energy 2%
Groundwater Recharge 19%
Recreation 4%Environment 4% Other 2%
NRDC-4

PAGe 3 | Water Reuse Potential in California
acre-feet of wastewater produced annually for direct use and groundwater recharge and has a recycled water goal of 50,000 acre-feet by 2025 (IEUA 2013). Likewise, the Orange County Water District and Orange County Sanitation District operate a recycled water plant that produces up to 72,000 acre-feet per year; plans call for an increase in production to 103,000 acre-feet per year by 2015 (GWRS n.d.). These efforts are supported by several state agencies, including the State Water Resources Control Board and the Department of Water Resources—both of which have developed recycled water goals that represent a considerable increase over current levels.
CAlifoRniA’s WAteR Reuse PotentiAl
Previous AnalysesIn 2003, the Recycled Water Task Force examined the water recycling potential in California. On the basis of detailed regional analyses for the San Francisco Bay Area and Southern California coastal region combined with surveys of utilities and data on wastewater discharges, the task force estimated that the recycled water potential in 2030 would range from 1.9 million to 2.3 million acre-feet per year, or about 23 percent of the estimated available municipal wastewater in 2030 (Recycled Water Task Force 2003). More recent estimates from DWR in the California Water Plan are similar: In a review of water management plans prepared by urban water agencies across California, DWR estimates that recycled water could augment water supply by 1.8 million to 2.3 million acre-feet per year by 2030 (DWR 2013).
our AnalysisFor this analysis, we assumed that the technical potential for water reuse in California is equivalent to the state’s indoor water use. While it is unlikely that we will soon reuse all of the water used in our homes, much of this water could be captured and reused onsite or treated at a municipal wastewater treatment plant and distributed as recycled water. On the basis of data from DWR for 2001–2010, we estimated that indoor water use in California averages 4.2 million acre-feet per year. By implementing indoor efficiency improvements, indoor use could decline by 40 to 54 percent, thereby reducing the amount of water available for reuse. We therefore estimated that the water reuse potential is equivalent to our estimate of efficient indoor water use and ranges from 1.9 million to 2.5 million acre-feet per year (Heberger et al. 2014). Approximately 64 percent of the water reuse potential is from residences; the remainder is from commercial businesses and institutions (21 percent) and industry (15 percent). Some of this reuse is already occurring. According to the most recent state survey, current recycled water use in California is 670,000 acre-feet per year (SWRCB and DWR 2012). Thus, the potential for additional water reuse in California today is 1.2 million to 1.8 million acre-feet per year.
Two-thirds of the reuse potential is in coastal areas where wastewater is discharged into the ocean or into rivers that drain directly into the ocean. In these areas, expanding water reuse may provide water supply and water quality benefits. We estimated that 0.9 million to 1.1 million acre-feet per year could be reused in coastal areas. The remainder of the reuse potential (0.3 million to 0.7 million acre-feet per year) is in inland areas. While water reuse may not produce new supply in these areas because that water may already be reused by a downstream user, it can improve the reliability of water supplies, and by replacing the use of potable water, provide energy savings and environmental benefits, such as, requiring less water to be extracted from rivers and streams.
This is a conservative estimate for several reasons. First, it assumed a high degree of indoor water efficiency. In reality, indoor water efficiency is unlikely to reach its full technical potential, and thus the reuse potential may be higher. Second, it did not take into account population growth, which can increase the amount of wastewater produced and thus the reuse potential. Third, it assumed that all of this water is reused for irrigation or some other consumptive use and thus can be reused only once. However, if that water is used inside a home or business or to recharge a groundwater aquifer, it may be possible to reuse the water several times.2 Finally, we did not include inflow and infiltration, which refer to rainwater and groundwater that enter the sanitary sewer system through cracked pipes, leaky manholes, or improperly connected storm drains and roof gutter downspouts and is transported to the wastewater treatment plant, where it is treated and discharged. Thus, the water reuse potential is likely to be higher.
ConClusionsWater reuse provides a reliable, local water supply that reduces vulnerability to droughts and other water-supply constraints. It can also provide economic and environmental benefits, for example by reducing energy use, diversions from rivers and streams, and pollution from wastewater discharges.
There is tremendous opportunity to expand water reuse in California. We estimate that the water reuse potential in California, beyond what has already been achieved, ranges from 1.2 million to 1.8 million acre-feet per year. Two-thirds of the reuse potential is in coastal areas where wastewater is discharged into the ocean or into streams that drain into the ocean. In these areas, expanding water reuse may provide both water supply and water quality benefits.
NRDC-4

References
City of Santa Rosa. (2011). 2010 Urban Water Management Plan, prepared in conjunction with West and Yost Associated and Maddaus Water Management.
California Department of Water Resources (DWR). (2013). California Water Plan Update 2013, Vol. 3, Chapter 1, Introduction. Draft report.
Groundwater Replenishment System (GWRS). (No Date). Technical brochure, www.gwrsystem.com/images/stories/AboutGWRS/GWRS%20Technical%20Brochure.pdf (accessed April 23, 2014).
Heberger, M., H. Cooley, and P.H. Gleick. (2014). Urban Water Conservation and Efficiency Potential. Pacific Institute and Natural Resources Defense Council.
Inland empire utilities Agency (IeuA). (2013). IEUA Business Goals, www.ieua.org/recycled/docs/fY2011_12_RWAnnualReport.pdf (accessed April 23, 2014).
National Research Council. (2012). Water Reuse: Potential for Expanding the Nation’s Water Supply Through Reuse of Municipal Wastewater. Washington, D.C.: National Academies Press.
Recycled Water Task force. (2003). Water Recycling 2030: Recommendations of California’s Recycled Water Task Force. California Department of Water Resources, State Water Resources Control Board, and California Department of Health Services.
State Water Resources Control Board (SWRCB). (2013). Recycled Water Policy, revised January 22, 2013.
State Water Resources Control Board (SWRCB). (2008). Strategic Plan Update 2008–2012. Sacramento (CA): State Water Resources Control Board.
State Water Resources Control Board (SWRCB) and Department of Water Resources (DWR). (2012). Results, Challenges, and Future Approaches to California’s Municipal Wastewater Recycling Survey.
endnotes
1 Graywater is defined slightly differently around the world but generally refers to the wastewater generated from household uses like bathing and washing clothes. It is distinct from blackwater, which refers to wastewater that has come into contact with fecal matter and urine.
2 We note that salt loading may limit the number of times that water may be reused.
Authors and Acknowledgements
The lead author of this report is Heather Cooley, with additional contributions by Peter Gleick and Robert Wilkinson. Support for this work was provided by the Pisces foundation. Numerous individuals provided comments on this report; we thank them for their input.
natural Resources defense Council40 West 20th StreetNew York, NY 10011212 727-2700fax 212 727-1773
Beijing
Chicago
Los Angeles
Bozeman
San francisco
Washington, D.C.
www.nrdc.org
www.nrdc.org/policy www.facebook.com/nrdc.org www.twitter.com/nrdc
Pacific institute654 13th Street, Preservation ParkOakland, CA 94612, uSAPhone: 510-251-1600fax: 510-251-2203
www.pacinst.orgwww.californiadrought.org
www.facebook.com/PacificInstitutewww.twitter.com/PacificInstitut
Printed on recycled paper
NRDC-4

Communities throughout California are facing serious and growing threats to their ability to provide a safe, reliable supply of water. Drought, coupled with over-allocation of existing water sources, is affecting cities, farms, businesses, industries, and the environment all across the state. For many communities, 2013 was the driest year in a century, and the lack of precipitation has critical implications for the continued viability of surface water and groundwater resources that supply our cities. The long-term effects of climate change are likely to exacerbate this. Capturing and using or storing stormwater runoff when it rains can help communities increase water supply reliability—so they have the water they need when it doesn’t.
Stormwater Capture Potential in Urban and Suburban California
issue brieF june 2014 ib:14-05-G
NRDC-4

PAGe 2 | Stormwater Capture Potential in urban and Suburban California
VENTURACOUNTY
LOS ANGELESCOUNTY
SAN BERNARDINOCOUNTY
RIVERSIDECOUNTY
SAN DIEGOCOUNTY
ORANGECOUNTY
MEXICO
Los Angeles
LongBeach
Santa Ana
Riverside
SanBernardino
SanDiego
ChulaVista
Escondido
Oceanside
Anaheim
Ventura
Oxnard
}
Temecula
Hemet
Palmdale
Victorville
PalmSprings
Calleguas MWD
Las Virgenes MWD
San FernandoBurbank
Glendale
Foothill MWD
Pasadena
Los Angeles
Beverly HillsSanta Monica
West BasinMWD
Torrance
Compton
LongBeach
San Marino
Upper San GabrielValley MWD
Three ValleysMWD
Inland EmpireUtilities Agency
Anaheim
Fullerton
Santa Ana
MWD ofOrange County
Western MWD ofRiverside County
Eastern MWD
Yucaipa Valley WD
Beaumont-Cherry Valley WD
San DiegoCounty WA
Central BasinvMWD
Water Supply Source
Water supply by district based on 2005statistics. Map created by GreenInfoNetwork, January 2009. 0 2512.5
Miles
Study Area Boundary Water Supply Aqueductor Canal
WATER SUPPLY - SOUTHERN CALIFORNIA REGION
Breakout of District Water Supply by Source(district colored by dominant source)
West Branch
East Branch
Colorado River
Los Angeles Aqueduct
Groundwater
Other
Capturing stormwater runoff from impervious surfaces in urban and suburban areas when it rains—whether by directing the runoff to open spaces and allowing it to infiltrate into the ground to recharge groundwater supplies or by harvesting the runoff, primarily from rooftops, in rain barrels and cisterns for direct use in nonpotable applications—can be used to increase California’s water supplies dramatically. In southern California and the San Francisco Bay Area, capturing runoff using these approaches can increase water supplies by as much as 630,000 acre-feet each year. Capturing this volume, roughly equal to the amount of water used by the entire City of Los Angeles annually, would increase the sustainability of California’s water supplies while at the same time reducing a leading cause of surface water pollution in the state.
StormwAter runoff, CAPture, And wAter SuPPlyWhen it rains on undeveloped lands, much of the rainwater either soaks into the ground or evaporates. Critically in this system, water that is not taken up by plants can infiltrate
below the surface and help add to, or recharge, groundwater aquifers—vast stores of water that fill in the voids, pores, or cracks in soil or rocks underground. Groundwater has been used to supply growing communities in Southern California for more than 150 years, and today it fills approximately 40 percent of the region’s overall water needs (Figure 1—showing water supply sources for water districts in Southern California including local groundwater production and imported water sources such as the Colorado River and the East and West branches of the State Water Project) (NRDC 2009). It is also used extensively in other portions of the state, supplying communities in the Central Coast, portions of the San Francisco Bay Area, throughout the Central Valley, and into the Shasta-Cascade region.
However, as California’s population has grown and more and more land has been developed or redeveloped, much of the natural landscape in these developed areas has been paved over, drastically altering the hydrologic regime that replaces and recharges groundwater. When it rains on urban and suburban landscapes, impervious surfaces like streets, sidewalks, rooftops, and parking lots prevent the water from soaking into the ground. This cuts off groundwater aquifers from a principal supply source and
Source: NrDC 2009
figure 1. water supply sources and dominant source type for water districts in Southern California
NRDC-4

PAGe 3 | Stormwater Capture Potential in urban and Suburban California
leaves the water with nowhere to go but downhill. Instead of adding to our groundwater supplies or nourishing plant life, it picks up animal waste, trash, metals, chemicals, and other contaminants in its path, ultimately dumping the pollution into rivers, lakes, or ocean waters. At the same time, the drastically increased volume of runoff can lead to increasingly severe flooding and erosion. And even when it isn’t raining, water from excess landscape irrigation, car washing, industrial processes, and other uses flows into storm sewer systems—an estimated 10 million to 25 million gallons flow into Santa Monica Bay alone for each dry-weather day (City of Los Angeles 2009), and more than 100 million gallons flow to the ocean from across Los Angeles County (City of Los Angeles BOS). Altogether, hundreds of billions of gallons of potential water supply are thrown away each year in a manner that endangers public health and ecosystems, and weakens coastal and other economies that depend on clean water for tourism revenue.
“Green infrastructure” is an approach to water and stormwater management that, among other goals, aims to maintain or enhance the pre-development or natural hydrology of urban and developing watersheds. It includes a wide variety of practices that can be used to capture stormwater runoff to increase water supplies at both a distributed (or on-site) scale and at subregional or regional scales. Green infrastructure may be used to promote infiltration of water into the ground, where it can recharge groundwater supplies, or to promote its capture in rain barrels and cisterns for later use. Many California cities and towns are already using a combination of distributed and regional practices to capture stormwater and put it to use.
There is a tremendous need, and opportunity, to capture more stormwater as a way to sustainably increase water supplies. For example, a one-inch rain event in Los Angeles County can generate more than 10 billion gallons (roughly 30,000 acre-feet) of stormwater runoff, most of which ultimately flows into the Pacific Ocean. In the Central and
West Coast groundwater basins on the coastal plain of Los Angeles, approximately 54,000 acre-feet of rain and stormwater runoff per year are currently captured and recharged, primarily by the Los Angeles County Flood Control District (Johnson 2008). But the Water Replenishment District of Southern California, which manages the groundwater basins, also must import roughly 30,000 acre-feet of water per year to make up for excess groundwater pumping by water rights holders. At the same time, an estimated 180,000 acre-feet of stormwater runoff is lost to the ocean each year from its service area (Water Replenishment District 2012), representing a lost opportunity to increase local water supplies.
QuAntifyinG the PotentiAl for StormwAter CAPtureIn 2009, NRDC and the University of California, Santa Barbara conducted an analysis of the potential stormwater capture for water supply that could be achieved at new building projects and redevelopment projects for residential and commercial properties in urbanized Southern California and the San Francisco Bay Area. Focusing on opportunities for either infiltration of runoff to recharge groundwater resources or rooftop rainwater capture for on-site use, the study found that stormwater capture could increase overall water supplies by up to 405,000 acre-feet per year by 2030 (NRDC 2009). However, that analysis did not address stormwater runoff from existing development, by far the largest source of runoff, and was limited in the types of land use it considered. As a result, while demonstrating a robust potential to increase water supply through stormwater capture, the analysis was conservative in its assessment of the overall potential for stormwater capture.
To inform ongoing discussions about the drought and pressing challenges for the California water supply sector, we have updated this analysis using new data in order to provide a more comprehensive picture of the potential for stormwater capture to augment local water supplies. The analysis again focused on urbanized Southern California and the San Francisco Bay Area, as the two most heavily urbanized and developed regions of the state; combined, they account for approximately 75 percent of California’s population.
For this analysis, we calculated the potential water supply that could be captured from existing impervious surfaces in urban and suburban landscapes through infiltration or rooftop rainwater harvesting on the basis of a GIS analysis of selected land uses and impervious surface cover.1 Calculations for runoff were based on an analysis of total impervious cover and average annual precipitation for each land use type.2
In addition to precipitation-based runoff, dry-weather runoff from human activities, such as landscape irrigation
A vegetated swale in a parking lot © Haan-Fawn Chou
NRDC-4
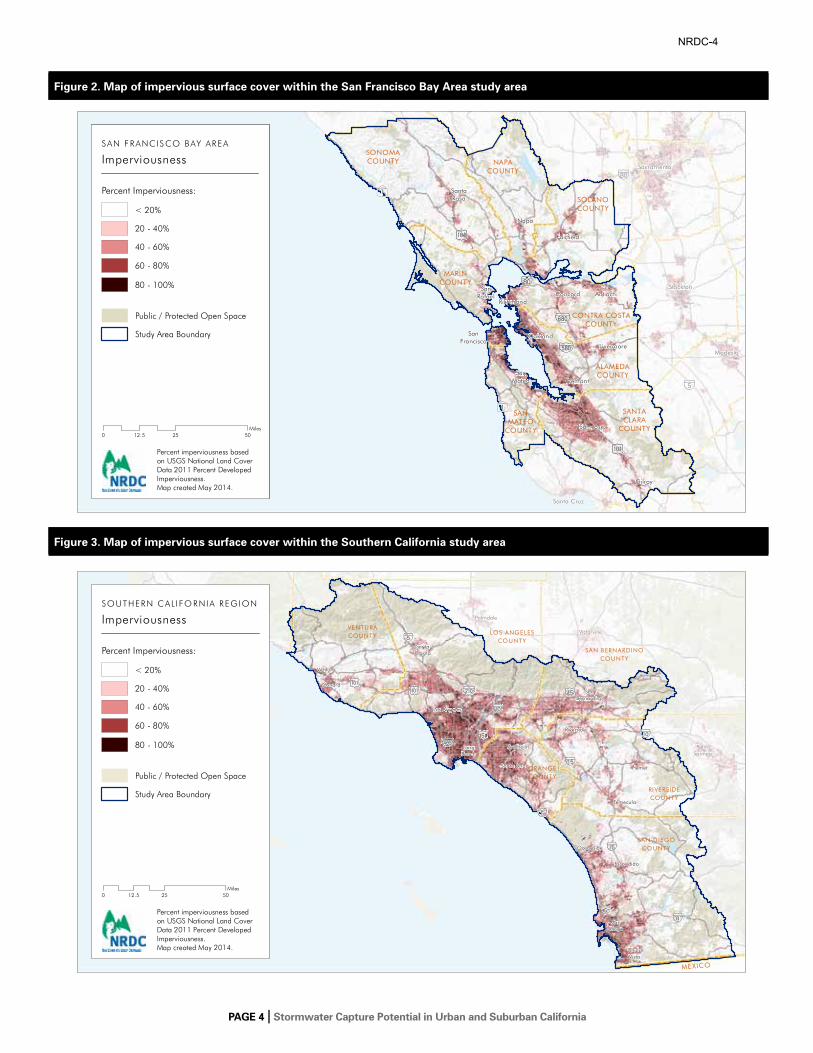
PAGe 4 | Stormwater Capture Potential in urban and Suburban California
figure 2. map of impervious surface cover within the San francisco Bay Area study area
NAPACOUNTY
SONOMACOUNTY
MARINCOUNTY
SOLANOCOUNTY
SANMATEO
COUNTY
SANTACLARA
COUNTY
ALAMEDACOUNTY
CONTRA COSTACOUNTY
}
E
E
R
P
>1
>1
@
}
SanFrancisco
San Jose
SanMateo
SanRafael
SantaRosa
Napa
Fairfield
AntiochConcordRichmond
Livermore
Fremont
Oakland
Gilroy
Santa Cruz
Stockton
Sacramento
Modesto
Percent Imperviousness:
< 20%
20 - 40%
40 - 60%
60 - 80%
Percent imperviousness based on USGS National Land CoverData 2011 Percent DevelopedImperviousness.Map created May 2014.
80 - 100%
Public / Protected Open Space
Study Area Boundary
SAN F RANC IS CO BAY AREA
Imperviousness
0 25 5012.5Miles
Percent Imperviousness:
< 20%
20 - 40%
40 - 60%
60 - 80%
Percent imperviousness based on USGS National Land CoverData 2011 Percent DevelopedImperviousness.Map created May 2014.
0 25 5012.5Miles
80 - 100%
Public / Protected Open Space
Study Area Boundary
SAN F RANC IS CO BAY AREA
Imperviousness
VENTURACOUNTY LOS ANGELES
COUNTY
SAN BERNARDINOCOUNTY
RIVERSIDECOUNTY
SAN DIEGOCOUNTY
ORANGECOUNTY
MEXICO
@
I
B
@
}
N
@
C
C
A
B
@
}
C
Los Angeles
LongBeach
Santa Ana
Riverside
SanBernardino
SanDiego
ChulaVista
Escondido
Oceanside
Anaheim
Ventura
Oxnard
SantaClarita
Temecula
Hemet
Palmdale
Victorville
PalmSprings
Percent Imperviousness:
< 20%
20 - 40%
40 - 60%
60 - 80%
Percent imperviousness based on USGS National Land CoverData 2011 Percent DevelopedImperviousness.Map created May 2014.
0 25 5012.5Miles
80 - 100%
Public / Protected Open Space
Study Area Boundary
SOUTHERN C ALI FO RNIA REGION
Imperviousness
figure 3. map of impervious surface cover within the Southern California study area
NRDC-4

PAGe 5 | Stormwater Capture Potential in urban and Suburban California
and car washing, that overflows onto paved surfaces can also be captured. On the basis of a 2004 study by the Irvine Ranch Water District, we assumed that dry-weather runoff resulting from over-irrigation and other processes for residential and commercial developments is 0.152 gallon of runoff per acre of pervious surface (landscaped area) per minute on days when it does not rain. Importantly, however, our analysis did not assess the potential for additional capture that could be achieved for runoff from open space, or for runoff from surrounding areas that may flow into urban and suburban landscapes. Because the study considered only runoff from developed lands, it is likely still conservative with respect to the total volume of runoff available for capture.
Land use was also analyzed to assess whether development was located over a groundwater aquifer currently used for municipal water supply, such that infiltration would add to an existing supply source, and to identify soil or geologic conditions that could obstruct runoff from infiltrating to a depth necessary to reach these aquifers. Within these areas, where conditions are favorable for infiltration, the analysis assumed that for highly infiltrative soils (NRCS Hydrologic Soil group A or B), between 75 and 90 percent of the runoff could be infiltrated into the ground. The analysis assumed that the remaining portion of runoff would be lost to evaporation or transpiration during conveyance of the runoff to its infiltration point or due to the drawdown time required for the water to fully infiltrate. Where infiltrative capacity of the soils is suitable for recharge, but where soil conditions require a longer drawdown time for the water to infiltrate (e.g., NRCS group C soils), the analysis assumed that 65 to 80 percent of the runoff could be infiltrated into the ground. Where highly non-infiltrative soils such as those with a high clay content are present (e.g., group D soils), or where development has occurred outside of areas underlain by a groundwater basin used for water supply, the analysis assumed that rooftop rainwater harvesting would be the method of capture used.
Existing groundwater pollution or the presence of shallow groundwater could serve as additional obstacles to using practices that increase groundwater recharge, as increased infiltration could in some circumstances result in flooding or mobilization of groundwater pollutant plumes. For example, portions of the San Fernando and Main San Gabriel groundwater basins in Los Angeles County are contaminated by such pollutants as the volatile organic compounds trichloroethylene (TCE) and perchloroethene (PCE); this complicates efforts both to make use of the basins’ resources and to recharge groundwater supplies (Sahagun 2013). However, the opportunity presented by stormwater capture offers a strong incentive to clean up and restore these groundwater resources where they are impaired.
Where infiltration is not feasible, the analysis assumed on-site rooftop rainwater harvesting would be used to supply water for nonpotable uses such as outdoor irrigation and toilet flushing. The analysis considered only those land uses that were likely to have use for captured water on-site, such as residential development or commercial/office development with landscaping or building occupants sufficient to make use of the water. The analysis assumed, at the low end, that a single-family residential parcel would use one 55-gallon rain barrel for capture and on-site use— providing an average of 660 gallons of water per year, based on 12 refill events (Santa Monica Bay Restoration Commission and Great Ecology 2012). While our higher end capture estimate for single family homes is based on an assessment of the amount of rooftop runoff that could be harvested and used per unit roof area (see below), even small, simple rooftop rainwater harvesting systems such as rain barrels can create a large overall water supply benefit when use is widespread within a community. Rain barrels provide a generally known range of annual capture volume based on the number of refill events regardless of roof size, and thus for our low end estimate we base the amount captured for any individual single family home on a set volume, rather than on
Left: A drainage swale as part of the City of seattle’s street edge Alternatives project © ePA/Abby Hall
right: A rain barrel in santa Monica © ePA/Abby Hall
NRDC-4

PAGe 6 | Stormwater Capture Potential in urban and Suburban California
a percentage of annual rooftop rainfall. Our low-end estimate also assumed that multifamily, commercial, and government or institutional development would use an average of 25 percent of annual rooftop runoff in Southern California and 35 percent in the San Francisco Bay Area.3 At its upper end, the analysis assumed that in Southern California, single-family residences would capture 35 percent of annual runoff for water supply, while multifamily residential, commercial, and government or institutional development would capture 45 percent of annual runoff for water supply. In the San Francisco Bay Area, the percentages assumed for the upper end case were 40 percent for single-family homes and 55 percent for residential, commercial, and government or institutional development.
urBAn StormwAter CAPture PotentiAl: findinGS And AnAlySiSOverall, we estimate that stormwater capture in urbanized Southern California and the San Francisco Bay region has the potential to increase water supplies by 420,000 to 630,000 acre-feet per year, at its upper end approximately as much water as used by the entire city of Los Angeles each year.
Infiltration, whether conducted at a distributed scale or through regional groundwater recharge projects, has the capacity to capture large volumes of water on both individual storm and annual time frames. As a result, it represents the greatest stormwater-based opportunity to increase water supplies for our cities. In areas overlying groundwater basins used for municipal water supply, our analysis found that between 365,000 and 440,000 acre-feet of runoff could be captured and stored for use each year. Projects designed for large-scale capture, including use of green streets (designed to manage stormwater runoff in the public right-of-way), park retrofits, government building or parking lot retrofits, and infrastructure changes to divert runoff to large-scale spreading grounds, offer substantial opportunity for cities to increase local supplies of water throughout California. Cities can additionally incentivize action on private property to increase infiltration, such as through downspout disconnection programs and landscape retrofits.
We also note that in areas not identified by the study as ideal for infiltration—for example, because of the presence of soil or geology that would inhibit the ability of water to percolate sufficiently deep to reach groundwater resources used for water supply—our cities will nevertheless generate hundreds of thousands to millions of additional acre-feet of stormwater runoff annually. Though not analyzed in this study, substantial opportunity exists to use parks or other open spaces to capture much of this runoff, in large-scale cisterns or detention basins, and put it to use for on-site irrigation or as part of neighborhood- or regional-scale nonpotable distribution systems (Community Conservation Solutions 2008). As a result, the figures presented above for municipal opportunity are likely conservative in terms of the volume of runoff that could actually be captured for water supply.
Where infiltration is not the preferred means of increasing water supplies, rooftop rainwater capture could be used to increase water supplies by as much as 190,000 acre-feet per year, of which nearly 145,000 acre-feet could be gained via rainwater capture systems installed in our homes. This amount could be even greater if rooftop rainwater capture were also used in areas where infiltration and groundwater recharge are feasible. Overall, however, on-site rooftop rainwater harvesting for residential buildings has the potential to add between 30,000 and 145,000 acre-feet of water supply per year that could be used for landscape irrigation, toilet flushing, or other nonpotable applications. The wide difference between the two estimates is driven largely by assumptions made for capture practices employed at single-family homes, which constitute by far the largest residential land use in both study areas. Capturing a portion of the runoff from single-family homes for on-site use, however, would drastically increase overall local water supplies and reduce strain on existing systems.
ConCluSionSOur findings make it clear that stormwater capture, using both infiltration to recharge groundwater resources and capture of rooftop runoff for direct nonpotable consumption, is a strong option for improving the resilience and sustainability of water supply for the cities and suburban areas of California.
NRDC-4

PAGe 7 | Stormwater Capture Potential in urban and Suburban California
references
Alliance resource Consulting. Water Replenishment District of Southern California: Water Quality Program Manager, www.allianceresourceconsulting.com/Profiles/480.pdf.
City of Los Angeles. 2009. Santa Monica Bay Shoreline Monitoring Municipal Separate Storm Sewer System (MS4) Report (July 1, 2008–June 30, 2009).
City of Los Angeles bureau of sanitation (bOs). Stormwater Best Management Practices (BMPs): Home Repair and Remodeling, san.lacity.org/watershed_protection/pdfs/homerepr.pdf.
City of Los Angeles Department of Water and Power and TreePeople. 2014. Stormwater Capture Master Plan Fact Sheet, www.ladwp.com/ladwp/faces/wcnav_externalid/a-w-stormwatercapturemp?_afrLoop=791181446553331&_afrWindowMode=0&_afrWindowid=5e5b97e9j_1#%40%3F_afrWindowid%3D5e5b97e9j_1%26_afrLoop%3D791181446553331%26_afrWindowMode%3D0%26_adf.ctrl-state%3D5e5b97e9j_17.
City of Los Angeles Department of Water and Power and Geosyntec. February 24, 2014. Existing and Potential Stormwater Capture in City of L.A. (presentation).
Community Conservation solutions. March 2008. Green Solution Project Report: Phase I—Los Angeles County, www.conservationsolutions.org/greensolution.html.
Geosyntec Consultants. April 28, 2014. Technical Memorandum re: Los Angeles-bay Area Cistern Performance evaluation.
irvine ranch Water District. July 2004. Residential Runoff Reduction Study, www.irwd.com/Conservation/r3-study-revised11-5-04.pdf.
Johnson, Ted. Winter 2008. “Groundwater replenishment at the Montebello Forebay spreading Grounds,” WRD Technical Bulletin 14, Water replenishment District of southern California, www.wrd.org/engineering/groundwater-replenishment-spreading-grounds.php.
Los Angeles economic Development Corporation. August 14, 2008. Where Will We Get the Water? Assessing Southern California’s Future Water Strategies, draft preliminary findings, www.mwdh2o.com/blueribbon/pdfs/Water_soCalWaterstrategies.pdf.
Los Angeles and san Gabriel rivers Watershed Council. January 30, 2010. Water Augmentation Study: Research, Strategy and Implementation Report, www.usbr.gov/lc/socal/reports/LAsGwtraugmentation/report.pdf.
Metropolitan Water District of southern California. september 2007. A Status Report on the Use of Groundwater in the Service Area of the Metropolitan Water District of Southern California, report No. 1308, www.mwdh2o.com/mwdh2o/pages/yourwater/supply/groundwater/GWAs.html.
NrDC. August 2009. A Clear Blue Future: How Greening California Cities Can Address Water Resources and Climate Challenges in the 21st Century, www.nrdc.org/water/lid/.
NrDC. 2011. Capturing rainwater from rooftops: An efficient Water resource Management strategy that increases supply and reduces Pollution, www.nrdc.org/water/rooftoprainwatercapture.asp.
Public Policy institute of California. December 2009. California Water Myths, www.ppic.org/main/publication.asp?i=890.
santa Monica bay restoration Commission and Great ecology. 2012. Final report: Culver City rainwater Harvesting Program, www.santamonicabay.org/Documents/CCrH%20Final_Print.pdf.
sahagun, Louis. June 23, 2013. “DWP to build Groundwater Treatment Plants on superfund site,” Los Angeles Times, articles.latimes.com/2013/jun/23/local/la-me-water-20130624.
schueler, T.r. 1987. Controlling Urban Runoff: A Practical Manual for Planning and Designing Urban BMPs, Metropolitan Washington Council of Governments.
u.s. environmental Protection Agency, Water Planning Division. December 1983. Results of the Nationwide Urban Runoff Program: Volume 1—Final Report, report No. 832r83112, www.epa.gov/npdes/pubs/sw_nurp_vol_1_finalreport.pdf.
Water replenishment District of southern California. August 20, 2012. Stormwater Recharge Feasibility and Pilot Project Development Study, www.wrd.org/1208020_sWrechargeFeasibility%20and%20PPDs_Finalreport.pdf.
endnotes
1 For example, residential, commercial, and institutional uses, as well as roads, were analyzed; airport, military, and heavy industrial uses were not.
2 The analysis used a runoff coefficient for impervious surfaces of C = 0.009 * i + 0.05, where i is the impervious percentage (with i = 100 percent for fully impervious areas) (schueler 1987). This is essentially equivalent to 95 percent of precipitation falling on paved surfaces mobilizing as runoff.
3 recent analysis by Geosyntec Consultants found that, using a representative rainfall record for the Los Angeles area, where one-half gallon of storage capacity is provided per square foot of roof area (e.g., a 500-gallon cistern for a 1,000-square-foot roof), 35 percent of annual runoff could be captured assuming a 360-hour (15-day) drawdown time to empty the cistern, and 43 percent of the annual rainfall could be captured assuming a 180-hour (7.5-day) drawdown time. For the san Francisco bay Area, the analysis found that for the same storage capacity, 41 percent of annual rainfall could be captured assuming a 360-hour drawdown time, and 56 percent could be captured assuming a 180-hour drawdown time (Geosyntec 2014) areas or land uses with higher consumption rates would have a higher harvesting and use potential.
Authors and Acknowledgements
The lead author of this report is Noah Garrison, with additional contributions by Jake sahl, Aubrey Dugger, and robert C. Wilkinson, Ph.D. support for this work was provided by the Pisces Foundation. Numerous individuals provided comments on this report; we thank them for their input.
NRDC-4

natural resources defense Council40 West 20th streetNew York, NY 10011212 727-2700Fax 212 727-1773
beijing
Chicago
Los Angeles
bozeman
san Francisco
Washington, D.C.
www.nrdc.org
www.nrdc.org/policy www.facebook.com/nrdc.org www.twitter.com/nrdc
Pacific institute654 13th street, Preservation ParkOakland, CA 94612, usAPhone: 510-251-1600Fax: 510-251-2203
www.pacinst.orgwww.californiadrought.org
www.facebook.com/Pacificinstitutewww.twitter.com/Pacificinstitut
Printed on recycled paper
NRDC-4