the unheard voices : citizen’s perceptions on the state … · 2013-10-06 · the unheard voices...
TRANSCRIPT

THE UNHEARD VOICES : CITIZEN’S PERCEPTIONS ON THE STATE OF GOVERNANCE AND SERVICE DELIVERY IN MUNICIPALITIES (POURASHAVAS) AND CITY CORPORATIONS IN BANGLADESH
CENTRE FOR POLICY DIALOGUE (CPD) B A N G L A D E S H a c i v i l s o c i e t y t h i n k – t a n k
Presented at CPD-CMI Research Colloquium at the BRAC Centre Inn Auditorium
Dhaka: 05 October, 2013
1

Research Team
Team Leader Debapriya Bhattacharya, Distinguished Fellow, CPD.
Principal Researcher
Mobasser Monem Professor, Department of Public Administration,
University of Dhaka.
Co-Researchers Hasan Muhammad Baniamin
Research Student, University of Bergen, Norway
Umme Shefa Rezbana Research Associate, CPD
2

Outline of the Presentation
1. Urban Local Government: Bangladesh Context 2. The Design of the Study 3. Sample Areas and Respondent Profile 4. Major Findings and Analysis 5. Mapping the Determinants of Citizen’s Satisfaction
with Municipality Services 6. Taxation in Municipalities 7. Governance Issues 8. Bangladesh Urban Local Government in Comparative
Perspective 9. Innovations in Local Government Institutions:
International Experience and Lessons for Bangladesh 10.Concluding Remarks and Policy Perspectives
3

1. Urban Local Government: Bangladesh Context
q Urban Local Government in Bangladesh comprises of 10 City Corporations and 321 Municipalities (Pourashavas) governed by elected local government q Municipalities (Pourashavas) do not have the capacity to generate sufficient revenues and largely depends on the budgetary transfers from the “Central” government of Bangladesh q City Corporations and Municipalities (Pourashavas) due to tremendous fiscal stress have not been able to operate and maintain desired level of services
4

2. The Design of the Study Rationale
q With the increasing rate of urbanization, citizen’s demands for urban services from the urban local government are increasing rapidly q Citizens’ experiences and perceptions of public services are critical for –
ØIdentifying local needs and priorities ØEvaluating the progress in service delivery ØDesigning and implementing effective and efficient service models for future ØUnderstanding the current level of satisfaction of the citizens with services and service delivery
5

2. The Design of the Study Objectives of the Study
q The study has three main objectives:
ØTo measure the extent to which Municipalities (Pourashavas) and City Corporations are meeting citizen’s expectations regarding service delivery ØTo assess the effectiveness of existing mechanisms of and governance including participation, transparency accountability related practices of Municipalities (Pourashavas) and City Corporations based on citizen’s perceptions ØTo register the citizen’s suggestions as to how overall service delivery, governance and own source revenue mobilization practices of Municipalities (Pourashavas) and City Corporations can be made more effective
6

2. The Design of the Study Methodology (Sequence of Research)
q Conceptualization- Preparation of Concept Note q Desk Research- Literature Review (National and Global) q Expert Group Meeting q Preparation of Survey Design q Survey- Field Testing Ø Sample Survey of Various Respondents (110 face-to-face interviews, questionnaire survey each lasting about an hour.) Ø Survey Period: 6 Dec, 2012- 3 March, 2013
q 11 Focus Group Discussions (FGDs) with the local people represented by cross section of local people in 11 different sample Municipalities (Pourashavas) and city corporations q Post-Survey Expert Group Meeting (10 March, 2013) q Validation- Today’s Meeting
7

SL Municipality (Pourashava)
Division
Class Year of Est.
Popula-tion
Comments
1. Bajitpur Dhaka B 1869 34,898 Old but having large population still in B class
2. Tarabo Dhaka B 2002 64,875 Newly established, with a medium population progressed very quickly from C to B class
3. Kasba Chittagong
C 1999 40,416 Having a large population & established in 1999 but still in C class
4. Kumarkhali Khulna A 1869 29,000 Having small population size compared to others it is in A class
5. Nabiganj Sylhet B 1997 30,286 Having large population Compared to other A class Pourashavas established in the same year, it is still in Class B
6. Dhunat Rajshahi
C 2001 15,575 Still in Class C compared to some other B and A class having population range 15,000 to 25,000 established after 2000
3. Sample Areas and Respondent Profile a. Sampled Pourashavas & City Corporations
8

SL Municipality (Pourashava)
Division Class Year of Est.
Popula-tion
Comments
7. Arani Rajshahi B 2006 28,300 Established newly and having small population among others it progressed quickly to Class B
8. Mathbaria Barisal A 1993 18,375 Small population, recently established quickly progressed to class A
9. Haragach Rangpur C 1989 61,425 Oldest among 9 C class Municipalities having the largest population size among those, Still in C class
SL City Corporation Division Established Population Comments 10. Narayanganj City
Corporation Dhaka 2011 7,29,000 Newly
established 11. Khulna City Corporation Khulna 1990 10,50,000 Relatively
Old
3. Sample Areas and Respondent Profile a. Sampled Pourashavas & City Corporations (Contd.)
9

3. Sample Areas and Respondent Profile b. Profile of the Respondents
(Gender & Educational Background)
q A total of 110 respondents from the 9 sampled Municipalities and 2 City corporations were interviewed taking 10 respondents from each Municipality (Pourashava) and City Corporation
q Among the sample respondents 95 percent respondents were male and 5 percent respondents were female.
q 44 percent were graduate, 35 percent were holding either secondary or higher secondary certificate and 21 attended primary or high school.
Male 95%
Female 5%
Below SSC 21%
SSC to HSC or
Equivalent 35%
Graduate or above
44%
10

3. Sample Areas and Respondent Profile b. Profile of the Respondents (Contd.)
(Age & Occupation)
21-30 16%
31-50 63%
51-70 21%
0%
q The target population of the sample was adults 24 years and older. Majority of the respondents (63 percent of the total) belonged to the age ranging between 31 and 50. q The mean age of the respondents was 45.
Business 49%
Service (both government and private)
16%
Professionals including Teachers, Doctors,
Journalists) 27%
Others including Farmers, Self-employed, Students,
Drivers 8%
Age of the Respondents:
Occupation of the Respondents:
11

4. Major Findings and Analysis
12
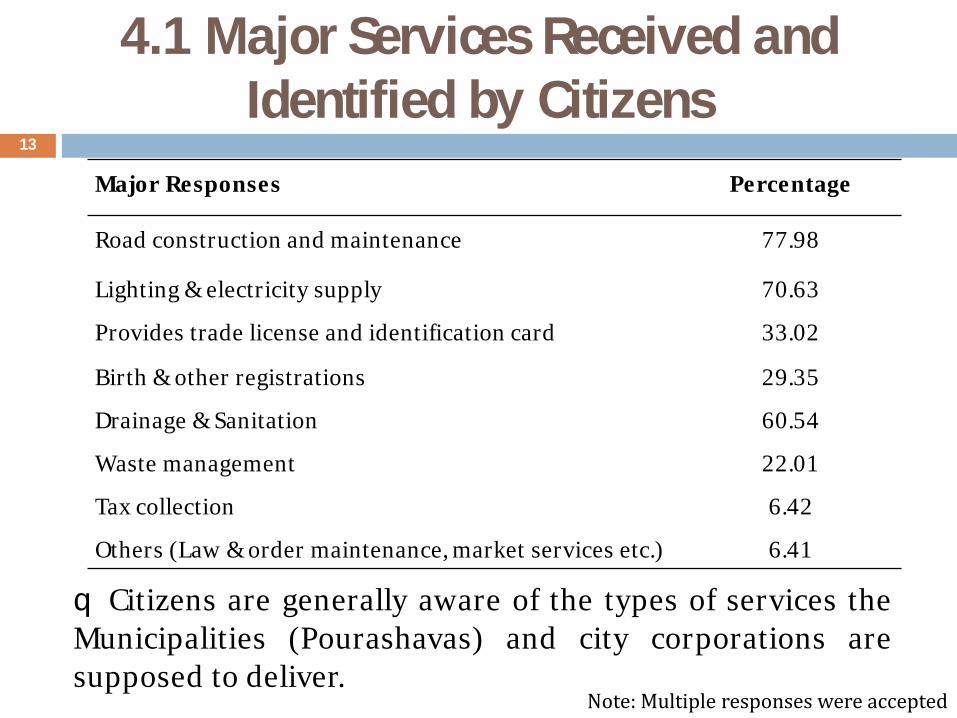
4.1 Major Services Received and Identified by Citizens
Major Responses Percentage
Road construction and maintenance 77.98
Lighting & electricity supply 70.63
Provides trade license and identification card 33.02
Birth & other registrations 29.35
Drainage & Sanitation 60.54
Waste management 22.01
Tax collection 6.42
Others (Law & order maintenance, market services etc.) 6.41
q Citizens are generally aware of the types of services the Municipalities (Pourashavas) and city corporations are supposed to deliver.
Note: Multiple responses were accepted
13

4.2 Citizen’s Level of Satisfaction Regarding the Services Received
q Less than half of the all respondents- 40 percent are satisfied and 60 percent respondents were dissatisfied with the services provided by their respective Municipalities q Only 35 percent citizens are satisfied and 65% citizens are dissatisfied with the services provided by their respective City Corporations.
Dissatisfied with theMunicipality Provided
Services
Satisfied with theMunicipality Provided
Services
60
40
Percentages, N= 90
Dissatisfied with theCity CorporationsProvided Services
Satisfied with CityCorporation provided
Services
65
35
Percentages, N=20
14

4.3 Variation of Satisfaction Level
Categories of Municipalities
Satisfied (%) Dissatisfied (%)
A 70.00 30.00
B 52.50 47.50
C 36.66 63.33
Ø Citizens from C category and B category Municipalities are more dissatisfied than the A category Municipalities Ø Level of dissatisfaction increase with the lower categories of Municipalities
q Category-wise Variation 15

4.4 Variation of Satisfaction Level (Contd.)
Nature of Municipalities Satisfied (%) Dissatisfied (%)
Old Municipalities 55.00 45.00
Relatively Old Municipalities 55.00 45.00
New Municipalities 43.33 56.67
(Note: Old Municipalities- established before 1900, Relatively Old Municipalities- established between 1989- 1999, New Municipalities -established after 2000)
Ø Number of dissatisfied citizen is more in newly established Municipalities
q Year of Establishment
16

Population Satisfied (%) Dissatisfied
(%)
<25,000 58.00 42.00
25,000-50,000 45.00 55.00
50,000> 40.00 60.00
4.5 Variation of Satisfaction Level (Contd.)
Ø With the increase of the population size, level of dissatisfaction among the citizen increases
q Population 17

4.6 Reasons behind Dissatisfaction
Lack of Opportunity for the Citizens to Interactwith the Municipality
High Politicisation of Municipality Affairs aswell as Political Polarization
Demands Unmet/Poor Quality Services
2.56
20.51
66.66
q Widespread dissatisfaction (66.66 percent) of citizens with the poor quality services delivered by their Municipalities q High level of politicisation in Municipality affairs. q Local political leaders and Municipal Officials often blamed each other for weak service delivery.
Note: Multiple responses were accepted
In percentages 18

4.7 Disaggregated Analysis of Service-Related Problems
Higher Tax Rate
Insufficient Anti-mosquito Sprayingand Killing Operations
Electricity Supply, Load Shedding
Poor Waste Management
Construction of New and Maintenanceof Old Roads
Insufficient Lighting
Water Supply Problem
Sanitation & Drainage Problem
9.17
17.43
18.35
24.77
37.61
46.78
55.96
67.89
Note: Multiple responses were accepted
In percentages 19

5. Mapping the Determinants of Citizen’s Satisfaction with Municipality Services
20

Satisfaction with
Municipalities
Delivery of
Efficient and
Quality
Services
Citizen’s
Participation in
the
Development
Projects
Payment
of Taxes
Satisfaction with
Tax Collection
Process of the
Municipalities
Satisfaction with
the Utilization of
Taxes by
Municipalities
Satisfaction with
the Existing
Accountability
Mechanisms
Perception on
the Incidence of
Corruption in
Development
Work
Satisfaction with
Municipalities
Pearson Correlation 1
Sig. (2-tailed)
N 90
Delivery of Efficient
and Quality Services
Pearson Correlation .742** 1
Sig. (2-tailed) .000
N 90 90
Citizen’s Participation in
the Development
Projects
Pearson Correlation .319** .385** 1
Sig. (2-tailed) .003 .000
N 84 84 84
Payment of Taxes
Pearson Correlation -.026 -.029 .116 1
Sig. (2-tailed) .804 .787 .295
N 90 90 84 90
Satisfaction with Tax
Collection Process
Pearson Correlation .411** .502** .345** .253* 1
Sig. (2-tailed) .000 .000 .001 .016
N 90 90 84 90 90
Satisfaction with the
Utilization of Taxes by
Municipalities
Pearson Correlation .641** .601** .284** .019 .332** 1
Sig. (2-tailed) .000 .000 .010 .859 .002
N 87 87 82 87 87 87
Satisfaction with the
Existing Accountability
Mechanisms
Pearson Correlation .413** .448** .523** .228* .322** .507** 1
Sig. (2-tailed) .000 .000 .000 .033 .002 .000
N 88 88 83 88 88 86 88
Perception on Incidence
of Corruption in the
Development Work
Pearson Correlation -.240* -.203 -.164 -.185 -.065 -.491** -.353** 1
Sig. (2-tailed) .024 .057 .138 .083 .544 .000 .001
N 89 89 83 89 89 86 87 89
**. Correlation is significant at the 0.01 level (2-tailed).
*. Correlation is significant at the 0.05 level (2-tailed).
21

5. Mapping the Determinants of Citizen’s Satisfaction with Municipalities (Contd.)
q Efficient delivery of services and citizen’s satisfaction with the Municipalities ⇒ A strong positive correlation (r = .742 and p < 0.01)
This means that citizen’s satisfaction is highly dependent on efficient delivery of Municipal services.
q In the sampled Municipalities, participation and the satisfaction ⇒ A positive correlation (r = .319 and p < 0.01)
This means with the increase of participation in the development projects, citizen’s satisfaction with the Municipalities’ increases.
q Payment of taxes and citizen’s satisfaction with the Municipalities ⇒ An inverse relationship (r = -.026 but p > 0.05) This means the trend is not statistically significant. r’ value indicates that those who pay taxes are more dissatisfied with the services. But higher level of ‘p’ value indicates that there are significant variances among the perception of satisfaction with the Municipalities.
22

5. Mapping the Determinants of Citizen’s Satisfaction with Municipalities (Contd.)
q Citizen’s satisfaction with the tax collection process and citizen’s overall satisfaction with the Municipalities ⇒ A strong positive correlation (r = .411and p < 0.01) Tax payer’s satisfaction with the municipalities reduces, if they are not comfortable with the tax assessment process, if they are not assured that there is a fair way to redress their grievances, if there is any or, if there is a possibility for them encounters harassments during the process of payment of Taxes. q Citizen’s perception of utilization of taxes and citizen’s satisfaction with the Municipalities as whole ⇒ A strong positive correlation (r = .641 and p < 0.01) It is generally expected that those who pays taxes, their money needs to be utilized properly. The lack of trust with regard to the proper utilization of tax may lead to citizen’s dissatisfaction with Municipalities.
23

q Citizen’s satisfaction with the Municipalities and accountability mechanisms ⇒ positively correlated (r = .413and p < 0.01) If the citizens’ confidence on the accountability mechanism reduces then the satisfaction with the Municipalities reduces. q Citizen’s satisfaction with Municipalities and the citizen’s perception on the incidence of corruption in development work undertaken in Municipalities ⇒ A negative correlation (r = -.240 and p < 0.05) This means with the increase of corruption, the satisfaction of the citizen with Municipalities decreases.
5. Mapping the Determinants of Citizen’s Satisfaction with Municipalities (Contd.)
24

5.1 Reasons behind Poor Quality Service Delivery
Major Responses Percentage
Acute Financial Stress 65
Lack of Commitment of the Mayors, Councilors & Other
Municipality Officials
37
Corruption of Contractors and Elected Representatives 26
Political Considerations in Implementing Local
Development Projects
15
Low Level of Social Audit/Citizen Engagement 10
Poor Capacity of Officials of the Municipalities and City
Corporations
9
Note: Multiple responses were accepted
25

6. Taxation In Municipalities
High Tax rate
Citizens Not Accustomed to Pay Tax
Corruption in the Assessment andCollection Process
People Have No Idea About ProperUitlization of Tax Money
People Not Having Ability to Pay
10.81
13.51
21.62
21.62
45.94
Reasons behind Citizen’s Unwillingness to Pay Taxes:
Note: Multiple responses were accepted
In percentages
26

6.1 Variations of the Satisfaction Level on the Utilization of Collected Taxes
Satisfied (%) Dissatisfied (%)
Citizens who Pay Taxes 35.71 75.51
Citizens who Don’t Pay Taxes
11.11 66.67
q Dissatisfaction is higher among the citizens who pay taxes to the Municipalities
27

6.3 Possible Ways to Increase Revenue Collection (Citizens’ perception)
Major Responses Percentage
Establishing New Industries, Markets, Recreation Centres 45.64
Proper Assessment and Collection of Taxes from the Influential Local Economic Elite
43.47
Increase Citizen's Awareness about Need to Pay Taxes 31.52
Provide Quality Services with Direct Supervision 29.34
Imposing Taxes on Local Vehicles and Collection of Taxes from the Vehicles Entering into Municipalities (Pourashavas)
8.69
Increase Market other Property Leasing Rate, Holding Tax Rate 5.42
Note: Multiple responses were accepted
28

7. Governance Issues
q Satisfaction with the Accountability Mechanism
Citizens Dissatisfied with theMunicipality/CC Accountability
Mechanism
Citizens Satisfied with theMunicipality/CC Accountability
Mechanism
85.20
14.80
Percentages
29

7. Governance Issues (Contd.)
Ø Majority of respondents (63.3 %) heard about corrupt practices in their Municipality/CC led development projects.
q Corruption
Citizens Frequently Heard aboutCorrupt Practices
Citizens Never Heard aboutCorrupt practices
63.3
36.7
Percentages
30

7. Governance Issues (Contd.)
Nature of Common Corrupt Practices Known to Citizens
Major Answers Percentage
Corrupt Practices by the Municipality Mayor, Councilors and Other
Officials
92.06
Local Politician’s Involvement in Corruption 34.92
Dishonesty of Municipality Engineers, Councilors and Contractors
Involved in Development Projects
34.92
Both the Elected Representatives and the Employees are Less Active in
Collecting Taxes from the Local Economic Elites
11.11
Corruption in Tendering 9.52
Note: Multiple responses were accepted
31

7. Governance Issues (Contd.) Suggestions for Making a More Accountable
Municipality/CC
Major Answers Percentage
Regular Meeting with Citizens & Regular Publication and Sharing
of Different Reports
74.76
Increase Peoples’ Awareness and Ensuring Participation 56.56
Activating Local Civil Society and Increase Local Community
Oversight
16.16
Activating the Ward level Coordination Committee (WLCC) with
Immediate Effect
14.14
Note: Multiple responses were accepted
32

7. Governance Issues (Contd.)
Ø Though the Municipalities/CCs have the system requires regular preparation of audit reports, but there is no provision of disclosing the reports to the general people.
q Disclosure of Audit Report
Regular DisclosureNo Idea
Not Regular
7.30 38.20
54.50
Percentages
33

7. Governance Issues (Contd.)
Ø Decisions regarding development project identification are finalized through the traditional system. ØNo active input from the community in project identification process and citizens are mostly not aware about the total identification process.
q Participation
Citizens Rarely Participate in DevelopmentProject Identification Process
Citizens Always Participate in DevelopmentProject Identification Process
71.20
28.80
Percentages
34

7. Governance Issues (Contd.)
q Participation of the Citizen Ø From the study it appears that the citizen have very limited scope for participation not only in the development project identification and implementation, but also in the overall activities of the Municipalities/CC.
q Participation of the Elected Representatives Ø In most of the Municipalities/CC, the Mayors take all the decisions, if the councilors are from opposition parties, hardly they have the chance to participate in important decision making process.
q Participation of the Women Ø Citizens often hear from the women Councilors that they a have a “very limited” or “no voice” in decision making process of the Municipalities and City corporations
35

Structure of Urban Local Government: Indian ULG consists of Municipal Corporation, Municipal Council, Nagar Panchayat (Town Council); Tanzanian ULG consists of City councils, Municipal councils and Town councils and Bangladesh ULG consists of City Corporations and Municipalities (Pourashavas) Nature of the executive: In India & Bangladesh Executive is elected but sometimes government appointed administrators from the civil servants; In Tanzania Indirectly elected by the elected members
8. Comparative Analysis Among Urban Local Government Bodies in India, Tanzania and Bangladesh
36

8. Comparative Analysis Among Urban Local Government Bodies in India, Tanzania and Bangladesh
q In case of ‘Reserved Seats’ India has the provision to reserve seats for SC (Schedule Cast) and ST (Schedule Tribe) and women; Tanzania has the provision to appoint women members and Bangladesh also has the provision to reserve seats for the women
q Major Sources of `Own' Municipal Taxes:
ØIndia: Octroi, property tax, profession tax, advertisement tax, vehicle tax, theatre tax
ØTanzania: Property tax, levies, licenses, fees
ØBangladesh: Holding tax, land transfer fees
q Local government expenditure as a percentage of GDP
Ø India: Around 4%
ØTanzania: Around 2.5 %
ØBangladesh: Bellow 1%
37

8. Comparative Analysis Among Urban Local Government Bodies in India, Tanzania and Bangladesh (Contd.)
q In India 80 per cent of ULGs income comes from central government, In Tanzania 93 % of resource come from central government and in Bangladesh it varies between 60% -99%
q All of these countries have the political intervention on the distribution of grants where Tanzania has especially in distributing ‘ ‘personal emoluments’ & Bangladesh has especially in distributing ‘especial block grant’
q In case of ‘Borrowing’, India has provisions to borrow for certain sectors. For example, in Karnataka, there are provisions to borrowing for roads sector . But in Tanzania it is heavily constrained and contributes less than 0.1% and in Bangladesh it is legally permitted but not practiced
q Both in India and Tanzania major source of own revenue is ‘Property Tax’ whereas in Bangladesh it is “Holding Tax’
38

q Committee System:
Ø India has various Statutory (executive committee, standing committee, planning committee etc.) and Non-Statutory Committees (transport committee, women and child welfare committee etc.)
Ø Tanzania has Mtaa and ward development committee (WDC).
Mtaa (street – a small urban area or geographical division of a ward), committees provide a grassroots link to the ward structure, and mobilize participation in local development. Priorities for local service delivery and development projects are discussed by the committees, before being forwarded to the WDC.
Ø Bangladesh: Legal Provisions for Standing committee, Ward-level coordination committee (WLCC) and Town- level coordination committee (TLCC); but only the standing committees exist on papers, but not made functional in reality
8. Comparative Analysis Among Urban Local Government Bodies in India, Tanzania and Bangladesh (Contd.)
39

9. Innovations in Local Government Institutions in other Countries and Lessons for Bangladesh
q Formula-based Grant System in Tanzania In 2006, Tanzania introduced a formula-based General Purpose Grant (GPG) by merging the local administration grant with the compensation grant. This grant is allocated based on the following factors: Ø Population. Ø Number of school aged children (for primary education grant). Ø Poverty count. Ø Infant mortality rate as proxy for burden of disease (for health grant). Ø Distance from council headquarters to service outlets as proxy for land area.
q Tanzania does have a Performance Based Grant for the LGIs.
40

9. Innovations in Local Government Institutions in other Countries and Lessons for Bangladesh (Contd.)
q Formula-based Performance Grant System in Bangladesh? Ø In Bangladesh, there are provisions for performance based allocation in the rural local government institutions namely Union Parishads and Upazila Parishads under the Local Governance Support Project (LGSP) and Upazila Governance Project (UZGP) projects. Such initiatives can also be introduced in the urban local government institutions in Bangladesh. Ø Performance grants are given to UPs & Upazilas under LGSP and UZGP respectively, against number of predetermined performance criteria. Ø Performance grants are given to stimulate the improved governance and these funds are made available to the LGIs in addition to the regular ADP allocation by the government.
41

q Revenue Collection Process in Tanzania
Ø In Tanzania, before 2003, revenue collection was largely organized around the council headquarters and wards. Ø After that a large number of revenue sources have been outsourced to the private agents. Ø Many local revenue sources are seasonal and thus the necessary inputs required for revenue collection also fluctuate. Ø Since council staffs are employed on a permanent basis, the employee costs are fixed throughout the year. In contrast, a private agent or a market association have much more flexibility with respect to labor inputs and thus can reduce the operational costs of revenue collection.
9. Innovations in Local Government Institutions in other Countries and Lessons for Bangladesh (Contd.)
42

q Fund Generation in Indian Municipalities
Ø To solve the problem of fiscal stress, in 1996, Ahmedabad Municipal Corporation (AMC) was the first urban authority in India to request and receive a rating for a Municipal Bond for water and sewerage expansion.
Ø But, before any such initiative to raise fund in Bangladesh, needs very cautious assessment about the suitability in Bangladesh
9. Innovations in Local Government Institutions in other Countries and Lessons for Bangladesh (Contd.)
43

10. Concluding Remarks
q Increase Citizen’s Participation- Standing Committee, Activate Town Level Coordination Committee (TLCC) and Ward level Coordination Committee (WLCC), Citizens Organize open budget meeting q Increase Central Monitoring for Activating Standing Committees- This the most effective way to deal with current “one man show” in the municipalities/City Corporations. q Increase Communication between Citizens and Municipalities –Organize Quarterly Opinion Sharing Meeting with Civil society and Community-based organizations.
44

10. Concluding Remarks (Contd.)
q Improve the Quality of Services which will help collect more local revenue (roads, drainage, lighting, conservancy, safe water supply) q Utilize the Collected Revenue Properly Taking into Account the Citizen’s Opinions (investing in health, education and recreation facilities for both children and the adults) q Making the Local Economic Elite Pay Fair Amount of Tax
q Remove the Problems Associated with the Assessment and Collection of Taxes q Establish Social Audit and Improve Accountability Mechanisms to reduce corruption
45

THANK YOU FOR
YOUR ATTENTION
46