“the turnkey solar factory company” - piper jaffray · • fluitecnik – row (dominican...
TRANSCRIPT
“The Turnkey Solar Factory Company”Company
Clean Technology and Renewables Conference
G iRoger G. LittleFebruary 19, 2009
SPIRE SAFE HARBOR STATEMENTThis presentation may include forward-looking statements within the meaning of Section 27A of the Securities Act of 1933 as amended and Section 21E of
SPIRE SAFE HARBOR STATEMENT
of Section 27A of the Securities Act of 1933 as amended, and Section 21E of the Securities Exchange Act of 1934. We have based these forward-looking statements on our current expectations and projections about future events. These forward-looking statements are subject to known and unknown risks, uncertainties and assumptions about us and our affiliate companies, that may cause our actual results, levels of activity, performance or achievements to be materially different from any future results, levels of activity, performance or achievements expressed or implied by such forward-looking statementsachievements expressed or implied by such forward looking statements. Factors that might cause or contribute to such a discrepancy include, but are not limited to our ability to effectively implement our business model, fluctuations in our operating results, our ability to expand revenue and sustain p g y pgrowth, as well as those identified in our other Securities and Exchange Commission filing and other public documents, including our Annual Report on Form 10-KSB.
2
“The Turnkey Solar Factory
Spire Corporation (Nasdaq: SPIR) is a
y yCompany”________________________________________________________________
leading Global Solar Companyproviding capital equipment and turnkey solutions to photovoltaic y pmodules manufactures worldwide
“Spire Makes the Machines“Spire Makes the MachinesThat Make The PV Modules”
3
Spire Key Facts
• Established in 1969Spire Key Facts
________________________________________________________________
• Solar for 30 Years• Nasdaq Since 1982
Capital Equipment for xSi & Thin Film• Capital Equipment for xSi & Thin Film• Turnkey Production Lines• Over 50 PatentsOver 50 Patents• Over $100M in R&D• Bedford, MA• 230 Employees• Approximately 200 Solar Customers in 50
C t i4
Countries

Global Customer Base________________________________________________________________
5
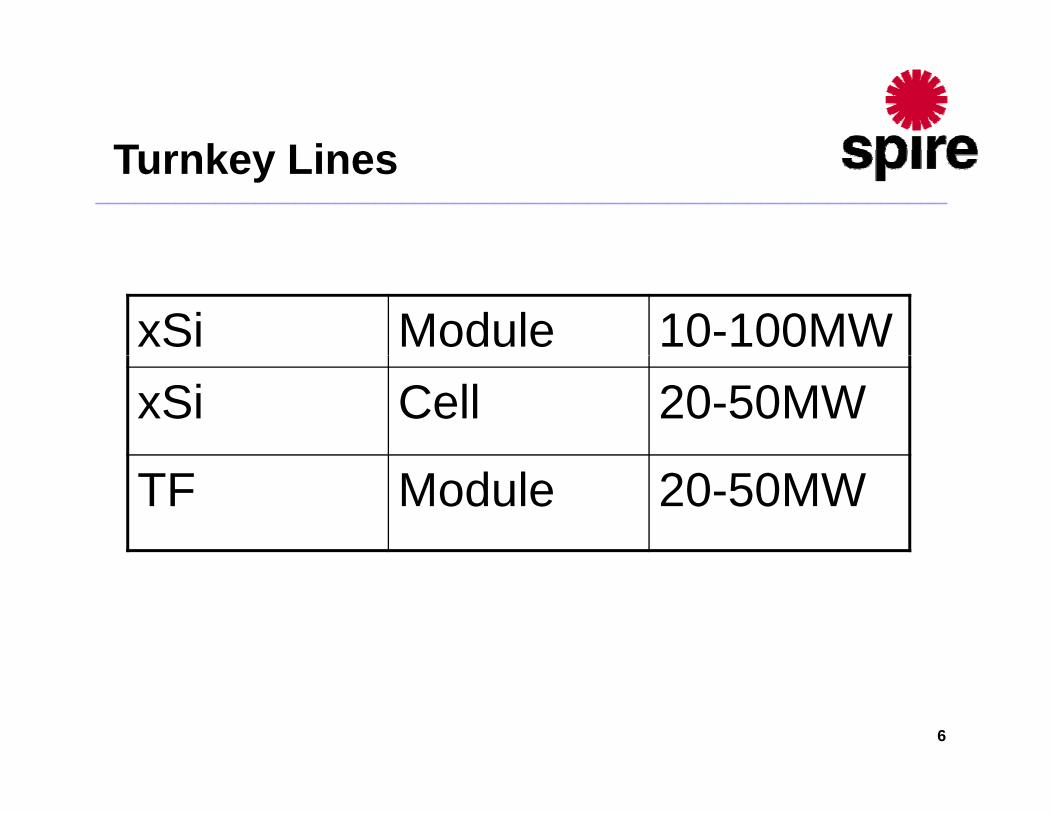
T k LiTurnkey Lines________________________________________________________________
xSi Module 10-100MWxSi Cell 20-50MW
TF Module 20-50MW
6
7
Spire Key FactsxSi Will Dominate
________________________________________________________________
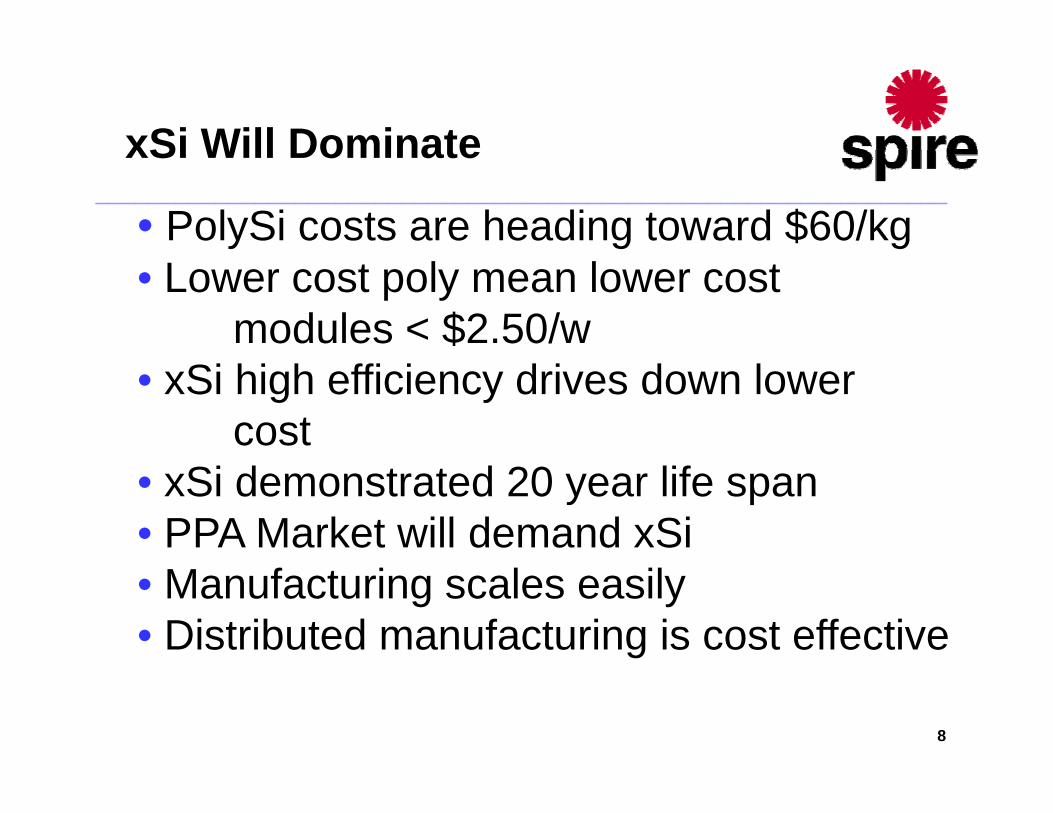
• PolySi costs are heading toward $60/kg
xSi Will Dominate
• Lower cost poly mean lower cost modules < $2.50/w
• xSi high efficiency drives down lower cost
• xSi demonstrated 20 year life span• PPA Market will demand xSi• Manufacturing scales easily• Distributed manufacturing is cost effective
8
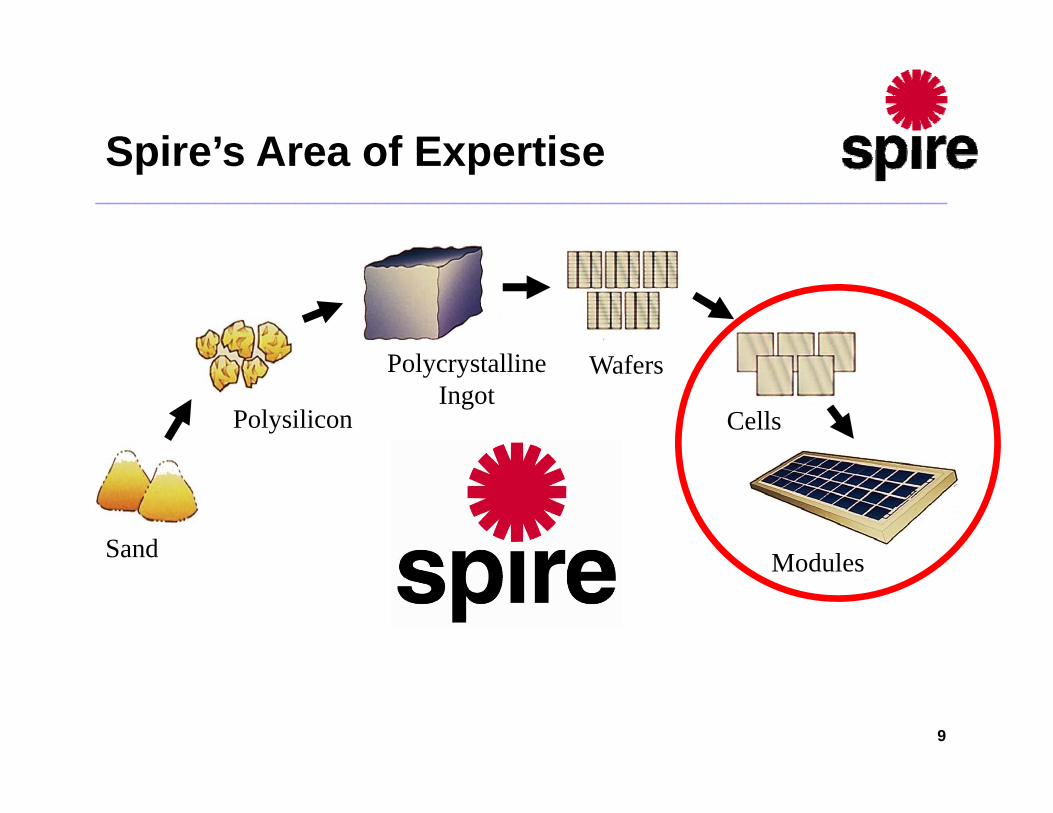
Spire’s Area of ExpertiseSpire s Area of Expertise________________________________________________________________
P l lli f
Polysilicon
Polycrystalline Ingot
Wafers
Cells
Sand ModulesModules
9

Si T k M d l LixSi Turnkey Module Line________________________________________________________________
Module Lay-Up Laminator
String Assembler Framerg Framer
10Cell Tester Module Tester
2008 T k F t i2008 Turnkey Factories________________________________________________________________
• Powercom/Texmac – TaiwanPowercom/Texmac Taiwan• Prosperity Solar – Taiwan• Gloria – Taiwan• Solaria Expansion – Europe• Alpex – India• Fluitecnik – ROW (Dominican Republic)• Fluitecnik – Europe (Portugal)
G B illi I di• GreenBrilliance – India• PLG – India• ET Solar – China (except Laminators)• Ryazan Russia• Ryazan – Russia• BTCP – Russia• Dong Yang – Korea• HHV – Korea
11
• HHV Korea• Unicor – USA• IX Energy – USA
S St A t ti
• Provided fully automated module
Success Story - Automation________________________________________________________________
• Provided fully automated module manufacturing lineC bl f 50MW / G i t• Capable of 50MW / Growing to 100MW
• Integrates automation• 50MW Facility = 30 operatorsy p
12
S St R id C tifi ti
• 25MW Semi-Automated crystalline
Success Story – Rapid Certification________________________________________________________________
• 25MW Semi-Automated crystalline cell module manufacturing lineC ’ 1st t t f th t l• Company’s 1st state-of-the-art solar energy facility
• Achieved IEC certification within 1 month of factory starty
13
S St Thi Fil B k E d
• 100MW a-Si Thin Film
Success Story – Thin Film Back End________________________________________________________________
• 100MW a-Si Thin Film • Automated back-end thin film
S i h t h l d• Spire has technology and process knowledge to accept any substrate
14
S St
• Multi-year multi-system contract for
Success Story – Factory Expansion Equipment________________________________________________________________
• Multi-year, multi-system contract for Spi-Sun Simulator 4600SLPR l tit t ith• Replace competitors system with Spire Simulators
• Same Simulators used by TUV, UL, and NREL
15
S St US E i
• Began with 10MW factory
Success Story – US Expansion________________________________________________________________
• Began with 10MW factory• Expanded to 180MW
S l i t 2002 t €900 B• Solaria est. 2002 – grown to €900 B in 5 years running Spire Factory
16

S St US E i• Established factory in upstate New York
Success Story – US Expansion________________________________________________________________
• Established factory in upstate New York (Otisville)Key partnership with leading suppliers• Key partnership with leading suppliers of raw materials to provide best value
d t t tproducts to customers• Spire’s connection to US
market and supply chain
17

18
Breeder Factories for Solar FarmsFarms
• Demonstrate lower cost systems withDemonstrate lower cost systems with larger modules ½ (?)
• Indentify cost advantages with on site• Indentify cost advantages with on site manufacturing – packing shipping,assembly
• Target PPA providersg• Move factory when farm is complete
19
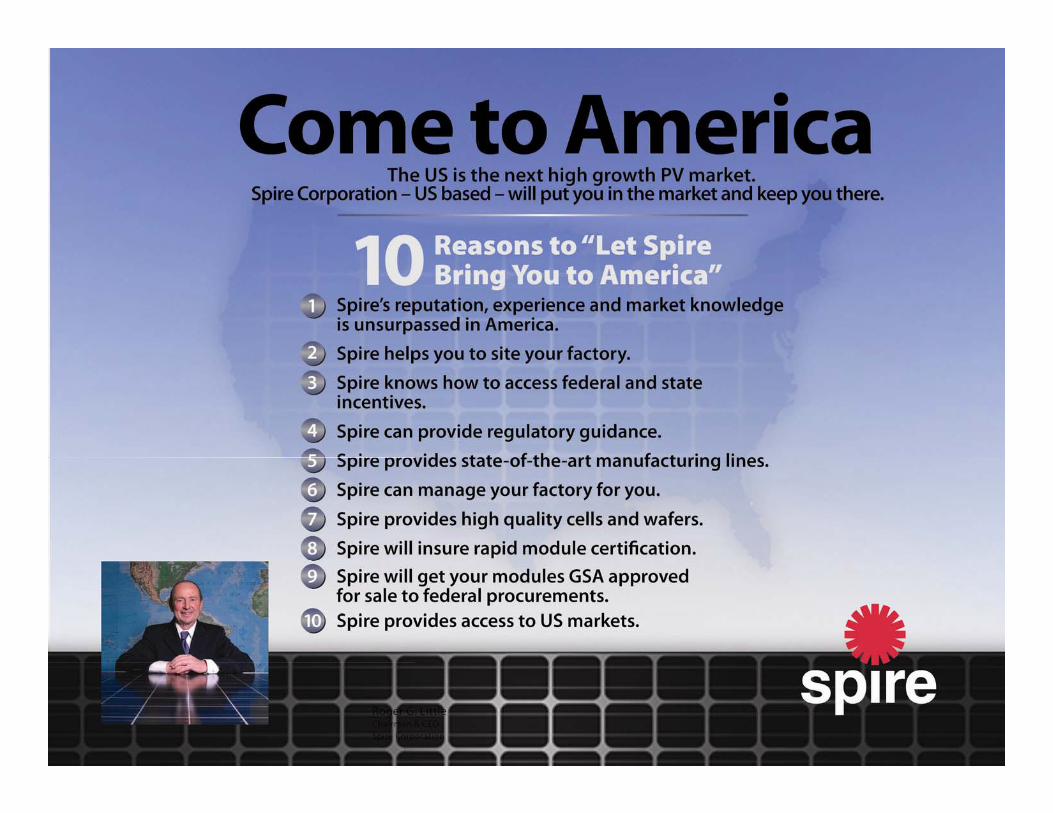
“C T A i ”“Come To America”• Spire provides support to expedite entry
________________________________________________________________
p p pp p y• State and federal government incentives• Regulatory guidanceg y g• Site selection• SOA manufacturingg• Source of Cells and Wafers• UL Module Certification• GSA Approval • Market Access
20

Incremental Module Production
120
Capacity Additions________________________________________________________________
100MW
80
100
50MW60
80
MW / year
10MW
25MW20
40
10MW5MW1MW0
20
1980-85 1985-90 1990-95 1995-00 2000-05 2005-10
21
1980 85 1985 90 1990 95 1995 00 2000 05 2005 10
Year
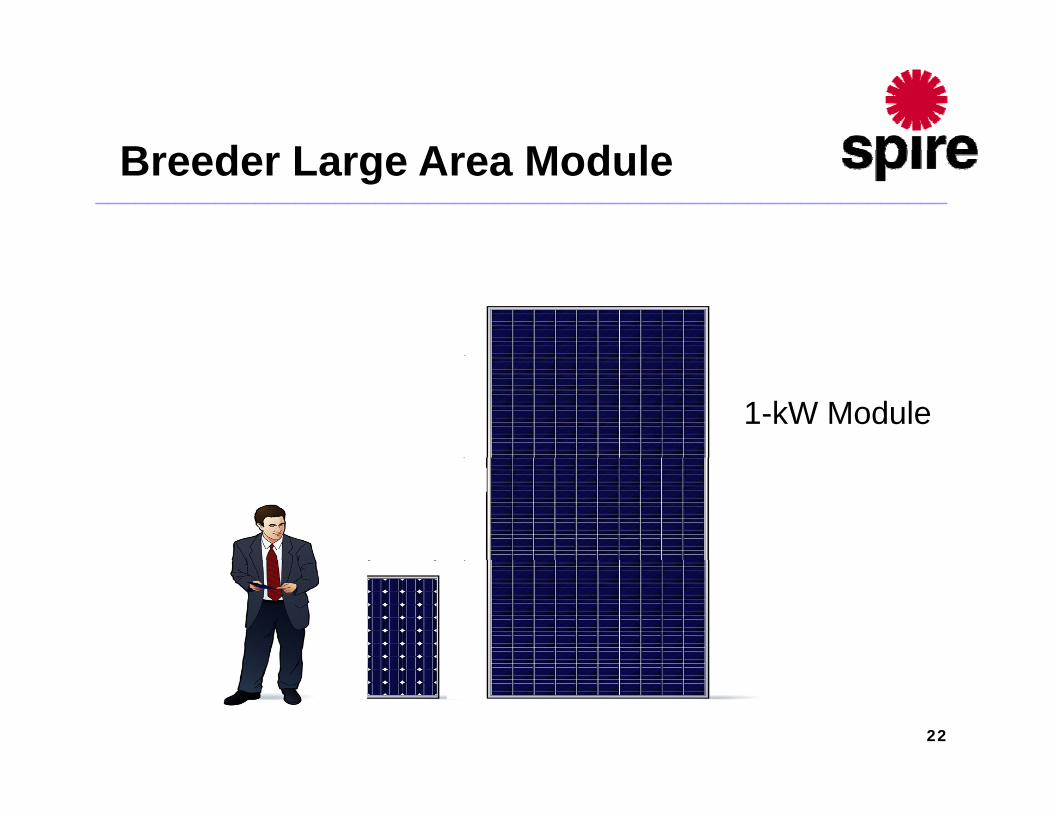
B d L A M d lBreeder Large Area Module________________________________________________________________
1-kW Module
22
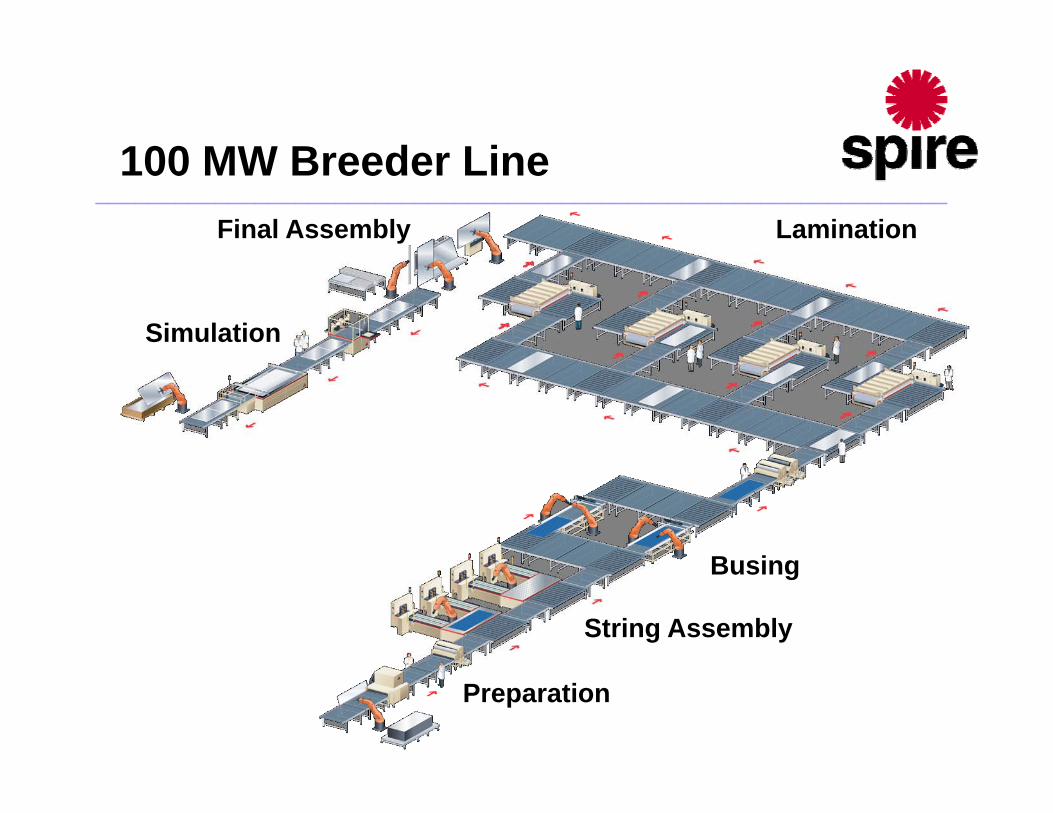
100 MW B d LiFinal Assembly Lamination
100 MW Breeder Line________________________________________________________________
Simulation
B singBusing
String Assembly
23
Preparation
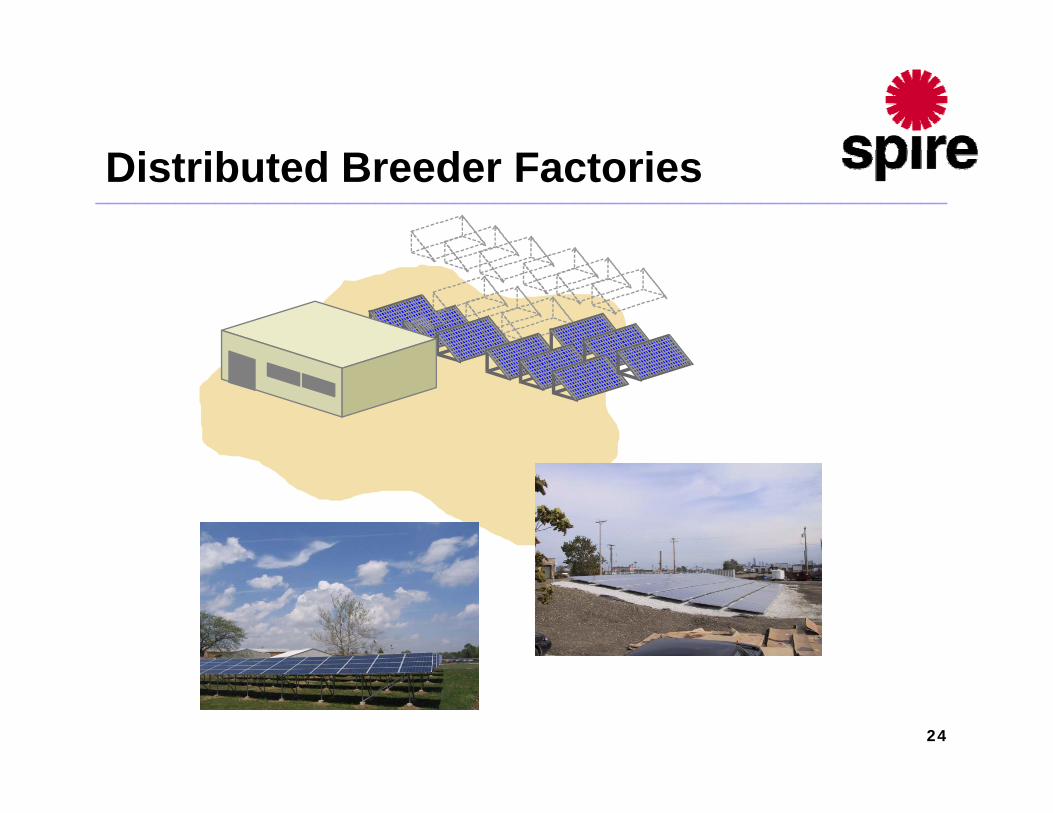
Spire EvolutionDistributed Breeder Factories
________________________________________________________________
24

Spire EvolutionBreeder System Cost
________________________________________________________________
BOS$0 65
$0.20 Total $2.96$0.65
Module $2.11
25
S i ’ P d t Pi liSpire’s Product Pipeline• 100 MW/yr Building Block Module Line
________________________________________________________________
y g• Line for Factory Expansions• Stand Alone Line for Regional g
Manufacturing• Line is Platform for High Throughput, g g p
Automated, Large Modules• Producing 1 KW Sized Modulesg• Target Cost of $2.50/watt Module and
$3.60/watt Module System
26
y
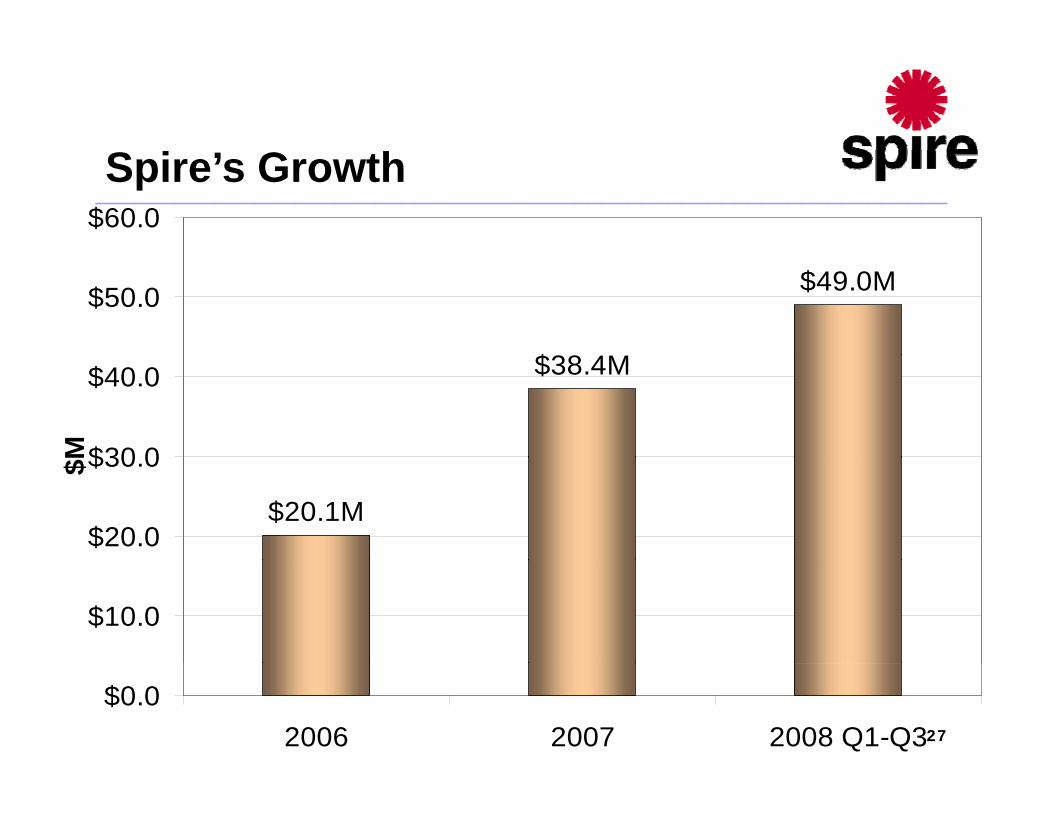
Spire’s Growth________________________________________________________________$60.0
$49.0M
$38 4M
$50.0
$38.4M
$30 0
$40.0
M
$20.1M$20.0
$30.0$
$10.0
27
$0.02006 2007 2008 Q1-Q3
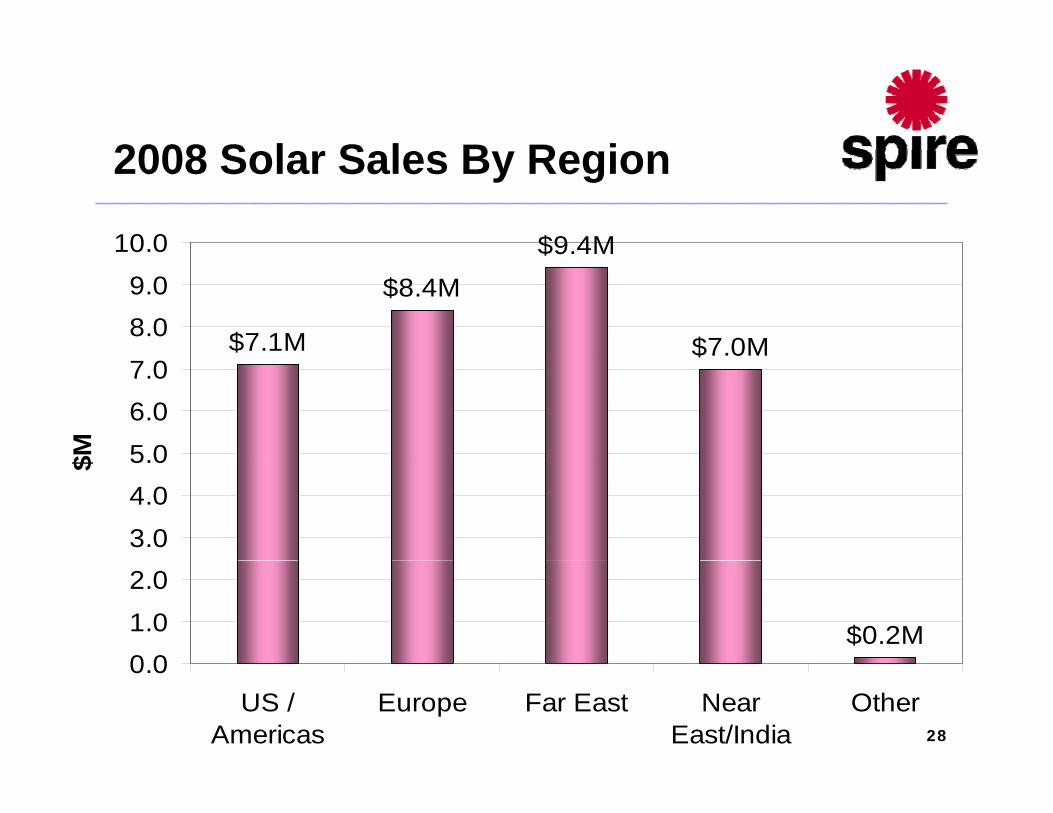
2008 S l S l B R i2008 Solar Sales By Region________________________________________________________________
$9.4M10.0
$7.0M
$9.4M$8.4M
$7.1M8.09.0
$7.0M
5 06.07.0
$M
3.04.05.0$
$0.2M0 01.02.0
28
0.0US /
AmericasEurope Far East Near
East/IndiaOther
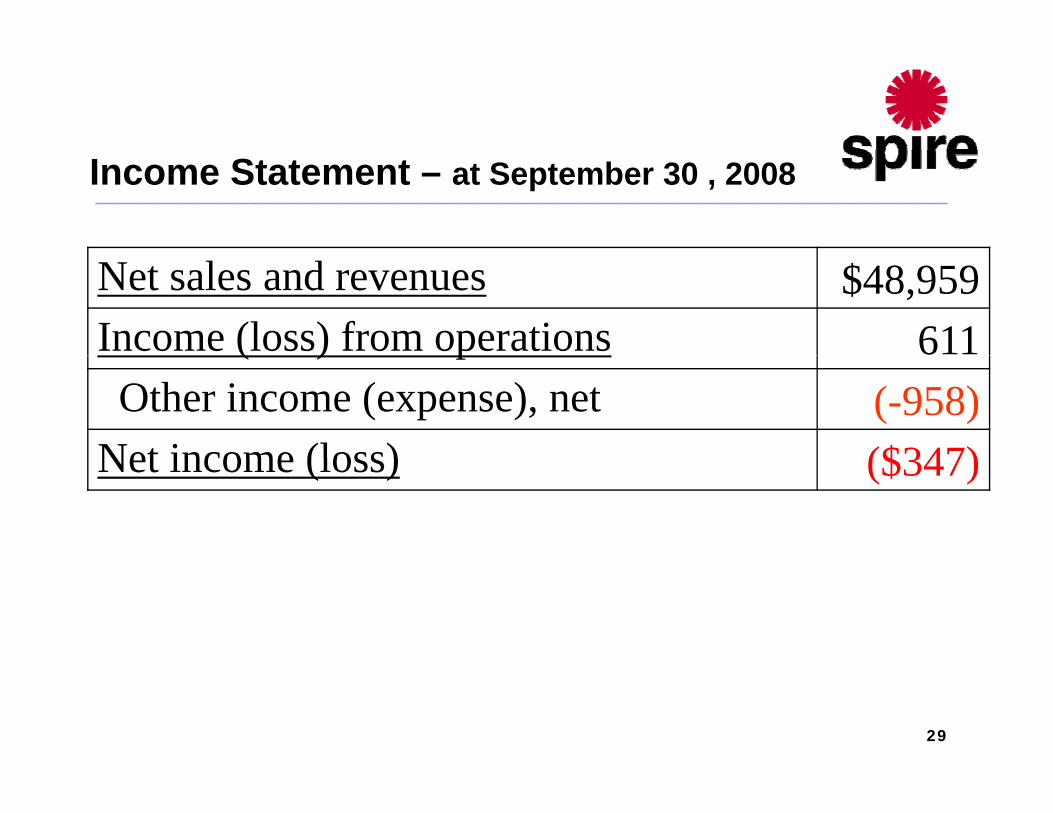
Income Statement – at September 30 , 2008________________________________________________________________
Net sales and revenues $48,959 Income (loss) from operations 611( ) pOther income (expense), net (-958)
Net income (loss) ($347)Net income (loss) ($347)
29
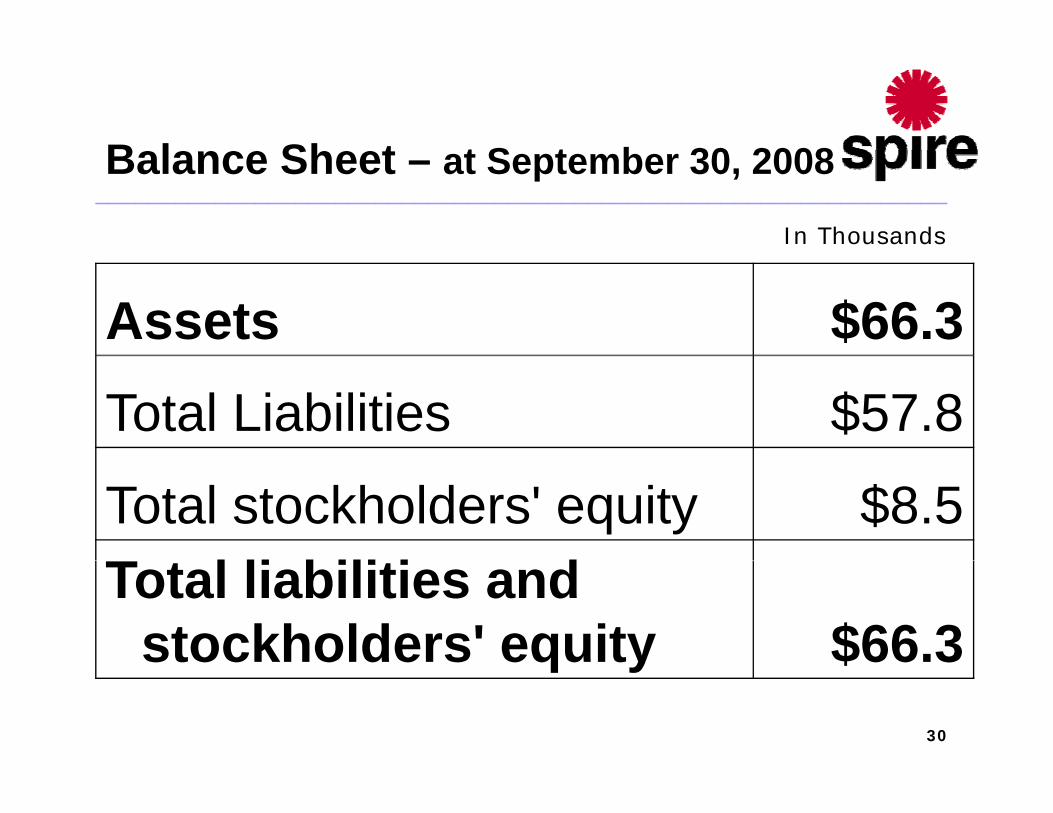
B l Sh t t S t b 30 2008Balance Sheet – at September 30, 2008________________________________________________________________
In Thousands
Assets $66.3Total Liabilities $57.8
Total stockholders' equity $8.5T l li bili i dTotal liabilities and
stockholders' equity $66.330
q y $
31