the treatment of air in road tunnels - cetu€¦ · the treatment of air ... the dilution of...
TRANSCRIPT
Tunnels Study Centre (CETU)
www.cetu.developpement-durable.gouv.fr
THE TREATMENT OF AIR IN ROAD TUNNELS
State-of-the-art of studies and works
Document updated in December 2016
Information document

2
DISCLAIMERThe information documents are intended to provide information about a technique or a problem which is new or is inadequately treated elsewhere. The reader can find background information there that may help them in their activities. The contents and any conclusions pre-sented must not be considered recommendations by the CETU. Although every effort has been made to ensure the reliability of sources used, the CETU or authors of the documents cannot be held responsible.
3
Information document
The treatment of air in road tunnels
State-of-the-art of studies and works
Document updated in December 2016
Tunnels study centre25, avenue François Mitterrand69674 BRON – FRANCETel. +33 (0)4 72 14 34 00Fax. +33 (0)4 72 14 34 30
cetu@developpement-durable.gouv.frwww.cetu.developpement-durable.gouv.fr
4
Introduction 5
1 Pollutants and related French regulations governing internal and external tunnel environments 6 1.1 Permissible levels within road tunnels 6 1.2 Permissible levels in the open air 7
2 Electrostatic filtration of particles 10 2.1Principleofelectrostaticfiltration 10 2.2 Implementation according to technical requirements or targeted objectives 11 2.3 Filter regeneration 12 2.4 Theoretical performance of system 13 2.5 Dimensions 14 2.6Costoffiltrationsystems 15 2.7Overviewoftunnelsequippedwithelectrostaticfiltrationsystems 16 2.8Conclusionsonelectrostaticfilters 21
3 Denitrification using the absorption method 22 3.1 Principle 22 3.2ImplementationinSpain,AustraliaandNorwayviauseofanactivatedcarbonfilter 22 3.3 Implementation in Japan using potassium hydroxide 24 3.4 Conclusion on gas systems 24
4 Alternative and innovative techniques 25 4.1Bagfilters 25 4.2 Treatment of gases 25 4.3Biofiltration 27 4.4 Conclusion 29
General conclusion 30
Bibliography 31
Annexes: photographic compendium following the May 2009 visit to the M30 in Madrid 32
TABLE OF CONTENTS

5
INTRODUCTIONRoad tunnels, often designed to circumvent obstacles, also provide an opportunity to shield residential areas from the nuisancecausedbyroadtrafficortobypassnatureareassen-sitivetopollution.Roadtrafficchannelledthroughtunnelsisstilla source of atmospheric pollution that has to be incorporated into tunnel operation. Atmospheric pollution has to be managed both inside tunnels to protect users’ safety and wellbeing, and outside tunnels at the discharge outlets in order to limit environmental impacts. These two aspects are governed by regulations that stipulate the pollution levels to be complied with inside tunnels,whicharequitedifferent to thosespecified forthe external environment.
Ventilation techniques are the most common approach to deal-ing with this two-fold issue. Ventilation is also used in smoke extractionprocessesintheeventoffire.Thisgenerallyinvolvesoptimising a system that provides “sanitary” ventilation in stand-arduse,andsmokeextractionintheeventoffire.
Generally speaking, the role of sanitary ventilation is to promote the dilution of pollutants inside tunnels through the intake of fresh air, which also dilutes the concentration of pollutants at tunnel portals. Mechanical air extraction systems can also be used to evacuate vitiated air from tunnels at several outlets along the length of the tunnel via one or more ventilation shafts, thus ensuring that pollutant discharges are not concentrated at the portals. These diverse ventilation mechanisms make it possible to comply with the regulations governing internal tun-nelairquality.Externally,theyareusedtosignificantlyreducethe impact of road pollution in areas (urban areas in particular) that may already be affected by a number of pollution sources.
Air treatment systems are designed to go beyond the simple principle of ventilation. These systems were developed in Japan fromthe1980sonwardsandwerefirstusedinNorwayinthe1990sduetothespecificfeaturesofcertaintunnelsthere,i.e.verylongtunnelswithsignificantcoveragethatmakesitdifficultto use conventional ventilation techniques; another example is the use of studded tyres that greatly increases particulate pollution and hinders visibility within tunnels.
In recent years, rising environmental concerns have led to these systems being used for other purposes upstream of discharge to the atmosphere, the aim this time being to limit the impact on the external environment. This makes it possible to supplement the treatment of particulates with that of gases. This shifts the focus onto meeting local pollution-related concerns. Owners, through large-scale land development projects, have focused on these technologies with a view to the preservation of fresh airwithinaspecificlocalisedcontext,i.e.thetunnelsontheM30in Spain, the Madrid orbital road. The GEIE-TMB (European Economic Interest Grouping of the Mont-Blanc Tunnel) has also decided to installanextraction-basedparticlefilterabove theFrench platform of the Mont-Blanc tunnel, in order to contribute to the various local initiatives aimed at improving air quality in the Chamonix Valley.
The CETU published a preliminary summary paper [1] on the treatment of air in a tunnel environment in 1999. This paper wasmainlybasedonthefindingsoftwocountries,NorwayandJapan. A more detailed information paper was then published in2010[2],tooutlinethetreatmenttechniquesdevelopedandthe new installations built since 1999.
Thisdocumentisarevisedversionofthe2010paper,containingupdates on the development of new treatment technologies and new installations built worldwide. The focus is on air treatment technologies,whetherparticulatefiltrationor the treatmentofgases.
The paper is organised into three sections:
• regulations governing atmospheric pollution and road tunnels,
• filtrationofparticulatematterintunnels,• denitrificationofgasesintunnels,• alternative and innovative techniques.

6
POLLUTANTS AND RELATED FRENCH REGULATIONS GOVERNING INTERNAL AND EXTERNAL TUNNEL ENVIRONMENTS
The French law on air and the rational use of energy [3], incor-porated into the Environmental Code, contains no requirements relating to permissible concentrations of pollutants in tunnels, nor even relating to the concentrations to be complied with in closed or partially closed underground structures. The main reference for underground structures is circular 99.329 of 8 June 1999 issued by the Ministry of Health [4]. This covers two pollutants:
• carbon monoxide (CO),• nitrogen dioxide (NO2).
However, the monitoring of air quality in tunnels is also based on the monitoring of smoke, via measurements of opacity, for which the CETU has recommended thresholds (les dossiers pilotes du CETU, Ventilation [5]).
Lastly, the technical instruction annexed to the circular of 25 August 2000 [6] stipulates maximum CO and opacity levels not to be exceeded in the event of an accident in a tunnel.
As exposure times for users of underground structures are generally fairly short, thresholds are calculated based on fairly shorttimes(15to30minutesatmost),orevenjustexpressedas an instantaneous threshold (see Table 1).
In France, conventional ventilation systems are sized so as to ensure that these thresholds can be complied with during the structure’s lifetime, with no need to use additional treatment systems.
Pollutant ParameterObservation
time
Regulatory or
recommended levelReference
Carbon monoxide
During accidents, at any point
in the tunnelInstantaneous value 150 ppm [171 mg/m3] Technical instruction of 25/08/00
Average content throughout the
whole length of the tunnel
15 minutes 90 ppm [103 mg/m3]
Circular of 08/06/99
30 minutes 50 ppm [57 mg/m3]
Nitrogen dioxideAverage content throughout the
whole length of the tunnel15 minutes 0.4 ppm [752 µg/m3] Circular of 08/06/99
Particles opacity
During accidents, at any point
in the tunnelInstantaneous value 9 · 10 –3 m –1
[≈ 900 µg/m3]
(PM10)Technical instruction of 25/08/00
In normal situations, at any point
in the tunnelInstantaneous value 5 · 10 –3 m –1
[≈ 500 µg/m3]
(PM10)CETU recommandation
Table 1: permissible level inside tunnels
PERMISSIBLE LEVELS INSIDE ROAD TUNNELS1.1
1
7
1.2.1 National criteriaNational air quality criteria are mainly based on:
• French decree, No. 2002-213, of 15 February 2002 relating to the monitoring of air quality and its effects on health and the environment, air quality objectives, alert thresholds and limit values [7];
• French decree, No. 2003-1085, of 12 November 2003 [8] transposing directive 2002/3/CE of the European Parliament and of the Council of 12 February 2002;
• French decree, No. 2007-1479, of 12 October 2007 [9] relating to air quality and modifying the environmental code (regulatory part). This decree partial implements the “ozone” (2002/3/CE) and “heavy metals/PAH” (2004/107/ CE) directives;
• French decree, No. 2008-1152, of 7 November 2008 [10] that completes the transposition of the directive “heavy metals/ PAH” (2004/107/CE);
• French decree, No. 2010-1250, of 21 October 2010 trans-posing directive 2008/50/EC of the European Parliament and of the Council of 21 May 2008 on ambient air quality and cleaner air for Europe [11];
• French circular of 12 October 2007 relating to the dis-semination of information to the public on particulates in suspension in ambient air [12].
Thesetextsformthebasisofaregulationfocusingonfivetypesof threshold relating to some or all of the seven pollutants listed below:
• nitrogen dioxide (NO2),• sulphur dioxide (SO2),• lead,• particulate matter with diameter less than 10 μm
(PM10),• carbon monoxide (CO),• benzene,• ozone (O3).
Thesefivetypesofthresholdaredefinedasfollows:
• Quality objective: a level of atmospheric pollutant con-centration to be attained in the long term and maintained, except where it is impossible to achieve this end using proportionate means, in order to ensure effective protec-tion of human health and the environment as a whole.
• Target value: a level of atmospheric pollutant concentra-tion set in order to avoid, prevent or limit harmful effects
on human health or on the environment as a whole, ideally, to be reached within a given time.
• Limit value: a level of atmospheric pollutant concentration basedonscientificknowledge,nottobeexceededwithina given time, in order to prevent or limit harmful effects on human health or on the environment as a whole.
• Information and recommendation threshold: a level of atmospheric pollutant concentration beyond which short-term exposure presents a risk to the health of particularly at-riskpopulationgroups,requiringimmediateandsuffi-cient information for these groups and recommendations to reduce certain emissions.
• Alert threshold: a level of atmospheric pollutant concen-tration beyond which short-term exposure presents a risk to the health of the general population or of damage to the environment, justifying the deployment of emergency measures.
Table 2onthefollowingpagesetsoutthemainvaluesdefinedthus.
Therearealsolimitsforfineparticulatematter(PM2.5) :
• French decree, No. 2010-1250, of 21 October 2010 on air quality sets an annual average target value of 20 μg/m3;
• French law, No. 2009-967, of 3 August 2009 on pro-gramming for the implementation of the Grenelle de l’environnment adopted a Particulate Matter Plan together with the objective for a 30% reduction in atmospheric levels of fine particulates by 2015.
ThecorrespondingParticulatesPlanwasadoptedinJuly2010.It comments that “although there are no linear relationships between ground-level emissions and atmospheric particulate concentrations, the goal will be to achieve a 30% reduction in emissions of primary particles PM2.5 by 2015, i.e. a reduction of 100 kt (kilotonnes) of PM2.5 by 2015”. These various elements conformtothesecondNationalHealth-EnvironmentPlan2009–2013thatprovidesfora30%reductioninconcentrationsoffineparticulatematterinambientairby2015.
This was a highly ambitious target. In reality, PM2.5 emissions onlyfellby15%between2010and2014[seeAssessmentofAirQualityinFrance2014,CGDD][13].
PERMISSIBLE LEVELS IN THE OPEN AIR1.2

8
1
Quality objectives Target values Limit values Recommendation and information thresholds and alert thresholds
NO2Annual average:
40 μg/m³
Annual average:
40 μg/m3
Hourly average:
not to be exceeded more than 18 hours per year:
200 μg/m3
Recommendation and information threshold
Hourly average: 200 μg/m³
Alert threshold
Hourly average:
• 400 μg/m³, exceeded for 3 consecutive hours,
• 200 μg/m³, whenever this threshold is exceeded the day before and risks being exceeded again the following day.
SO2Annual average:
50 μg/m³
Daily average: 125 μg/m³ not to be
exceeded more than 3 days per year
Hourly average: 350 μg/m³ not to be exceeded more than
24 hours per year
Recommendation and information threshold
Hourly average: 300 μg/m³
Alert threshold
Hourly average over 3 consecutive hours: 500 μg/m³
Lead Annual average: 0,25 μg/m³
Annual average: 0,5 μg/m³
PM10Annual average:
30 μg/m³
Annual average: 40 μg/m³
Daily average: 50 μg/m³ not to be exceeded more than
35 days per year
Recommendation and information threshold
Averaged over 24 hours: 50 μg/m³.
Alert threshold
Hourly average over 24 hours: 80 μg/m³
CO Averaged over 8 hours: 10,000 μg/m³
Benzene Annual average: 2 μg/m³
Annual average: 5 μg/m³
O3
Protection of health: 120 μg/m3 on average over
8 hours
Protection vegetation: 6,000 μg/m3 per hour in AOT40 from May to July.The “AOT40” is equal to
the sum of the differences between hourly concentrations
greater than 80 µg/m3 and 80 µg/m3 using only values for a one-hour period measured daily between 8h and 20h,
during a given period.
Protection of health: 120 μg/m3 maximum daily
dose for the average over an
8 hour period not to be exceeded on more than 25 days per average civil
year calculated over
3 years.
Protection vegetation: 18,000 μg/m3 per hour in AOT40 averaged from May to July and calculated over
5 years.
Recommendation and information threshold
Hourly average: 180 μg/m³
Alert threshold
For protection of the health of the general population: Hourly average: 240 μg/m³
For the progressive implementation of emergency measures:
• 1st threshold: 240 μg/m³, as an hourly average, exceeded for a period of 3 consec-utive hours;
• 2nd threshold: 300 μg/m³, as an hourly average, exceeded for a period of 3 consecutive hours;
• 3rd threshold: 360 μg/m³, as an hourly average.
Arsenic6 ng/m3 as an annual
average of the total content of the PM10 fraction
Cadmium5 ng/m3 as an annual
average of the total content of the PM10 fraction
Nickel20 ng/m3 as an annual
average of the total content of the PM10 fraction
Benzo(a)pyrene1 ng/m3 as an annual
average of the total content of the PM10 fraction
Table 2: National air quality criteria (fresh air)

9
1.2.2 European standardsEuropean standards on atmospheric pollution are incorpo-rated intoFrench law.Directive2008/50/CEof theEuropeanParliamentandoftheCouncil,of21May2008shouldbecited.This directive introduces an annual target value (less restric-tive than a limit value) for particles with diameter of less than 2.5μm,of25μg/m3,tobeimplementedasof2010.Thisvaluewillbecomearestrictivelimitvaluein2015.Lastly,in2020,thislimitvaluewillbeloweredfrom25to20μg/m3.
1.2.3 Pollutants to be considered in impact studiesBeyond those covered by current regulations, other pollutants are also being monitored due to their impact on health. This health impact raises questions on the related regulations, in cases where these pollutants are not already regulated. The health impact is also a component of road infrastructure impact studies.
As such, the methodological note on the evaluation of the effects on health of air pollution in road impact studies [14] specifiesthetypeofpollutanttobefactoredintothesestudies.This note is annexed to an interministerial circular dated 25 February2005[15].Thelistofpollutantstobetakenaccountof depends on the challenges faced by the project in question (i.e.expectedtrafficdensityandlanduse).Wherehighstakesare involved, there are 16 pollutants that must be factored into the studies:
• 5 volatile organic compounds (VOC): benzene, formalde-hyde, acetaldehyde, acrolein and 1,3-butadiene;
• 7 metals: chromium, nickel, cadmium, arsenic, lead, mercury and barium;
• nitrogen dioxide;• sulphur dioxide;• particulates;• benzo(a)pyrene.
The pollutants were chosen based on a comparative analysis ofthequantitiesemittedbyroadtrafficandtherelatedhealthrisks (selection of hazardous agents to be taken account of in assessments of health risks linked to road and rail infrastruc-tures [16]).
1.2.4 To sum upWhiletheregulationsgoverningtheinsideoftunnelsfocusontwo or three pollutants in particular, the regulations governing the outside of tunnels is far more wide ranging. This apparent plethora of pollutants actually covers four main families in addi-tiontoafew,specificpollutants:
• Volatile Organic Compounds including benzene, the best known representative;
• Polycyclic Aromatic Hydrocarbons, including benzo(a) pyrene which is used as a marker;
• Metals;• Particulates, closely related to the metals and PAH fami-
lies, as will be seen further on;• Nitrogen dioxide;• Sulphur dioxide;• Carbon monoxide;• Ozone, a secondary pollutant, concentrations of which
can only be reduced by cutting emissions of the originat-ing primary pollutants.
Some of these pollutants, although still being monitored, no longerrepresentasignificantenvironmentalchallenge.Thisisthe case, for example, with both sulphur dioxide and carbon monoxide where emissions and concentrations in ambient air and in tunnels have decreased substantially.
Of all these pollutants, it is particulate matter that raises the most questions in terms of health risks and which generally have the most serious effects. Particulate pollution also includes contamination by heavy metals and PAH where the particulate phases are the most common (i.e., the vapour phase of ben-zo(a)pyrenerarelyexceeds10%[17]).
In its annual pollution assessment of the Paris region, Airparif [18] revealed that, in 2014, 400,000 people living in the Ile-de-France region were at risk of potential exposure to PM10 at levels that exceed the legal limit. However, the number of inhabitants of the region exposed to these excess levels has been falling for several years.
Changes in the concentrations of nitrogen dioxide and vol-atile organic compounds must also be closely monitored, particularly due to their role in the ozone formation process and also regarding compliance with regulatory values of benzene and nitrogen dioxide.Airparif [18] also found that, in 2014,2.3 million people living in the Ile-de-France region (including more than90%ofpeople in thecityofParis)wereat riskofpotential exposure to nitrogen dioxide at levels that exceed the legal limit.
The external environment is therefore marked by the presence of various types of pollution, including substantial road pollution along the edges of main roads. Tunnels partially channel this pollution and modify its distribution.
The installation of an air treatment system would provide a means of eliminating some of this channelled pollution, thereby providingalocalisedsolutiontoaspecificpollutionissue,sub-ject to cost and energy consumption requirements. Accordingly, the treatment targets the problem pollutants mentioned earlier:
• particulate pollution;• gaseous effluents, in particular pollutants such as NO2
and Volatile Organic Compounds (VOC).

10
ELECTROSTATIC FILTRATION OF PARTICLES
Very few tunnels in the world are equipped with air treatment systems. There are about sixty such tunnels in existence, three quarters of which are in Japan and eight in Norway. In almost allcases,electrostaticparticlefiltrationsystemsareused.TheJapanesewerethefirsttoimplementsuchsystems;theirfirstinstallation dates back to 1979.
Theparticulatefiltrationrepresentsbothasysteminitselfandalso a system of pre-treatment if any action is planned on gas-eous effluents. However, in nearly 95% of cases, particulatefiltrationsystemsareusedaloneandnotinconjunctionwiththetreatmentofgaseouseffluents.
Thisfigure isexplainedbythefact thatparticulatefiltration isoften used in Norway or Japan to improve visibility in tunnels, where visibility is affected by particulate pollution, or to mini-mize the need for fresh air renewal in very long tunnels. These systems are rarely used solely for environmental purposes. However, greater environmental and health-related concerns are driving interest in the use of such systems as indicated by recent European projects.
All particulate filtration systems in tunnels are based on theprinciple of “electrostatic precipitation”. Particles in suspension intheairflowtobetreatedarefirstionisedi.e.givenanelectriccharge. Technically speaking, the charge can be selected to be either negative or positive. The charged particulates are then collected using electrodes that carry a charge opposite to that of the ionised particles.
In the block diagram in illustration 1, particles shown in green are ionised by ions shown in yellow. The charged particles, in this example, positively, are recollected by streaming them through charged plates, some negative (blue plates) and some positive (violet plates). The violet plates repel the particles while the blue plates attract and collect them.
Ideally, theobjective is tohavesmallfilterssoas to limit thefootprintofthefiltrationsystems,andthereforetheircost.Suchanapproach leads toan increaseofairflowspeed inside thefilters.According to the companyKawasakiHeavy Industries[19], increasing the speedof theairflow in precipitators from9m/sto13m/smakesitpossibletoreducetheirvolumeby30%andtherebysavespace.Nonetheless,iftheairflowistoofastthis can result in collected particulates being re-expelled into the atmosphere, thereby reducing the system’s performance.
Systemperformanceisalsoaffectedbycloggingofthefilters.
Lastly,theionisationphasepriortothefiltrationofdustparticlesproduces nitrogen dioxide (NO2). Specifically, the ionisationproduces ozone which reacts with nitrogen monoxide (NO) to form NO2.
The various tunnelling contractors who have equipped tunnels to date all base their work on the fundamental principle outlined above, adapting it to increase performance levels, reduce the
footprint and facilitate maintenance and servicing.
PRINCIPLE OF AIR FILTRATION IN TUNNELS2.1
Illustration 1: block diagram showing the principle of electrostaticfiltration (Source: “Managing air outside of tunnels” [19])
2

11
Particulatefiltrationsystemscanbeimplementedaccordingtoone of two principles, depending on the primary objective:
• Bypass-type installation: the objective mainly focuses on improving visibility;
• Extraction-type installation: the objective mainly focuses on reducing the impact of discharges to the environment.
2.2.1 Bypass-type installationBypass-type installations are generally used to provide longitu- dinal ventilation in very long tunnels.
Theairisextracted,thenfilteredandre-injectedintothetunnel.Several bypass passages may be installed in a given tunnel. The standard example is the 11 km long Kan’etsu tunnel inJapan,openedin1985,whichhasfivelateralbypasspassages.
The dimensions of lateral bypass passages vary according to thetreatedairflowsbutareapproximately150minlengthwithacross-sectionof50m2foratreatedairflowof200to250m3/s.
Around thirty Japanese tunnels are equipped with particulate filtersfitted inbypasspassages,asarefive tunnels inKoreaand one in Vietnam (see section 2.7). This type of installation can also be seen in six tunnels in Norway.
Bypass passages may be lateral or ceiling-based in order to adapt to civil engineering requirements. In practice, however, there are far fewer ceiling installations than lateral bypass installations. These are found in Norway in the tunnels at Hell, Nygards and Stromsas as well as in Japan in the Tokyo Bay tunnel, Aqua Line. However, the installations in Norway are no longer in use (see section 2.7).
2.2.2 Extraction-type installationWheremajor environmental requirements are involved, elec-trostatic precipitators can be installed at the level of the vitiated air outlets.
This type of installation is used less than bypass installations. It is found in around ten Japanese tunnels, in the Festing and Bragernes tunnels in Norway, and also in the latest European tunnels,i.e.theM30inMadridandtheCesenetunnelinItaly(see section 2.7).
IMPLEMENTATION ACCORDING TO TECHNICAL REQUIREMENTS OR TARGETED OBJECTIVES
2.2
Illustration 2: block diagram of a lateral bypass passage (Source: http://www.cta.no/bypass .html)
Illustration 3: block diagram of a ceiling-based installation (Source: “Managing air outside of tunnels” [19])
Illustration 4: block diagram of an extraction-based installation at the Hasumiya tunnel (Source: “Managing air outside of tunnels” [19])

12
2
2.2.3 Performance and operationWhicheverimplementationprincipleisselected,itisnotpossiblefor a single, given system to simultaneously demonstrate the same level of performance in terms of both improving air quality inside tunnels and limiting the environmental impact outside tunnels. For example, the installation of an extraction-based air treatment system near to a tunnel portal makes it possible to limit the impact of discharges to the outside environment but is of no use in terms of air quality inside tunnels. Conversely, while a bypass-type installation located in the middle of the
tunnel improves the quality of air inside the tunnel, it is of less benefit to the outside environment than an extraction-basedinstallation.
Beyond the two above-mentioned implementation principles, there can also bemany different ways of exploiting filtrationtechnologies.Themostwidespreadapproachistofitthesys-tem to the needs. These needs can be determined either using pollution level measurements or according to particular times of day,inrelationtotrafficpeaks.
Filter maintenance and regeneration, are decisive factors as theyunderpinthedevices’long-termefficacy.Thisrequirestheuse of auxiliary equipment. This equipment varies depending onwhetherfilterregenerationisbasedonawetordrysystem.
The figure below illustrates the principle of wet regenerationsuch as proposed by Mitsubishi. The filters are rinsed withwater;thetreatmentwateristhencollectedandfilteredinorderto extract any particulate matter.
Dryregenerationoffiltersinvolvesdrycleaningusinghigh-pres-sureairjets.Thefigurebelowillustratestheprincipleproposedby the company Aigner using a cross-section and a perspective view.Thebottomofthefilteriscleanedbyahigh-pressureairjet.Duringcleaningcycles,thefilterisrotatedinordertoensurefull and effective cleaning.
Technologicalprogresshasmade itpossible tooptimisefiltercleaning operations. These operations, which used to be carried out by hand, are now automated and programmed according to appropriatecriteria(periodbetweentwofiltercleaningcycles,loss of pressure in the system, etc.).
Mitsubishi Heavy Industries gives a one-hour cleaning cycle timeforelectrostaticfiltersfollowedbya30-minutedryingtime.Cleaning cycle frequencies vary according to the number of parameters (airflow, particulate concentrations, etc.) but aregenerally around one cleaning cycle every 1 to 5 days.
Lastly, system maintenance also requires the cleaning of ionis-ing equipment, which may also be automated.
Generally speaking, cleaning operations for these systems remain an operational requirement, even if they are largely automated these days. This cleaning is vital to ensure the systems remain in proper working order.
FILTER REGENERATION2.3
Illustration 5: block diagram showing filter regeneration via rinsing with water, Mitsubishi (Source: “Managing air outside of tunnels” [19])
Illustration 6: block diagram showing dry regeneration of a filter by dry cleaning (Source: http://www.aigner.at/)
13
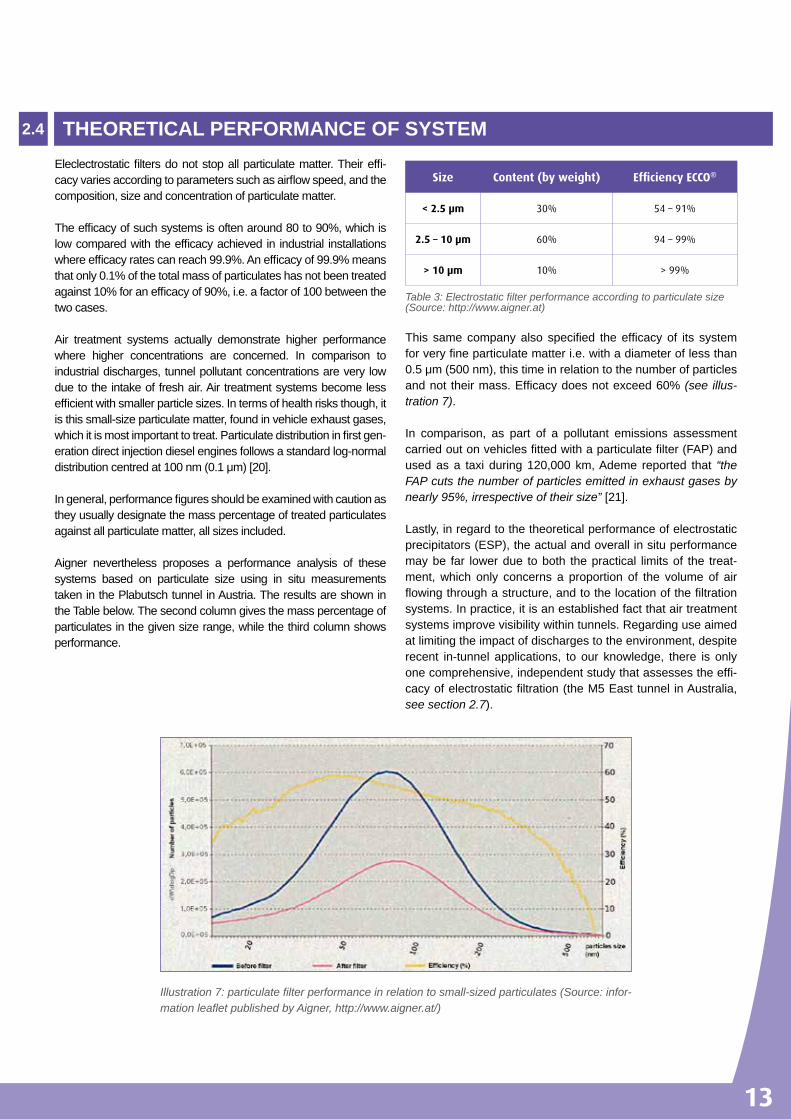
Eleclectrostaticfiltersdonotstopallparticulatematter.Theireffi-cacyvariesaccordingtoparameterssuchasairflowspeed,andthecomposition, size and concentration of particulate matter.
Theefficacyofsuchsystemsisoftenaround80to90%,whichislowcomparedwiththeefficacyachievedinindustrial installationswhereefficacyratescanreach99.9%.Anefficacyof99.9%meansthatonly0.1%ofthetotalmassofparticulateshasnotbeentreatedagainst10%foranefficacyof90%,i.e.afactorof100betweenthetwo cases.
Air treatment systems actually demonstrate higher performance where higher concentrations are concerned. In comparison to industrial discharges, tunnel pollutant concentrations are very low due to the intake of fresh air. Air treatment systems become less efficientwithsmallerparticlesizes.Intermsofhealthrisksthough,itis this small-size particulate matter, found in vehicle exhaust gases, whichitismostimportanttotreat.Particulatedistributioninfirstgen-eration direct injection diesel engines follows a standard log-normal distributioncentredat100nm(0.1μm)[20].
Ingeneral,performancefiguresshouldbeexaminedwithcautionasthey usually designate the mass percentage of treated particulates against all particulate matter, all sizes included.
Aigner nevertheless proposes a performance analysis of these systems based on particulate size using in situ measurements taken in the Plabutsch tunnel in Austria. The results are shown in the Table below. The second column gives the mass percentage of particulates in the given size range, while the third column shows performance.
Size Content (by weight) Efficiency ECCO®
< 2.5 µm 30% 54 – 91%
2.5 – 10 µm 60% 94 – 99%
> 10 µm 10% > 99%
Table 3: Electrostatic filter performance according to particulate size (Source: http://www.aigner.at)
This samecompanyalso specified theefficacyof its systemforveryfineparticulatematteri.e.withadiameteroflessthan0.5μm(500nm),thistimeinrelationtothenumberofparticlesandnot theirmass.Efficacydoesnotexceed60%(see illus-tration 7).
In comparison, as part of a pollutant emissions assessment carriedoutonvehiclesfittedwithaparticulatefilter(FAP)andusedasa taxi during120,000 km,Ademe reported that “the FAP cuts the number of particles emitted in exhaust gases by nearly 95%, irrespective of their size” [21].
Lastly, in regard to the theoretical performance of electrostatic precipitators (ESP), the actual and overall in situ performance may be far lower due to both the practical limits of the treat-ment, which only concerns a proportion of the volume of air flowingthroughastructure,andtothelocationofthefiltrationsystems. In practice, it is an established fact that air treatment systems improve visibility within tunnels. Regarding use aimed at limiting the impact of discharges to the environment, despite recent in-tunnel applications, to our knowledge, there is only onecomprehensive,independentstudythatassessestheeffi-cacyofelectrostaticfiltration(theM5Easttunnel inAustralia,see section 2.7).
THEORETICAL PERFORMANCE OF SYSTEM2.4
Illustration 7: particulate filter performance in relation to small-sized particulates (Source: infor-mation leaflet published by Aigner, http://www.aigner.at/)

14
2
Electrostatic precipitators are generally small units which, when combinedinseries,makeitpossibletocoveracompleteairflowsection.
Totreatagivenairflow,itisthereforenecessarytoalignasuf-ficientnumberofunits,accordingtothetreatmentcapacityofeach basic device. Illustrations 8 and 9 present a basic module (on the left of each illustration) and an example of the treatment ofanairflowsectionbasedonanalignmentofseveralmodules(on the right of each illustration).
Unit dimensions vary. A few examples are given below:
• Kawasaki proposes basic units that treat an airflowof 7.2 m3/swithanassociatedairflowof13m/s for thefollowing dimensions: 1.04m× 0.94m× 1.7mwith apressurelossof250Pa;
• CTA proposes units that treat a volume of 3.7 to 6.25 m3/swithanassociatedairflowof7to12m/sforthefollowingdimensions:0.854m×0.58m×0.610m;theassociatedpressurelossisnotspecified.
Specifically, figure 10 represents the footprint of electrostaticfilterswhenanairflowof750m3/s is tobetreatedusingpre-cipitators proposed by Mitsubishi with respective dimensions 2.16m × 1.7m × 2.46m (treated airflow of 36.6m3/s) and2.16m×1.7m×3.23m(treatedairflowof48.8m3/s).
N° Treated flow Dimensions (L × l × h) in m
1 48.8 m3/s 2.16 × 1.7 × 3.23
2 36.6 m3/s 2.16 × 1.7 × 2.46
Table 4: dimension of the basic electrostatic filters proposed by Mitsubishi (Source: “Managing air outside of tunnels” [19])
Lastly, to complete the data on dimensions, note that a system isnotlimitedsolelytoitsfilters.Whenconsideringinstallations,it is also necessary to factor in the maintenance systems (see section 2.3) together with the appropriate electrical equipment. Basedagainonthespecificcaseillustratedabove,MitsubishiHeavy Industries reports that, in addition to the electrostatic filters,theplanningmustalsoincludetworoomswithagroundsurfaceareaof20m×11mand10m×11m,respectively.
French studies carried out to assess treatment systems always focus on reducing the impact of discharges with a treated air-flowofbetween200to500m3/s.
.
DIMENSIONS2.5
Illustration 8: example of basic filtration modules alone (left) and in series (right) (Source: http://www.aigner.at/)
Illustration 9: basic filtration modules alone (left) and in series (right) (Source: “Managing air outside of tunnels” [19])
Illustration 10: footprint of electrostatic filters used to treat an airflow of 750 m3/s (Source: “Managing air outside of tunnels” [19])
15
Thereisfairly littledataontheinvestmentcostforfiltrationsys-tems and even less on their operating cost. The data given below should therefore be examined with caution. Note also that partic-ulatemattercollectedbyfiltrationsystemsrepresentswastethatmust be dealt with appropriately, thus generating a surplus cost.
In his report: “Managing air outside of tunnels” [19], Arnold Dix provides data on the installation costs for the Cesene tunnel in Italy.Thistunnel,openedin2008,hasbeenfittedwithtwofiltrationsystems,eachdesignedtotreatanairflowof200m3/s.Thecostis approximately 2.5 million Euros per installation. This figureincludes auxiliary equipment such as those relating to system maintenance (cleaning in particular) or to its electric power supply, but does not cover civil engineering and additional ventilation requirements of the installation.
Moreover, the paper “Approval Application of East- link, Tunnel Ventilation System Works” [22], which concerns an impact study on the proposed construction of a tunnel on the Eastlink in Australia, gives cost estimates in terms of the electrical consumption of the filtrationsystems.Thetunnelinquestionisa1.6-kmlongtwin-tubetunnel with 3 driving lanes in each direction. It has a cross-section of100m2andanairflowof450m3/stobetreated.Thestudyinquestionindicatesthatsettingupafiltrationsystemwouldinvolveincreasing the tunnel’s maximum electric power supply require-mentby30%inordertoreach1,680kW,overhalfofwhichwouldbe needed to cover surplus ventilation requirements. This would raise annual electricity consumption by 33%. This comparisonaddressestheissueofwhetheraprecipitatorshouldbefittedatthe level of a stack. The results might have been different if the comparisonhadplottedascenarioinvolvingastackwithnofilteragainst a scenario involving a filter in a bypass passage (andtherefore with no stack). The system manufacturers, however, indicate that the use of precipitators can cut costs. They point out thatfiltrationsystemsreducetheamountoftunnelcloggingand,therefore, result in lower cleaning requirements.
Still in Australia, estimates put the annual operating cost of the M5 East tunnel’sair treatmentsystemat835,000Australiandollars(M5 East Tunnel Filtration Trial Evaluation Program – Review of Operational Performance, Independent Review Role M5 East Air FiltrationProject,RoadsandMaritimeServicesNSW,February2012[23]),i.e.approximately525,000euros(1euro=1.59$AUSin2015),atatreatedairflowrateof200m3/s.Thiscostincludeswater and energy requirements.
Following discussions with Japanese contacts, the following costs wereidentifiedforthefiltrationofaflowof700m3/sforaperiodof nearly 24 hours per day in a Japanese tunnel: an installation costof500millionyen (approx.3.85millionEurosat the2009exchange rate) with maintenance costs of 6 million yen per year, approx.46,000Euros,excludingwaterandelectricitybills(Source:discussions with Hideto MASHIMO of Public Works ResearchInstitute, Incorporated Administrative Agency, Japan).
Itisdifficulttogatherdataonthevariousfiguresmentionedaboveas costs vary widely between installations depending on the oper-atingconditions,thetreatedvolumes,tunnelconfiguration,etc.
Nonetheless, a large part of the costs relating to these systems is linked to their energy consumption due to surplus ventilation requirements.
It would be useful to have a comprehensive and consistent analysis of this consumption based on a multicriteria approach setting this surplus energy cost against expected gains in terms of atmospheric pollution. This kind of analysis could be combined with a Life Cycle Analysis approach, thus making it possible to consider every environmental factor. To our knowledge, no such studies have been published to date.
COST OF FILTRATION SYSTEMS2.6

16
2
sss
2.7.1 Norway case studyNorwaycountsbetween900and1,000 road tunnels,around115 ofwhich are over 2,000metres long ([24]).The countrypresentsspecificfeaturesintermsoftunnelvisibility,whichisdeterioratedsignificantlyduetothewidespreaduseofstuddedtyres that increase abrasion phenomena and, consequently, thesuspensionofparticulatematterandasignificanteffectonvisibilityimpairment.Asaresult,Norwayisapioneerinthefieldofparticlefiltration.
8 tunnels are equipped with filtration systems including two,in Festning and Bragernes, designed principally to reduce the impact of discharges to the environment.
Of these 8 tunnels, the Laerdal has the greatest number of spe-cificfeatures(see section 3.2). This tunnel has an internal air qualityproblemduetoitslength(over20km)anditscoverageheight that imposes major constraints in terms of ventilation and access to fresh air. This tunnel comprises a gas treatment systeminadditiontotheparticulatefiltrationsystem.
Feedback from the installations in Norway’s eight tunnels paintsadisappointingpicture. In2008, only theprecipitatorslocated upstream of the extraction systems in the Festning and Bragernes tunnels were still operational. There have been growingdoubtsoverthebenefitsofputtingtheprecipitatorsinbypass tunnels back into service given that they have proved less effective than predicted (Road tunnels: a guide to optimis-ing the air quality impact upon the environment, PIARC [25]). These precipitators are no longer used for a variety of reasons, in particular due to the need to replace their electric cables.
As things currently stand,all of theparticle filtration systemsin Norway’s eight tunnels (bypass-type and extraction-type installations) have been shut down because of uncertain performance, and high operating costs stemming from energy consumption.
Tunnel Region L in km Year Trafic (veh./day) Installation type and tunnelling contractor
Festning Oslo 1.8 1990 60,000 Extraction (CTA)
Granfoss Oslo 1 1992 15,000 Lateral bypass passage (CTA)
Ekeberg Oslo 1.5 1994 45,000 Lateral bypass passage (CTA)
Hell Trondheim 4 1995 10,000 Bypass passage in ceiling (CTA)
Nygard Bergen 0.95 1999 28,000 Bypass passage in ceiling (CTA)
Laerdal Laerdal 24.5 2000 1,000 Lateral bypass passage (CTA)
Stromsas Drammen 3.5 2001 12,500 Bypass passage in ceiling (CTA)
Bragernes Drammen 3.2 2002 20,000 Extraction (Xtor)
Table 5: Norwegian tunnels equipped with a particulate filtration system (Source: Approval Application of Eastlink, Tunnel Ventilation System Works, annexe 8, Tunnel ventilation system technology review and best practice [22])
OVERVIEW OF TUNNELS EQUIPPED WITH ELECTROSTATIC FILTRATION SYSTEMS
2.7

17
2.7.2 Beyond the Norwegian case study, the rest of EuropeIn Germany, a pilot site was installed in the tunnel under the Elbe inHamburgin1994.Thistunnelhasalengthof3,900metres.This pilot site was installed by the company Filtrontec, enabling it to carry out small-scale trials of its systems.
In Austria, the company Aigner uses the tunnels of Plabutsch inGratz(9,755metres)andKatschberg(5,439metres)totrialand develop its systems; this only involves small-scale instal-lations though.
In Italy, an electrostatic filtration system was set up in the“Le Vigne” tunnel, also referred to as the Ecotunnel, located on the “Secante de Cesena” in Cesene, in Emilie Romagne. This tunnel lies in a heavily populated area that is particularly sensitive to atmospheric discharges from tunnel portals. The problemwas dealt with by installing an electrostatic filtrationsystem.Aignerwasselectedtofitoutthistunnelthathasbeenoperational since2008.Each tube is1,580metres in length.Thefreshairflowforeachtubeisapproximately200m3/s.Theinstallationisbasedonpre-dischargeparticulatefiltrationatthelevel of each portal (Source: Ventilia, November 2006, No. 61 [26]).
In Spain,filtrationsystemshavebeen installed in theM30 inMadrid.TheM30projectisafullredevelopmentoftheMadridcircularandisbrokendownintofourmainworksections:M30East,M30South,M30WestandM30North.
OneofthelargestworksectionsistheM30South,whichcom-prises in particular:
• to the west, one cut-and-cover tunnel with a length of approx.1,600metres;
• two separate cut-and-cover tunnels (one in each direction of circulation) on either side of the Manzanares river: eachonehasalengthof4,500metres;onecut-and-covertunnelneverthelesscontainsa600-metresectioninopenair;
• one section referred to as the By-Pass Sur: this corre-sponds to two tubes – North and South – each with length 4,200metres,themainpartofwhichwasexcavatedusingatunnelboringmachine(approx.3,600metres);
• to the east, connections in a cut-and-cover tunnel with length approx. 1,200metres between thenorth tubeofthe By-Pass Sur and the A3 motorway, which links up with Valence.
This underground series of structures is supplemented by a number of cut-and-cover access roads (around forty) that rep-resent a cumulated length of around ten kilometres.
22particulatefiltrationsystemshavebeensetup in thisvastunderground network, 4 of which include a gas treatment sys-tem(seesection3.2).Theownerhascalledinthekeyfiltrationsystem manufacturers:
• the Austrian company Aigner: 9 installations;• the Norwegian company CTA: 2 installations;• the German company Filtrontec: 3 installations;• the Japanese company Panasonic: 8 installations.
TheCETUvisitedtheseinstallationsinMay2009inthepres-ence of the manufacturers. The installations initially operated for20hoursoutof24atfullpower.Today,theyactuallyoperateonly a few hours a week. Photographs of the systems taken during the inspection can be seen in annex.
In France, the GEIE-TMB (Groupement Europeen d’Interêt Economique du Tunnel du Mont Blanc) decided to install an extraction-basedparticulatefilterabovetheFrenchplatformofthe Mont Blanc tunnel, in order to contribute to the various local initiatives aimed at improving air quality in the Chamonix Valley. This filter, scheduled to be installed in 2010, will be locatedupstream of a discharge outlet in an existing extraction gallery with a capacity of 450m3/s.The current configuration of theventilation system means this installation can go ahead with no need for any major civil engineering works.
2.7.3 Japan case studyTo provide background context, it should be noted that Japan is a densely populated country where pollution reaches alarming levels that have driven the authorities to speed up the process ofequippingofvehicleswithparticulatefilters.
The country counts 9,000 road tunnels representing a linearlengthof3,000km,fortyofwhichareequippedwithparticulatefiltrationsystems.Thisfigurevariesslightlydependingonthesource (47 according to the “Approval Application of Eastlink, Tunnel Ventilation System Works” [22]).
The systems are generally installed to improve visibility or in response to strong ventilation requirements. They are therefore placed in bypass passages inside the tunnels. The following chart lists the main Japanese tunnels equipped with an electro-staticfiltrationsystem.

18
2
Name Tunnel length in km Objective Max. flow per plant (in m3/s) Architecture
Aioi-cho exhaust air 80 exhaust station
Asukayama 0.6 exhaust air 375/360 exhaust station
Enasan 8.5 visibility 300/240/255/200 bypass
Fukuchiyama 3.6 visibility 285/270/285 bypass
Gorigamine 4.45 visibility 105/105/195 bypass
Hakamagashi 5.95 visibility 190 bypass
Han-Na 5.6 visibility 270/285 bypass
Hanazonobashi 2.6 exhaust air exhaust station
Happusan 4 visibilité 225/210/170/190 bypass
Hasumiya exhaust air exhaust station
Higashiyama 2.6 exhaust air
Higo 6.3 visibility 113/90/135/260 bypass
Hihonzaka 2.05 exhaust air
Hiroshimaseifu 1.25 85 bypass
Ichifuri 3.35 visibility 180/165 bypass
Kakuto 6.25 visibility 170 bypass
Kann-etsu 11.05 visibility 945/810 bypass
Kann-Mon 3.5 visibility and exhaust air 365 exhaust station
Karasuyama visibility and exhaust air 175 bypass
Kasaijama 3.2 visibility 270/240/225/210/201/210 bypass
Kongosan visibility 195/285 bypass
Koshirazu 4.55 visibility 300/180 bypass
Maiko 3.4 visibility and exhaust air 180/180 bypass (in ceiling)
Midoribashi 3.4 exhaust air 573 exhaust station
Nihonzaka 2.2 visibility and exhaust air 240/240/680/440 exhaust station + bypass
Nou 165 bypass
Ryugatake 3.65 visibility 270 bypass
Ryu-ohzan 2 visibility and exhaust air 225/210 bypass
Sekido 3.2 visibility 240/240/240 bypass
Shintoshon-nishi 318 exhaust station
Shintoshon 154 exhaust station
Sirubachiyama 4.1 visibility 195 bypass
Suginami-ku exhaust air 60 exhaust station
Tachitoge 2.15 visibility 225 bypass
Takanomine 3.1 visibility 195 bypass
Taroyama 4.3 visibility 180 bypass
Tennozan 2 exhaust air 1643 exhaust station
Tokyo Bay 9.6 visibility AND exhaust air bypass (in ceiling)
Tsuruga 2.1 visibility 240 bypass
Uji 4.3 visibility 285/255/210 bypass
Chuo-Kanjo-Shinjuku exhaust air
Honmachi exhaust air
Nishishinjuku exhaust air
Yoyogi exhaust air
Kanayamacho exhaust air
Oohashi exhaust air
Table 6: main Japanese tunnels equipped with particle filtration systems Source: “Possibilities and limitations of tunnel-air filtration and portal-flow extractions” [27] and https://panasonic.co.jp/es/peseng/

19
The Japanese were the first to use particulate filtration withan installation in the Tsuruga tunnel (2.1 km) in 1979. These systems were often used to provide longitudinal ventilation in tunnelswithlongstraightsectionssuchastheKanet’sutunnel(11 km) in 1985. The environmental impact nevertheless led to the installation of electrostatic precipitators in around ten tunnels. For example, electrostatic precipitators were installed at the base of the extraction stacks in the Tennozan (2 km), Kanmon(3.5km),Asukayama(0.6km),Midoribashi(3.4km)and also the Hanazonobashi tunnels (2.6 km). The Tokyo Bay tunnel (9.6 km) is mainly equipped with ceiling-based precipitators.
Filtration systems operate based on actual pollution measure-mentswhich,inthecaseoftheKan’etsutunnel,resultsinanaverage operating time of 143 hours permonth (20%of thetime)at thenorthportal and40hourspermonth (3%of thetime) at the south portal. The Tokyo Bay “Aqualine” tunnel only records12to13hoursofoperationperyear(i.e.approx.0.15%of the time). These operating periods are those given in the report “Managing air outside of tunnels” [19].
Discussions with Japanese contacts indicate that operating rates are highly variable. (Source: discussions with Hideto MASHIMO of Public Works Research Institute, Incorporated Administrative Agency, Japan). They can range between 5 hours per month up to nearly 24 hours out of 24 where urban tunnels are concerned.
Lastly, note that Japan is experimenting with gas treatment systemsintheChuo-Kanjo-Shinjukutunnel(Seesection3.3).
2.7.4 South Korea, Vietnam and ChinaInSouthKorea,5tunnelshavebeenequippedwithelectrostaticprecipitators, which are all located in lateral bypass passages.
In Vietnam, the Hai Van Pass tunnel, 6.5 km long and opened in2006, isequippedwithelectrostaticfilters in lateralbypasspassages,i.e.3installationseachwithacapacityof260m3/s.
InChina, thebuildingworkon theCentralWanChaiBypasstunnel(HongKong)hasbeenongoingsince2009.Thetunnel,measuring 3.7 km in length, will be equipped with Filtrontec electrostaticfilterswithanairflowtreatmentcapacityofaround1,500m3/s.Thetunnelisscheduledtoopeninlate2017.
As far as we know, these are the only tunnels referenced as beingequippedwithfiltrationsystems in these twocountries.The paper “Approval Application of Eastlink, Tunnel Ventilation SystemWorks”[22],indicatesthatinthesetwocountries,elec-trostaticfiltersaremainlyusedtoprovideadequatevisibilityintunnels where there are major constraints on the intake of fresh air.
Name ObjectiveMax. flow per station
(m3/s)Architecture
Chinbu Visibility and exhaust air 285 bypass
Saritjae Visibility 285 bypass
Safe-San Visibility 350/350/130 bypass
Su-Jung-San Visibility 600 bypass
Woo-Myun- San Visibility 210 bypass
Table 7: Main Korean tunnels equipped with a particulate filtration system (Source: “Possibilities and limitations of tunnel-air filtration and portal-flow extractions” [27])
2.7.5 AustraliaIn Australia, the issue of the installation of air treatment sys-tems comes up time and again during the development of new projects. This issue is generally pursued by local residents or environmental protection associations. Among the projects in question, we can cite the Lane Cove Tunnel (Sydney), the North- South bypass in Brisbane and the Eastlink in the Melbourne region. All these projects are gravitating towards a decisionnottoinstallafiltrationsystem,inparticular,basedona digital model that indicates that such systems provide fairly low value added.
However, faced with rising concerns in the country, a tunnel was equippedin2010,mainlytotesttheefficacyofactualefficacyofthese systems. This installation was carried out on an existing tunnel on the M5 East in the Sydney region.
Illustration 11: Hai Van tunnel (Source: http://www.hazama.co.jp/ japanese/hazamag/genbarepo/0504/genbarepo01_eng.htm)

20
2
The data on this project, shown below, can be viewed in detail in the following reports:
• “M5 East Tunnel Filtration Trial Evaluation Program – Review of Operational Performance, Independant Review Role M5 East Air Filtration Project, Roads and Maritime Services NSW”, February2012[23];
• “Air filtration plant of the M5, Determination of particle removal efficiencies, Roads and Maritime Services NSW”, BrendanHaliburton&MerchedAzzi,November2011[28]
The tunnel in question, 4 kilometres in length, is a twin-tube tunnel with two lanes per tube. It has been in operation since December2001andmainlyencountersdifficultiesdue to thegreaterdensityoftrafficthatwaspredictedbyupstreamstudieswith,inparticular,significantHGVtraffic.
An air quality improvement plan was also implemented so as to improve tunnel visibility without harming external air quality.Initsformerconfiguration,priortoinstallationofthetreatmentsystem,90%ofthevitiatedairinthetunnelwasdischargedviaanextractionstack,theremaining10%beingdischargedattheportals.
Although measurement campaigns have indicated that these dischargesdonotpresentanysignificantimpactonexternalairquality,adecisiondated18July2007providedfortheinstalla-tionofafiltrationsystematthetunnel’swestportal.
A structuremeasuring 60 × 40 × 8metreswas built to hostaparticulatefiltrationsystem,adenitrificationsystem,officesand an information centre. A ventilation duct with length approx. 300metreshasalsobeenbuilt.Ratherthanbeingdischargedby the structure, air is re-injected into the tunnel and then even-tually discharged by the existing stack or the portals.
According to the specifications, the electrostatic filter had amaximum airflow treatment capacity of 200 m3/s at tunnelairflowintheregionof320m3/s.Theair,extracted500metresfrom the exit portal (western portal) of the southern tube, reachedthetreatmentsystemafterpassingalonga280-metreduct. The air was then treated and immediately injected back intothetunnel,downstreamoftheextractionpoint,500metresfromthewesternportal,afterpassingalonga280-metreduct(see illustration 12).
During the evaluation, the treatment systems were switched on for 6 hours a day, between 12 noon and 6 pm, Monday to Friday only. A range of measuring techniques was used to assess the results. The measurements consistently found a reduction in PM2.5 and PM10 particles of around 65% at the particle filterinlet andoutlet, comparedwith just 60% for total suspendedparticles (TSP). These results fell well short of the manufactur-ers’ claims.
The system’s efficacywas limited in this tunnel because thetreatedairflowrate(200m3/s)waslessthantheactualairflowthrough the structure (320 m3/s). Ultimately, the treated airre-injected500metresfromthewesternportalofthesoutherntube accrued pollutants once again as it made its way to the end of the tunnel – a phenomenon exacerbated by the upward gradient of around 8% in the structure.Measurements weretaken at the western end of the southern tube. Here, there was only a limited difference between concentration levels when thefiltrationsystemwasoperatingandwhen itwasswitchedoff.Themeasurementsshowedanaveragereductionof11%,varyingaccordingtotrafficlevels.
Aswellasdoubtsaround theefficacyof thesystemwhen inoperation, there were also concerns about its reliability. The plan was to switch on the system between 12 noon and 6 pm onweekdays,duringa50-plus-weektestingperiod.Duringthe
experiment, the system was judged to be working correctly whenthevariousgenerators(pre-ionizer,ionizerandfilter)andthe fans that moved the air around the system were operating simultaneously. The system only worked correctly for a full 6 hourson2outof3days.Whenexpressedinactualoperatinghours, the system had an estimated reliability score of 84%(comparedwith a target of 99.5%as stated in the specifica-tions). Over the 56-week testing period, there was not a single weekwhen thesystemworkedcorrectly for the full30hours(5 days at 6 hours per day).
In the end, the local authority decided to terminate the exper-iment on the grounds that the costs outweighed the pollution benefits.Theauthoritystillhasanairqualityimprovementplan,but the emphasis is now on stopping the most heavily polluting vehicles from entering the tunnel.
Illustration 12: overview of the air treatment installation in the M5 East tunnel (source: “M5 East Tunnel Filtration Trial Evaluation Program - Review of Operational Performance, Independent Review Role M5 East Air Filtration Project” [24])

21
Todate,particulatefiltration in tunnels isbasedsolelyon theuse of electrostatic filters.Current research aims to optimisethis technique rather than to develop new techniques. For example,thecompanyKGDproposessmallfiltrationunitsthatcan be fixed directly onto existing jet-fans. Moreover, othercompaniesareconductingresearch intoelectrostaticfiltrationin moist environments that would encourage the filtration ofsmall-sizeparticulates,i.e.withdiameterlessthan1μm([29]).
The use of electrostatic precipitators is not, however, univer-sally accepted. Some people contend that this technology rarelyhasanyprovenscientificeffectonpopulationexposureas thepositiveeffect isoftenmaskedby thesignificantbaseconcentration that marginalises the gains. Others emphasize the potential benefits of first optimising the various pollutiondispersion factors linked to tunnels, such as the position of the portals or the location of stacks enabling the displacement and dispersion of pollutants away from residential areas. Still others point to the highly uncertain nature of the overall assessment due to costly use of pre-treatment vitiated air extraction means.
It has to be said that several tunnels that have been equipped withelectrostaticfiltershavesubsequentlyusedthemverylittle,as revealed by some operating rates illustrated in this paper.
Itremainsdifficulttoassesstheactualperformanceoffiltrationsystems so long as they present such variable conditions of use. Faced with the issue of the environmental impact of tunnel discharges, in particular in areas where air quality is a major issue, there is no clear answer on exactly which provisions should be implemented. Accordingly, we can only cite as an example the approach that, when the issue was raised, led Australian authorities to model the various alternatives, whether based on the installation of a treatment system or on efforts to optimise ventilation performance.
CONCLUSIONS ON ELECTROSTATIC FILTERS2.8

22
DENITRIFICATION USING THE ABSORPTION METHOD
The treatment of gases in tunnels was only recently introduced into an operational phase. The Norwegians were the first toinstall agas treatment system in theLaerdal tunnel in2000.Incontrast toparticulatefiltration,currentsystemsarebasedon a diverse range of technologies, some of which are still at
the experimental stage. These installations still have one point in common though; they all focus on the treatment of nitrogen dioxide (NO2). This part is devoted to the most common denitri-ficationprocess,absorption.
Absorption-baseddenitrificationisbasedonthephenomenonof sorption, i.e. on the activity of gas molecules (in this case NO2) when placed in contact with a solid material, and which adheres to its surface. During absorption, NO2 molecules undergo chemical change in contrast to adsorption where the moleculesarenotdegradedbutfixedtoadsorbentagents.
Effective performance of gas treatment systems requires that the air has already been treated to remove particulates, i.e. by electrostatic precipitation (see previous section). Manufacturers reporta90%removalrateforNO2 (Source: “Managing air out-side of tunnels”, by Arnold Dix – Counsel at Law, Adj. Professor of Engineering [19]).
sss
The absorption principle can be implemented using an activated carbonfilterasseeninfourtreatmentplantsintheByPassSurtunnelontheM30inMadrid(seesection2.7).Therearetwoinstallations in the North tube (built by Aigner) and two others in the South tube (built by CTA). These 4 plants treat particulates upstreamviaelectrostaticfiltration.
Theactivatedcarbonfilterscomeintheformofametalstruc-turewithaW-shapedcross-section.
ThepanelsmakingupthisW(seeillustration14)areapprox-imately fifty centimetres thick. These panels are filled withactivated carbon through which vitiated air is circulated. The system requiresairflowsectionsequivalent to thoseused forparticulatefiltrationwhileseveralmetresoflengthisnecessarytoensuresufficientsurfacecontact.
In the North tube of the By-Pass Sur tunnel, the two plants have arespectivetreatmentcapacityof520m3/s(thePV3plant)and450m3/s(thePV4plant).Pressurelossesduetothedenitrifi-cationsystemareestimatedat200to300Pa.Airflowspeedisapprox.0.3m/sattheleveloftheactivatedcarbonthicknessfora residence time of around one second.
Themanufacturerreportsaperformancerateof80to90%onnitrogen dioxide, no effect on nitrogen monoxide (NO) and no guaranteed result on any other compounds. As the system is installeddownstreamofanelectrostaticfilter,partoftheNOinthe air has already been oxided to NO2.
According to the manufacturer, the absorbent reaches satu-rationafterapproximately25,000hoursofoperation,i.e.afterabout 3 years.
Even if the system is not in operation, the activated carbon reacts with ambient air and gradually degrades.
PRINCIPLE3.1
IMPLEMENTATION IN SPAIN, AUSTRALIA AND NORWAY VIA USE OF AN ACTIVATED CARBON FILTER
3.2
Illustration 13: 3D model of a denitrification process using activated carbon (Source: www.filtrontec.de)
3
23
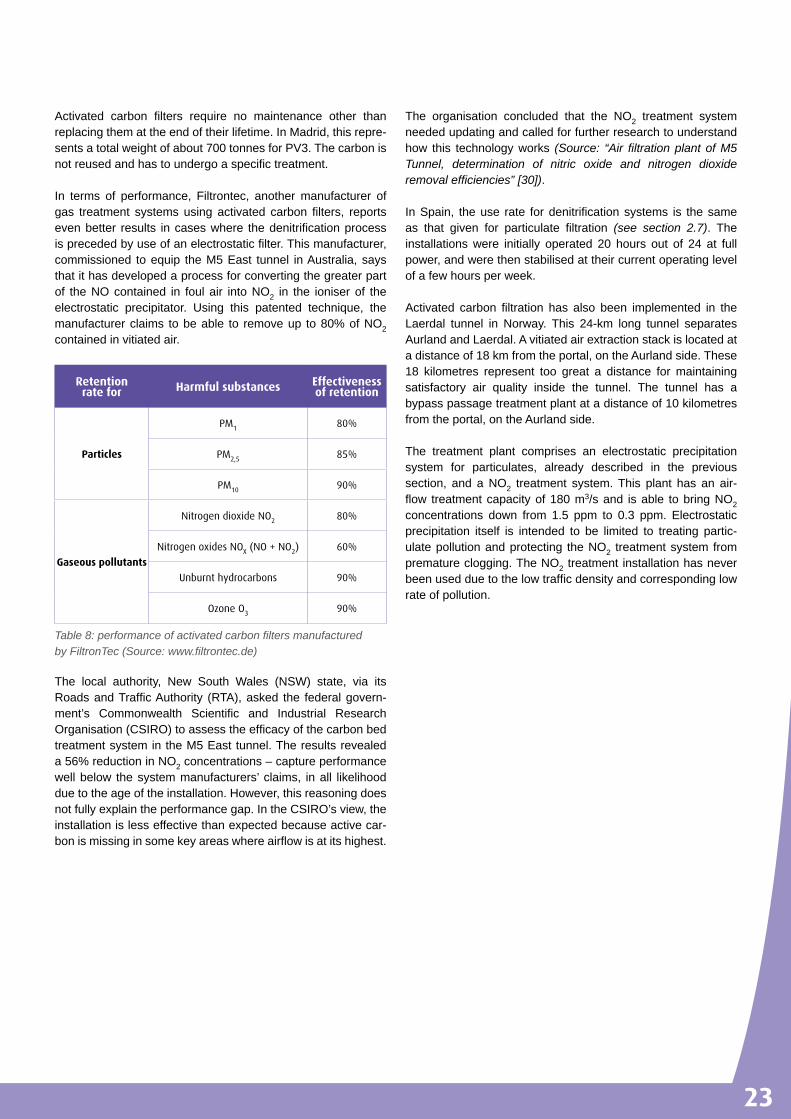
Activated carbon filters require no maintenance other thanreplacing them at the end of their lifetime. In Madrid, this repre-sentsatotalweightofabout700tonnesforPV3.Thecarbonisnotreusedandhastoundergoaspecifictreatment.
In terms of performance, Filtrontec, another manufacturer of gas treatment systems using activated carbon filters, reportsevenbetter results incaseswhere thedenitrificationprocessisprecededbyuseofanelectrostaticfilter.Thismanufacturer,commissioned to equip the M5 East tunnel in Australia, says that it has developed a process for converting the greater part of the NO contained in foul air into NO2 in the ioniser of the electrostatic precipitator. Using this patented technique, the manufacturerclaims tobeable to removeup to80%ofNO2 contained in vitiated air.
Retention rate for Harmful substances Effectiveness
of retention
Particles
PM1 80%
PM2,5 85%
PM10 90%
Gaseous pollutants
Nitrogen dioxide NO2 80%
Nitrogen oxides NOX (NO + NO2) 60%
Unburnt hydrocarbons 90%
Ozone O3 90%
Table 8: performance of activated carbon filters manufactured by FiltronTec (Source: www.filtrontec.de)
The local authority, New South Wales (NSW) state, via itsRoadsandTrafficAuthority (RTA),asked the federalgovern-ment’s Commonwealth Scientific and Industrial ResearchOrganisation(CSIRO)toassesstheefficacyofthecarbonbedtreatment system in the M5 East tunnel. The results revealed a56%reductioninNO2 concentrations – capture performance well below the system manufacturers’ claims, in all likelihood due to the age of the installation. However, this reasoning does not fully explain the performance gap. In the CSIRO’s view, the installation is less effective than expected because active car-bonismissinginsomekeyareaswhereairflowisatitshighest.
The organisation concluded that the NO2 treatment system needed updating and called for further research to understand how this technology works (Source: “Air filtration plant of M5 Tunnel, determination of nitric oxide and nitrogen dioxide removal efficiencies” [30]).
InSpain, theuse rate fordenitrificationsystems is thesameas that given for particulate filtration (see section 2.7). The installationswere initially operated 20 hours out of 24 at fullpower, and were then stabilised at their current operating level of a few hours per week.
Activated carbon filtration has also been implemented in theLaerdal tunnel in Norway. This 24-km long tunnel separates Aurland and Laerdal. A vitiated air extraction stack is located at a distance of 18 km from the portal, on the Aurland side. These 18 kilometres represent too great a distance for maintaining satisfactory air quality inside the tunnel. The tunnel has a bypasspassagetreatmentplantatadistanceof10kilometresfrom the portal, on the Aurland side.
The treatment plant comprises an electrostatic precipitation system for particulates, already described in the previous section, and a NO2 treatment system. This plant has an air-flow treatmentcapacityof180m3/sand isable tobringNO2 concentrations down from 1.5 ppm to 0.3 ppm. Electrostaticprecipitation itself is intended to be limited to treating partic-ulate pollution and protecting the NO2 treatment system from premature clogging. The NO2 treatment installation has never beenusedduetothelowtrafficdensityandcorrespondinglowrate of pollution.

24
3
In2004,twotypesofNO2 treatment system were developed in Japan thanks to national research programmes. One system based on adsorption (see Section 4.2.1) and the other on absorption.
Here again, system performance depended on the air being first cleaned viaelectrostatic precipitation in order to removeparticulate matter.
Given the doubts over their long-term use, the systems underwent full-scale trials in the ventilation stacks of the Chuo- Kanjo-ShinjukutunnelintheregionofTokyo.This10-kmlongtunnel comprises 9 stacks and is located in a heavily populated areawheretheairqualityissignificantlydegraded.Theaimistherefore to limit the impact of tunnel discharges. Absorption- based systems have been installed at the base of 4 stacks.
The NO2isconvertedintonitriteandpotassiumnitrate(KNO2 andKNO3) by potassiumhydroxide (KOH)which ismodifiedon contact with an absorbent structure with a honeycomb structure and then introduced into a metal cube. The system’s performanceleveldropsbyabout10%overaperiodof8to10months of operation. On the other hand it is easily regenerated
by simply removing the absorbent structures from the tunnel and then subjecting them to a 4-step cleaning process:
• water washing,• firstdrying,• dunkinginasolutionofKOH,• second drying.
NO2 removal rate (daily average value) Over 90%
Gas velocity 1.04 m/s
Regeneration interval Regeneration of the ½ quantity of absorbent every 8 to 10 months
Pressure drop Less than 460 Pa
Durability Over 20 years
Table 9: characteristics of the absorption-based NO2 treatment system in the Chuo-Kanjo-Shinjuku road tunnel (Source: “Road tunnels: a guide to optimising the air quality impact upon the envi-ronment”, PIARC [25])
Evenmorethanelectrostaticfiltration,thetreatmentofgasesintunnels remains a little used system that is only implemented in four tunnels worldwide. Moreover, to our knowledge, only two ofthesesystemsarecurrentlyinuse:theChuo-Kanjo-ShinjukutunnelinJapanandthetunnelontheM30inMadrid.
It is hard to judge the operational performance of these systems toahighdegreeofconfidencebecausefeedbackislimitedtoahandfulofspecificcases.Otherthanthedetailedassessmentof the M5 East tunnel near Sydney, there is only patchy data on theefficacyofsuchsystems,eitherbecausetheyarelocatedintunnelswithlowtrafficdensityandacorrespondinglylowlevelof pollution (Laerdal tunnel in Norway), or because they are too recent(tunnelontheM30inMadrid).
IMPLEMENTATION IN JAPAN USING POTASSIUM HYDROXIDE3.3
CONCLUSION ON GAS TREATMENT SYSTEMS3.4

2525
ALTERNATIVE AND INNOVATIVE TECHNIQUES
This tried and trusted industrial technique has been tested in the Tenozan tunnel in Japan ([19]).It proved to be of limited use in tunnels, or rather, less effective
thanelectrostaticfiltersduetothelowparticulateconcentrationin tunnels and the grain size distribution, which contains, in particular,alargeproportionofveryfineparticulates.
4.2.1 Denitrification using the adsorption methodFull-scale trials of denitrification via adsorption (where NO2 molecules are attached to adsorbent agents rather than being degraded) were performed at 5 of the 9 ventilation stacks in the Chuo-Kanjo-Shinjukutunnel,intheregionofTokyo.
Adsorbent pellets are packaged in a tankmade of FRP (fibre-glass-reinforced plastic). The NO2 is physically adsorbed into the pores of pellets. In contrast to the absorption process, the system rapidly loses its performance capacity, as early as the 12th day of operation. The adsorbent pellets therefore require frequent regeneration. The system is regenerated using a sodium sulphate solution (Na2SO4) that can be stored in a dedicated regeneration equipment room. The regeneration solution is sent to the plastic tank containing the adsorbent pellets, used to regenerate the pellets and then sent back to its storage room. In other words, regeneration is carried out in situ.
NO2 removal rate (daily average value) Over 90%
Gas velocity 0.9 m/s
Regeneration interval Approx. every 12 days
Pressure drop Less than 600 Pa
Durability Over 20 years
Table 10: characteristics of the adsorption-based NO2 treatment system in the Chuo-Kanjo-Shinjuku tunnel (Source: “ Road tunnels: a guide to optimising the air quality impact upon the environment”, PIARC [25])
4.2.2 Photocatalytic denitrification4.2.2.1 Principle
Photocatalytic denitrification uses the properties of titaniumoxide (TiO2). Under ultraviolet light, the latter activates atmos-pheric oxygen (O2), producing a hydroxyl ion (OH –) that then reacts with the nitrogen oxides (NOX) to form acid solutions (HNO3). This photocatalytic reaction based on the use of tita-nium oxide can be used to break up nitrogen oxides (NOX) in ambient air. This principle has found favour with several civil engineering contractors, in particular, Eurovia and Calcia, who have developed its application in a diverse range of processes, i.e. acoustic screens, treatment of building facades or the treat-ment of road surfaces.
4.2.2.2 Deployment inside a tunnel
Because tunnels are deprived of natural light, photocatalytic denitrificationreliesontheartificiallightinginstalledinthetun-nel.YetfluorescentbulbsemitsignificantlylowerlevelsofUVlight than natural light, and sodium lamps emit no UV at all. The photocatalyticdenitrificationprocesswillonlybeeffective ifaspecial UV lighting system is installed – something that requires further investment and operating costs and, through additional energyconsumption,limitsthesystem’senvironmentalbenefits.
Moreover, because there is no rainwater inside a tunnel environment, photocatalytic activity drops sharply after a few weeks because the particle deposits that build up on the treated surfaces are not leached. These particles can block active sites andpreventreactionswithnitrogenoxides.Thesystem’seffi-cacy is only partially or fully restored once the surfaces holding titanium dioxide are washed with water.
As such, demand for UV light and fouling are major barriers to application of this system in a tunnel environment.
BAG FILTERS4.1
TREATMENT OF GASES4.2
4

26
1
26
Polluted discharges post-leaching would not be a major issue because the nitrates formed would remain trapped inside the cement matrix in the form of salts
4.2.2.3 Deployment around a tunnel perimeter
The process can be used upstream or downstream of a tunnel, in the immediate vicinity of the portals, where nitrogen diox-ide concentrations are likely to be at their highest. Eurovia’s NOxer®, a TiO2-based “depolluting coating for roadways”, is used at the toll booths on the A86 duplex tunnel in the Paris region. More generally, titanium dioxide could be used in a variety of civil engineering structures around tunnel portals, such as supporting wall facings, canopies, anti-recycling walls, noise screens, etc.
This document does not explore the use of this process in open-air environments away from the immediate vicinity of tunnels.
4.2.2.4 Case study: two tunnels in Italy and Belgium
Titanium dioxide coatings are used at two tunnels in Europe: the Umberto I tunnel in Rome, and the Leopold II tunnel in Brussels.
Measurements have been taken at both tunnels to measure the efficacyofthephotocatalysissystem.
InItaly, the350-metre-longUmberto I tunnelcurrentlycarriesaround1,000vehiclesperhour,alongtwoone-waylanesandone bus and taxi lane travelling in the opposite direction. There is also a footway for pedestrians, and this is the reason why a decision was made to install the photocatalysis system during renovation work on the tunnel.
A special artificial lighting circuitwas installed to provide theUV light required for the photocatalysis process. Italcementi carried out a series of measurement campaigns in 2007 toassessthesystem’sefficacy,findingthataverageNO2 concen-trationshadfallenby19%sincecompletionoftherenovationwork. According to digital models produced for Calcia by Aria Technologies, average NO2 concentrations in the Umberto I tunnelinRomehadfallenby30%atanairflowrateof1.5m/s,andby15%at3m/s.
From the analysis above, we can deduce that:
• generally speaking, photocatalysis is highly effective at mitigating pollution peaks;
• it is harder to calculate average pollution reduction performance because pollution levels in the city differed markedly between the two measurement campaigns (before and after completion of the renovation work);
• it isdifficult toassess the long-termperformanceof theproduct.
The Leopold II tunnel in Brussels is the longest in Belgium, measuring 2,534 m in length. Around 65,000 vehicles passthrough the tunnel each day. A photocatalytic cement plaster was appliedtothetunnel’swallsandceilingtoassesstheefficacyofphotocatalysis.Theplasterwas initiallyapplied toa70-metresectionforthefirstmeasurementcampaign(September2011),and then to a 160-metre section for the second campaign(January2013).
The results of both measurement campaigns were inconclusive. Nitrogenoxideconcentrationsfellbylessthan2%,ataUVlightintensityof1.6W·m– 2,anairflowrateof3m/s,andhumidityabove70%[31].Thesedisappointingresultswereattributedtoalack of UV lighting power and unfavourable conditions during the experiment(airflowrate,humidityandpollutantconcentrations)[32]. Digital simulations were carried out under ideal experimen-talconditions(lightpowerof10W·m– 2,airflowrateof1m/s,humidityof50%).Thesesimulationsproducedmorepromisingresults,pointingtoapotential20%reductioninnitrogenoxideconcentrationinthe160-metreexperimentalsection[31].
The two examples above show that laboratory results do not necessarily translate to actual in-tunnel performance. The efficacy of photocatalysis is dependent on several variables(lighting power, wind speed, humidity, pollutant concentration, etc.).Where the optimal conditions for photocatalysis are notmet,thiscansignificantlyreducesystemperformance.
4.2.2.5 Nanoparticle risk
The prospect of adding TiO2 to materials in the form of nanopar-ticles has become a topic of debate.
The French Agency for Health and Safety of the Environment andWork(AFSSET)issuedanopinionon17March2010[33]suggesting that some TiO2-based products could pose a risk to health and the environment. In terms of nanoparticle dispersion risk,issue28ofmagazineBéton[s](May/June2010)[34]statesthat “in most cases, these problems are now addressed by the way in which the products are used (aggregated or integrated intothefinalmaterial,therebyreducingtheriskofnanoparticledispersion in the air). Yet toxicology and particle concentration studiesareongoinginanefforttoaddressfinaluserhealthandprotection concerns.”
4

27
4.2.3 Non-photocatalytic depolluting concretesLafargeHolcim has recently developed a range of concretes and renders that remove pollution from the air.
The process works through the adsorption of NO2 molecules, which then undergo a chemical reaction with alkaline hydrates in the cement pastes. Calcium hydroxide (Ca(OH)2) and cal-cium silicate hydrate (C-S-H) react strongly with NO2 molecules to form ionic compounds such as nitrates and nitrites in the cement medium. As such, this depollution technique capitalises on the intrinsic properties of concrete, to which special depollut-ing agents are added to boost adsorption capacity [35].
Following promising tests in the laboratory and on a car garage-size prototype, the technique was applied full-scale at the Croix-Rousse road tunnel in Lyon, France. The material was applied on the walls of one of the tunnel’s ventilation stations to reduce nitrogen dioxide emissions via this shaft during extrac-tion for health reasons. The results of the test have not yet been published.
Unlike photocatalytic denitrification, this technique appearswell suited to tunnels because it does not require either natural orartificial light.However,onedrawback is that theconcretesurface tends to become fouled (at different rates), thereby lim-itingthesystem’sefficacy.Assuch,thecoatedsurfaceswouldneed to be washed (as a minimum) to keep the system working correctly over time.
4.2.4 Cold plasmaThescientificcommunityhashighhopesforcoldplasmatech-nology, which has potential long-term applications that extend beyond tunnels.
Plasma, a partially ionized gas, is considered a “fourth state of matter”. Cold plasma occurs when the temperature of the plasma is close to the ambient temperature. For many years now, scientists have been studying the potential use of cold plasmatoremovepollutantsfromgaseouseffluents,harness-ing plasma’s reactive properties to convert toxic compounds into harmless gases. Eventually, this process could be easy to deploy, with potential applications in tunnel environments and in treating particle pollution.
4.3.1 ContextThe early 20th century saw the development of biofiltration,harnessing the capacity of certain micro-organisms to treat wastewaterandsometypesofsolidwaste.Thefirstapplica-tionsofbiofiltrationinairtreatmentemergedinthe1950s,inaneffort toeliminateodoursfromwaterpurificationplants1. This technique rapidly spread to several other domains (sanitation, manufacturing, food processing, livestock farming, etc.) in the 1990s,asaway to treatvolatileorganiccompounds (VOCs)and foul-smelling compounds 2.
4.3.2 How biofiltration worksBiofiltration involves forcing air through a filter medium thatcaptures pollutants, encourages bacteria to grow in the rhizosphere 3, and promotes plant growth on the surface (see illustration 14). Gases and exhaust fumes are soluble in the aqueous phase. A wide range of physical and chemical processes are observed, including absorption, adsorption, nitrificationandbreakdownbymicro-organismsinthebiomass.The particles, meanwhile, are trapped through mechanical filtration(mainlysedimentation).
BIOFILTRATION4.3
Illustration 14: how biofiltration works
27
1.J.S.Devigny&al.(1999)Biofiltrationforairpollutioncontrol.2.ADEME(2014)Traitementbiologique.3.Thenarrowregionofsoilthatisdirectlyinfluencedbyrootsecretionsandassociatedsoilmicroorganisms.

28
4.3.3 Experimental application of biofiltration to treat vitiated air in a road tunnel4.3.3.1 System deployed in the Guy Môquet tunnel (Thiais, Val de Marne, France)
Biofiltration has proven highly effective in several industrialapplications, raising the possibility of using the technique to treat road vehicle emissions. An experiment was conducted to assess how effective the process was a treating vitiated air from a tunnel.
Becausebiofiltrationhasneverbeenusedinatunnelenviron-ment before, a small-scale system was deployed for the initial experiment.Thebiofilterwasdesigned to treatair ina smallsection of the tunnel (a few cubic metres), and all other parts of the system were scaled accordingly, thereby substantially reducing the installation’s size.
Theaimsoftheexperimentwere,firstandforemost,toassessthe feasibility of tunnel deployment, as well as to measure depolluting performance in this configuration, to observechangestothesystemoverasufficiently longperiodof time,and to assess the associated maintenance and operation con-straints (including water and energy consumption).
The experiment was carried out as part of a research project part-funded by ADEME 4, in partnership with the Ile-de-France Regional Directorate of the Centre for Research and Expertise on Risks, the Environment, Mobility and Planning (CEREMA) (the main contributor to the programme), the CETU, Phytorestore, the Laboratory of Microbial Evolution (EML) (joint Université Claude Bernard Lyon 1 and CNRS laboratory), and ENGIE Axima.
ThebiofilterwasinstalledintheGuyMôquettunnel,ontheA86motorwayinThiais(Val-de-Marne)–a650-metre-long,bi-tube“cutandcover”tunnelwiththreetrafficlanesineachdirection,carrying134,000vehiclesperday.
Thesystemcomprisedtwo16m²biofilters,consistingofplantsubstrates50cm(BF50)and100cm(BF100)thick, installedon the open cut. A stream of vitiated air, extracted from inside the tunnel just before the exit portal of one of the two tubes, passedthroughthebedofthefilteratarateof1-3m3/s.
TheexperimentranfromNovember2012toApril2014,togivesufficient time to encompass all of the seasons. Therewerefour short measurement campaigns, of 4-6 weeks each, to assesstheefficacyofthebiofiltersandtomonitorchangestotheir physical, chemical and biological properties throughout the life of the experiment.
Illustration 15 provides an overview of the experimental system.
4.3.3.2 Particle filtration results
Themeasurementsfoundparticlereductionsofbetween30%and90%,accordingtoparticlesizeandbiofilterthickness.
Particle diameter [0 – 1 μm[ [1 – 2,5 μm[ [2,5 – 10 μm[ > 10 μm
BF50 reduction 29% 77% 84% 36%
BF100 reduction 61% 93% 91% 66%
Table 12: average reductions observed across the four measure-ment campaigns
Illustration 15: the site overview shows: (1) the premises housing the extractor fan; (2) the duct conveying the vitiated air; (3) the two biofil-ters; (4) a control biofilter without vitiated air; and (5) the bungalows accommodating the measuring equipment. The air samples at the biofilter outlets are captured by two “bell chambers” (6). The water for irrigating the biofilters is stored in (7) in tanks. The percolation water is collected under the filters and then filtered for reuse.
12
3
3
7
4
56
6
4
4.FullreportavailableontheADEMEwebsite:www.ademe.fr/evaluation-biofiltration-traitement-emissionsatmospheriques-tunnels-routier

29
4.3.3.3 NO2 filtration results
Averagereductionsacross theprojectdurationwere58%fortheBF50biofilterand80%fortheBF100.
Illustration 16 gives an indication of the observed reductions by comparing the NO2 concentrations measured upstream and downstreamofthebiofilters.
4.3.3.4 Conclusions of the experiment
The experiment showed how biofilters can effectively treatthemain road traffic pollutants,with no loss of efficacy after18 months of operation, provided that a continuous water sup-ply is available and several plants are replaced.
The life cycle analysis (LCA) conducted in parallel, however, revealed the major impact of the operation phase, pointing in particular to the amount of electricity needed to power the air extractor fan. Indeed, this item has more severe environmental impacts than any other category.
Doubts remain over the general environmental benefits ofthis technology, given the need to weigh energy consumption againstthepositivedepollutingimpactsofthebiofilter.
The experiment showed a clear need, at this stage, to improve biofiltercharacteristicssuchasairflow,thickness,surfaceareaand substrate composition. This, in turn, would help maintain pollution reduction efficacywhile at the same time consider-ably limiting energy consumption during the operation phase, thereby improving overall environmental impact.
Denitrificationistheonlygastreatmentmethodthathasbeeneffectively deployed in a tunnel environment. The other tech-nologies mentioned here (depolluting concrete, biofiltrationand cold plasma) are still in the research and experimentation phase.
While various laboratory studies have shown that photoca-talysis is effective at reducing nitrogen oxide concentrations, the two in-field experiments conducted to date produceddebatable and disappointing results respectively, revealing that this method appears only to work within a narrow range of
conditions. As for LafargeHolcim concrete, it is still too early to determine how effective this technology is in practice and over time.While these two technologiesaredesignedprimarily toreduce nitrogen oxide concentrations, they could also have an effect on other gases.
Biofiltrationseemstobethemostpromisingtechnology,sinceittackles both gaseous pollutants and particles. However, further development work is needed, in particular to reduce energy consumption during the operation phase and to adapt the system to the scale of existing tunnels.
Illustration 16 : example of daily NO2 content measurements during the third campaign
CONCLUSION4.4
30
GENERAL CONCLUSIONThe design and development of air treatment systems in tun-nels initially focusedon thefiltrationofparticulatematterandsmoke that forms the visible part of the pollution. Since then, the principle has been the same in every tunnel equipped with a particulatefiltrationsystem,andisbasedonelectrostaticfiltra-tion. It is now an established fact that, technologically speaking, electrostatic precipitators furnish excellent results in terms of filtrationperformance.Nonetheless,whileprogresshasbeenmade in the development of these systems, concerning the simplification of cleaning operations in particular, there havenot been any major, groundbreaking technological advances and the devices are still bulky and less cost-effective than con-ventional ventilation systems, both in terms of investment and operation. Generally-speaking, these systems are also ener-gy-intensivegiventhesurplusventilationrequirements.Whilemost of the older installations were designed to decontaminate air inside tunnels, the most recent installations place a greater focus on treating discharges to at-risk environments.
Regarding the treatment of gaseous effluents,major techno-logical breakthroughs have made it possible to step up from laboratory trials to operational deployment in tunnels. However, the relatively few cases of tunnels being equipped with gas treatment systems means there is a lack of adequate data on the operationalperformanceofsuchsystems,specificallybecausethey are so very recent. Current installations are mainly based onabsorption-baseddenitrificationtechniquesdownstreamofelectrostaticparticulatefiltration.Theyaremainlydesignedtoreduce the impact of discharges to the environment.
In recent years, new tunnel air treatment technologies such as depollutingconcreteandbiofiltrationhaveemergedtoaddressshortcomings in existing tunnel-based treatment systems. However, these technologies are still in the experimental phase and more work is required to determine the conditions under which they can be effectively deployed inside tunnels. As such, it is hard to say how these technologies will develop.
Air quality has become a major health and environmental con-cern. Despite the fact that full multi-criteria analysis has not yet provided any hard evidence to support the use of air treatment systems in preference to more conventional methods, recent tunnel projects often propose the use of air treatment systems in response to concerns expressed by local populations, who have reason to be worried about changes in their environment. Before turning to systems that may effectively provide an answer to a local pollution concern, conventional ventilation techniques (using fresh airflows to dilute pollutants) shouldstill be considered by making use of the appropriate means, i.e.playingontheairflowsandconcentrationsofthediscardedvitiatedair,aswellasonthelocationandconfigurationofdis-charges and any other method likely to improve the dispersion of pollution and so protect the most at-risk areas.
Moreover, a consistent and comprehensive system analysis should be based on a life cycle analysis (LCA), in particular to gain an insight into energy consumption and to consider the additional infrastructure required when installing air treatment systems.
Lastly, it is useful to look at the issue of air treatment in tunnels against the background of road-related atmospheric pollution. Tunnelsdonotthemselvescreatepollution;itisthetrafficgoingthrough them that is the polluting factor. It is true that tunnels channel this pollution and make it possible to treat it, but only along a very short linear length in contrast to the number of vehicles circulating in ambient air. Tunnels are still atypical structures. As such, tunnel-related atmospheric pollution is limited to very localised issues.

31
[1] The treatment of air in road tunnels, State-of-the-art of stud-ies and works, [Le traitement de l’air des tunnels routiers, état des connaissances sur les études et les réalisations], CETU,1999
[2] The treatment of air in road tunnels, State-of-the-art of stud-ies and works, [Le traitement de l’air des tunnels routiers, état des connaissances sur les études et les réalisations], CETU,2010
[3] French law on air and the rational use of energy No. 96-1236, [Loi sur l’air et l’utilisation rationnelle de l’énergie], 1996
[4] French circular 99.329 of 8 June 1999 issued by the Ministry of Health, [Circulaire n° 99.329, Ministère de la Santé], 1999
[5] Dossier pilote des tunnels “ Ventilation”,CETU,2004
[6] French technical instruction relating to safety measures in new road tunnels, design and operation, published as appen-dix 2 to inter-ministry circular No. 2000-63 of 25 August 2000 concerning safety in the tunnels of the national highways net-work (the circular and its appendix 1 are no longer in force, only appendix 2 is still applicable), [Instruction technique annexé à la circulaire interministérielle n° 2000-63 relative à la sécurité dans les tunnels du réseau routier national],2000
[7] French decree, No. 2002-213, of 15 February 2002 relating to the monitoring of air quality and its effects on health and the environment, air quality objectives, alert thresholds and limit values, [Décret, n° 2002-213, relatif à la surveillance de la qualité de l’air et de ses effets sur la santé et sur l’environ-nement],2002
[8] French decree, No. 2003-1085, of 12 November 2003 trans-posing directive 2002/3/CE of the European Parliament and of the Council of 12 February 2002, [Décret, n° 2003-1085, portant transposition de la directive 2002/3/CE],2003
[9] French decree, No. 2007-1479, of 12 October 2007 relating to air quality and modifying the environmental code (regula-tory part), [Décret, n° 2007-1479, relatif à la qualité de l’air et modifiant le code de l’environnement (partie réglementaire)], 2007
[10] French decree, No. 2008-1152, of 7 November 2008 that completes the transposition of the directive “heavy metals/ PAH” (2004/107/CE), [Décret, n° 2008-1152, relatif à la qualité de l’air],2008
[11] French decree, No. 2010-1250 transposing directive 2008/50/CE of the European Parliament and of the Council of 21 May 2008 on ambient air quality and cleaner air for Europe,2010
[12] French circular of 12 October 2007 relating to the dissemina-tion of information to the public on particulates in suspension in ambient air, [Circulaire relative à l’information du public sur les particules en suspension dans l’air ambiant, Ministère de l’Écologie, du Développement et de l’Aménagement Durables],2007
[13] Air quality assessment in France in 2014 [Bilan de la qualité de l’air en France],CGDD,2015
[14] French methodological note on the evaluation of the effects on health of air pollution in road impact studies, [Note méthodologique sur l’évaluation des effets sur la sante de la pollution de l’air dans les études d’impact routières],2005
[15] French interministerial circular dated 25 February 2005, [Circulaire interministérielle Santé/Écologie/Équipement relative à l’évaluation des effets sur la santé de la pollution de l’air dans les études d’impact routières],2005
[16] Selection of hazardous agents to be taken account of in assessments of health risks linked to road and rail infra-structures, [Sélection des agents dangereux à prendre en compte dans l’évaluation des risques sanitaires liés aux infrastructures routières et ferroviaires, Groupe de travail interministériel Santé/Équipement/Écologie],2004
[17] Toxicological and Environmental Data Sheet for Chemical Substances, benzo(a)pyrene [Fiche de données toxi-cologiques et environnementales des substances chimiques, le benzo(a)pyrène],INERIS,2006
[18] Air quality assessment in Ile-de-France in 2014 [Bilan de la qualité de l’air en Ile-de-France en 2014],Airparif,2015
[19] Managing air outside of tunnels, report for The Rijkswaterstaat Department of Road and Hydraulic Engineering, The Netherlands, Arnold Dix - Counsel at Law, Adj. Professor of Engineering,2006
[20] Automotive combustion particles and their disposal devices [Les particules de combustion automobile et leurs dispositifs d’élimination],Ademe,2005
[21] Peugeot 607 equipped with particulate filters, pollutant emis-sions balance and fuel consumption under taxi conditions for 120,000 km [Peugeot 607 équipés de filtres à particules, bilan des émissions de polluants et de la consommation en conditions d’utilisation taxi pendant 120 000 km], Ademe, 2005
[22] Approval application of East link, Tunnel Ventilation System Works,ThiessJohnHolland,2006
BIBLIOGRAPHY

32
[23] M5 East Tunnel Filtration Trial Evaluation Program – Review of Operational Performance,AMOG,2012
[24] Airborne dust and particle cleaning in urban road tunnels in norway,TomMyran/HaraldBuvik,2005
[25] Road tunnels: a guide to optimising the air quality impact upon the environment,PIARC,2008
[26] VentiliaNo.61,2006
[27] Possibilities and limitations of tunnel-air filtration and portal-flow extractions, R Brandt, I Riess, HBI Haerter Ltd, Switzerland,May2009
[28] Air filtration plant of the M5 tunnel-Détermination of Particle Removal Efficiencies,CSIRO,2011
[29] Review of Emission Treatment Systems & Technologies - Road Tunnel Applications, report for NSW Roads and Traffic Authority (Australia),Child&Associates,2004
[30] Air filtration plant of M5 Tunnel-Determination of nitric oxide and nitrogen dioxide removal efficiencies, CSIRO, November 2011
[31] Photocatalytic de-pollution in the Leopold II tunnel in Brussels: NOX abatement results,BuildingandEnvironment,2014
[32] Construction of a photocatalytic de-polluting field site in the Leopold II tunnel in Brussels, Journal of Environment al Management, 2015
[33] Avis de l’Agence française de sécurité sanitaire de l’envi-ronnement et du travail relatif à “ l’évaluation des risques lies aux nanomatériaux pour la population générale et dans l’environnement”,17March2010
[34] Photocatalysis applied to concrete, Claude Stock paper publishedin“Béton[s]”n°28,May/June2010
[35] Mechanisms of NOX entrapment into hydrated cement paste containing activated carbon – Influences of the temperature and carbonation, Université de Poitiers; Lafarge Research Center,2013
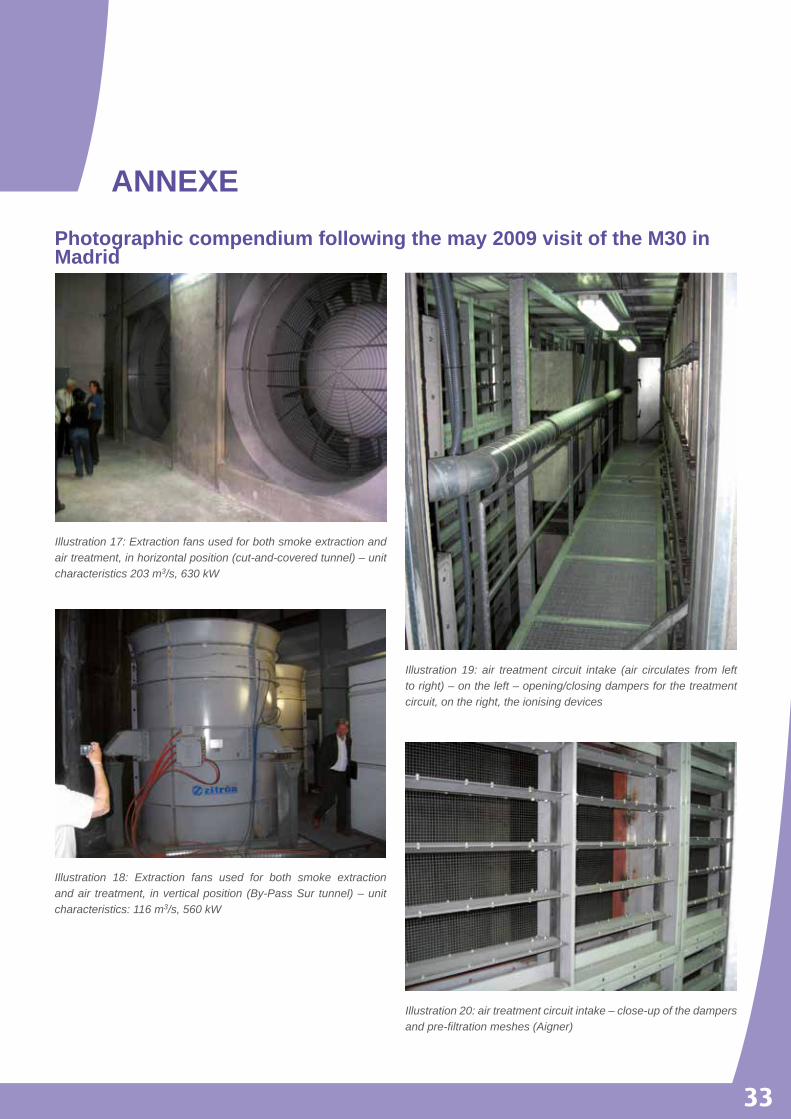
33
ANNEXE
Photographic compendium following the may 2009 visit of the M30 in Madrid
Illustration 17: Extraction fans used for both smoke extraction and air treatment, in horizontal position (cut-and-covered tunnel) – unit characteristics 203 m3/s, 630 kW
Illustration 18: Extraction fans used for both smoke extraction and air treatment, in vertical position (By-Pass Sur tunnel) – unit characteristics: 116 m3/s, 560 kW
Illustration 20: air treatment circuit intake – close-up of the dampers and pre-filtration meshes (Aigner)
Illustration 19: air treatment circuit intake (air circulates from left to right) – on the left – opening/closing dampers for the treatment circuit, on the right, the ionising devices

34
Illustration 21: ionisation device – the difference in potential is established between the points seen in the photo, air is electrically charged on passing between the blades
Illustration 22: components of the ionisation system
Illustration 23: on the left, cabinets containing the electrostatic fil-ters and, on the right, deNOX system (air circulates from left to right)
Illustration 24: electrostatic filters mounted on rollers to simplify cleaning under high-pressure air jets (Aigner)

35
Illustration 26: ionisation device being washed under high-pressure water jets (CTA)
Illustration 28: filters being washed under high-pressure water jets (Filtrontec)
Illustration 25: rinsing nozzles on an ionisation device (CTA) Illustration 27: electrostatic filters and their rinsing nozzles(CTA)

36
Illustration 29: DeNOx system – air circulates between the pan-els seen in the photo, from the back to front – the curved shape increases the panels’ surface area (W-shaped profile when seen from above) and therefore, those of the contact surfaces between air and the activated carbon, thus enhancing system performance
Illustration 30: DeNOx system – air circulates between the panels seen in the photo, a length of several metres is required to ensure a large enough contact surface area
Illustration 31: DeNOx system – close-up of the panels housing the activated carbon pellets
Illustration 32: end of the treatment system (air flows in on the right, fills the plenum then flows out through the opening in the ceiling) – on the right – the acoustic panels demonstrate the size of the aeraulics section required to limit flow speeds through the system – at top right, in shadow, the opening that forms the end of the sheathing parallel to the treatment circuit making it possible to short-circuit the treatment system in the event of fire
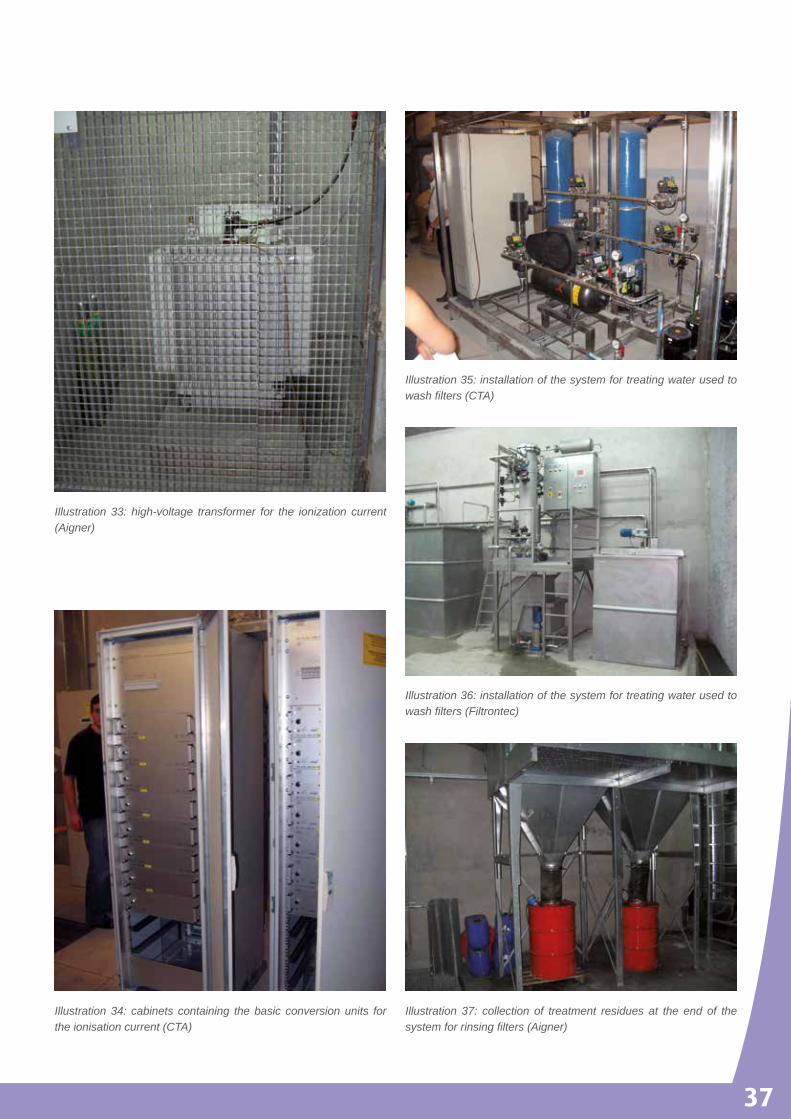
37
Illustration 33: high-voltage transformer for the ionization current (Aigner)
Illustration 34: cabinets containing the basic conversion units for the ionisation current (CTA)
Illustration 35: installation of the system for treating water used to wash filters (CTA)
Illustration 36: installation of the system for treating water used to wash filters (Filtrontec)
Illustration 37: collection of treatment residues at the end of the system for rinsing filters (Aigner)

38
Illustration 39: collection point for treatment residues at the end of the system for treating water used to wash filters (CTA)
Illustration 38: collection point for treatment residues at the end of the system for treating water used to wash filters (Filtrontec)

39
The following CETU staff contributed to this document:
Cyrille Bernagaud, Jean-François Burkhart, Bruno Vidal and Marouane Yaghzar.

www.cetu.developpement-durable.gouv.fr
Tunnels study centre25 avenue François Mitterrand69674 BRON – FRANCETel. +33 (0)4 72 14 34 00Fax. +33 (0)4 72 14 34 [email protected]
Cove
r: Ex
perim
enta
l bio
filte
r at t
he G
uy-M
ôque
t tun
nel i
n Th
iais
(94)
. Pho
to c
redi
t: CE
TU -
Edi
ting
and
coor
dina
tion:
CET
U -
Impl
emen
tatio
n: C
omm
un
iqu
ez -
Prin
ting:
VAS
SEL
GRAP
HIQU
E