the transcription factor e4f1 coordinates chk1 … · the transcription factor e4f1 coordinates...
TRANSCRIPT

Article
The Transcription Factor E
4F1 Coordinates CHK1-Dependent Checkpoint and Mitochondrial FunctionsGraphical Abstract
Highlights
d Transcriptional target genes of E4F1 encode mitochondrial
and checkpoint proteins
d E4F1 controls the basal expression of the Chek1 gene
d E4F1 transcriptional program impacts metabolism and stress
response
d E4F1 is essential for cancer cell survival and could be a target
for cancer therapies
Rodier et al., 2015, Cell Reports 11, 220–233April 14, 2015 ª2015 The Authorshttp://dx.doi.org/10.1016/j.celrep.2015.03.024
Authors
Genevieve Rodier, Olivier Kirsh, ...,
Laurent Le Cam, Claude Sardet
[email protected] (G.R.),[email protected] (L.L.C.),[email protected] (C.S.)
In Brief
Rodier et al. show that the transcription
factor E4F1, previously described as a
regulator of the p53 response and a target
of E1A, directly controls a transcriptional
program involved in mitochondrial
homeostasis, metabolism, and cell-cycle
checkpoints. This program is essential for
cancer cell survival.
Accession Numbers
GSE57242

Cell Reports
Article
The Transcription Factor E4F1 CoordinatesCHK1-Dependent Checkpointand Mitochondrial FunctionsGenevieve Rodier,1,2,3,4,5,9,* Olivier Kirsh,1,4,9,11 Martın Baraibar,6 Thibault Houles,1,2,3,4,5 Matthieu Lacroix,2,3,4,5
Helene Delpech,1,2,3,4,5 Elodie Hatchi,1,4 Stephanie Arnould,1,2,3,4,5 Dany Severac,7 Emeric Dubois,7 Julie Caramel,1,4,12
Eric Julien,1,2,3,4,5 Bertrand Friguet,6,8 Laurent Le Cam,2,3,4,5,10,* and Claude Sardet1,2,3,4,5,10,*1Equipe labellisee Ligue Contre le Cancer, Institut de Genetique Moleculaire de Montpellier, UMR5535, Centre National de la Recherche
Scientifique (CNRS), 34293 Montpellier, France2Institut de Recherche en Cancerologie de Montpellier (IRCM), 34298 Montpellier, France3Institut National de la Sante et de la Recherche Medicale (INSERM), U1194, 34298 Montpellier, France4Universite de Montpellier, 34090 Montpellier, France5Institut regional du Cancer de Montpellier, 34298 Montpellier, France6Sorbonne Universites, UPMC Univ Paris 06, UMR 8256, Biological Adaptation and Ageing—IBPS, 75005 Paris, France7MGX-Montpellier GenomiX, c/o Institut de Genomique Fonctionnelle, 141 rue de la cardonille, 34094 Cedex 5 Montpellier, France8INSERM U1164, 75005 Paris, France9Co-first author10Co-senior author11Present address: Epigenetics and Cell Fate, University Paris Diderot, Sorbonne Paris Cite, UMR7216 CNRS, 75013 Paris, France12Present address: Inserm UMR-S1052, CNRS UMR5286, Centre de Recherche en Cancerologie de Lyon, 69008 Lyon, France
*Correspondence: [email protected] (G.R.), [email protected] (L.L.C.), [email protected] (C.S.)http://dx.doi.org/10.1016/j.celrep.2015.03.024
This is an open access article under the CC BY license (http://creativecommons.org/licenses/by/4.0/).
SUMMARY
Recent data support the notion that a group of keytranscriptional regulators involved in tumorigenesis,includingMYC, p53, E2F1, andBMI1, share an intrigu-ing capacity to simultaneously regulate metabolismand cell cycle. Here, we show that another factor, themultifunctional protein E4F1, directly controls genesinvolved in mitochondria functions and cell-cyclecheckpoints, including Chek1, a major component ofthe DNA damage response. Coordination of thesecellular functions by E4F1 appears essential for thesurvival of p53-deficient transformed cells. Acuteinactivation of E4F1 in these cells results in CHK1-dependent checkpoint deficiency and multiple mito-chondrial dysfunctions that lead to increased ROSproduction, energy stress, and inhibition of de novopyrimidine synthesis. This deadly cocktail leads tothe accumulation of uncompensated oxidative dam-age to proteins and extensive DNA damage, endingin cell death. This supports the rationale of therapeuticstrategies simultaneously targetingmitochondria andCHK1 for selectivekillingofp53-deficient cancer cells.
INTRODUCTION
E4F1 transcription factor was found to regulate the viral E4 and
E1A promoters (Lee and Green, 1987; Fernandes and Rooney,
1997), but its cellular target genes remain largely unknown. Char-
acterization of E4F1 protein indicated that, in addition to its
220 Cell Reports 11, 220–233, April 14, 2015 ª2015 The Authors
intrinsic transcriptional activities, E4F1 is also an atypical ubiqui-
tin E3 ligase for the p53 tumor suppressor. Surprisingly, E4F1-
mediated ubiquitylation does not control p53 protein stability,
but regulates its transcription functions (Le Cam et al., 2006).
The central role of E4F1 in the p53 pathway also is underscored
by its direct interactions with p14ARF (Rizos et al., 2003), the pol-
ycombmember BMI1 (Chagraoui et al., 2006), and the product of
the p53 target gene FHL2 (Paul et al., 2006). Compelling evi-
dence supports the implication of E4F1 in carcinogenesis as
illustrated by its interactions with pRB (Fajas et al., 2000),
RASSF1A (Fenton et al., 2004), HNF1 (Dudziak et al., 2008),
HMGA2 (Tessari et al., 2003), Smad4 (Nojima et al., 2010), and
TCF3 (Ro and Dawid, 2011). Through its multiple activities, the
E4F1 protein plays key roles in cell proliferation and survival of
somatic, stem, and cancer cells, and is essential for both embry-
onic development and adult tissue homeostasis (Chagraoui
et al., 2006; Fajas et al., 2000, 2001; Hatchi et al., 2011; Lacroix
et al., 2010; Le Cam et al., 2004, 2006; Paul et al., 2006).
Here we show that the multifunctional protein E4F1 directly
controls on one hand mitochondria homeostasis and metabolic
functions, and on the other hand the CHK1-dependent check-
point, both functions being required for cell survival of cancer
cells. These data provide a molecular explanation for the essen-
tial role of E4F1 during cell-cycle control and cell survival and
open new questions related to its role in metabolism.
RESULTS
E4F1 Is Necessary for the Survival of p53KO
and Transformed MEFsOur previous data showed that E4F1 inactivation induces
massive cell death in cdkn2a�/� myeloid tumor cells, suggesting

CTL E4F1KO CTL E4F1KO
0
20
% a
nnex
inpo
sitiv
e ce
lls
10
Cx p53 KO
mefs
+ LTAg+ RasV12
x p53 KO
+ RasV12
CTL E4F1KOCTL E4F1
CTL
KO
CleavedCasp 3
CTL E4F1KOF
A
Ctl
Ctl
Ctl
E4F1KO
0
2
4
6
8
10
12
3 5 7 10
Ctl
E4F1KO
E4F1KO
E4F1KO
0
20
40
60
3 5 7 10
3 6 10
cell
num
ber (
106 )
0
5
10
15
2025
x p53KO
+ LTAg+ RasV12
0
10
20
30
40
0 3 10
x p53KO
+ RasV12
6
mefs
days post Cre
CTL E4F1 KO CTL E4F1 KO
x p53KO
0
20
40
60
80
100
Cel
l cyc
le p
hase
(%)
G0/G1
S
B
mefs
G2/M
0
20
40
60
80
100
% o
f cel
lsw
ithcy
toki
nesi
sfa
ilure
CTL E4F1KO
Dx p53KO
+ RasV12
E
Days post cells injection
0
1
0
Tum
or s
ize
(cm
3 )
2 +4OHT(Cre)
E4F1KO; RERT
8 12 16 18
Figure 1. E4F1 Is Essential for the Survival
of p53KO and Transformed MEFs
(A) E4F1KO cells show proliferation defects. Pro-
liferation curves upon Cre-mediated acute inacti-
vation of E4F1 in E4F1+/f (CTL) and E4F1�/f
(E4F1KO) primary MEFs (first), in isogenic p53KO
primary MEFs (second), in MEFs transformed by
LTAg + HaRasV12 (third), and in p53KO MEFs
transformed by HaRasV12 alone (fourth) are shown.
Data represent the mean ± SEM of six experi-
ments.
(B)E4F1 inactivation in primaryMEFs leads to p53-
dependent growth arrest. Cell-cycle profiles were
analyzed by FACScan (BrdU/propidium iodide [PI]
stainings) 5 days after Cre-mediated inactivation
of E4F1. Data represent the mean ± SEM of four
experiments.
(C) E4F1 inactivation in transformed cells leads to
cell death. FACScan analysis of annexin-FITC-
positive cells, 6 days after Cre-mediated inacti-
vation of E4F1, is shown. Data represent the mean
± SEM of six experiments.
(D) Fraction of the cell population of transformed
MEFs harboring abnormal mitosis upon Cre-
mediated inactivation of E4F1, as monitored by
videomicroscopy on living cells (n = 3), is shown.
(E) Acute inactivation of E4F1 impairs tumor
growth in vivo. Tumor growth (n = 3) in nude
mice upon injection of RERT;E4F1+/f (CTL) and
RERT;E4F1�/f MEFs, both fully transformed by
LTAg + HaRasV12, is shown. In measurable tu-
mors, acute inactivation of E4F1 was induced by
topical skin application of tamoxifen (3 mg/mouse/
day during 3 days, gray bar). Data represent the
mean ± SEM of six experiments.
(F) Immunoblot analysis of cleaved-caspase 3 in
protein extracts prepared from tumors, upon
tamoxifen-induced in vivo inactivation of E4F1, is
shown.
(See also Figure S1.)
that E4F1 is required for the survival of tumor cells deficient for
the p53 pathways (Hatchi et al., 2011).
In this report, we compared the effect of the conditional
inactivation of E4F1 in normal, p53�/�(p53KO), and transformed
mouse embryonic fibroblasts (MEFs). Primary MEFs were
derived from E4F1�/flox and p53KO;E4F1�/flox embryos bearing
a null and conditional E4F1 alleles (Caramel et al., 2011; Hatchi
et al., 2011; Lacroix et al., 2010). E4F1�/flox or control E4F1+/flox
MEFs were fully transformed by SV40-LargeT (LTAg) or
E1A12S oncogenes in combination with Ha-RasV12, while
p53KO;E4F1�/flox or control p53KO;E4F1+/flox MEFs were trans-
formed by Ha-RasV12 alone. Efficient depletion of E4F1 protein
was obtained in these primary or transformed MEFs upon trans-
duction with a self-excising retroviral vector encoding the Cre re-
combinase (Silver and Livingston, 2001; Figures S1A and S1B).
Upon E4F1 inactivation, primary MEFs (Cre-treated E4F1�/flox
cells, hereinafter referred to as E4F1KO cells) gradually ceased
proliferating (Figure 1A), failed to incorporate BrdU (Figure S1D),
and showed a total DNA content indicative of a cell-cycle
arrest in G0–G1 and G2/M phases (Figure 1B). Importantly,
E4F1KO-arrested MEFs showed no sign of increased cell death
(annexin-V-positive cells, Figure 1C) or of premature senes-
cence (SA b-galactosidase-positive cells, Figure S1F). E4F1KO
cells undergo a p53-dependent G2 arrest (Taylor et al., 1999)
rather than an M-phase arrest, as shown by their 4n DNA con-
tent and concomitant absence of phospho-histone H3 staining
and (Figure S1E) lack of CYCLIN B1 and CDK1 expression
(Figure S1H). This G2/M arrest was not detected in E4F1KO;
p53KO double knockout (KO) cells nor in E4F1KO transformed
cells (LTAg;Ha-RasV12 or p53KO;Ha-RasV12 MEFs) (Figures 1B,
S1D, and S1H). However, their growth curves (Figures 1A and
S1C) and microscopic observation (Figure S1M) indicated
they still exhibited severe proliferation defects compared to
control cells (Figures 1A, S1C, and S1M). Time-lapse imaging
confirmed that these cells died during mitosis, following one
or several unsuccessful attempts to divide (Figures 1D and
S1N). This resulted in a gradual increase in cell death, as indi-
cated by annexin-V labeling (Figures 1C and S1I) and by the
presence of a large number of floating dying cells with a sub-
G1 DNA content (Figure 5F). These cells also released cyto-
chrome c from mitochondria (Figure S1L), suggesting that
they died by apoptosis.
Cell Reports 11, 220–233, April 14, 2015 ª2015 The Authors 221

E4F1 ChIP Input
10kb spanover TSS
BA
Genes bound by E4F1 in p53KO + Rasv12 mefs
(95 ChIP-Seq peaks, 111 genes)
3816 14
43
254 168 3178
Transcriptome-Array
ChIP-Seq
Genes deregulatedupon E4F1 KO in p53KO + Rasv12 mefs
(3398 genes)
Genes deregulatedupon E4F1 KO in p53KO mefs(476 genes)
C E4F1 Motif E-Value=1.6e-046
Up
E4F1 Ch-IP
0,0
0,1
0,2
0,3
CTLE4F1KO
% o
f inp
ut
0,0
0,1
0,2
0,3
0,4
DNAjc19Ndufs5Dlat Hax1 Taz Sod2 Chek1Rad52 Chek2
% o
f inp
ut%
of i
nput
0,0
0,1
0,2
0,3
0,4
0,5
D
TSS TSS
CTLE4F1KO
CTLE4F1KO
DNAjc19Ndufs5Dlat Hax1 Taz Sod2 Chek1Rad52 Chek2
DNAjc19Ndufs5Dlat Hax1 Taz Sod2 Chek1Rad52
p53KO
p53KO + Ha-Rasv12
GeneRatio
KO/WTPos. to
TSS Motif Function
Dnajc19 0,06 74 + Mito Ndufs5 0,11 -45 + MitoMrfap1 0,14 -106 +
1700025K23Rik 0,18 352 -Psmb6 0,18 16 +
Ipo8 0,2 -60 +Senp8 0,23 -168 + DDR/ChkDlat 0,24 161 + MitoE4f1 0,25 -18 +Taz 0,25 164 + Mito
Tsen2 0,26 53 +Elp3 0,27 -102 +
Pbrm1 0,27 76 +Hax1 0,31 -91 + Mito
Mrpl15 0,32 -67 + MitoNcoa5 0,32 -195 +Brp44l 0,33 -128 + MitoRad52 0,33 34 + DDR/ChkDnajc9 0,34 -67 +Eef1g 0,36 144 +Fktn 0,42 46 +
AA408296 0,43 -79 +Bag5 0,43 -107 +Tube1 0,43 21 +Chek1 0,44 -56 + DDR/ChkTgds 0,47 -112 +
4930402E16Rik 0,48 -45 + MitoWdr7 0,49 51 +
BC019943/Tti2 0,52 -38 + DDR/ChkD1Bwg0212e 0,52 28 +
Plod1* 0,52 -4189 +Taf5 0,61 12 +
2510003E04Rik 0,63 -94 + Mito2510039O18Rik* 0,64 71 +2310003H01Rik 0,65 -114 + DDR/Chk
Mcts2 0,69 -9 +Lsm4 2,54 95 +
Cep290 2,67 -598 +
E
Chek2
mefs
E4F1 Ch-IP
E4F1 Ch-IP
Down
Figure 2. E4F1 Controls a Limited Set of Genes that Define at Least Two Subprograms Involved in Mitochondrial Homeostasis and
Metabolism and in Stress Response and Checkpoints
(A) E4F1-binding sites identified by ChIP-seq are mainly located nearby TSS. E4F1 ChIP-seq read densities in the 10-kb regions surrounding the TSS of the
closest genes located nearby E4F1-binding sites, as identified in p53KO;HaRasV12 transformed MEFs, are shown.
(B) Venn diagram of the overlaps among all E4F1-bound genes identified by ChIP-seq in p53KO;HaRasV12 transformed MEFs (GSE57228, in red) and genes
differentially expressed (transcriptiome arrays GSE57240) between E4F1WT and E4F1KO cells (p53KO;E4F1KO versus p53KO;E4F1WT primary MEFs [blue] and
p53KO;HaRasV12;E4F1KO versus p53KO;HaRasV12;E4F1WT transformed MEFs [green]) is shown. These genome-wide analyses were performed at a time when
(legend continued on next page)
222 Cell Reports 11, 220–233, April 14, 2015 ª2015 The Authors

Next, we assessed the capacity of E4F1WT and E4F1KO cells to
grow in soft agar and form tumors in nude mice. To bypass the
usual low efficiency of infection by Cre-retroviruses in these as-
says, we performed these experiments on LTAg and Ha-RasV12
transformed MEFs derived from E4F1+/flox;Cre-ERT2 KI/KI and
E4F1�/flox;Cre-ERT2 KI/KI mice that express a 4-hydroxy-tamox-
ifen (4OHT)-inducible CreERT2 recombinase (Lacroix et al.,
2010). 4-OHT-mediated acute inactivation of E4F1 in these
transformed cells led to a strong reduction of their capacity to
form colonies in soft agar (Figure S1J) and strongly decreased
their tumorigenic potential in nude mice (Figures 1E and S1K).
Altogether, these data indicate that E4F1 depletion leads to a
p53-dependent cell-cycle arrest in normal MEFs and to p53-
independent mitotic cell death in immortalized or transformed
cells deficient for the p53 pathway.
E4F1 Target Genes, a Limited Set of Genes Involvedin Mitochondrial Homeostasis, Metabolism,and CheckpointsE4F1 chromatin immunoprecipitation (ChIP) combined with
deep sequencing (ChIP-seq) and differential transcriptomic ana-
lyses of E4F1KO and E4F1WT cells were performed to identify
the p53-independent program directly controlled by E4F1. We
identified the full repertoire of endogenous target DNA sites
bound by E4F1 in primary MEFs and p53KO;Ha-RasV12 trans-
formed MEFs (Table S1) by ChIP-seq using a previously charac-
terized anti-E4F1 rabbit polyclonal antibody (Fajas et al., 2000;
Figure S1A). E4F1-binding regions were defined by combining
bioinformatic toolboxes provided by CisGenome and Qeseq
software systems. Raw sequencing data are available on Gene
Expression Omnibus (GEO) dataset repository (GSE57228).
Genome sequences significantly enriched (Table S1) by this
E4F1 ChIP-seq were then annotated according to the transcrip-
tion start site (TSS) of the closest gene (Table S2). Peak read
densities, displayed as a heatmap (Seqminer 1.3.3) of the 10-
kb (Figure 2A) or 100-kb window (Figure S2C), centered on
gene TSS. Our analyses identified 126 E4F1-binding sites that
are mainly located in the promoter (<1,000 bp from TSS),
50UTR, or first exons (Figure S2B) of 111 genes that are distrib-
uted along all chromosomes (Figure S2A). Strikingly, this ChIP-
seq profile was very similar in primary and p53K0;Ha-RasV12
MEFs, indicating this E4F1 cistrome is independent of p53 and
of cell transformation (Figure S2F).
In parallel, we performed differential transcriptomic analyses
(microarray GEO dataset GSE57240) on E4F1WT;p53KO and
E4F1KO;p53KO cells or their Ha-RasV12 transformed counter-
parts. Gene lists identified by these transcriptomic analyses
were intersected with the list of genes directly bound by
E4F1 according to our ChiP-seq (Figure 2B). This led to the
all cells (E4F1KO and E4F1WT) were still viable (annexin-V negative) and actively gr
cell lines.
(C) MEME logo sequence analysis of the DNA fragments bound by E4F1 reveals
(D) ChIP-qPCR validation of E4F1 target genes in E4F1WT and E4F1KO cells 3 d
percentages of input (data are means ± SEM of four experiments).
(E) List of the 38 E4F1 direct target genes identified in (B). Table provides informa
(ratio KO/WT), the presence of an E4F1 consensus motif near the gene promot
proteins (Mito) or for factors involved in cellular stress response and checkpoints
identification of a common set of 38 genes, the expression of
which depends on the presence of E4F1 nearby or on their
TSS, in all tested cell populations. Notably, 36 of these 38
genes were downregulated upon E4F1 inactivation, suggesting
that E4F1 acts mainly as a transactivator for its target genes
(Figure 2E).
A set of 26 genes was further validated as direct targets
for E4F1 by ChIP-qPCR experiments performed in E4F1WT
and E4F1KO MEFs. These assays confirmed the presence of
the E4F1 protein on the TSS region of these genes in E4F1WT,
but not in E4F1KO MEFs (Figures 2D and 2E; Table S2). A selec-
tion of E4F1 genes was further validated by ChIP-qPCR in pri-
mary, immortalized (p53KO) and transformed (p53KO;Ha-RasV12)
MEFs (Figure 2D).
Analyses of DNA sequences bound by E4F1 unveiled a
hitherto unidentified consensus motif (Figure 2C) present in
most of these target sequences (Figure 2E). Noteworthy, this
new E4F1 motif was detected in many but not all of the 128
DNA regions initially identified by ChIP-seq, with an enrichment
in regions located in the close vicinity of TSS (Table S2). In
contrast, most peaks located further than 1 kb relative to the
TSS did not harbor such an E4F1motif and turned out to be false
positive in our ChIP-qPCR validation experiments performed on
E4F1WT and E4F1KO cells (Table S2). Finally, we confirmed by
electrophoretic mobility shift assays (EMSAs) that this new motif
is recognized by recombinant E4F1 protein in vitro (Figure S2D).
Interestingly, the E4F1 gene itself contains this consensus motif
nearby its own TSS and was identified as a direct target of the
E4F1 protein by our ChIP-seq (Figure 2E), indicating that E4F1
controls its own expression.
Ontology analysis of this list of 38 genes, bound and tran-
scriptionally controlled by E4F1, revealed an unexpected
enrichment for nuclear genes encoding mitochondrial pro-
teins (Dnajc19, Taz, Ndufs5, Dlat, Hax1, Mrpl15, Brp44l,
4930402E16Rik/Pdpr, and 2510003E04Rik/KBP) and for genes
involved in DNA damage response and cell-cycle checkpoints
(Chek1, Rad52, Senp8, BC019943/Tti2, and 2310003H01Rik/
Faap100) (Figure 2E). To challenge the evolutionary conserva-
tion and specificity of this dual E4F1 transcriptional program,
we monitored by ChIP-qPCR the presence of E4F1 at the
human orthologous region of the Dnajc19, Ndufs5, Dlat,
Chek1, and Rad52 genes in human U2OS cells. This assay
confirmed that E4F1 was recruited on these genes in human
cells (Figure S2E).
Altogether, our data indicate that, regardless of the p53 status
of the cells, E4F1 is bound to a novel regulatory motif located
nearby the TSS of a limited set of genes involved in mitochondria
homeostasis and stress responses, and it exerts a positive
control on their expression.
owing. The overlap defines a set of 38 genes bound and regulated by E4F1in all
a novel E4F1 consensus motif.
ays after Cre-mediated inactivation of E4F1. Enrichments are represented as
tion about the differential expression of transcripts in E4F1WT and E4F1KO cells
er and its distance to TSS, and whether these genes codes for mitochondrial
(DDR/Chk). (See also Figure S2 and Tables S1 and S2.)
Cell Reports 11, 220–233, April 14, 2015 ª2015 The Authors 223

mefs
DNAjc19
1,4
00,2
0,6
1
Ndufs5
00,2
0,6
1
00,2
0,6
1
00,2
0,6
1
00,2
0,6
1
Mrpl15
Taz
Dlat
00,2
0,6
1
mR
NA
, arb
itrar
yun
its
Hax1
E4F1KOCTL
p53KO p53KO
+RasV12
A B
0
1
2
AM
P/A
TP a
.u.
CTL E4F1KO0100200300400500600700800
ATP
/ug
prot
, 10
3
CTL E4F1KO
E4F1
AMPKP
AMPK
ACTIN
C CTL E4F1KO
DNAjc19
TAFAZZIN
p38P
p38
Non Mitochondrial Respiration
1.00.5
1.51.00.5
0
1.00.5
0
1.5
2.0
1.00
2.0
E
Cytosine
Thymidine
UMP
Orotate
Adenosine
Guanosine
CTL E4F1KO
210
3
3210
0
1.5
Basal Respiration
0
500
1000
1500
2000
2500
3000
OC
R(p
mol
es/m
in/m
g)
Spare RespiratoryCapacity
0
2000
4000
6000
8000
10000
12000
OC
R(p
mol
es/m
in/m
g )
Maximal respiration
0
2000
4000
6000
8000
10000
12000
OC
R(p
mol
es/m
in/m
g )
0
1000
2000
3000
4000
OC
R(p
mol
es/m
in/m
g)
CTL E4F1KO CTL E4F1KO
CTL E4F1KO CTL E4F1KO
E4F1+/flox
E4F1+/flox + CRE
oligomycin FCCP RotenoneD
E4F1-/flox
E4F1-/flox + CRE
Figure 3. E4F1 KO in Transformed MEFs Results in Mitochondria Dysfunctions that Lead to Energy Stress and Inhibition of De Novo
Pyrimidine Synthesis
(A) mRNA levels of E4F1 target genes coding for mitochondrial proteins are downregulated in E4F1KO cells, as measured by qRT-PCR 3 days after Cre-mediated
inactivation of E4F1 (E4F1KO) in primary MEFs, p53KO MEFs, or p53KO;HaRasV12 transformed MEFs. In each case, corresponding Cre-treated E4F1+/f cells that
retain an E4F1 WT allele were used as controls (CTL). Data represent the mean ± SEM of seven experiments.
(B) ATP level (left) and AMP/ATP ratio (right) are altered in E4F1KO cells, as measured 3 days after Cre-mediated inactivation of E4F1 (E4F1KO) in p53KO;HaRasV12
transformed MEFs (n = 3). As in (A), corresponding Cre-treated E4F1+/f transformed cells (CTL) were used as controls. Data represent the mean ± SEM of three
experiments.
(C) AMPK and p38 are activated in E4F1KO cells. Immunoblots show the levels of AMPK, AMPKp, p38, p38p, DNAJC19, and TAFAZZIN on extracts from E4F1WT
and E4F1KO transformed MEFs, treated as in (B).
(D) Representative experiment (n = 3) of an OCR performed on transformed E4F1WT and E4F1KO MEFs (top). Values for basal and maximal respirations, spare
respiratory capacity, and nonmitochondrial respiration (evaluated upon injection of the ATP synthase inhibitor oligomycin, the uncoupling agent FCCP, and the
(legend continued on next page)
224 Cell Reports 11, 220–233, April 14, 2015 ª2015 The Authors
E4F1 KO Results in Mitochondria Dysfunctions thatLead to Energy Stress and Inhibition of De NovoPyrimidine SynthesisThe qRT-PCR validation experiments on Dnajc19, Ndufs5, Dlat,
Taz, Hax1, andMrpl15 transcripts confirmed that the E4F1 mito-
chondrial sub-program identified by our arrays and ChIP-seq
experiments was strongly downregulated in all E4F1KO cells
(Figure 3A). These genes are involved in various biological pro-
cesses and their concomitant downregulation in E4F1KO cells
should result in mitochondrial dysfunctions, with consequences
on energy production, nucleoside synthesis, or redox homeosta-
sis, processes important for cell proliferation and survival.
We found that E4F1KO transformed cells showed signs of
energetic stress compared to controls, as shown by the alter-
ation in the total ATP level and the AMP/ATP ratio (Figures
3B and S3). These defects led to the induction of a p38 stress
response and activation of the energy sensor AMP-activated
protein kinase (AMPK) (Figure 3C). As a readout of potential
mitochondrial alterations in transformed E4F1KO cells, we
determined their oxygen consumption rate (OCR). Compared
with control cells, transformed E4F1KO cells exhibited a strong
decrease in O2 consumption (at all levels, i.e., basal respiration
and maximum respiratory capacity as well as nonmitochondrial
respiration, spare respiratory capacity, and ATP turnover)
(Figures 3D and S3).
Mitochondrial dysfunction also has been described to entail
impairment of pyrimidine de novo synthesis via a key enzyme
of this pathway, the mitochondrially bound and respiratory-
chain-coupled dihydroorotate dehydrogenase (DHODH). A
screen for alterations in metabolites selectively affected in
E4F1KO transformed cells revealed that E4F1 inactivation re-
sulted in a significantly decreased level of several intermediates
in pyrimidine biosynthesis, including orotate and its downstream
metabolite UMP (Figure 3E), the latter being considered as
the first pyrimidine and precursor of other nucleosides. As a
consequence of this downregulation in de novo UMP synthesis,
the levels of the pyrimidine nucleosides, thymidine and cytosine,
were also significantly decreased in E4F1KO cells. Unconnected
to mitochondria, the neosynthesis of the purine nucleosides,
guanosine and adenosine, were unaffected in these cells
(Figure 3E).
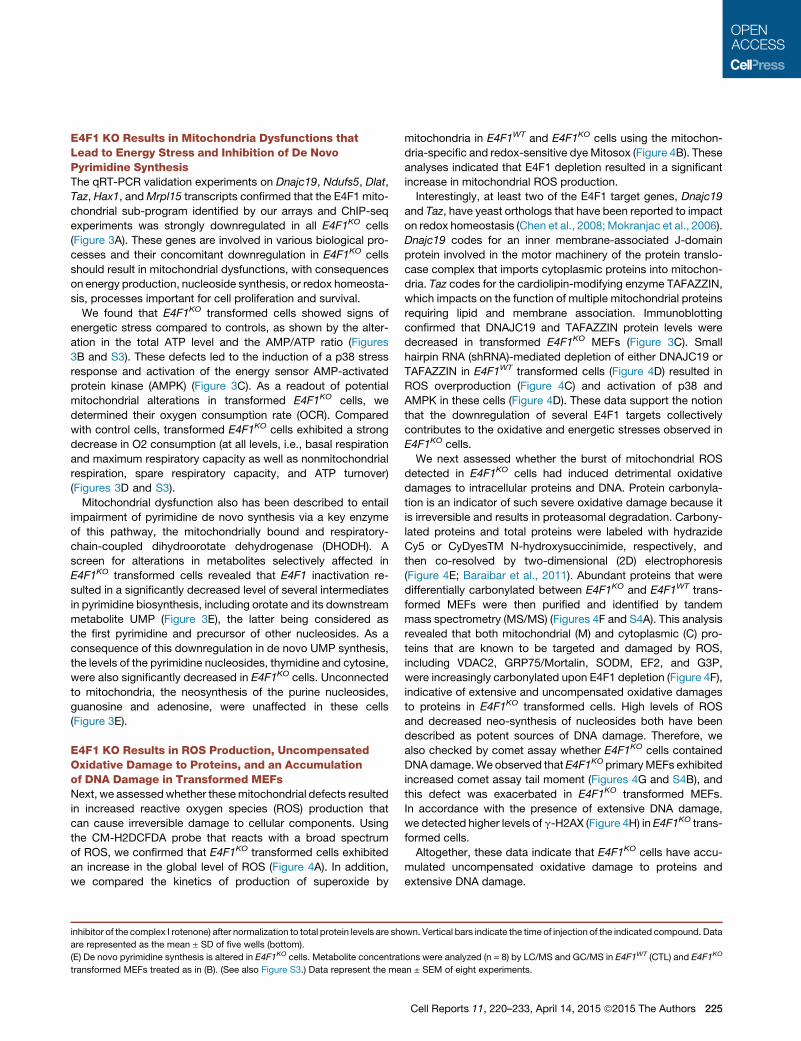
E4F1 KO Results in ROS Production, UncompensatedOxidative Damage to Proteins, and an Accumulationof DNA Damage in Transformed MEFsNext, we assessedwhether thesemitochondrial defects resulted
in increased reactive oxygen species (ROS) production that
can cause irreversible damage to cellular components. Using
the CM-H2DCFDA probe that reacts with a broad spectrum
of ROS, we confirmed that E4F1KO transformed cells exhibited
an increase in the global level of ROS (Figure 4A). In addition,
we compared the kinetics of production of superoxide by
inhibitor of the complex I rotenone) after normalization to total protein levels are sh
are represented as the mean ± SD of five wells (bottom).
(E) De novo pyrimidine synthesis is altered in E4F1KO cells. Metabolite concentrat
transformed MEFs treated as in (B). (See also Figure S3.) Data represent the me
mitochondria in E4F1WT and E4F1KO cells using the mitochon-
dria-specific and redox-sensitive dyeMitosox (Figure 4B). These
analyses indicated that E4F1 depletion resulted in a significant
increase in mitochondrial ROS production.
Interestingly, at least two of the E4F1 target genes, Dnajc19
and Taz, have yeast orthologs that have been reported to impact
on redox homeostasis (Chen et al., 2008; Mokranjac et al., 2006).
Dnajc19 codes for an inner membrane-associated J-domain
protein involved in the motor machinery of the protein translo-
case complex that imports cytoplasmic proteins into mitochon-
dria. Taz codes for the cardiolipin-modifying enzyme TAFAZZIN,
which impacts on the function of multiple mitochondrial proteins
requiring lipid and membrane association. Immunoblotting
confirmed that DNAJC19 and TAFAZZIN protein levels were
decreased in transformed E4F1KO MEFs (Figure 3C). Small
hairpin RNA (shRNA)-mediated depletion of either DNAJC19 or
TAFAZZIN in E4F1WT transformed cells (Figure 4D) resulted in
ROS overproduction (Figure 4C) and activation of p38 and
AMPK in these cells (Figure 4D). These data support the notion
that the downregulation of several E4F1 targets collectively
contributes to the oxidative and energetic stresses observed in
E4F1KO cells.
We next assessed whether the burst of mitochondrial ROS
detected in E4F1KO cells had induced detrimental oxidative
damages to intracellular proteins and DNA. Protein carbonyla-
tion is an indicator of such severe oxidative damage because it
is irreversible and results in proteasomal degradation. Carbony-
lated proteins and total proteins were labeled with hydrazide
Cy5 or CyDyesTM N-hydroxysuccinimide, respectively, and
then co-resolved by two-dimensional (2D) electrophoresis
(Figure 4E; Baraibar et al., 2011). Abundant proteins that were
differentially carbonylated between E4F1KO and E4F1WT trans-
formed MEFs were then purified and identified by tandem
mass spectrometry (MS/MS) (Figures 4F and S4A). This analysis
revealed that both mitochondrial (M) and cytoplasmic (C) pro-
teins that are known to be targeted and damaged by ROS,
including VDAC2, GRP75/Mortalin, SODM, EF2, and G3P,
were increasingly carbonylated upon E4F1 depletion (Figure 4F),
indicative of extensive and uncompensated oxidative damages
to proteins in E4F1KO transformed cells. High levels of ROS
and decreased neo-synthesis of nucleosides both have been
described as potent sources of DNA damage. Therefore, we
also checked by comet assay whether E4F1KO cells contained
DNAdamage.We observed that E4F1KO primaryMEFs exhibited
increased comet assay tail moment (Figures 4G and S4B), and
this defect was exacerbated in E4F1KO transformed MEFs.
In accordance with the presence of extensive DNA damage,
we detected higher levels of g-H2AX (Figure 4H) in E4F1KO trans-
formed cells.
Altogether, these data indicate that E4F1KO cells have accu-
mulated uncompensated oxidative damage to proteins and
extensive DNA damage.
own. Vertical bars indicate the time of injection of the indicated compound. Data
ions were analyzed (n = 8) by LC/MS and GC/MS in E4F1WT (CTL) and E4F1KO
an ± SEM of eight experiments.
Cell Reports 11, 220–233, April 14, 2015 ª2015 The Authors 225
shCTL shTaz shDNAjc19shCTLC
Mito
Sox
fluor
esce
nce
a.u
.
p53KO
+ RasV12 y = 127,26x - 121,31R = 0,9862
0
50
100
150
200
15 30 45
250E4F1KO
Time after Mitosox addition (min)
2y = 75,02x - 88,42
R = 0,968
CTL
BAD
CFD
A fl
uore
scen
ce a
.u.
FL1-H (DCFDA)
E4F1KOCTL
D
TAFAZZIN
shRNA CTL DNAjc19 TAZ
DNAjc19
AMPKp
p38p
F
CTL E4F1KO
2E
p53KO
+ RasV12
020
406080
100
Cla
ss IV
Com
et,
% o
f cel
lpop
ulat
ion
mefs
CTL E4F1KO CTL E4F1KO
G
H3
γH2AX
CTL E4F1KOH
p53KO + RasV12
FL1-H (DCFDA)
Figure 4. Mitochondrial ROS, Uridine, and Depletion of CHK1 Contribute to the Cell Death Induced by the Inactivation of E4F1 in
p53-Deficient Transformed Cells
(A) Cellular ROS levels are increased in E4F1KO cells. ROS levels were measured by FACScan with the fluorescent dye DCFDA in E4F1WT (CTL) and E4F1KO
transformed MEFs 6 days after E4F1-mediated inactivation.
(B) Mitochondrial ROS production is increased in E4F1KO transformed cells. ROS production was measured by FACScan with the mitochondrial ROS-specific
fluorescent dye Mitosox in E4F1WT (CTL) and E4F1KO transformed MEFs treated as in (A).
(C) The individual shRNA-mediated depletion of two E4F1 target genes,Dnajc19 or Taz, is sufficient to generate higher levels of cellular ROS. ROSwasmeasured
with the fluorescent dye DCFDA upon transduction of p53KO;HaRasV12 transformed MEFs with lentiviral particles encoding shRNAs directed against DNAjc19,
Taz, or an irrelevant sequence (shCTL).
(D) Immunoblotting shows the partial depletion of DNAJC19 and TAFAZZIN (Taz product) proteins and the stimulation of AMPK and p38 phosphorylation
(AMPKp and p38p) in cells treated by shRNAs as in (C).
(legend continued on next page)
226 Cell Reports 11, 220–233, April 14, 2015 ª2015 The Authors

E4F1 Directly Controls Chek1 Gene Expression withImpact on the CHK1-Dependent DNADamage ResponseOur list of E4F1 target genes indicated the existence of a second
E4F1 transcriptional sub-program involved in DNA damage
responses and cell-cycle checkpoints (Figure 2) that pointed to
the Chek1 gene. We decided to further investigate this unde-
scribed E4F1-CHK1 pathway, considering that, together with
mitochondrial dysfunctions, it could explain the extensive DNA
damage and G2/M checkpoint defects observed in transformed
E4F1KO cells (Figures 1 and 4).
Our data clearly identified E4F1 on the TSS of the Chek1 gene
in primary, p53KO, and transformed MEFs (Figures 2D, 2E, and
5A). In contrast, E4F1 was undetectable at the Chek2 gene
that codes for the partially redundant checkpoint kinase CHK2,
as illustrated in the ChIP-seq experiments (Figure 5A) and
ChIP-qPCR validations (Figure 2D). Consistent with a role of
E4F1 as an essential transcriptional activator of Chek1, expres-
sion arrays (Figure 2E) and qRT-PCR analyses (Figure 5B)
showed that Chek1 mRNA level was decreased in E4F1K0 cells.
To confirm that E4F1was activatingChek1 transcription, we also
testedwhether ectopic expression of E4F1was able to activate a
luciferase reporter construct driven by the Chek1 promoter
sequence. This reporter assay showed that full-length E4F1,
but not a mutant devoided of its DNA-binding domain (DDBD)
(Le Cam et al., 2006), stimulated this Chek1 reporter construct
in a dose-dependent manner (Figure 5C).
Importantly, CHK1 level also was decreased in E4F1K0;p53KO
and transformedMEFs, whileChek2mRNA and protein levels re-
mained unchanged (Figures 5B and 5D). Of note, the control of
E4F1 on the basal expression of Chek1 extends beyond MEFs,
since CHK1 protein downregulation also was detected by immu-
nocytochemistry in tumor sections prepared from a previously
described mouse model of histiocytic sarcomas (Hatchi et al.,
2011) undergoing acute inactivation of E4F1 in vivo (Figure 5E).
In addition, we observed in human cell lines (HEL and HL60)
that CHK1 level was strongly decreased upon shRNA-mediated
depletion of E4F1 (Figure S5), confirming the E4F1-CHK1
connection in human cells (Figure S2E).
As previous reports showed that the CHK1-dependent check-
point is particularly important for the survival of p53-deficient
cancer cells exposed to DNA-damaging agents inducing replica-
tive stress (McNeely et al., 2014), we next evaluated the sensi-
tivity of p53-deficient E4F1KO transformed MEFs to hydroxyurea
(HU). As expected, E4F1WT transformed control cells massively
arrested in S and G2/M phases upon the addition of HU (Fig-
ure 5F). According to a major role of CHK1 in this checkpoint,
inhibition of CHK1 kinase activity by the pharmacological inhib-
itor AZD7762 partially bypassed this cell-cycle arrest and re-
(E) Increased protein oxidation in p53KO;HaRasV12 transformed MEFs upon inact
and E4F1KO transformed cells treated as in (A). Carbonylated proteins (red spots)
N-Hydroxysuccinimide, respectively, and then co-resolved by 2D electrophores
p < 0.05) in E4F1KO cells.
(F) Identification by mass spectrometry of the proteins that are increasingly carb
(G) E4F1KO cells accumulate DNA damages. Alkaline comet assay was performe
transformed MEFs (p53KO;HaRasV12). Histograms represent the percentage of c
Figure S4.) Data represent the mean ± SEM of three experiments.
(H) g-H2AX is activated in E4F1KO cells. Immunoblots show the level of g-H2AX
sulted in massive cell death (Sub-G1 DNA content). Consistent
with a role of E4F1 in the basal expression of CHK1, E4F1KO
transformed cells treated with HU only exhibited a profile indic-
ative of a compromised arrest in S and G2/M and of enhanced
cell death (Sub-G1) that was similar to that of control cells
treated with both HU and the CHK1 inhibitor (Figure 5F).
Altogether, these data strongly support a direct role for E4F1
in regulating CHK1 expression, with impact on the CHK1-depen-
dent checkpoint response to DNA damage.
The Abnormal Levels of Mitochondrial ROS, PyrimidineNeosynthesis, and CHK1 Contribute to E4F1KO CellPhenotypeNext, we addressed in rescue experiments the relative contribu-
tion of mitochondrial dysfunctions (oxidative stress and pyrimi-
dine neosynthesis) and of CHK1 depletion in the growth arrest
and cell death resulting from E4F1 inactivation. Addition of the
antioxidant ascorbate (ASC) partially bypassed the cell-cycle
arrest of primary E4F1KO MEFs and improved, at least in the
short term, their capacity to proliferate (Figures 6A and 6B).
ASC also significantly decreased cell death in transformed
E4F1KO MEFs (Figure 6C), resulting in a limited but significant
restoration of proliferation (Figure 6A), observed up to 2 weeks
after E4F1 conditional inactivation (Figure S6A). Importantly,
similar partial rescue of cell death was observed with mito-
TEMPO, a mitochondria-targeted antioxidant (Figure 6C).
Collectively, these results indicate that mitochondrial ROS is,
at least in part, responsible for the proliferation defects and
loss of viability of E4F1KO cells.
Because pyrimidine depletion due to mitochondrial defects
also has been reported to induce cell death, we then tested
whether the addition of uridine, a product of the pyrimidine neo-
synthesis pathway that bypasses the mitochondrial step of this
synthesis, could also protect E4F1KO cells. As observed with
antioxidants, uridine addition markedly decreased cell death in
transformed E4F1KOMEFs (Figure 6D). Notably, the combination
of Mito-TEMPO and uridine did not further improve the survival
of these cells (data not shown).
Finally, we tested whether ectopic restoration of CHK1 protein
level in E4F1KO transformed cells also could rescue cell death.
Expression of HA-tagged CHK1 in these cells clearly enhanced
their short-term survival (Figures 6E and S6B). Moreover, similar
rescue was observed by transducing E4F1KO transformed cells
with retroviruses expressing GFP-CHK1 (Figure S6C). The
protective effect of CHK1 was detected up to 2 weeks after
Cre-mediated inactivation of E4F1 (Figure S6C). Noteworthy,
similar CHK1 re-expression in primary MEFs did not rescue their
capacity to proliferate (data not shown), likely because these
ivation of E4F1. Oxiproteome (red) and total proteome (green) of E4F1WT (CTL)
and total proteins (green spots) were labeled with CyDye hydrazide and CyDye
is. White arrows indicate protein spots increasingly oxidized (at least 2-fold,
onylated upon E4F1 inactivation, as revealed in (A), is given.
d 5 days after Cre treatment of E4F1�/f (E4F1KO) and E4F1+/f (CTL), primary or
ells with Tail moment of the fourth class (as defined in Figure S4B). (See also
on extracts from E4F1WT and E4F1KO transformed MEFs.
Cell Reports 11, 220–233, April 14, 2015 ª2015 The Authors 227

AB
C
D
F
E
Figure 5. E4F1 Directly Controls Chek1 Gene Expression with Impact on the CHK1-Dependent DNA Damage Response
(A) E4F1 is bound to the promoter region of the Chek1 gene, but not of the Chek2 gene. E4F1 ChIP-seq read densities at the Chek1 and Chek2 genes in
p53KO;HaRasV12 transformed MEFs are shown.
(B) Chek1 mRNA level is downregulated in E4F1KO cells. Chek2 and Chek1 transcripts were measured by qRT-PCR 3 days after Cre-mediated E4F1 inactivation
(E4F1KO) in primary E4F1�/f;p53KO MEFs and in E4F1�/f;p53KO;HaRasV12 transformed MEFs. Cre-treated primary and transformed E4F1+/f cells were used as
controls (CTL). Data represent the mean ± SEM of six experiments.
(legend continued on next page)
228 Cell Reports 11, 220–233, April 14, 2015 ª2015 The Authors

cells contained p53 and were therefore still checkpoint profi-
cient. This result is consistent with our data showing that the
growth arrest of these cells mainly relies on p53 (Figure 1).
Altogether, these experiments indicate that the control of E4F1
on mitochondrial homeostasis and CHK1 expression are both
required for the survival of transformed cells.
DISCUSSION
By combining ChIP-seq and differential transcriptomic analyses
in E4F1KO and E4F1WT MEFs, we show that E4F1 is bound to a
limited set of genes. Characterization of E4F1-binding sites
defined a new DNA motif, present nearby the TSS of these
genes, that is significantly different from the one originally
identified in the viral E4 promoter (Fernandes and Rooney,
1997). The decreased expression of most E4F1 target genes
we identified indicate that E4F1 mainly acts as a transcriptional
activator. These genes define at least two programs involved in
mitochondrial homeostasis and checkpoint.
Surprisingly, one of four E4F1 target genes is coding for mito-
chondrial proteins involved in multiple biological processes,
including components of the protein translocase (Dnajc19), the
OXPHOS respiratory complexes (Ndufs5), the mitochondria
transport machinery (2510003E04Rik/Kbp1), the pyruvate dehy-
drogenase (PDH) complex (Dlat, 4930402E16Rik, and Brp44l),
the cardiolipin synthetic pathway (Taz), an anti-apoptotic com-
plex (Hax-1), and mitochondrial ribosomes (Mrpl15). Although
E4F1 previously was described as a cell-cycle regulator,
these results identify E4F1 as a novel regulator of mitochondrial
homeostasis. The decreased expression of this program in
E4F1KO transformed cells correlates with alterations in several
biological processes that require functional mitochondria,
including ATP production, pyrimidine nucleotide neosynthesis,
and redox homeostasis. We believe these pleiotropic and com-
plexmitochondrial dysfunctions result from the combined deple-
tion of several E4F1 target genes, including Dnajc19 and Taz,
the depletion of which is sufficient to recapitulate the abnormal
level of ROS detected in E4F1KO cells. In addition, recent work
confirms our data showing that DNAJC19 downregulation in-
creases ROS levels (Sinha et al., 2014). Interestingly, mutations
in the coding sequence of several of these E4F1 target genes
(Taz, DNAJC19, Dlat, Brp44l, and Hax1) have been implicated
in monogenic human syndromes characterized by various and
complex mitochondrial dysfunctions (Schlame, 2013; Davey
et al., 2006; Imbard et al., 2011; Bricker et al., 2012; Klein, 2011).
In E4F1KO cells, abnormal ROS levels and nucleotide depletion
results in alterations of multiple cellular macromolecules, accu-
(C) E4F1 acts as a transactivator for the Chek1 promoter. Reporter assay (top) in U
promoter (�846 + 1,110) and increasing amounts of E4F1-GFP or of an E4F1 mu
analysis (bottom) of overexpressed E4F1-GFP proteins is shown.
(D) Immunoblotting shows that CHK1 protein level, but not CHK2 protein level, i
treated as in (B).
(E) Immunocytochemistry shows CHK1 expression in E4F1KO and E4F1WT (CTL)
RERT;E4F1+/f;cdkn2a�/� or RERT;E4F1�/f;cdkn2a�/� fetal liver cells. E4F1was ac
Bar, 1 mm (left) and 300 mm (right).
(F) E4F1KO cells have an altered response to DNA-damaging agents. DNA content
G2/M phases of the cell cycle (bottom), in exponentially growing E4F1KO and E
damaging agent HU and to CHEK1 chemical inhibitors (AZD7762), are shown. (S
mulation of uncompensated oxidative damage in cytoplasmic
and mitochondrial proteins, and extensive DNA damage that
eventually lead to proliferation defects or cell death. Strikingly,
our data clearly indicate that E4F1 also regulates another sub-
program involved in genome surveillance pathways required
to cope with such damages, which includes Chek1, Rad52,
Senp8, BC019943/Tti2, and 2310003H01Rik/Faap100. How
metabolism and cell-cycle control are coordinated remains
poorly understood, but recent data stressed that several onco-
genes or tumor suppressors impinge on both cellular processes
and thereby contribute to the complex rewiring of tumor meta-
bolism. This notion is well illustrated by the p53 pathway, where
both p53 and BMI1, which were initially implicated in cell-cycle
control and cell death, are now recognized as major transcrip-
tional regulators of several metabolic pathways and mitochon-
dria homeostasis (Liu et al., 2009; Maddocks and Vousden,
2011; Jiang et al., 2013). Similarly, E2F/RB,MYC, and OCT1 pro-
tein families recently have been shown to control genes involved
in energy production, redox homeostasis, and anabolic pro-
cesses (Blanchet et al., 2011; Chen and Russo, 2012; Dang,
2011). Like E4F1, they impinge on various metabolic pathways
linked to mitochondrial functions (Chen and Russo, 2012).
It raises important but still poorly explored questions about
the overlapping, complementary functions and coordination of
these metabolic and checkpoint programs.
Our rescue experiments, combined with those reported by
Grote et al. in this same issue (Grote et al., 2015), indicate that
the control exerted by E4F1 on CHK1 kinase occurs at multiple
levels and is central for the survival functions of E4F1 in trans-
formed MEFs and hematopoietic stem cells. Grote et al. show
that E4F1 directly interacts with CHK1 protein and regulates its
stability. In addition, we show that E4F1 is a potent transcrip-
tional activator bound at the Chek1 promoter in actively prolifer-
ating cells. Our data, together with previous reports showing the
role of E2Fs (Carrassa et al., 2003; Yang et al., 2008), p53 (Gotti-
fredi et al., 2001; Kho et al., 2004), NF-kB (Barre and Perkins,
2007), and BCL6 (Ranuncolo et al., 2008) in Chk1 transcription,
suggest that the Chek1 promoter is an important and common
hub for several oncogenic pathways. Since CHK1- and p53-
dependent checkpoints are partially redundant, the upregulation
of CHK1 is usually seen as the way cancer cells compensate
for p53 inactivation and ensure the maintenance of a proficient
checkpoint required for survival (Verlinden et al., 2007; Hoglund
et al., 2011). This notion is the rationale for ongoing therapeutic
strategies targeting pharmacologically CHK1 kinase activity,
together with genotoxic agents, in p53-deficient tumors
(McNeely et al., 2014). We propose that the inactivation of
2OS cells co-transfected with a luciferase reporter construct driven by Chek1
tant deleted from its DNA-binding domain (DDBD-E4F1) is shown. Immunoblot
s downregulated in E4F1KO cells. Total cell extracts were prepared from cells
hystiocytic sarcoma sections developed in the lung of mice transplanted with
cutely inactivated in pre-formed tumors by treating mice with 4-OH tamoxifen.
analyses (PI, top) and quantifications of the Sub-G1 (dying cells), G0/G1, S, and
4F1WT (CTL) cells transformed by p53KO;HaRasV12 and exposed to the DNA-
ee also Figure S5.)
Cell Reports 11, 220–233, April 14, 2015 ª2015 The Authors 229

p53KO+RasV12
A
0
1
2
Cel
lnum
ber,
fold
over
non
trea
ted
cells
+ ASC- ASC
mefs
E4F1KO
F
E4F1 WT cells E4F1 KO
In p53-deficient / Cancer Cells
Growtharrest
E4F1
CHEK1
Energy stressNucleotides lossROS
p53-independentCell death
Extensive DNA & Protein damage
p53
In Normal CellsE4F1
CHEK1
p53Energy stressNucleotides lossROS
Mild DNA & Protein damage Growth
Arrest
CCCCCCC
E4F1
CHEK1 p53
Mitochondriahomeostasis
DNA damage response
S and G2/M Growth arrest
E
Ann
exin
posi
tive
cells
, fol
dch
ange
from
non
infe
cted
cells
GFPpcDNA3
HA-CHK1
00,20,40,60,8
11,21,41,61,8
2 E4F1+/flox E4F1-/flox
++++++++
CRE ++++
p53KO+ RasV12
B
05
1015202530
S p
hase
, %
CTL E4F1KO
+ ASC- ASC
mefs
Amplificationloop
051015202530354045
Ann
exin
V s
tain
ing,
% + Uridine- Uridine
CTL E4F1KO
p53KO+ RasV12
D
C p53KO+ RasV12
0
20
40
60
Ann
exin
Vpo
sitit
ive,
%
80
CTL E4F1KO
+ ASC+ Mito-Tempo
CTL E4F1KO
Figure 6. Mitochondrial ROS and CHK1 Depletion Both Contribute to the Cell Death Induced by E4F1 Inactivation in Transformed Cells
(A) Antioxidant partially restores the growth of E4F1KO cell populations. Proliferation curves of Cre-treated E4F1�/f (E4F1KO) and E4F1+/f (CTL) MEFs or of E4F1�/f;
p53KO;HaRasV12 and E4F1�/f;p53KO;HaRasV12 transformed MEFs were established as in Figure 1A, in the presence or absence of ASC (100 mM). Histograms
represent the ratio of the cell numbers counted with or without ASC 10 days after Cre treatment. Data represent the mean ± SEM of three experiments.
(B) Antioxidant partially restores the capacity of E4F1KO primary MEFs to proliferate. BrdU incorporation was measured in Cre-treated E4F1�/f (E4F1KO)
and E4F1+/f (CTL) MEFs cultured in the presence of ASC (100 mM) 6 days after Cre-mediated inactivation of E4F1. Data represent the mean ± SEM of three
experiments.
(legend continued on next page)
230 Cell Reports 11, 220–233, April 14, 2015 ª2015 The Authors

E4F1 in p53-deficient transformed cells results in multiple
damages originating from mitochondria defects combined with
deficiencies in both CHK1 and p53-dependent checkpoints,
resulting in a deadly cocktail. Of note, the proficiency of the
p53-mediated checkpoint in primary MEFs results in growth
arrest and appears sufficient to limit the expansion of these
damages (Figure 6F).
Our data support the notion that the E4F1-CHK1 regulatory
axis is essential for the survival of p53-deficient cells, including
transformed cells. This also points to a potential involvement
among E4F1, CHK1, and p53, with complex feedback loops.
Indeed, while we and Grote et al. (2015) reveal that E4F1 regu-
lates positively CHK1 expression, previous reports have shown
the following: (1) p53 represses chek1 at the transcriptional
level (Gottifredi et al., 2001; Kho et al., 2004); (2) CHK1 kinase
regulates p53 phosphorylation (Shieh et al., 2000) and the
transcriptional elongation of one of its main targets, p21 (Becker-
man et al., 2009); and (3) E4F1 directly controls p53 transcrip-
tional activities through atypical ubiquitination (Le Cam et al.,
2006).
Further investigations will be required to evaluate whether
the complex connections among E4F1, CHK1, and p53 are
involved in embryonic and epidermal stem cells that require
E4F1 for proper homeostasis (Lacroix et al., 2010; Le Cam
et al., 2004). Noteworthy, Chek1- and E4F1-deficient embryos
die at a very similar developmental stage, i.e., soon after implan-
tation (Le Cam et al., 2004; Liu et al., 2000; Takai et al., 2000).
In conclusion, our data reveal an unexpected role for E4F1 in
coordinating mitochondria homeostasis and genome surveil-
lance checkpoints. The high sensitivity of p53-deficient trans-
formed cells to E4F1 inhibition highlights the potential interest
of exploring new anti-cancer strategies targeting E4F1, or phar-
macologically mimicking the deadly environment of E4F1 KO
cells by combining mitochondria and checkpoint inhibitors.
EXPERIMENTAL PROCEDURES
All experiments were approved by the University of Montpellier’s Ethics Com-
mittee for Animal Welfare.
ROS Detection, Protein Carbonylation, and 2D Map of the
Oxiproteome
Total and mitochondrial ROS levels were measured by flow cytometry on live
cells upon staining with CM-H2DFCDA and MitoSOX probes (Invitrogen), as
described previously (Hatchi et al., 2011). Kinetics of mitochondrial ROS
production shown in Figure 3F are expressed as the fold increase of time-
dependent changes in mean fluorescence intensity of the MitoSOX staining
measured by flow cytometry (FACSCalibur, Becton Dickinson). Detection
and identification of carbonylated proteins (2D Map of the oxiproteome)
(C) Antioxidant partially restores viability in E4F1KO transformed MEFs. E4F1�/f;p5
with or without ASC or Mito-TEMPO, were probed with annexin-V-FITC 7 days af
experiments.
(D) Uridine partially restores viability in E4F1KO transformed MEFs. E4F1�/f;p53KO
or without uridine (50 mg/ml), were probed with annexin-V-FITC 7 days after C
experiments.
(E) Exogenous re-expression of CHK1 partially restores viability in E4F1KO tr
or E4F1�/f;p53KO;HaRasV12 transformed MEFs were co-transfected with pcDNA
for cell death with annexin-V-alexa568. Data represent the mean ± SEM of five e
(F) Schematic representation of E4F1 functions in normal and p53-deficient or c
were performed as previously described (Baraibar et al., 2011) and as detailed
in the Supplemental Experimental Procedures.
Nucleotides Analysis and ATP/AMP Measurements
To determine the concentration of purine and pyrimidine intermediates in
p53KO;E4F1WT;Ha-RasV12 and p53KO;E4F1KO;Ha-RasV12 transformed MEFs
(2 3 107 cells), soluble extracts were prepared and analyzed by gas chroma-
tography-mass spectrometry (GC-MS) and liquid chromatography-tandem
mass spectrometry (LC-MS/MS) platforms (Metabolon) on eight independent
samples for each cell line. ATP and AMP concentrations (Figure 3B)
were measured by high-performance liquid chromatography (HPLC) from
5 3 106 cells lysed in 65% perchloric acid. ATP levels, normalized to total
protein levels, were confirmed on 2 3 104 cells using Cell Titer Glo (Promega)
luminescent assay. See Supplemental Experimental Procedures for addi-
tional detail.
ChIP-qPCR and ChIP-Seq
Detailed protocols and primer sequences used for ChIP, as well as Bio-
informatic tools and parameters used to treat ChIP-seq data and annotate
E4F1-bound regions, are detailed in the Supplemental Experimental
Procedures.
To identify the DNA consensus sequence bound by E4F1, ChIP-seq peak
DNA sequences were retrieved from bed files containing E4F1-bound region
coordinates and analyzed with MEME logo suite (http://meme.nbcr.net/
meme/).
qRT-PCR and Differential Transcriptomic Analyses
To identify genes with expression levels differentially expressed between
E4F1WT and E4F1KO cells, total RNA was recovered using RNeasy Mini kits
(QIAGEN). Of total RNA samples, 1 mg was amplified and Cy3- and Cy5-
labeled using Amino Allyl Message Amp II aRNA amplification kit (Ambion),
hybridized on mouse HD12 plex Nimblegen arrays (135,000 probes/44,170
genes, platform MGX-Montpellier GenomiX, www.mgx.cnrs.fr/), and scanned
on an Innoscan900 scanner (Innopsys). Raw data were normalized by
Loess (Limma Package) and differentially expressed genes identified with
both LIMMA and SAM packages with a false discovery rate (FDR) of 1% or
5%. Expression arrays are accessible at GEO dataset GSE57240.
For validation RT-PCR, total RNAs were isolated in TRIZOL (Invitrogen) and
used to generate cDNAs by SuperScript III reverse transcription (Invitrogen)
in the presence of random hexamers. Primers sequences and amplification
parameters are described in the Supplemental Experimental Procedures.
ACCESSION NUMBERS
The full series of data, including expression arrays and ChIP-seq data, re-
ported in this paper have been deposited in NCBI’s Gene Expression Omnibus
and are available through accession number GEO: GSE57242 (superseries).
SUPPLEMENTAL INFORMATION
Supplemental Information includes Supplemental Experimental Procedures,
six figures, and two tables and can be found with this article online at http://
dx.doi.org/10.1016/j.celrep.2015.03.024.
3KO;HaRasV12 (CTL) and E4F1�/f;p53KO;HaRasV12 transformed MEFs, cultured
ter Cre-mediated inactivation of E4F1. Data represent the mean ± SEM of eight
;HaRasV12 (CTL) and E4F1�/f;p53KO;HaRasV12 transformed MEFs, cultured with
re-mediated inactivation of E4F1. Data represent the mean ± SEM of eight
ansformed MEFs. 24 hr after Cre-treatment, E4F1�/f;p53KO;HaRasV12 (CTL)
3-HaGFP and pcDNA3-HaChek1; 72 hr later, GFP-positive cells were probed
xperiments.
ancer cells is shown. (See also Figure S6.)
Cell Reports 11, 220–233, April 14, 2015 ª2015 The Authors 231

AUTHOR CONTRIBUTIONS
G.R. and O.K. equally contributed to this work as first author. This work is a
joint effort of the C.S. and L.L.C. laboratories at IRCM. G.R., L.L.C., and C.S.
all equally contributed to the experiment design and writing of the paper.
ACKNOWLEDGMENTS
This work was supported by grants from the French Ligue Nationale Contre le
Cancer (LNCC, C.S. Equipe labellisee 2011), from the Agence Nationale pour
la Recherche (ANR SVSE2-YinE4F1Yang2 and MetaboCycle 2 to C.S. and
L.L.C.), and from the Association pour la Recherche contre le Cancer (to
G.R.). Institutional support was provided by the Institut National de la Sante
et de la Recherche Medicale (L.L.C.) and the Centre National de la Recherche
Scientifique (C.S.), and technical support by theMontpellier Rio Imaging (MRI),
Genomics (MGX) and animal facilities. T.H. andM.L. were supported by fellow-
ships from the LNCC, and O.K. and H.D. by fellowships financed on the ANR
grants JCJC-0014-01 and SVSE2-YinE4F1Yang2.
Received: May 22, 2014
Revised: December 19, 2014
Accepted: February 17, 2015
Published: April 2, 2015
REFERENCES
Baraibar, M.A., Hyzewicz, J., Rogowska-Wrzesinska, A., Ladouce, R., Roep-
storff, P., Mouly, V., and Friguet, B. (2011). Oxidative stress-induced proteome
alterations target different cellular pathways in human myoblasts. Free Radic.
Biol. Med. 51, 1522–1532.
Barre, B., and Perkins, N.D. (2007). A cell cycle regulatory network controlling
NF-kappaB subunit activity and function. EMBO J. 26, 4841–4855.
Beckerman, R., Donner, A.J., Mattia, M., Peart, M.J., Manley, J.L., Espinosa,
J.M., and Prives, C. (2009). A role for Chk1 in blocking transcriptional elonga-
tion of p21 RNA during the S-phase checkpoint. Genes Dev. 23, 1364–1377.
Blanchet, E., Annicotte, J.S., Lagarrigue, S., Aguilar, V., Clape, C., Chavey, C.,
Fritz, V., Casas, F., Apparailly, F., Auwerx, J., and Fajas, L. (2011). E2F tran-
scription factor-1 regulates oxidative metabolism. Nat. Cell Biol. 13, 1146–
1152.
Bricker, D.K., Taylor, E.B., Schell, J.C., Orsak, T., Boutron, A., Chen, Y.C., Cox,
J.E., Cardon, C.M., Van Vranken, J.G., Dephoure, N., et al. (2012). Amitochon-
drial pyruvate carrier required for pyruvate uptake in yeast, Drosophila, and
humans. Science 337, 96–100.
Caramel, J., Lacroix, M., Le Cam, L., and Sardet, C. (2011). E4F1 connects the
Bmi1-ARF-p53 pathway to epidermal stem cell-dependent skin homeostasis.
Cell Cycle 10, 866–867.
Carrassa, L., Broggini, M., Vikhanskaya, F., and Damia, G. (2003). Character-
ization of the 5’flanking region of the human Chk1 gene: identification of E2F1
functional sites. Cell Cycle 2, 604–609.
Chagraoui, J., Niessen, S.L., Lessard, J., Girard, S., Coulombe, P., Sauva-
geau, M., Meloche, S., and Sauvageau, G. (2006). E4F1: a novel candidate
factor for mediating BMI1 function in primitive hematopoietic cells. Genes
Dev. 20, 2110–2120.
Chen, J.Q., and Russo, J. (2012). Dysregulation of glucose transport, glycol-
ysis, TCA cycle and glutaminolysis by oncogenes and tumor suppressors in
cancer cells. Biochim. Biophys. Acta 1826, 370–384.
Chen, S., He, Q., and Greenberg, M.L. (2008). Loss of tafazzin in yeast leads to
increased oxidative stress during respiratory growth. Mol. Microbiol. 68, 1061–
1072.
Dang, C.V. (2011). Therapeutic targeting of Myc-reprogrammed cancer cell
metabolism. Cold Spring Harb. Symp. Quant. Biol. 76, 369–374.
Davey, K.M., Parboosingh, J.S., McLeod, D.R., Chan, A., Casey, R., Ferreira,
P., Snyder, F.F., Bridge, P.J., and Bernier, F.P. (2006). Mutation of DNAJC19, a
human homologue of yeast inner mitochondrial membrane co-chaperones,
232 Cell Reports 11, 220–233, April 14, 2015 ª2015 The Authors
causes DCMA syndrome, a novel autosomal recessive Barth syndrome-like
condition. J. Med. Genet. 43, 385–393.
Dudziak, K., Mottalebi, N., Senkel, S., Edghill, E.L., Rosengarten, S., Roose,
M., Bingham, C., Ellard, S., and Ryffel, G.U. (2008). Transcription factor
HNF1beta and novel partners affect nephrogenesis. Kidney Int. 74, 210–217.
Fajas, L., Paul, C., Zugasti, O., Le Cam, L., Polanowska, J., Fabbrizio, E.,
Medema, R., Vignais, M.L., and Sardet, C. (2000). pRB binds to andmodulates
the transrepressing activity of the E1A-regulated transcription factor p120E4F.
Proc. Natl. Acad. Sci. USA 97, 7738–7743.
Fajas, L., Paul, C., Vie, A., Estrach, S., Medema, R., Blanchard, J.M., Sardet,
C., and Vignais, M.L. (2001). Cyclin A is a mediator of p120E4F-dependent
cell cycle arrest in G1. Mol. Cell. Biol. 21, 2956–2966.
Fenton, S.L., Dallol, A., Agathanggelou, A., Hesson, L., Ahmed-Choudhury, J.,
Baksh, S., Sardet, C., Dammann, R., Minna, J.D., Downward, J., et al. (2004).
Identification of the E1A-regulated transcription factor p120 E4F as an inter-
acting partner of the RASSF1A candidate tumor suppressor gene. Cancer
Res. 64, 102–107.
Fernandes, E.R., and Rooney, R.J. (1997). The adenovirus E1A-regulated
transcription factor E4F is generated from the human homolog of nuclear
factor phiAP3. Mol. Cell. Biol. 17, 1890–1903.
Gottifredi, V., Karni-Schmidt, O., Shieh, S.S., and Prives, C. (2001). p53 down-
regulates CHK1 through p21 and the retinoblastoma protein. Mol. Cell. Biol.
21, 1066–1076.
Grote, D., Moison, C., Duhamel, S., Chagraoui, J., Girard, S., Yang, J.,
Mayotte, N., Coulombe, Y., Masson, J.-Y., Brown, G.W., et al. (2015). E4F1
is a master regulator of CHK1-mediated functions. Cell Rep., Published online
April 2, 2015 http://dx.doi.org/10.1016/j.celrep.2015.03.019.
Hatchi, E., Rodier, G., Lacroix, M., Caramel, J., Kirsh, O., Jacquet, C., Schrep-
fer, E., Lagarrigue, S., Linares, L.K., Lledo, G., et al. (2011). E4F1 deficiency
results in oxidative stress-mediated cell death of leukemic cells. J. Exp.
Med. 208, 1403–1417.
Hoglund, A., Nilsson, L.M., Muralidharan, S.V., Hasvold, L.A., Merta, P.,
Rudelius, M., Nikolova, V., Keller, U., and Nilsson, J.A. (2011). Therapeutic
implications for the induced levels of Chk1 in Myc-expressing cancer cells.
Clin. Cancer Res. 17, 7067–7079.
Imbard, A., Boutron, A., Vequaud, C., Zater, M., de Lonlay, P., de Baulny, H.O.,
Barnerias, C., Mine, M., Marsac, C., Saudubray, J.M., and Brivet, M. (2011).
Molecular characterization of 82 patients with pyruvate dehydrogenase
complex deficiency. Structural implications of novel amino acid substitutions
in E1 protein. Mol. Genet. Metab. 104, 507–516.
Jiang, P., Du,W., and Yang, X. (2013). p53 and regulation of tumormetabolism.
J. Carcinog. 12, 21.
Kho, P.S., Wang, Z., Zhuang, L., Li, Y., Chew, J.L., Ng, H.H., Liu, E.T., and Yu,
Q. (2004). p53-regulated transcriptional program associated with genotoxic
stress-induced apoptosis. J. Biol. Chem. 279, 21183–21192.
Klein, C. (2011). Genetic defects in severe congenital neutropenia: emerging
insights into life and death of human neutrophil granulocytes. Annu. Rev. Im-
munol. 29, 399–413.
Lacroix, M., Caramel, J., Goguet-Rubio, P., Linares, L.K., Estrach, S., Hatchi,
E., Rodier, G., Lledo, G., de Bettignies, C., Thepot, A., et al. (2010). Transcrip-
tion factor E4F1 is essential for epidermal stem cell maintenance and skin
homeostasis. Proc. Natl. Acad. Sci. USA 107, 21076–21081.
Le Cam, L., Lacroix, M., Ciemerych, M.A., Sardet, C., and Sicinski, P. (2004).
The E4F protein is required for mitotic progression during embryonic cell
cycles. Mol. Cell. Biol. 24, 6467–6475.
Le Cam, L., Linares, L.K., Paul, C., Julien, E., Lacroix, M., Hatchi, E., Triboulet,
R., Bossis, G., Shmueli, A., Rodriguez, M.S., et al. (2006). E4F1 is an atypical
ubiquitin ligase that modulates p53 effector functions independently of
degradation. Cell 127, 775–788.
Lee, K.A., and Green, M.R. (1987). A cellular transcription factor E4F1 interacts
with an E1a-inducible enhancer and mediates constitutive enhancer function
in vitro. EMBO J. 6, 1345–1353.

Liu, Q., Guntuku, S., Cui, X.S., Matsuoka, S., Cortez, D., Tamai, K., Luo, G.,
Carattini-Rivera, S., DeMayo, F., Bradley, A., et al. (2000). Chk1 is an essential
kinase that is regulated by Atr and required for theG(2)/M DNA damage check-
point. Genes Dev. 14, 1448–1459.
Liu, J., Cao, L., Chen, J., Song, S., Lee, I.H., Quijano, C., Liu, H., Keyvanfar, K.,
Chen, H., Cao, L.Y., et al. (2009). Bmi1 regulates mitochondrial function and
the DNA damage response pathway. Nature 459, 387–392.
Maddocks, O.D., and Vousden, K.H. (2011). Metabolic regulation by p53.
J. Mol. Med. 89, 237–245.
McNeely, S., Beckmann, R., and Bence Lin, A.K. (2014). CHEK again: revisiting
the development of CHK1 inhibitors for cancer therapy. Pharmacol. Ther. 142,
1–10.
Mokranjac, D., Bourenkov, G., Hell, K., Neupert, W., and Groll, M. (2006).
Structure and function of Tim14 and Tim16, the J and J-like components of
the mitochondrial protein import motor. EMBO J. 25, 4675–4685.
Nojima, J., Kanomata, K., Takada, Y., Fukuda, T., Kokabu, S., Ohte, S., Ta-
kada, T., Tsukui, T., Yamamoto, T.S., Sasanuma, H., et al. (2010). Dual roles
of smad proteins in the conversion from myoblasts to osteoblastic cells by
bone morphogenetic proteins. J. Biol. Chem. 285, 15577–15586.
Paul, C., Lacroix, M., Iankova, I., Julien, E., Schafer, B.W., Labalette, C., Wei,
Y., Le Cam, A., Le Cam, L., and Sardet, C. (2006). The LIM-only protein FHL2 is
a negative regulator of E4F1. Oncogene 25, 5475–5484.
Ranuncolo, S.M., Polo, J.M., and Melnick, A. (2008). BCL6 represses CHEK1
and suppresses DNA damage pathways in normal and malignant B-cells.
Blood Cells Mol. Dis. 41, 95–99.
Rizos, H., Diefenbach, E., Badhwar, P., Woodruff, S., Becker, T.M., Rooney,
R.J., and Kefford, R.F. (2003). Association of p14ARF with the p120E4F
transcriptional repressor enhances cell cycle inhibition. J. Biol. Chem. 278,
4981–4989.
Ro, H., and Dawid, I.B. (2011). Modulation of Tcf3 repressor complex compo-
sition regulates cdx4 expression in zebrafish. EMBO J. 30, 2894–2907.
Schlame, M. (2013). Cardiolipin remodeling and the function of tafazzin. Bio-
chim. Biophys. Acta 1831, 582–588.
Shieh, S.Y., Ahn, J., Tamai, K., Taya, Y., and Prives, C. (2000). The human
homologs of checkpoint kinases Chk1 and Cds1 (Chk2) phosphorylate p53
at multiple DNA damage-inducible sites. Genes Dev. 14, 289–300.
Silver, D.P., and Livingston, D.M. (2001). Self-excising retroviral vectors en-
coding the Cre recombinase overcome Cre-mediated cellular toxicity. Mol.
Cell 8, 233–243.
Sinha, D., Srivastava, S., Krishna, L., and D’Silva, P. (2014). Unraveling the
intricate organization of mammalian mitochondrial presequence translocases:
existence of multiple translocases for maintenance of mitochondrial function.
Mol. Cell. Biol. 34, 1757–1775.
Takai, H., Tominaga, K., Motoyama, N., Minamishima, Y.A., Nagahama, H.,
Tsukiyama, T., Ikeda, K., Nakayama, K., Nakanishi, M., and Nakayama, K.
(2000). Aberrant cell cycle checkpoint function and early embryonic death in
Chk1(-/-) mice. Genes Dev. 14, 1439–1447.
Taylor, W.R., Agarwal, M.L., Agarwal, A., Stacey, D.W., and Stark, G.R. (1999).
p53 inhibits entry into mitosis when DNA synthesis is blocked. Oncogene 18,
283–295.
Tessari, M.A., Gostissa, M., Altamura, S., Sgarra, R., Rustighi, A., Salvagno,
C., Caretti, G., Imbriano, C., Mantovani, R., Del Sal, G., et al. (2003). Transcrip-
tional activation of the cyclin A gene by the architectural transcription factor
HMGA2. Mol. Cell. Biol. 23, 9104–9116.
Verlinden, L., Vanden Bempt, I., Eelen, G., Drijkoningen, M., Verlinden, I.,
Marchal, K., De Wolf-Peeters, C., Christiaens, M.R., Michiels, L., Bouillon,
R., and Verstuyf, A. (2007). The E2F-regulated gene Chk1 is highly expressed
in triple-negative estrogen receptor/progesterone receptor/HER-2 breast
carcinomas. Cancer Res. 67, 6574–6581.
Yang, S.Z., Lin, F.T., and Lin, W.C. (2008). MCPH1/BRIT1 cooperates with
E2F1 in the activation of checkpoint, DNA repair and apoptosis. EMBO Rep.
9, 907–915.
Cell Reports 11, 220–233, April 14, 2015 ª2015 The Authors 233