the trading week wheat - admgrain.com.au snapshots/feb 18... · mixed bag for barley barley has...
TRANSCRIPT

WHEAT
Increased volatilityfor wheat prices
Wheat prices have shown a surge in volatility since the start of the year, partly due to increased volatility in global stock, bond and currency markets that have followed corrective patterns. The AUD/USD has seen a 3.5 cent range, trading from a low .7781 to a high of .8135 over the first 50 days of the year.
The US market remains under the influence of the Fund open positions and weather. Drought conditions in the US Southern Plains (HRW) have remained largely unchanged, while
south-eastern US (SRW) reported some precipitation, partially alleviating drought conditions. Speculative Fund positions continue to decrease their short position in CBOT Wheat, which currently stands at -16,435 contracts (was close to -100, 000 at the start of the year), while Kansas City (KC) wheat sees the net fund long position at +35,380 contracts. CBOT wheat futures have traded from a low of 413c/bu mid Jan 18, making a recent high of 467c/bu last week.
Black Sea feed wheat grades still remain competitive into South East Asia, which has caused some displacement of lower Australian grades. However, difficult Russian inland logistics and big line-ups have started to underpin
23 FEBRUARY 2018
MARKET SNAPSHOT
* Prices are indicative and subject to change.
Market Last Trade
7 Day Move
CBOT Wheat ($USc/bu)
450.75 10.5
CBOT Corn ($USc/bu)
366.75 1.5
CBOT Beans ($USc/bu)
1031.5 7.5
Winnipeg Canola ($CAN/Mt)
510.70 9.5
Matif Canola (€/Mt)
353.5 4
AU$ / US$ 0.7841 0.0064
AU$ / EUR 0.636 0.0012
THE TRADING WEEK
AT A GLANCE 17/18 ADM PORT PRICES
APW1 FMG F1 Non GM Canola
Sorghum
Brisbane 320 310Newcastle 300 280 540 310Pt Kembla 290 270 525Geelong 265 260 498Pt Adelaide 245 255 480Kwinana (Port Inc) 270 280 530
For latest prices, contracting grainand administration, call ADM Direct
1300 123 ADM(1300 123 236)
2/1/18
6/1/18
10/1/
1814
/1/18
18/1/
1822
/1/18
26/1/
1830
/1/18
3/2/18
7/2/18
11/2/
1815
/2/18
19/2/
18
290
270
250
230
210
190
170
0.82
0.81
0.8
0.79
0.78
0.77
0.76
APW1 AUD APW1 USD F1 AUD F1 USD AUD
Kwinana Port Values – AUD vs USD
S/to
nne
USD/
AUD
near-term local pricing in that origin, with old crop now trading at a premium to new crop.
Locally, grower liquidity remains light, with the balance of tonnes held by those that are cash flow positive. Selling ideas are that of scale up pricing, otherwise they are happy sitting on the sidelines.
Domestic trade remains that of covering recent sales and/or swapping out of grades/Port zones that aren’t required, with the primary aim of covering
shipping slot commitments.
South East Asian consumers remain just-in-time buyers, with bid ideas USD5-7 below trade replacement levels. The local domestic consumer also remains a just-in-time buyer, with east coast feed homes in Southern Queensland continuing to underpin local, flat price levels. The current southern drawing arc to the Darling Downs is pencilled just below Parkes in the Pt Kembla port zone.
F1/APW1 AUD prices sourced from www.profarmergrain.com.au

MARKET SNAPSHOTPAGE 2
Mixed bag for barley
Barley has been on an interesting journey post-harvest and the recent Saudi feed barley tender result will add to the intrigue.
From a malt feed production ratio, 17/18 harvest results were mixed and subsequently had direct impact on local market moves. WA received about 35% malt and SA, Victoria/Southern NSW sub 20%. As a result, malt spreads for mainstream varieties were elevated on the back of domestic demand primarily, as export
customers were reluctant to digest the malt premium.
Early February saw local feed barley prices firm, as China looked to switch out of US sorghum. While feed rallied, malt prices remained steadfast, narrowing the spread.
Coupled with a constant grower sales program, the Australian barley SnD from WA to the east coast remains extremely tight, hence it is difficult to see the market softening a great deal in the short term. It’s equally unlikely for a new wave of
export selling from Australia to commence.
At the time of writing, Saudi Arabia had just announced results of their 960,000mt tender. While it appears to have traded some USD$20/mt under local export prices, again it places a floor under the market and tightens the global SnD a notch more. This is highlighted by the page 1 chart, showing the spread between F1 and APW1 values has narrowed on both an AUD and USD basis over the past six weeks.
BARLEY
Foodbank are still short of their target and you can support by
donating grain to NGR 133 193 95.
HELP US SUPPORT LOCAL RURAL COMMUNITIES DOING IT TOUGH
CLICK HERE TO FIND OUT HOW YOU CAN HELP

MARKET SNAPSHOT
CANOLA
Up, down trend for canola
Canola futures (Winnipeg and Matif) continue to be pushed and pulled by their corresponding by-products in oil and meal. In the US, the price of soy oil continues to decline, down around 7% since the beginning of 2018, while soymeal has appreciated 17% in a rally starting early January.
Over in Europe, the old/new crop inverse has softened, however remains prevalent until the back end of 2018, when it reverts to a carry market.
Global canola production for the year was again quite high, as Canada produced a record harvest of 21.3 mln mt, Europe 22.1 mln mt, Ukraine 2.2 mln mt (also record high) and Australia at 3.7 mln mt. Given the large productions of each country and relatively consistent/stable demand, we expect a substantial carryout of more than 2 mln mt each in EU and Canada, and around 700,000 mt in Australia. If this carryout remains high, ie, we do not find new demand, then look for the carry to widen out to the end of 2018 and into 2019.
PAGE 3
The glut of canola worldwide will naturally have some effect on prices, particularly in Australia, as we produce more than is required domestically. We have seen prices fall some A$40 per mt over the last two months, before stabilising and then recovering around a quarter of this more recently. This recent price recovery can be credited to the exporters need to cover upcoming vessels.As a guide to the biggest demand point for canola seed (Europe will crush 24 mln mt annually), the below chart represents the crushing pace in Europe of rapeseed (canola), soy and sunflower seed over the past four years as published by Oil World.
We can see after a slower than usual start in canola/rapeseed, crush began to pick up toward the end of 2017, owing to favourable margins. One to watch going forward will be the importation of cheap Argentinean SME (soy methyl ester) to Europe, as this is likely to slow crush down or cause crush plants to switch products.
July
Aug Sept
Oct
Nov Dec Jan
FebMarc
h
April
May
June
Oil World EU Crush Estimate
3000
2500
2000
1500
1000
500
0
in 1
,000
t
Rapeseed 2014/15
Rapeseed 2015/16
Rapeseed 2016/17
Rapeseed 2017/18
Soy 2014/15
Soy 2015/16
Soy 2016/17
Soy 2017/18
Sun 2014/15
Sun 2015/16
Sun 2016/17
Sun 2017/18
Source: Oil World Weekly.
SORGHUM
www.admgrain.com.au
For latest prices, contracting grainand administration, call ADM Direct
CENTRAL QUEENSLAND & SOUTHERN
NEW SOUTH WALES Michael Vaughan | 0427 308 317
SOUTHERN QUEENSLAND & NORTHERN
NEW SOUTH WALESPeter Dorney | 0428 214 986
VICTORIAPeter Sidley | 0427 517 417
SOUTH AUSTRALIAKimberley Hoepner | 0407 180 526
WESTERN AUSTRALIATom Mayfield | 0459 152 840
1300 123 ADM(1300 123 236)
Follow us on Twitter @ADMAustralia
MARKET SNAPSHOT
on Chinese anti-dumping retaliation on US sorghum (our main competitor), the market has touched A$300/mt onto the Darling Downs. The US is still to execute on many contracts; therefore, while exports are expected to be higher than last year, the degree will largely be reflective of China’s ability to ration stocks.
Strong rally for sorghum
The current market has rallied significantly since early January, when Sorghum Delivered into the Darling Downs was worth only $A260/mt. The January stretch of long and hot dry weather, which resulted in traders pulling back production estimates, saw prices onto the Downs rally into the 280s. Combined with recent speculation
PAGE 4
India cloud over pulses
The pulse complex continues to be dominated by the negative influence of Indian import duties.
All major exports have felt the wrath, as global supplies of all major pulses have increased in 2016-17, as well as Indian port stocks in 2017. Sub-continent production (to be harvested in
PULSES
Aussie lentils and chickpeas continue to be supported by Pakistan and Bangladesh, however, most of the demand is focused on pre-Ramadan supplies
March/April 2018) appears adequate for demand.
Aussie lentils and chickpeas continue to be supported by Pakistan and Bangladesh, however, most of the demand is focused on pre-Ramadan supplies due to fall in May 2018 (earlier this year than previous years). Once the Ramadan demand is filled, expect for export demand to be very thin.
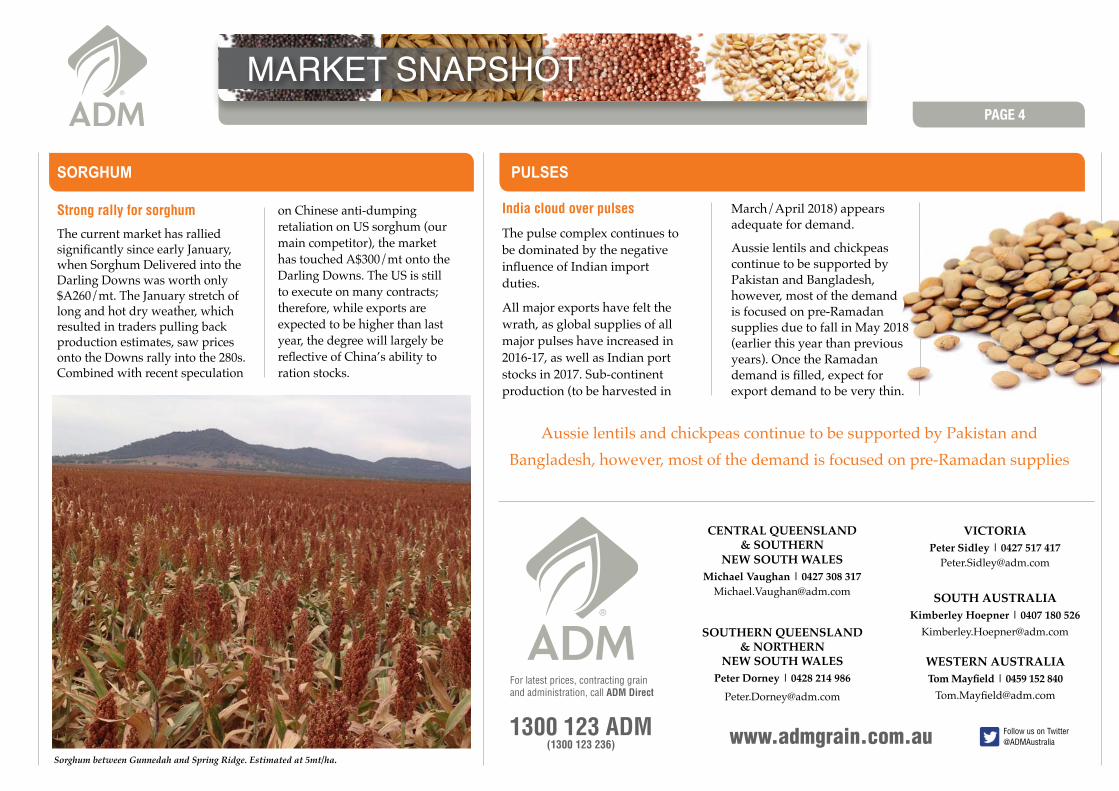
Sorghum between Gunnedah and Spring Ridge. Estimated at 5mt/ha.