the total economic impact™ of plex smart manufacturing
TRANSCRIPT

A FORRESTER TOTAL ECONOMIC IMPACT™ STUDY COMMISSIONED BY PLEX
The Total Economic Impact™ Of Plex Smart Manufacturing Platform Cost Savings And Business Benefits Enabled By The Plex Smart Manufacturing Platform MAY 2021

THE TOTAL ECONOMIC IMPACT™ OF PLEX SMART MANUFACTURING PLATFORM
Table Of Contents
Executive Summary ................................................. 1
The Plex Smart Manufacturing Platform Customer Journey ..................................................................... 6
Interviewed Organization........................................ 6
Key Challenges ...................................................... 6
Use Case Description ............................................. 6
Analysis Of Benefits ................................................ 8
Lower Cost Of IT Administration Via Plex .............. 8
Cost Savings Of Paperless Manufacturing Process ................................................................................ 9
Saved FTEs Create Transaction Reports ............ 10
Reduced Inventory Waste Via Improved Production Processes ............................................................. 11
Cost Savings From Lower Chargebacks Due To Late Production .................................................... 12
Unquantified Benefits ........................................... 13
Flexibility ............................................................... 13
Analysis Of Costs .................................................. 14
Plex Subscription Cost ......................................... 14
Plex Implementation Cost .................................... 15
Financial Summary ................................................ 17
Appendix A: Total Economic Impact ................... 18
Appendix A: Endnotes .......................................... 19
Consulting Team: Greg Phillips
ABOUT FORRESTER CONSULTING
Forrester Consulting provides independent and objective research-based consulting to help leaders succeed in their
organizations. For more information, visit forrester.com/consulting.
© Forrester Research, Inc. All rights reserved. Unauthorized reproduction is strictly prohibited. Information is based on
the best available resources. Opinions reflect judgment at the time and are subject to change. Forrester®, Technographics®,
Forrester Wave, RoleView, TechRadar, and Total Economic Impact are trademarks of Forrester Research, Inc. All other
trademarks are the property of their respective companies.

THE TOTAL ECONOMIC IMPACT™ OF PLEX SMART MANUFACTURING PLATFORM 1
Executive Summary
With its cloud-based Smart Manufacturing Platform, Plex transforms manufacturers’
understanding of their production processes and how to improve them. The product journey
is captured on a transactional basis, permitting an in-depth analysis of the machine, people,
and time that resources have utilized. The Plex Smart Manufacturing Platform puts
warehousing, manufacturing, maintenance, and customer service on the same team in
optimizing inventory management, production, and customer success.
Plex Systems commissioned Forrester Consulting to
conduct a Total Economic Impact™ (TEI) study and
examine the potential return on investment (ROI)
enterprises may realize by deploying the Plex Smart
Manufacturing Platform.1 The Plex Smart
Manufacturing Platform includes applications for
manufacturing execution system (MES), enterprise
resource planning (ERP), quality, supply chain
planning, the industrial internet of things, and
analytics. The purpose of this study is to provide
readers with a framework to evaluate the potential
financial impact of Plex on their organizations. Plex
digitally transforms the operation and management of
the manufacturing process in a cloud-based
environment that highly integrates the organization to
fully account for the transformation of raw material to
the finished product.
To better understand the benefits, costs, and risks
associated with this investment, Forrester interviewed
an organization with experience using Plex. Forrester
used this experience to project a three-year financial
analysis.
Prior to using Plex, the customer had a highly
customized and antiquated on-premises material
requirements planning (MRP) platform. The basic
account of raw material input to the finished product
output was known for both ends of the manufacturing
process; however, significant effort was required to
both record the transformation and to operationalize
any efficiencies on the shop floor. The customer did
not have a robust forecast ability to plan for future
raw material needs around anticipated demand,
creating costs in both inventory and late production.
Even with the efforts to create and manage
transactional data with manual input/manipulation,
the customer had poor visibility into cost, waste,
opportunities for operational improvement, and more
timely and accurate decision-making. As such, the
customer faced expenses and challenges in its older
solution and manufacturing operation that affected its
overall competitiveness.
After the investment in Plex, the customer was able
to reduce or eliminate costs from IT, data/analysis,
production waste, and late performance, which freed
cash flow, permitted new investment, and ultimately
lowered its production cost basis by 50%.
KEY FINDINGS
Quantified benefits. Risk-adjusted present value
(PV) quantified benefits include:
Return on investment (ROI)
412%
Net present value (NPV)
$4.25M
KEY STATISTICS

THE TOTAL ECONOMIC IMPACT™ OF PLEX SMART MANUFACTURING PLATFORM 2
EXECUTIVE SUMMARY
• Lower cost of IT administration via Plex. As a
multitenant, cloud-based, and managed solution,
Plex shifts administrative roles out of on-
premises server support, backups, and desktop
management while ensuring a contractually
guaranteed 99.9% uptime. This was cited as
saving two IT administration FTEs, which were
redirected into analytical needs, and transforming
the IT role into more of an active and more highly
valued business analyst function. Over three
years, lower IT administration costs were worth
approximately $412,000 to the organization.
• Cost savings of paperless manufacturing
process. The production process proceeds
through a full paperless quality system.
Operators and managers conduct their various
quality checks from an electronic standpoint,
rather than having production assistants track by
clipboard and paper; this also minimizes manual
data input. This innovation redirected the work of
two staff FTEs and saved $223,000.
• Saved FTEs to create transaction reports. The
electronic data acquisition afforded by Plex has
also transformed the function of the existing
business analyst group. Rather than spending
time on data input and spreadsheet manipulation,
the seven analyst FTEs were redirected to spend
time on more valuable analytical tasks that: 1)
improved operations and 2) created accurate
production cost models. The cost models have
been instrumental in helping expand business
development. This FTE savings was worth
$1,058,000.
• Reduced inventory waste via improved
production processes. Plex allocates a precise
amount of stock to production output and
monitors each step in batch production and
labeling. This is fundamental to catching
errors/manufacturing variances both at the outset
of production and during production processes to
fix mistakes and avoid wasting inventory and
material. This eliminated the 10% inventory
waste factor that was experienced prior to the
implementation of Plex. Eliminating inventory
waste saved $2,535,000 over the three-year
period.
• Cost savings from lower chargebacks due to
late production. The sequencing of customer
production runs, including the planning and
shipping of inventory was organized through
Plex, resulting in 99% on-time rates. By
dramatically reducing the chargebacks received
for late production, $1,057,000 in costs were
saved prior to the implementation.
“Plex has eliminated the silos of warehousing, manufacturing, maintenance and customer service. With total visibility for everyone in the operation, it makes our goals crystal clear, because the timing and interdependencies of inventory, production, [and] maintenance to customer success are right there. And we’ve been amazingly successful since Plex.”
VP of IT and ERP, food manufacturer
“The old system was limited. There was no transactional data on the actual manufacturing piece, no visibility to forecast what we needed or fix where we were inefficient. Now we have a strong handle on how to model our costs and win new business.” VP of IT and ERP, food manufacturer

THE TOTAL ECONOMIC IMPACT™ OF PLEX SMART MANUFACTURING PLATFORM 3
EXECUTIVE SUMMARY
Unquantified benefits. Benefits that are not
quantified for this study include:
• Lean inventories. The implementation of Plex
DemandCaster Supply Chain Planning — to drive
order lead time, production schedules, and batch
lot allocation of inventory — permitted the
customer to reduce its inventory allocation by
50% or $13 million. This freed operating cash
and reduced debt, which was not quantified as a
benefit in the economic model, but it was
nonetheless significantly positive for the pre-cash
flow to be invested in plant improvements and
potential acquisitions.
• Organize and scale across different plants.
The forecast capability of DemandCaster allowed
the customer to not only order inventory for
different plants as one entity but to also apportion
production to different plants as the shipment
point. As such, the customer benefited from not
having to order and manage inventory at
separate sites, allowing it to realize economies of
scale from ordering in larger quantities. This was
also cited as making integration of future
acquisitions easier.
• Accurate cost models help expand profitable
business. A newfound understanding of the cost
basis to production permitted the creation of
accurate cost models for an array of different
products where the organization had less
experience; this facilitated new business wins
among large retailers.
• Break down silos across warehousing,
manufacturing, maintenance, and customer
service. New standard operating procedures
(SOPs) were created and implemented as part of
training done across departments. Additionally,
the improved visibility of the manufacturing
operation across the organization removed
barriers and showcased the interdependency of
these roles in efficient and on-time product
delivery.
Costs. Risk-adjusted PV costs include:
• Subscription cost of $675,200 over a three-
year period. The Plex subscription model scales
with the revenue growth that the customer
experiences following implementation. Plex’s
standard pricing includes unlimited users
(including customers and partners), and thus the
number of users is not tied to cost. In this
instance, the customer’s subscription cost rose
50% over the three-year period. Also, following
implementation, there was a 50% decline in the
customer’s manufacturing cost.
• Implementation cost of $357,000 over a three-
year period. These costs included adding
electronic data interchange (EDI) trading
partners, the acquisition of supporting hardware,
and the training and development of SOPs that
utilized the Plex Smart Manufacturing Platform.
The interview and financial analysis found that this
customer experiences benefits of $5.29M over three
years versus costs of $1.03M, adding up to a net
present value (NPV) of $4.25M and an ROI of 412%.
“Plex gave us the ability to help drive product improvement. As a large food manufacturer, that is fundamentally important to our process and was a huge hole with our previous MRP.”
VP of IT and ERP, food manufacturer

THE TOTAL ECONOMIC IMPACT™ OF PLEX SMART MANUFACTURING PLATFORM 4
EXECUTIVE SUMMARY
There was a broad array of measurable benefits
following the implementation of Plex.
Cost savings from the reduction of manufacturing
waste and on-time production represent 68% of
the total benefits.
ROI
412%
BENEFITS PV
$5.29M
NPV
$4.25M PAYBACK
<6 months
$411.8K
$223.8K
$1.1M
$2.5M
$1.1M
Lower cost of IT administration viaPlex
Cost savings of paperlessmanufacturing process
Automatic transaction reports savedFTEs
Reduced inventory waste viaimproved production processes
Cost savings from lowerchargebacks due to late production
Benefits (Three-Year)
THE TOTAL ECONOMIC IMPACT™ OF PLEX SMART MANUFACTURING PLATFORM 5
EXECUTIVE SUMMARY
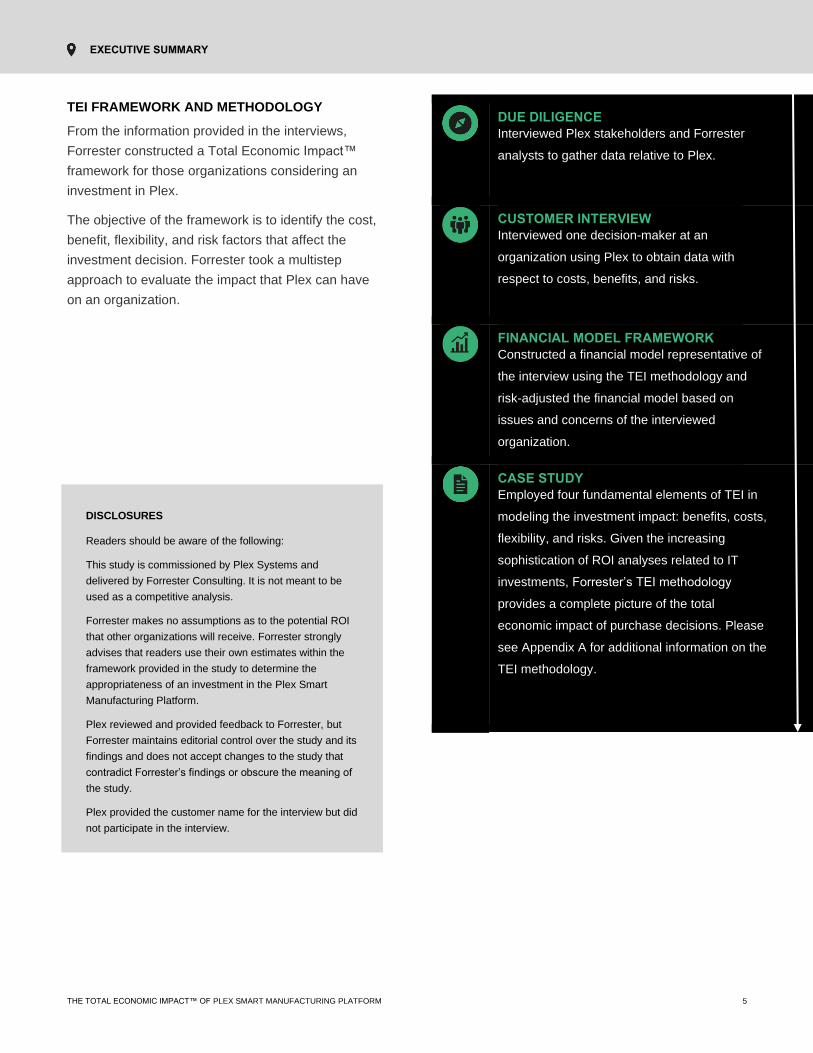
TEI FRAMEWORK AND METHODOLOGY
From the information provided in the interviews,
Forrester constructed a Total Economic Impact™
framework for those organizations considering an
investment in Plex.
The objective of the framework is to identify the cost,
benefit, flexibility, and risk factors that affect the
investment decision. Forrester took a multistep
approach to evaluate the impact that Plex can have
on an organization.
DUE DILIGENCE
Interviewed Plex stakeholders and Forrester
analysts to gather data relative to Plex.
CUSTOMER INTERVIEW
Interviewed one decision-maker at an
organization using Plex to obtain data with
respect to costs, benefits, and risks.
FINANCIAL MODEL FRAMEWORK
Constructed a financial model representative of
the interview using the TEI methodology and
risk-adjusted the financial model based on
issues and concerns of the interviewed
organization.
CASE STUDY
Employed four fundamental elements of TEI in
modeling the investment impact: benefits, costs,
flexibility, and risks. Given the increasing
sophistication of ROI analyses related to IT
investments, Forrester’s TEI methodology
provides a complete picture of the total
economic impact of purchase decisions. Please
see Appendix A for additional information on the
TEI methodology.
DISCLOSURES
Readers should be aware of the following:
This study is commissioned by Plex Systems and
delivered by Forrester Consulting. It is not meant to be
used as a competitive analysis.
Forrester makes no assumptions as to the potential ROI
that other organizations will receive. Forrester strongly
advises that readers use their own estimates within the
framework provided in the study to determine the
appropriateness of an investment in the Plex Smart
Manufacturing Platform.
Plex reviewed and provided feedback to Forrester, but
Forrester maintains editorial control over the study and its
findings and does not accept changes to the study that
contradict Forrester’s findings or obscure the meaning of
the study.
Plex provided the customer name for the interview but did
not participate in the interview.

THE TOTAL ECONOMIC IMPACT™ OF PLEX SMART MANUFACTURING PLATFORM 6
The Plex Smart Manufacturing Platform Customer Journey
Drivers leading to the Smart Manufacturing Platform investment
INTERVIEWED ORGANIZATION
Forrester interviewed a Plex Smart Manufacturing
Platform customer with the following characteristics:
less than $300 million revenue, 450 employees, and
420 Plex users.
The customer organization benefits from their
implementation and use of the cloud-based Plex
Smart Manufacturing Platform, as it harmonizes each
step of the manufacturing process from inventory, to
production runs, to fulfillment. Plex tracks each step
on a transaction basis to account for raw material
inputs, manufacturing outputs, and machinery, time,
and people resources used during production. With
the cloud-based capability that Plex provides, the
customer organization did not have to rely on IT staff
to either build or run the operation. This was
important as the platform expanded through
acquisition.
KEY CHALLENGES
The customer organization had an overall need to
transition to a more modern solution. Their existing
production control system was antiquated, highly
customized, and no longer supportable, which led to
a host of business challenges.
The customer struggled with common challenges,
including:
• Stockpiled inventory to not run out of stock
and miss production deadlines. Balancing lean
inventory and sufficient stock to meet production
requirements, and not tie up unnecessary budget
in a timely manner, was an ongoing challenge.
This was particularly the case as the existing
system did not have a forecast capability.
Projections were developed from a straight-line
sales history to build inventory. With this limited
accuracy, the customer commonly kept too much
inventory on hand to ensure order commitments
and customer retention.
• Poor visibility within the end-to-end
manufacturing process. Without a capability to
readily generate transaction data within the end-
to-end manufacturing process, there was
significant effort required to track the bookends of
raw materials in and finished goods out. This
included line production recording by paper
record and an inability to create useable data. In
all, a significant effort in people resources was
needed to create operational intelligence, but it
did provide timely or widely visible intelligence for
the customer organization.
• A lack of visible production data allowed
manufacturing inefficiencies to run
unchecked. The inability to discern production
errors until later in the process led to wasted
inventory, delays in production, and more
extensive fixes in both machinery and service
delivery. This resulted in customer service
interventions to reorder schedules for pressing
customer need as well as expedited shipping to
help keep orders on time. With limited visibility to
an end-to-end, and holistic view of performance,
the warehousing, manufacturing, maintenance,
and customer service components of the
organization operated in siloes.
USE CASE DESCRIPTION
The customer organization first implemented the Plex
Smart Manufacturing Platform in 2017; it followed up
“The inventory management capabilities brought by Plex have been a huge, huge win for us.” VP of IT and ERP, food manufacturer

THE TOTAL ECONOMIC IMPACT™ OF PLEX SMART MANUFACTURING PLATFORM 7
THE PLEX SMART MANUFACTURING PLATFORM CUSTOMER JOURNEY
with addition of the forecast application, Plex
DemandCaster Supply Chain Planning, in 2019.
The end-to-end implementation took approximately
one year, this included: the development of EDI
trading partners, three months for training, and a one-
month post-live phase for process modification and
assessment. Additionally, the team acquired
hardware (UI screens and printing equipment) and
developed new SOPs, which opened the door for
cross-departmental changes and improvements.
Training on Plex also included sessions and
communication across departments. This, coupled
with the creation of new SOPs indicating how the job
is done, initiated conversations on the process of
manufacturing, change, and improvement across
departments. As Plex provides visibility of the end-to-
end manufacturing process to all users, the
interdependencies between manufacturing,
maintenance, and customer service are finally
showcased. In sum, the training and post-live phase
for Plex implementation served to break down silos
between departments.
Plex’s digital, transactional model enabled the
customer organization to understand the
manufacturing process in granular detail, from
inventory to finished product. This not only identified
and filled in important operational intelligence holes,
but it also allowed technical resources to move to
more valuable analytical tasks.
The addition of DemandCaster allowed the customer
organization to quantify the raw material
requirements for projected production to shipment
timing, to ensure adequate supply and accurate
timelines. By directly apportioning inventory to
manufacturing, the customer organization permitted
analysis of production line efficiency, identified
production errors and machine variances to be fixed
early in the process, and significantly reduced waste.
In many ways, this helped sow the seeds for growth.
With greater operating efficiency, the customer
organization was able to increase production some
250% with largely the same plant size and people
resources. There were significantly reduced costs in
IT management, inventory, and production. Its cost
basis for production also fell 50%.
As the cost basis to production was also now
understood in granular detail, this provided an
understanding of how to price opportunities with
existing and new customers, to win additional
business.
Plex gives us the ability to look at things in a different way to plan for the future and improve
upon it with insights we didn’t have.
– VP of IT and ERP, food manufacturer

THE TOTAL ECONOMIC IMPACT™ OF PLEX SMART MANUFACTURING PLATFORM 8
Analysis Of Benefits
Quantified benefit data
LOWER COST OF IT ADMINISTRATION VIA PLEX
Evidence and data. The on-premises management
cost of backing up servers, network maintenance,
and client computers is removed in a cloud-based
environment.
• The customer organization’s on-premises IT FTE
commitment of 2.5 jobs was reduced to 0.5
following the implementation of Plex.
• The average burdened salary of IT administrator
jobs within this type of setting was cited as being
$92,000.
• The jobs were freed to take on more valuable
analytical roles using outputs and automation
from Plex.
Modeling and assumptions. The FTE savings is
assumed to be stable over the three-year period, as
the overall job totals for the customer did not increase
even as revenue and output expanded.
Risks. The successful implementation of Plex to
replace an on-premises solution demonstrated that
other firms should experience reductions in IT
administration.
To account for a moderate risk of lower reduction
based on firm size, Forrester adjusted this benefit
downward by 10%, yielding a three-year, risk-
adjusted total PV (discounted at 10%) of $411,000.
Total Benefits
Ref. Benefit Year 1 Year 2 Year 3 Total Present Value
Atr Lower cost of IT administration via Plex
$165,600 $165,600 $165,600 $496,800 $411,823
Btr Cost savings of paperless manufacturing process
$90,000 $90,000 $90,000 $270,000 $223,817
Ctr Automatic Transaction Reports Saved FTEs
$425,250 $425,250 $425,250 $1,275,750 $1,057,534
Dtr Reduced inventory waste via improved production processes
$1,020,000 $1,020,000 $1,020,000 $3,060,000 $2,536,589
Etr Cost savings from lower chargebacks due to late production
$425,000 $425,000 $425,000 $1,275,000 $1,056,912
Total benefits (risk-adjusted) $2,125,850 $2,125,850 $2,125,850 $6,377,550 $5,286,675
8%
three-year benefit PV
$411,823
Lower Cost Of IT Administration Via Plex: 8% of benefits

THE TOTAL ECONOMIC IMPACT™ OF PLEX SMART MANUFACTURING PLATFORM 9
ANALYSIS OF BENEFITS
COST SAVINGS OF PAPERLESS
MANUFACTURING PROCESS
Evidence and data. In order to record manufacturing
on the plant floor and track it against inventory and its
utilization for each production run, two assistants
would record the data via paper and clipboard on a
daily basis.
• These production assistant roles were redirected
to other aspects of the manufacturing process
following the implementation of Plex.
• The average burdened salary of production
assistant jobs within this type of setting was cited
as being $50,000.
Modeling and assumptions. The FTE savings is
assumed to be stable over the three-year period, as
the overall job totals for the customer did not gain
even as revenue and output expand.
Risks. The successful implementation of Plex to
record transaction-level data on the production
process meant that other customers that utilize staff
for cycle counts and production data should
experience reductions in production assistant costs
dedicated to this function.
To account for a moderate risk of lower reduction
based on firm size, Forrester adjusted this benefit
downward by 10%, yielding a three-year, risk-
adjusted total PV (discounted at 10%) of $224,000.
Lower Cost Of IT Administration Via Plex
Ref. Metric CalculationSource Year 1 Year 2 Year 3
A1 Reduce IT administrator staff from 2.5 to 0.5 FTEs This project has been off pace every step.
Interview 2 2 2
A2 Averaged burdened salary of IT administrator Payscale.com $92,000 $92,000 $92,000
At Lower cost of IT administration via Plex A1*A2 $184,000 $184,000 $184,000
Risk adjustment ↓10%
Atr Lower cost of IT administration via Plex (risk-adjusted) $165,600 $165,600 $165,600
Three-year total: $496,800 Three-year present value: $411,823
4%
three-year benefit PV
$223,817
Cost Savings Of Paperless Manufacturing Process: 4% of benefits

THE TOTAL ECONOMIC IMPACT™ OF PLEX SMART MANUFACTURING PLATFORM 10
ANALYSIS OF BENEFITS
AUTOMATIC TRANSACTION REPORTS SAVED
FTES
Evidence and data. The task of creating transaction
data and manipulation for the required business and
operational analysis equaled seven FTEs.
• Data acquisition, analysis, and reporting is
automated via Plex. Roles that previously were
responsible for those tasks are now free to create
both higher level analysis of operational
improvement and cost models to develop the
business.
• The averaged burdened salary of the business
analyst in this setting was cited as being $92,000.
Modeling and assumptions. Resourcing needs are
expected to remain stable over the three-year period.
While the business grew, the number of employees
did not.
• The recapture rate for this productivity
enhancement was assumed to be 75%.
Risks. The successful implementation of Plex to
create transaction-level data on production processes
means that other customers that utilize staff to create
transaction reports should experience similar
reductions in these costs, though they may vary
according to the size and function.
To account for these risks, Forrester adjusted this
benefit downward by 10%, yielding a three-year, risk-
adjusted total PV of $1,058,000.
Cost Savings Of Paperless Manufacturing Process
Ref. Metric Source Year 1 Year 2 Year 3
B1 Number of fewer production assistant FTEs for manual recording Interview 2.0 2.0 2.0
B2 Averaged burdened salary of shop floor production assistants Payscale.com $50,000 $50,000 $50,000
Bt Cost savings of paperless manufacturing process B1*B2 $100,000 $100,000 $100,000
Risk adjustment ↓10%
Btr Cost savings of paperless manufacturing process (risk-adjusted) $90,000 $90,000 $90,000
Three-year total: $270,000 Three-year present value: $223,817
20%
three-year benefit PV
$1.1 million
Automatic Transaction Reports Saved FTEs: 20% of benefits

THE TOTAL ECONOMIC IMPACT™ OF PLEX SMART MANUFACTURING PLATFORM 11
ANALYSIS OF BENEFITS
REDUCED INVENTORY WASTE VIA IMPROVED
PRODUCTION PROCESSES
Evidence and data. One significant failure of the
previous solution was the queueing of production
runs without the ability to calibrate SOPs to catch
production errors early from mislabeling, machines
not performing to standard, and without built-in
analytics to identify what processes run best in the
production line.
• These capabilities are all incorporated in Plex,
enabling the customer to save 10% in inventory
waste that was due to previously experienced
production errors.
Modeling and assumptions. This 10% factor is
applied to the customer’s $12,000,000 inventory
carry in order to arrive at the waste reduction
calculation.
• This annual savings was conservatively counted
as the previous inventory level was double in the
previous solution, and inventory carry was kept
constant at $12,000,000 even with the
customer’s business growth.
Risks. Other firms may not have the same use profile
or savings factor.
To account for these risks, Forrester adjusted this
benefit downward by 15%, yielding a three-year, risk-
adjusted total PV of $2,537,000.
Automatic Transaction Reports Saved FTEs
Ref. Metric Source Year 1 Year 2 Year 3
C1 Business analyst FTEs saved Interview 7.0 7.0 7.0
C2 Average burdened salary of business analyst Payscale.com $90,000 $90,000 $90,000
C3 Productivity recapture rate Interview 75% 75% 75%
Ct Automatic transaction reports saved FTEs C1*C2*C3 $472,500 $472,500 $472,500
Risk adjustment ↓10%
Ctr Automatic transaction reports saved FTEs (risk-adjusted) $425,250 $425,250 $425,250
Three-year total: $1,275,750 Three-year present value: $1,057,534
48%
three-year benefit PV
$2.5 million
Reduce Inventory Waste Via Improved Production Process: 48% of benefits

THE TOTAL ECONOMIC IMPACT™ OF PLEX SMART MANUFACTURING PLATFORM 12
ANALYSIS OF BENEFITS
COST SAVINGS FROM LOWER CHARGEBACKS
DUE TO LATE PRODUCTION
Evidence and data. The capability of Plex to align
raw material supply chains, production schedules,
and warehouse cycle times resulted in raising on-
time customer order completion to 99% performance.
• Over a three-year period, this was cited by the
customer as saving $500,000 per year on
average from late delivery, conditions that were
more prevalent under the previous system.
Modeling and assumptions. The modeling
compared late production charges of Plex versus that
of the previous system.
Risks. Not all firms will have the same degree of
supply and production sensitivity affecting on-time
performance.
To account for these risks, Forrester adjusted this
benefit downward by 15%, yielding a three-year, risk-
adjusted total PV of $1,057,000.
Reduced Inventory Waste Via Improved Production Processes
Ref. Metric Source Year 1 Year 2 Year 3
D1 Total inventory cost Interview $12,000,000 $12,000,000 $12,000,000
D2 Cut 10% waste due to production errors Interview 10% 10% 10%
Dt Reduced inventory waste via improved production processes D1*D2 $1,200,000 $1,200,000 $1,200,000
Risk adjustment ↓15%
Dtr Reduced inventory waste via improved production processes (risk-adjusted)
$1,020,000 $1,020,000 $1,020,000
Three-year total: $3,060,000 Three-year present value: $2,536,589
20%
three-year benefit PV
$1.1 million
Cost Savings From Lower Chargebacks Due To Late Production: 8% of benefits

THE TOTAL ECONOMIC IMPACT™ OF PLEX SMART MANUFACTURING PLATFORM 13
ANALYSIS OF BENEFITS
UNQUANTIFIED BENEFITS
Additional benefits that the customer experienced but
was not able to quantify include:
• Lean inventories. The implementation of
DemandCaster to drive order lead time,
production schedules, and batch lot allocation of
inventory permitted the customer organization to
reduce its inventory allocation by 50% or $13
million. This freed operating cash and reduced
debt, which was not quantified as a benefit in the
economic model, but it was nonetheless
significantly positive for the pre-cash flow to be
invested in productivity improvements and
potential acquisitions.
• Organize and scale across different plants.
DemandCaster allowed the customer to not only
order inventory for different plants as one entity
but to also apportion production to different plants
as the shipment point. As such, the customer
organization benefited from not having to order
and manage inventory at separate sites, allowing
it to realize economies of scale from ordering in
larger quantities. This was also cited as making
integration of future acquisitions easier.
• Accurate cost model helps expand profitable
business. A newfound understanding of the cost
basis to production permitted the creation of
accurate cost models or an array of different
products where the organization had less
experience; this facilitated new business wins
among large retailers.
• Break down silos across warehousing,
manufacturing, maintenance, and customer
service. New SOPs were created and
implemented as part of training done across
departments. Additionally, the improved visibility
of the manufacturing operation across the
organization removed barriers and showcased
the interdependency of these roles.
FLEXIBILITY
The value of flexibility is unique to each customer.
There are multiple scenarios in which a customer
might implement Plex and later realize additional
uses and business opportunities, including:
• Connecting manufacturing via IoT and Plex to do
analytics of machine performance, in addition to
system performance to enhance the productivity,
efficiency, and maintenance elements of the
business.
Flexibility would also be quantified when evaluated as
part of a specific project (described in more detail in
Appendix A).
Cost Savings From Lower Chargebacks Due To Late Production
Ref. Metric Source Year 1 Year 2 Year 3
E1 Customer chargebacks before Plex Interview $650,000 $650,000 $650,000
E2 Customer chargebacks following Plex Interview $150,000 $150,000 $150,000
Et Cost savings from lower chargebacks due to late production E1-E2 $500,000 $500,000 $500,000
Risk adjustment ↓15%
Etr Cost savings from lower chargebacks due to late production (risk-adjusted) $425,000 $425,000 $425,000
Three-year total: $1,275,000 Three-year present value: $1,056,912

THE TOTAL ECONOMIC IMPACT™ OF PLEX SMART MANUFACTURING PLATFORM 14
Analysis Of Costs
Quantified cost data
PLEX SUBSCRIPTION COST
Evidence and data. Plex affords an unlimited
number of users to its subscription model. Costs are
pegged to company revenue.
• In this instance, subscription costs began in the
$200,000 range. And with the rise in revenue
experienced by the customer organization, Plex
subscription costs increased 50% over the three-
year period.
Modeling and assumptions. Subscription costs and
history were gathered from the interviewee and
directly loaded into the model.
Risks. While the growth in revenue and subscription
cost was significant for this customer, some
companies could experience faster growth, which
would affect the cost of their Plex Smart
Manufacturing platform, the basis of which is tied to
revenue growth following implementation.
To account for these risks, Forrester adjusted this
cost upward by 10%, yielding a three-year, risk-
adjusted total PV (discounted at 10%) of $675,000.
Total Costs
Ref. Cost Initial Year 1 Year 2 Year 3 Total Present Value
Ftr Plex subscription cost $0 $220,000 $275,000 $330,000 $825,000 $675,207
Gtr Plex implementation cost
$357,500 $0 $0 $0 $357,500 $357,500
Total costs (risk-adjusted)
$357,500 $220,000 $275,000 $330,000 $1,182,500 $1,032,707
Plex subscription
cost, 65%
three-year total
costs PV
$675,207

THE TOTAL ECONOMIC IMPACT™ OF PLEX SMART MANUFACTURING PLATFORM 15
ANALYSIS OF COSTS
PLEX IMPLEMENTATION COST
Evidence and data. The implementation costs for
the customer organization included:
• Implementation of professional services by Plex
and the addition of EDI trading partners.
• Internal training through Plex and an overall “train
the trainer” approach to permeate Plex
knowledge to users throughout the organization.
• The development of updated SOPs.
• The procurement of necessary physical UI
interfaces (monitors) and printers for the system.
Modeling and assumptions. These were Year 1
upfront costs taken directly from the customer
experience in implementing Plex.
Risks. As there is some risk a customer could have
higher costs from longer training cycles and more
expansive EDI trading partner additions, Forrester
has adjusted this cost upward by 10%, yielding a
three-year, risk-adjusted total PV of $357,500.
Plex Subscription Cost
Ref. Metric Source Initial Year 1 Year 2 Year 3
F1 Plex subscription cost Interview $200,000 $250,000 $300,000
Ft Plex subscription cost F1 $0 $200,000 $250,000 $300,000
Risk adjustment ↑10%
Ftr Plex subscription cost (risk-adjusted) $0 $220,000 $275,000 $330,000
Three-year total: $825,000 Three-year present value: $675,207
Plex implementation cost, 35%
three-year total
costs PV
$357,500

THE TOTAL ECONOMIC IMPACT™ OF PLEX SMART MANUFACTURING PLATFORM 16
ANALYSIS OF COSTS
Plex Implementation Cost
Ref. Metric Source Initial Year 1 Year 2 Year 3
G1 Implementation professional services Interview 150,000
G2 Internal training three months Interview 50,000
G3 Updating SOPs Interview 50,000
G4 Procure supporting hardware Interview 75,000
Gt Plex implementation cost G1+G2+G3+G4 $325,000 $0 $0 $0
Risk adjustment ↑10%
Gtr Plex implementation cost (risk-adjusted) $357,500 $0 $0 $0
Three-year total: $357,500 Three-year present value: $357,500

THE TOTAL ECONOMIC IMPACT™ OF PLEX SMART MANUFACTURING PLATFORM 17
Financial Summary
CONSOLIDATED THREE-YEAR RISK-ADJUSTED METRICS
-$1.0 M
$1.0 M
$2.0 M
$3.0 M
$4.0 M
$5.0 M
$6.0 M
Initial Year 1 Year 2 Year 3
Ca
sh
flo
ws
Cash Flow Chart (Risk-Adjusted)
Total costs Total benefits Cumulative net benefits
These risk-adjusted ROI, NPV, and payback period values are determined by applying risk-adjustment factors to the unadjusted results in each Benefit and Cost section.
The financial results calculated in the
Benefits and Costs sections can be
used to determine the ROI, NPV, and
payback period for the composite
organization’s investment. Forrester
assumes a yearly discount rate of 10%
for this analysis.
Cash Flow Analysis (Risk-Adjusted Estimates)
Initial Year 1 Year 2 Year 3 Total Present
Value
Total costs ($357,500) ($220,000) ($275,000) ($330,000) ($1,182,500) ($1,032,707)
Total benefits $0 $2,125,850 $2,125,850 $2,125,850 $6,377,550 $5,286,675
Net benefits ($357,500) $1,905,850 $1,850,850 $1,795,850 $5,195,050 $4,253,968
ROI 412%
Payback period <6 months

THE TOTAL ECONOMIC IMPACT™ OF PLEX SMART MANUFACTURING PLATFORM 18
Appendix A: Total Economic Impact
Total Economic Impact is a methodology developed
by Forrester Research that enhances a company’s
technology decision-making processes and assists
vendors in communicating the value proposition of
their products and services to clients. The TEI
methodology helps companies demonstrate, justify,
and realize the tangible value of IT initiatives to both
senior management and other key business
stakeholders.
TOTAL ECONOMIC IMPACT APPROACH
Benefits represent the value delivered to the
business by the product. The TEI methodology
places equal weight on the measure of benefits and
the measure of costs, allowing for a full examination
of the effect of the technology on the entire
organization.
Costs consider all expenses necessary to deliver the
proposed value, or benefits, of the product. The cost
category within TEI captures incremental costs over
the existing environment for ongoing costs
associated with the solution.
Flexibility represents the strategic value that can be
obtained for some future additional investment
building on top of the initial investment already made.
Having the ability to capture that benefit has a PV
that can be estimated.
Risks measure the uncertainty of benefit and cost
estimates given: 1) the likelihood that estimates will
meet original projections and 2) the likelihood that
estimates will be tracked over time. TEI risk factors
are based on “triangular distribution.”
PRESENT VALUE (PV)
The present or current value of
(discounted) cost and benefit estimates
given at an interest rate (the discount
rate). The PV of costs and benefits feed
into the total NPV of cash flows.
NET PRESENT VALUE (NPV)
The present or current value of
(discounted) future net cash flows given
an interest rate (the discount rate). A
positive project NPV normally indicates
that the investment should be made,
unless other projects have higher NPVs.
RETURN ON INVESTMENT (ROI)
A project’s expected return in percentage
terms. ROI is calculated by dividing net
benefits (benefits less costs) by costs.
DISCOUNT RATE
The interest rate used in cash flow
analysis to take into account the
time value of money. Organizations
typically use discount rates between
8% and 16%.
PAYBACK PERIOD
The breakeven point for an investment.
This is the point in time at which net
benefits (benefits minus costs) equal initial
investment or cost.
The initial investment column contains costs incurred at “time
0” or at the beginning of Year 1 that are not discounted. All
other cash flows are discounted using the discount rate at the
end of the year. PV calculations are calculated for each total
cost and benefit estimate. NPV calculations in the summary
tables are the sum of the initial investment and the
discounted cash flows in each year. Sums and present value
calculations of the Total Benefits, Total Costs, and Cash Flow
tables may not exactly add up, as some rounding may occur.

THE TOTAL ECONOMIC IMPACT™ OF PLEX SMART MANUFACTURING PLATFORM 19
Appendix A: Endnotes
1 Total Economic Impact is a methodology developed by Forrester Research that enhances a company’s
technology decision-making processes and assists vendors in communicating the value proposition of their
products and services to clients. The TEI methodology helps companies demonstrate, justify, and realize the
tangible value of IT initiatives to both senior management and other key business stakeholders.
_____________________

THE TOTAL ECONOMIC IMPACT™ OF PLEX SMART MANUFACTURING PLATFORM 20