the toroidal helicon experiment at ipr -...
TRANSCRIPT
THE TOROIDAL HELICON THE TOROIDAL HELICON EXPERIMENT AT IPREXPERIMENT AT IPR
Supervisor
Prof. Dhiraj BoraD.D.G, ITER
Institute for Plasma Research Gandhinagar, Gujarat (India)
Acknowledgement
Dr. S.K.P.TripathiUCLA
Manash Kumar Paul
MOTIVATIONMOTIVATION
• To explore toroidal counterparts of conventional Helicon modes
• Advanced applications of Helicon waves in toroidal plasma experiments
Ø In terms of an RF source to ionize neutrals, sustain plasma and drive toroidal plasma current
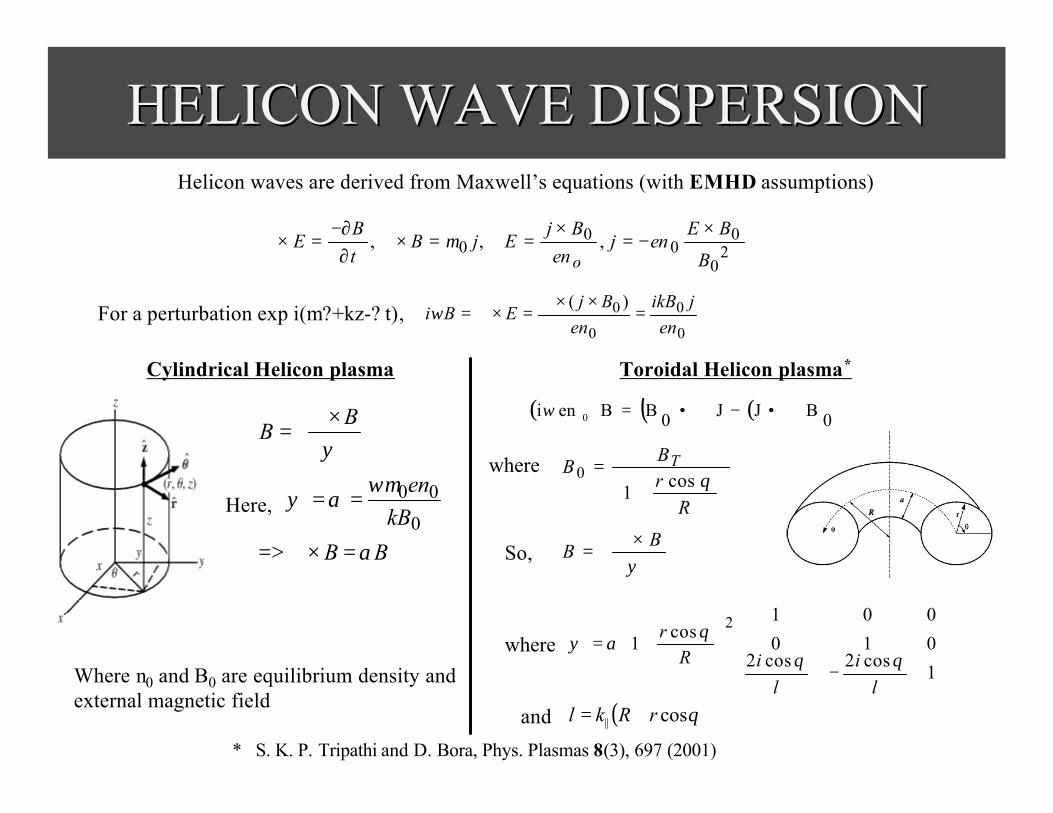
HELICON WAVE DISPERSION HELICON WAVE DISPERSION Helicon waves are derived from Maxwell’s equations (with EMHD assumptions)
20
00
00 ,,,
B
BEenj
enBj
EjBtB
Eo
×−=
×==×∇
∂−∂
=×∇ µ
For a perturbation exp i(m?+kz-? t),0
0
0
0 )(en
jikBen
BjEBi =
××∇=×∇=ω
Where n0 and B0 are equilibrium density and external magnetic field
( ) ( ) ( ) 0BJJ0BBeni 0 ∇•−∇•=ω
Cylindrical Helicon plasma Toroidal Helicon plasma*
BB
kBen
BB
α
ωµαψ
ψ
=×∇=>
==
×∇=
0
00
×∇=
+
=
ψ
θ
BB
RrB
B Tcos
10
−
+=
1cos2cos2
010
001cos
12
li
liR
r
θθ
θαψ
where
So,
where
( )θcos|| rRkl +=and
Here,
* S. K. P. Tripathi and D. Bora, Phys. Plasmas 8(3), 697 (2001)
DIFFERENCE DIFFERENCE -- LINEAR AND TOROIDALLINEAR AND TOROIDAL
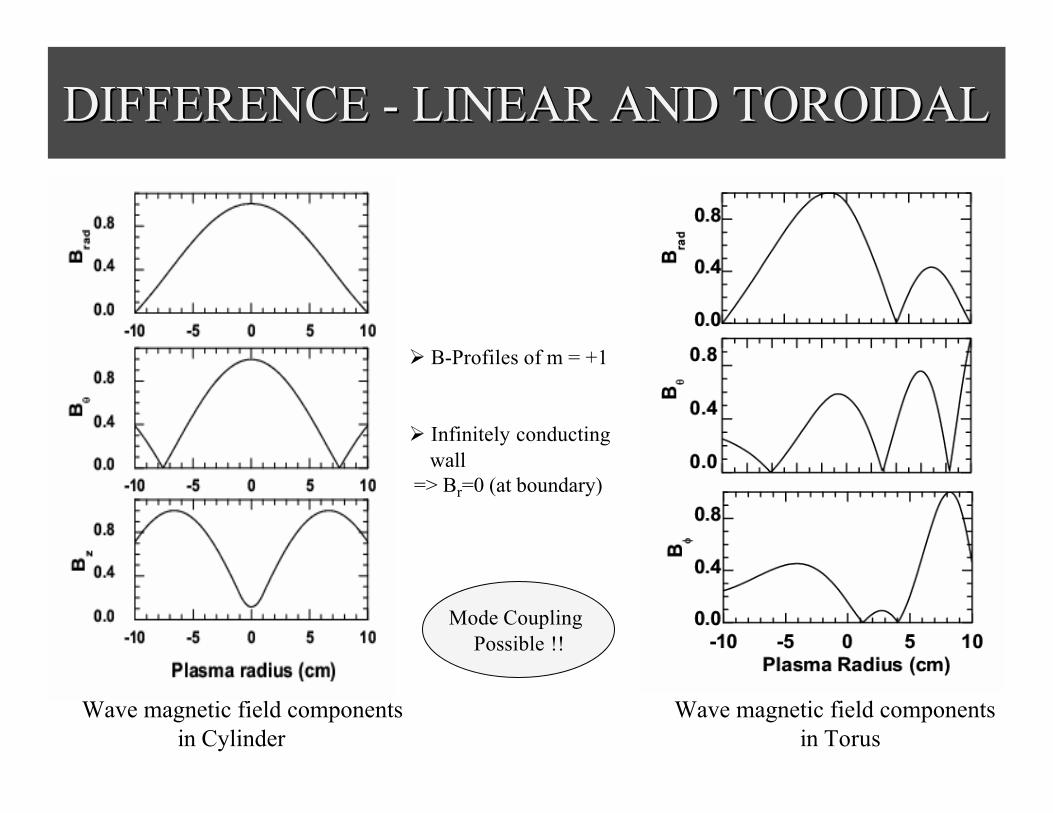
Ø B-Profiles of m = +1
Ø Infinitely conducting wall
=> Br=0 (at boundary)
Wave magnetic field componentsin Cylinder
Wave magnetic field componentsin Torus
Mode Coupling Possible !!
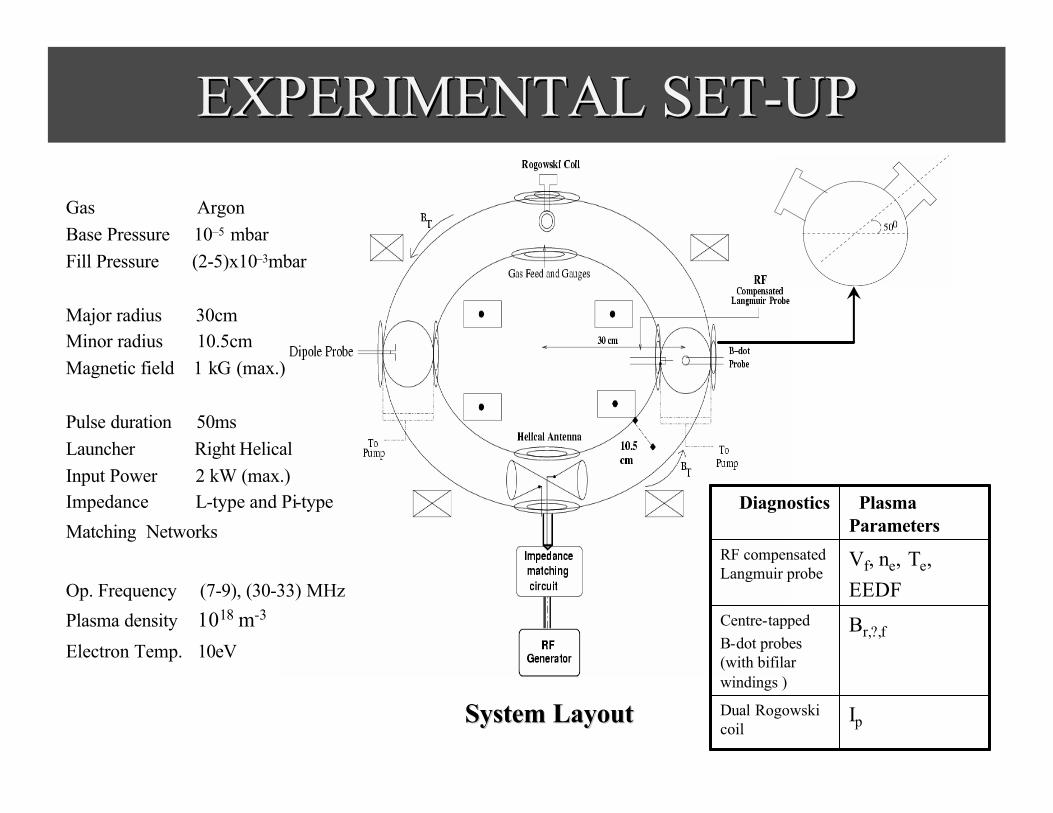
EXPERIMENTAL SETEXPERIMENTAL SET--UPUP
System LayoutSystem Layout
Gas Argon Base Pressure 10–5 mbarFill Pressure (2-5)x10–3mbar
Major radius 30cmMinor radius 10.5cmMagnetic field 1 kG (max.)
Pulse duration 50msLauncher Right Helical Input Power 2 kW (max.)Impedance L-type and Pi-type
Matching Networks
Op. Frequency (7-9), (30-33) MHz
Plasma density 1018 m-3
Electron Temp. 10eV
IpDual Rogowskicoil
Br,?,fCentre-tapped B-dot probes (with bifilar windings )
Vf, ne, Te, EEDF
RF compensated Langmuir probe
Plasma Parameters
Diagnostics
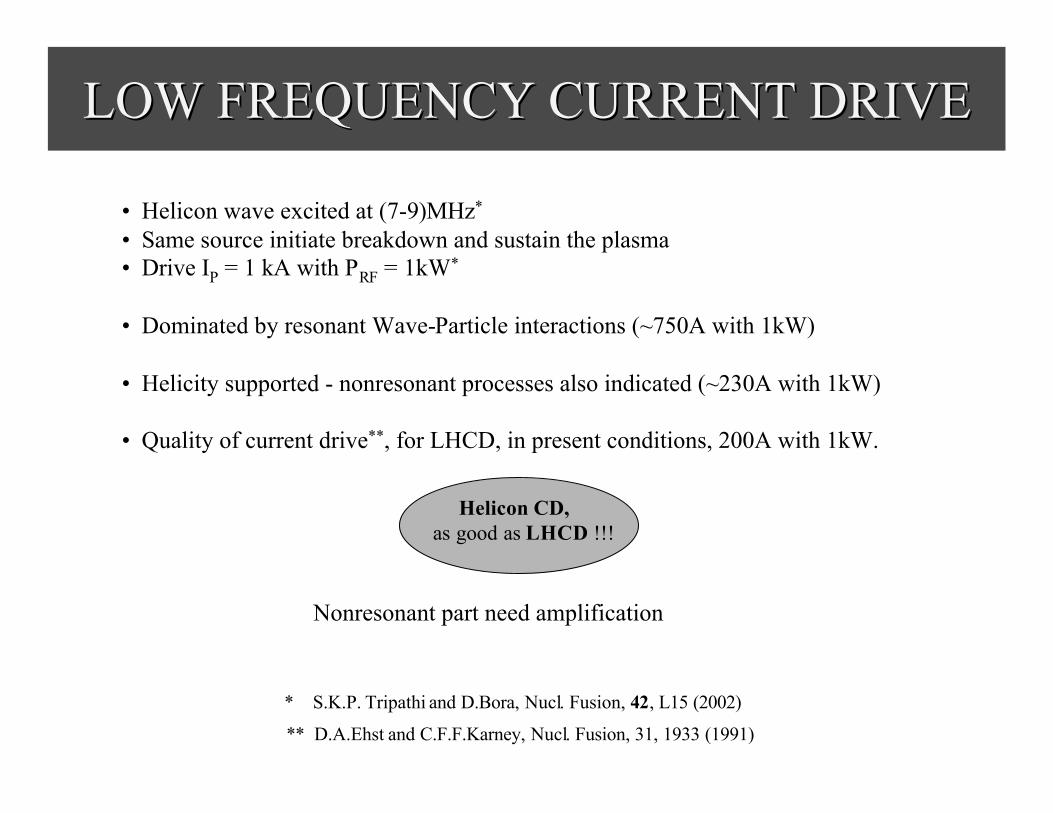
LOW FREQUENCY CURRENT DRIVELOW FREQUENCY CURRENT DRIVE
• Helicon wave excited at (7-9)MHz*
• Same source initiate breakdown and sustain the plasma• Drive IP = 1 kA with PRF = 1kW*
• Dominated by resonant Wave-Particle interactions (~750A with 1kW)
• Helicity supported - nonresonant processes also indicated (~230A with 1kW)
• Quality of current drive**, for LHCD, in present conditions, 200A with 1kW.
Nonresonant part need amplification
* S.K.P. Tripathi and D.Bora, Nucl. Fusion, 42, L15 (2002)
** D.A.Ehst and C.F.F.Karney, Nucl. Fusion, 31, 1933 (1991)
Helicon CD, as good as LHCD !!!
NONRESONANT CURRENT DRIVENONRESONANT CURRENT DRIVE
• Operating frequency increased to increase the phase velocity
• Nonresonant (ponderomotive forces*) contribution amplified
* Petri?z´ilka V. and Tataronis J.A., Plasma Phys. Control. Fusion, 36, 1027 (1994)
• Magnetic field (BT) increased
• Appropriate diagnostics designed and developed
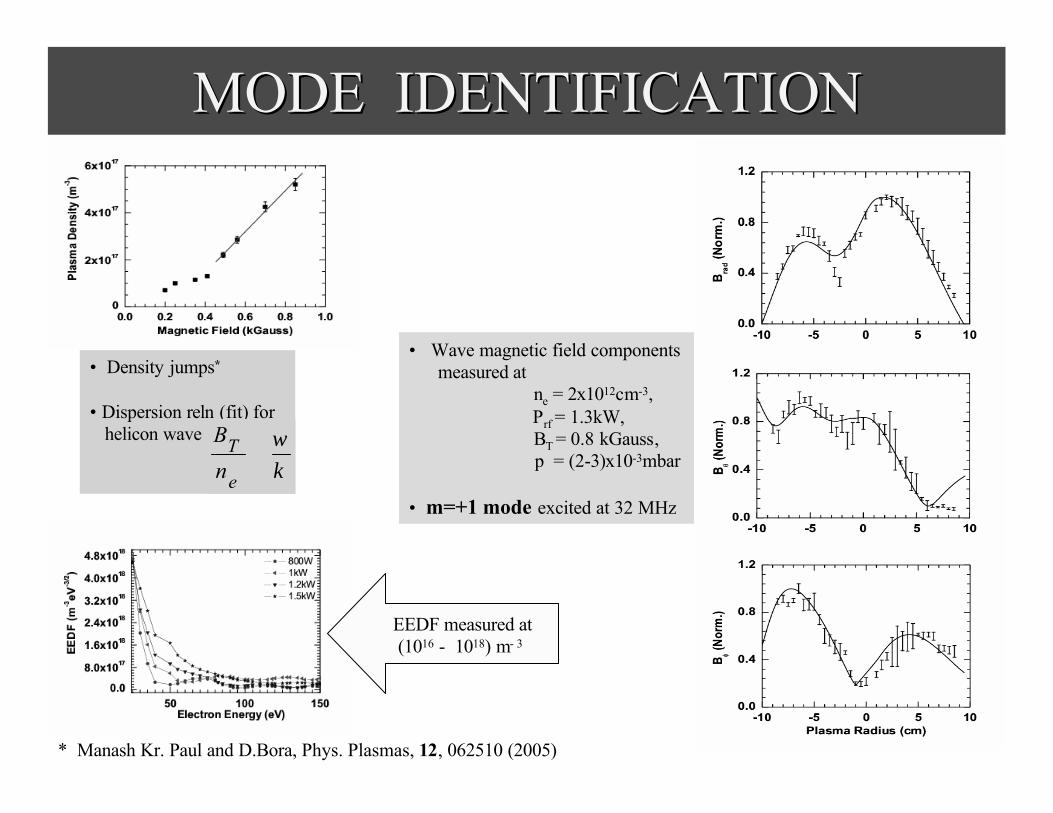
MODE IDENTIFICATIONMODE IDENTIFICATION
• Wave magnetic field components measured at
ne = 2x1012cm-3, Prf = 1.3kW, BT = 0.8 kGauss, p = (2-3)x10-3mbar
• m=+1 mode excited at 32 MHz
• Density jumps*
• Dispersion reln (fit) for helicon wave
κω
∝e
Tn
B
* Manash Kr. Paul and D.Bora, Phys. Plasmas, 12, 062510 (2005)
EEDF measured at (1016 - 1018) m- 3
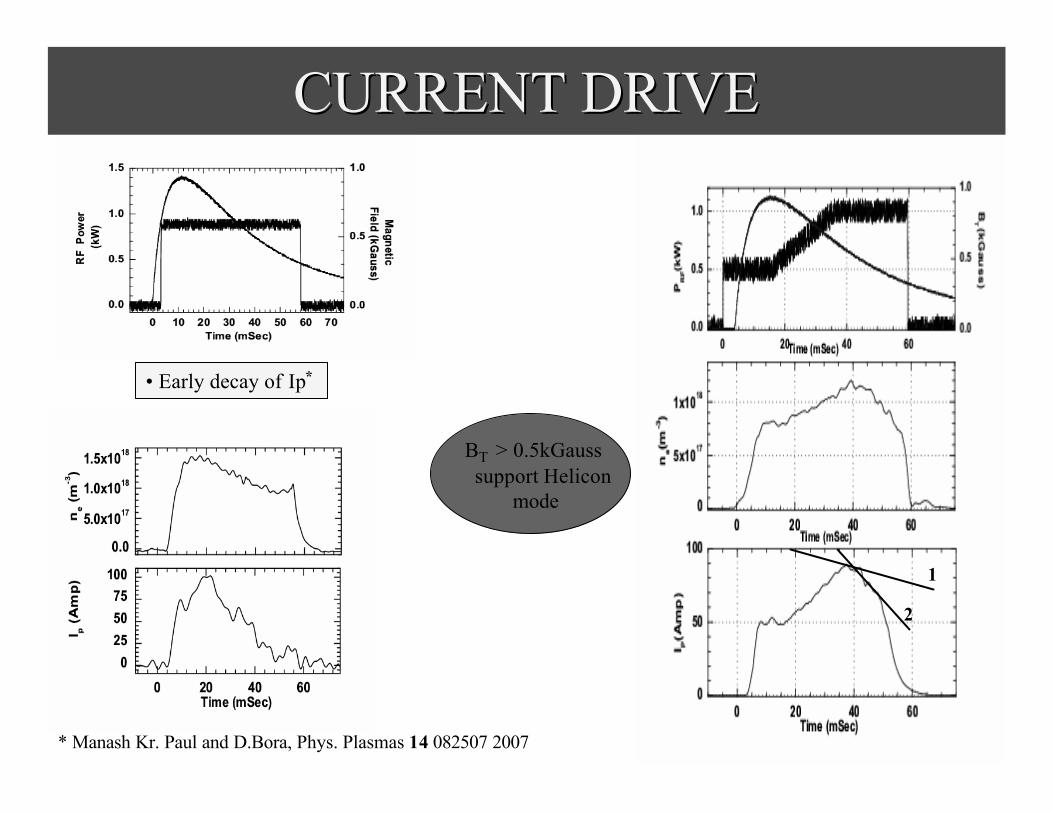
CURRENT DRIVECURRENT DRIVE
• Early decay of Ip*
1
2
* Manash Kr. Paul and D.Bora, Phys. Plasmas 14 082507 2007
BT > 0.5kGauss support Helicon
mode
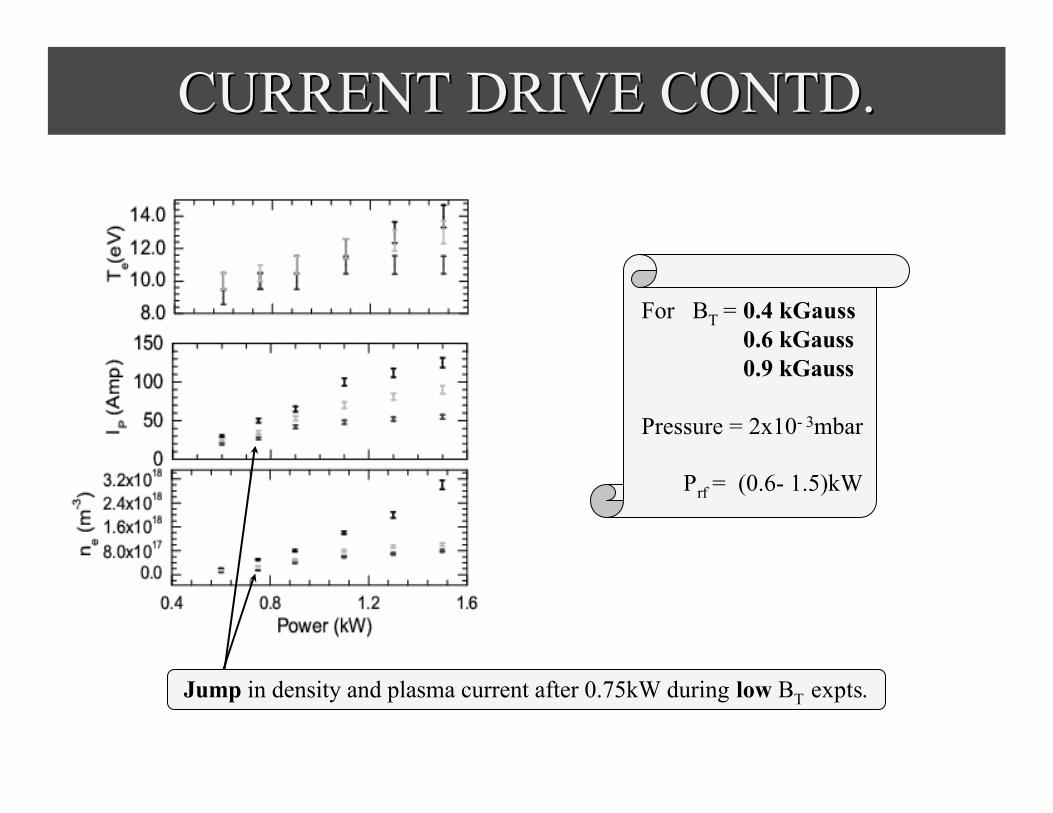
CURRENT DRIVE CONTD.CURRENT DRIVE CONTD.
For BT = 0.4 kGauss0.6 kGauss0.9 kGauss
Pressure = 2x10- 3mbar
Prf = (0.6- 1.5)kW
Jump in density and plasma current after 0.75kW during low BT expts.
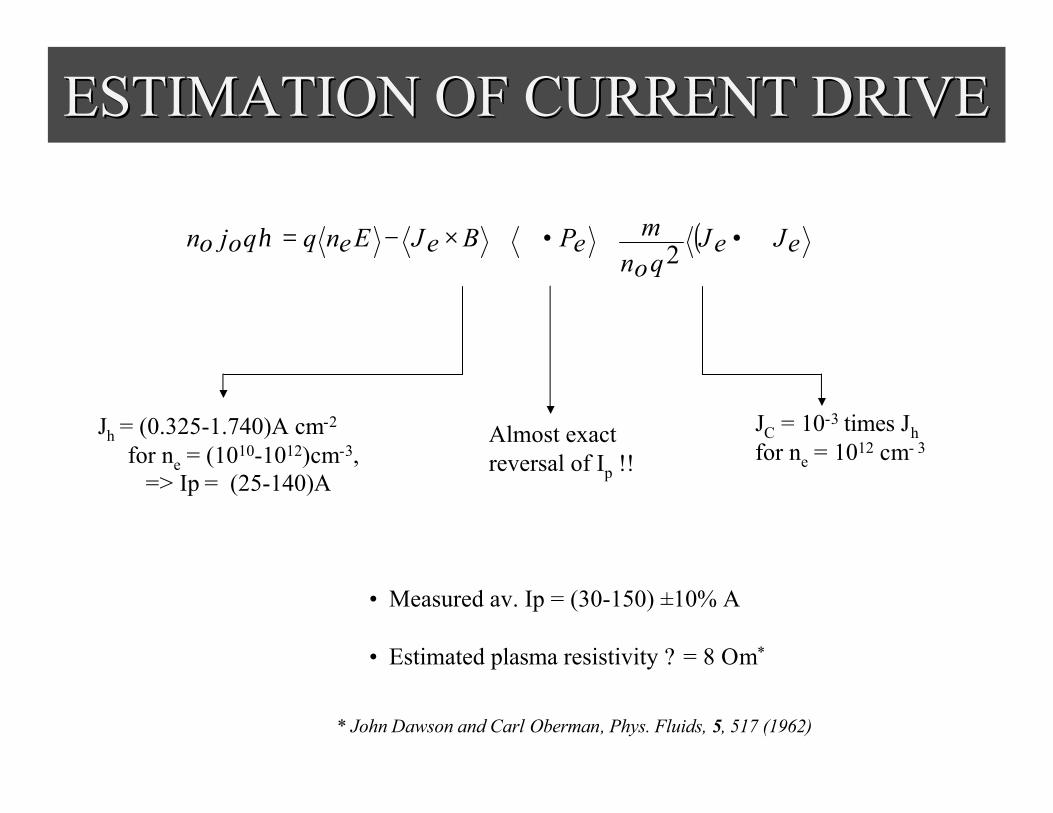
ESTIMATION OF CURRENT DRIVEESTIMATION OF CURRENT DRIVE
( ) eJeJqon
mePBeJEenqqojon ∇•+•∇+×−=2
η
Jh = (0.325-1.740)A cm-2
for ne = (1010-1012)cm-3, => Ip = (25-140)A
• Measured av. Ip = (30-150) ±10% A
• Estimated plasma resistivity ? = 8 Om*
Almost exact reversal of Ip !!
JC = 10-3 times Jhfor ne = 1012 cm- 3
* John Dawson and Carl Oberman, Phys. Fluids, 5, 517 (1962)
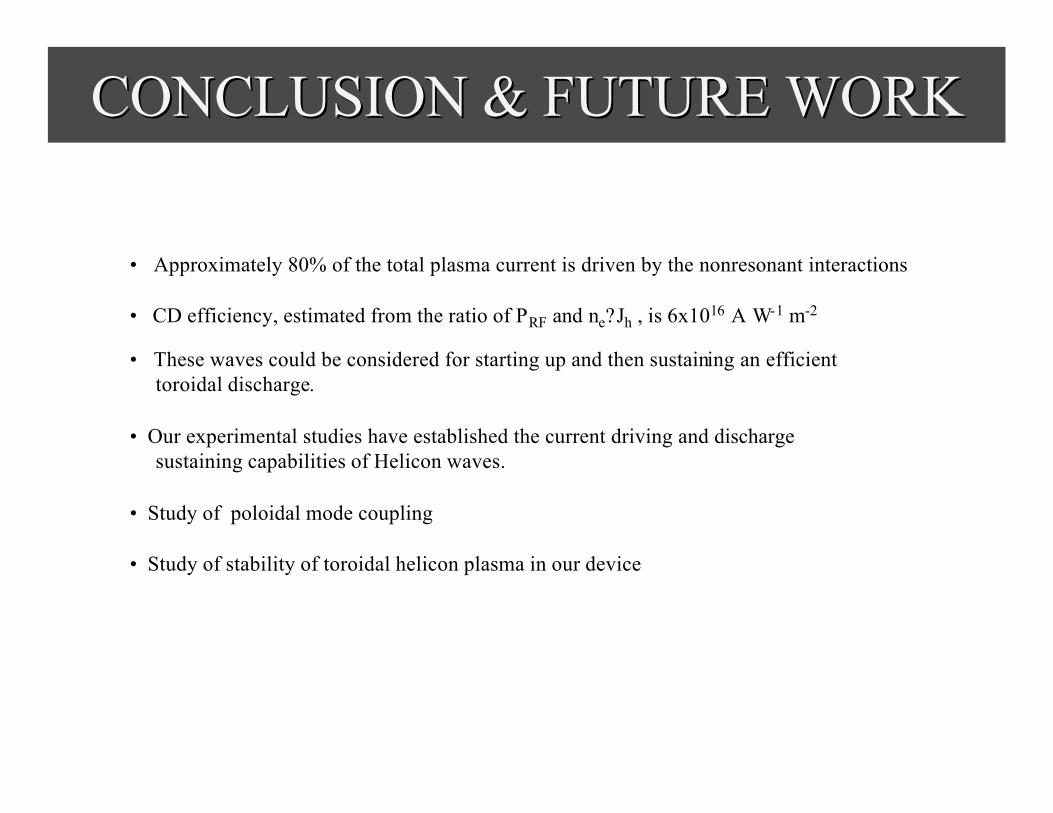
CONCLUSION & FUTURE WORKCONCLUSION & FUTURE WORK
• Approximately 80% of the total plasma current is driven by the nonresonant interactions
• CD efficiency, estimated from the ratio of PRF and ne?Jh , is 6x10¹⁶ A W-1 m-2
• These waves could be considered for starting up and then sustaining an efficient toroidal discharge.
• Our experimental studies have established the current driving and discharge sustaining capabilities of Helicon waves.
• Study of poloidal mode coupling
• Study of stability of toroidal helicon plasma in our device

THANK YOUTHANK YOU
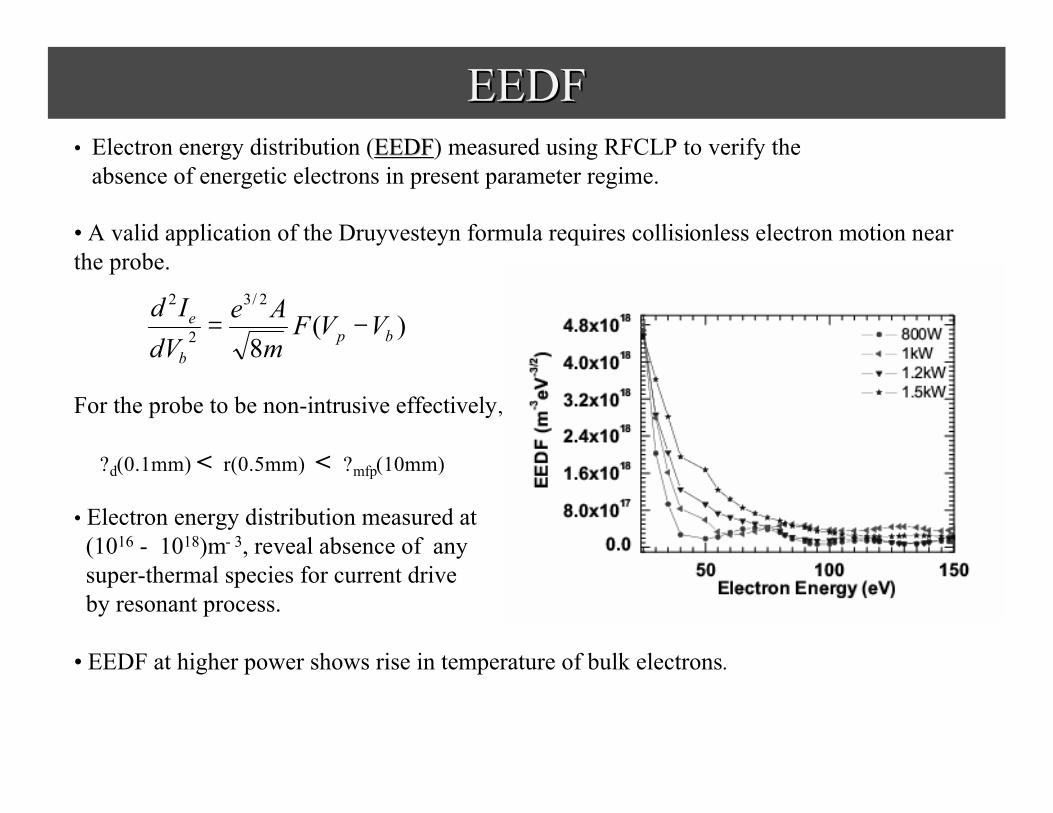
EEDFEEDF• Electron energy distribution (EEDFEEDF) measured using RFCLP to verify the
absence of energetic electrons in present parameter regime.
• A valid application of the Druyvesteyn formula requires collisionless electron motion near the probe.
For the probe to be non-intrusive effectively,
?d(0.1mm) < r(0.5mm) < ?mfp(10mm)
• Electron energy distribution measured at (1016 - 1018)m- 3, reveal absence of anysuper-thermal species for current drive by resonant process.
• EEDF at higher power shows rise in temperature of bulk electrons.
)(8
2/3
2
2
bpb
e VVFmAe
dVId
−=
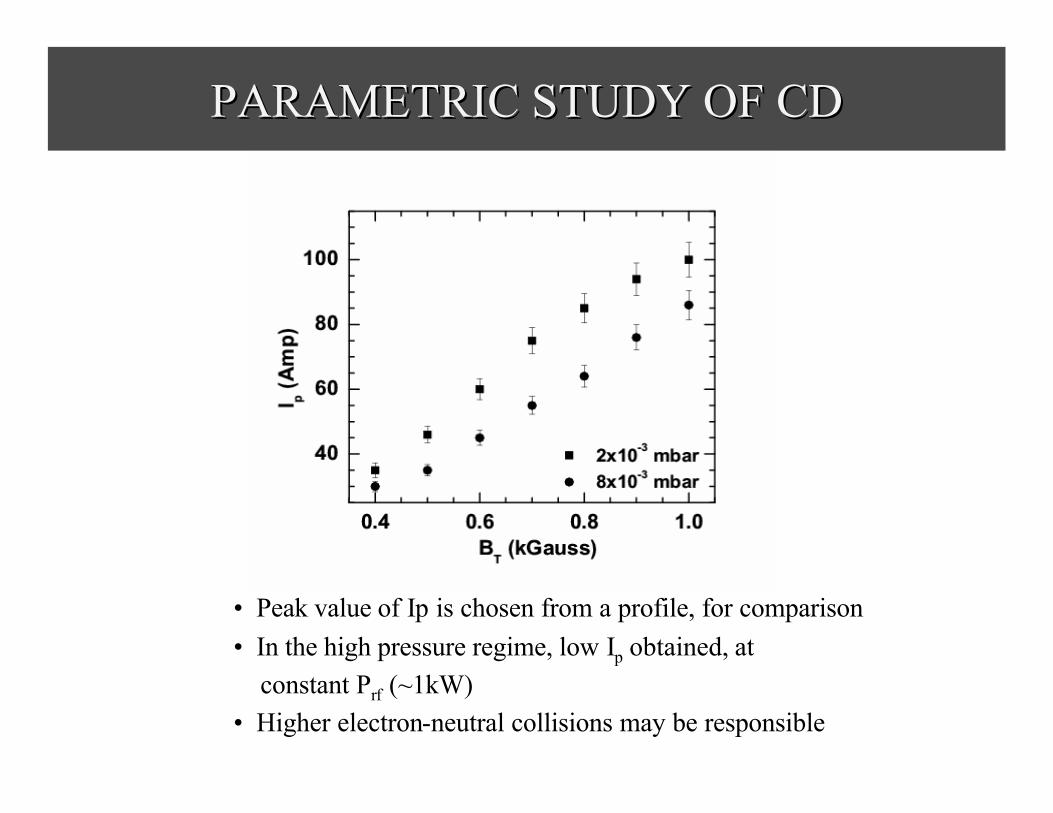
PARAMETRIC STUDY OF CDPARAMETRIC STUDY OF CD
• Peak value of Ip is chosen from a profile, for comparison • In the high pressure regime, low Ip obtained, at
constant Prf (~1kW)• Higher electron-neutral collisions may be responsible
ANALYSIS OF NONRESONANT CURRENT ANALYSIS OF NONRESONANT CURRENT DRIVEDRIVE
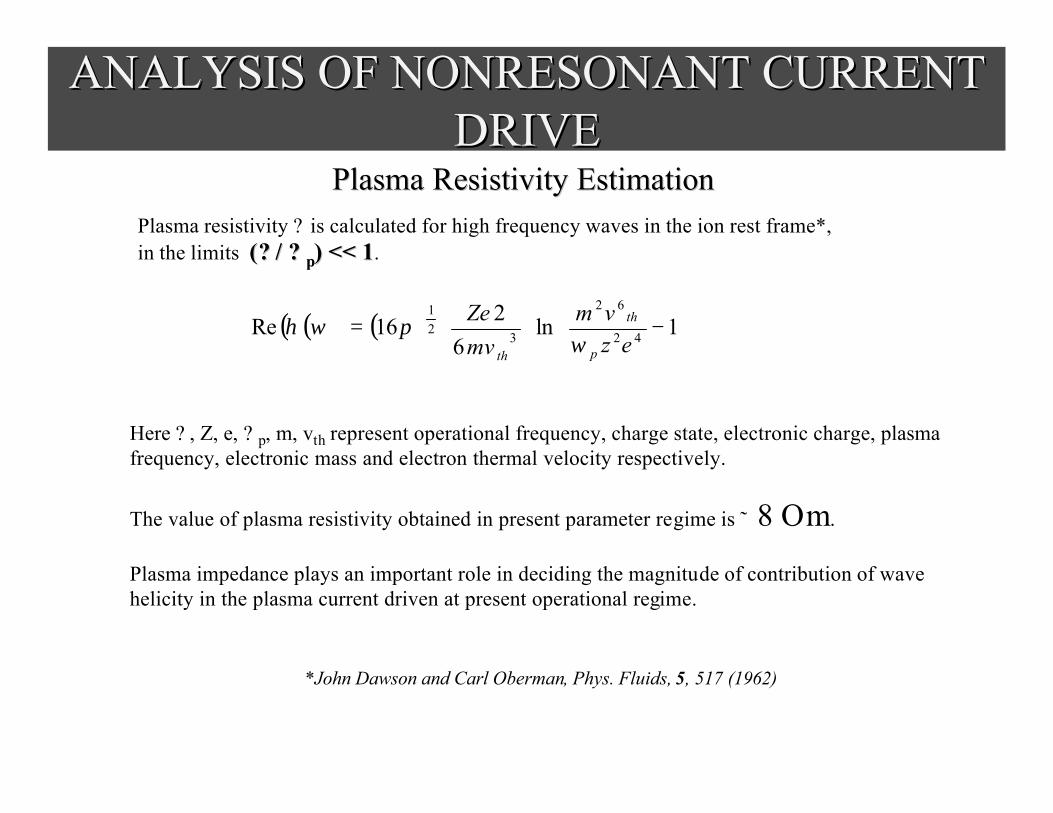
Plasma Resistivity EstimationPlasma Resistivity EstimationPlasma resistivity ? is calculated for high frequency waves in the ion rest frame*, in the limits ((?? / / ?? pp) << 1) << 1.
( )( ) ( )
−= 1ln
6216Re 42
62
321
ezvm
mvZe
p
th
th ωπωη
Here ? , Z, e, ? p, m, vth represent operational frequency, charge state, electronic charge, plasma frequency, electronic mass and electron thermal velocity respectively.
The value of plasma resistivity obtained in present parameter regime is ˜ 8 Om.
Plasma impedance plays an important role in deciding the magnitude of contribution of wave helicity in the plasma current driven at present operational regime.
*John Dawson and Carl Oberman, Phys. Fluids, 5, 517 (1962)
ANALYSIS OF NONRESONANT CURRENT ANALYSIS OF NONRESONANT CURRENT DRIVE: CONTD.DRIVE: CONTD.
Helicity Current DriveHelicity Current Drive
( )( )( )( ) ( )rBBBrB
BBBeJhJenrrrr
rrr
×∇−×∇=
×∇−=×=
θθ
φηµ0
( ) ( )[ ]
∂
∂+
∂
∂−−
++
∂
∂+
∂
∂
+=
θ
φθφθθθθ
φ
φθ
θφθ
B
r
B
r
BrBrBB
rR
BBBrB
rBrR
cossincoscos
1
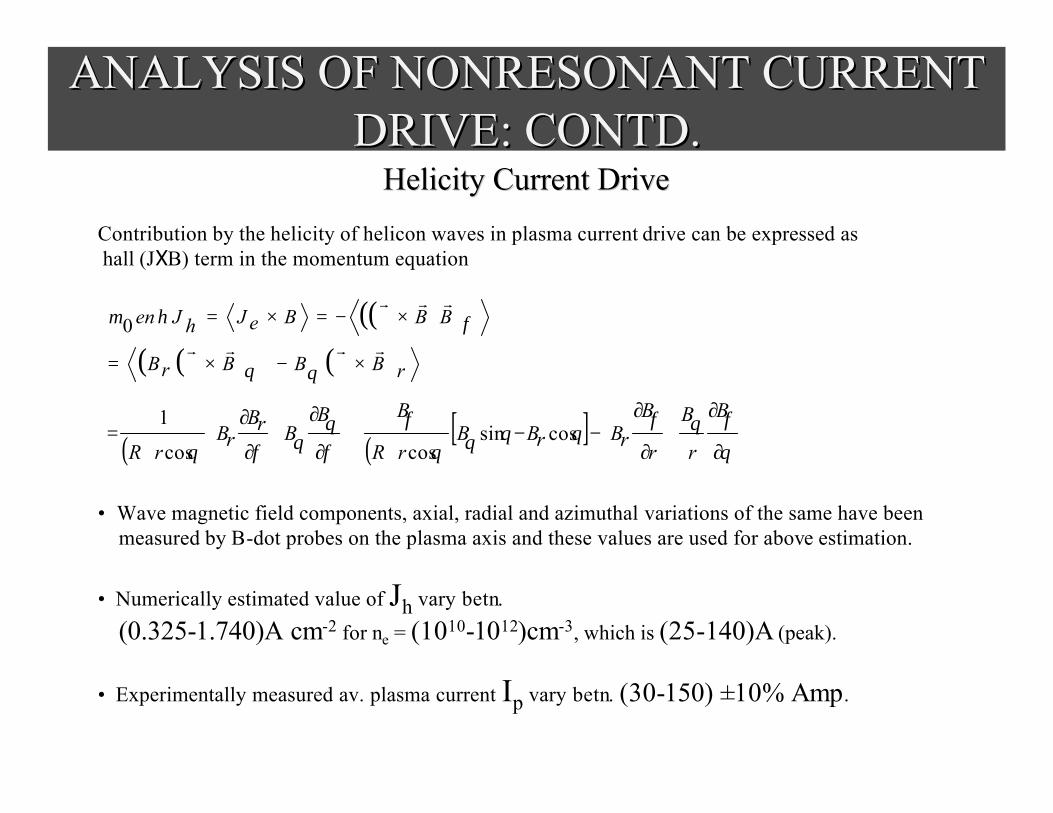
Contribution by the helicity of helicon waves in plasma current drive can be expressed as hall (JXB) term in the momentum equation
• Wave magnetic field components, axial, radial and azimuthal variations of the same have been measured by B-dot probes on the plasma axis and these values are used for above estimation.
• Numerically estimated value of Jh vary betn.
(0.325-1.740)A cm-2 for ne = (1010-1012)cm-3, which is (25-140)A (peak).
• Experimentally measured av. plasma current Ip vary betn. (30-150) ±10% Amp.
ANALYSIS OF NONRESONANT CURRENT ANALYSIS OF NONRESONANT CURRENT DRIVE: CONTD.DRIVE: CONTD.
Current from convective termCurrent from convective term
( )( )φφ
θφ
θφθφ
φη
∂
∂
++
∂
∂+
∂
∂=∇•=
J
rR
JJ
r
J
r
JrJeJeJcJem
eoncos
32 rrr
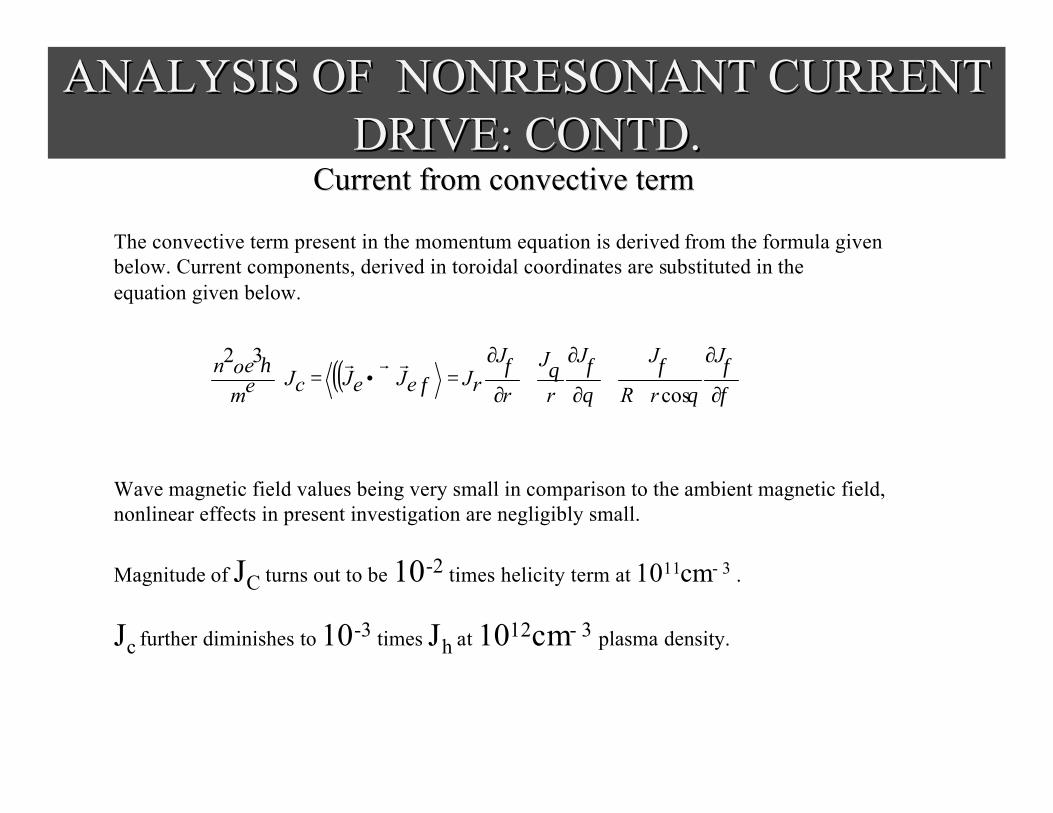
The convective term present in the momentum equation is derived from the formula given below. Current components, derived in toroidal coordinates are substituted in the equation given below.
Wave magnetic field values being very small in comparison to the ambient magnetic field, nonlinear effects in present investigation are negligibly small.
Magnitude of JC turns out to be 10-2 times helicity term at 1011cm- 3 .
Jc further diminishes to 10-3 times Jh at 1012cm- 3 plasma density.
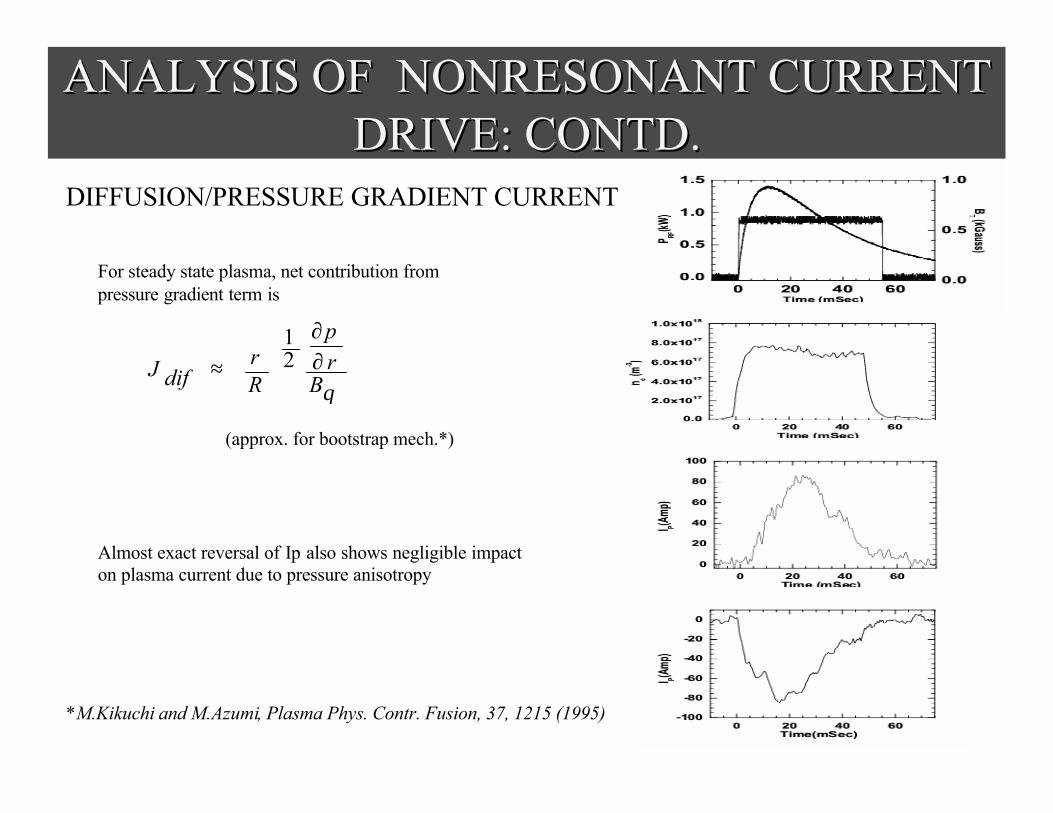
DIFFUSION/PRESSURE GRADIENT CURRENT
For steady state plasma, net contribution from pressure gradient term is
θBrp
Rr
difJ ∂∂
≈
2
1
Almost exact reversal of Ip also shows negligible impacton plasma current due to pressure anisotropy
ANALYSIS OF NONRESONANT CURRENT ANALYSIS OF NONRESONANT CURRENT DRIVE: CONTD.DRIVE: CONTD.
(approx. for bootstrap mech.*)
*M.Kikuchi and M.Azumi, Plasma Phys. Contr. Fusion, 37, 1215 (1995)
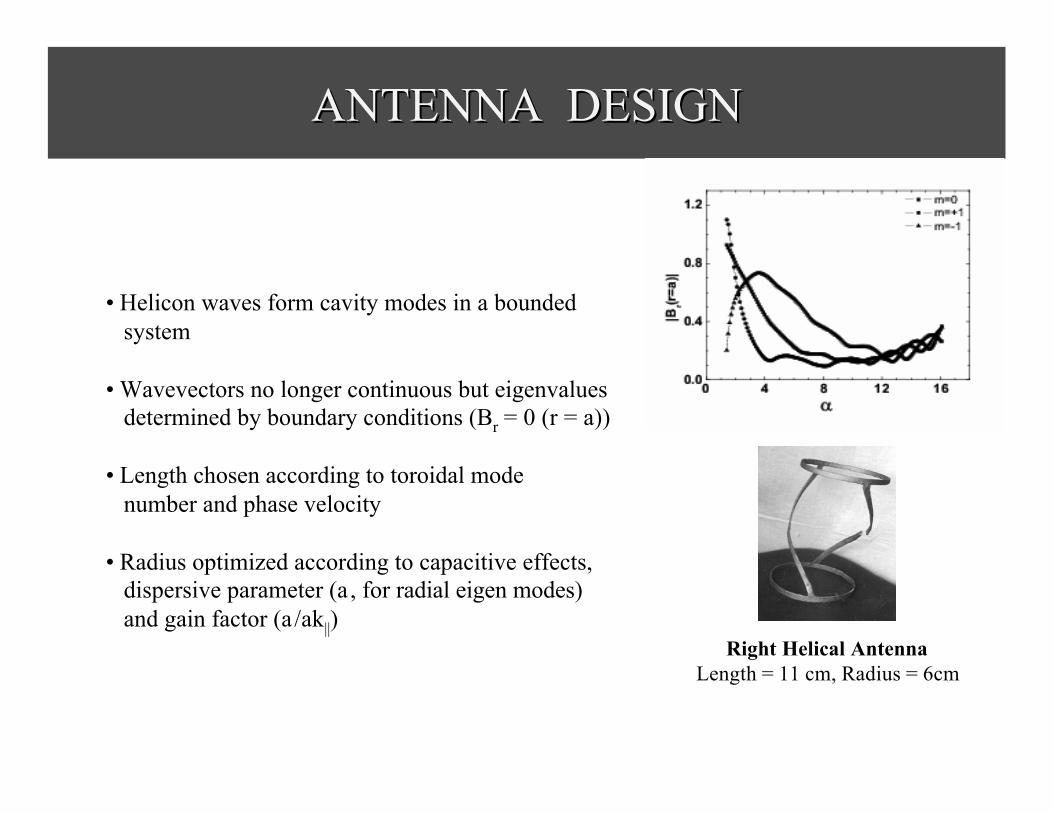
ANTENNA DESIGNANTENNA DESIGN
• Helicon waves form cavity modes in a bounded system
• Wavevectors no longer continuous but eigenvalues determined by boundary conditions (Br = 0 (r = a))
• Length chosen according to toroidal mode number and phase velocity
• Radius optimized according to capacitive effects, dispersive parameter (a , for radial eigen modes) and gain factor (a/ak||)
Right Helical AntennaLength = 11 cm, Radius = 6cm
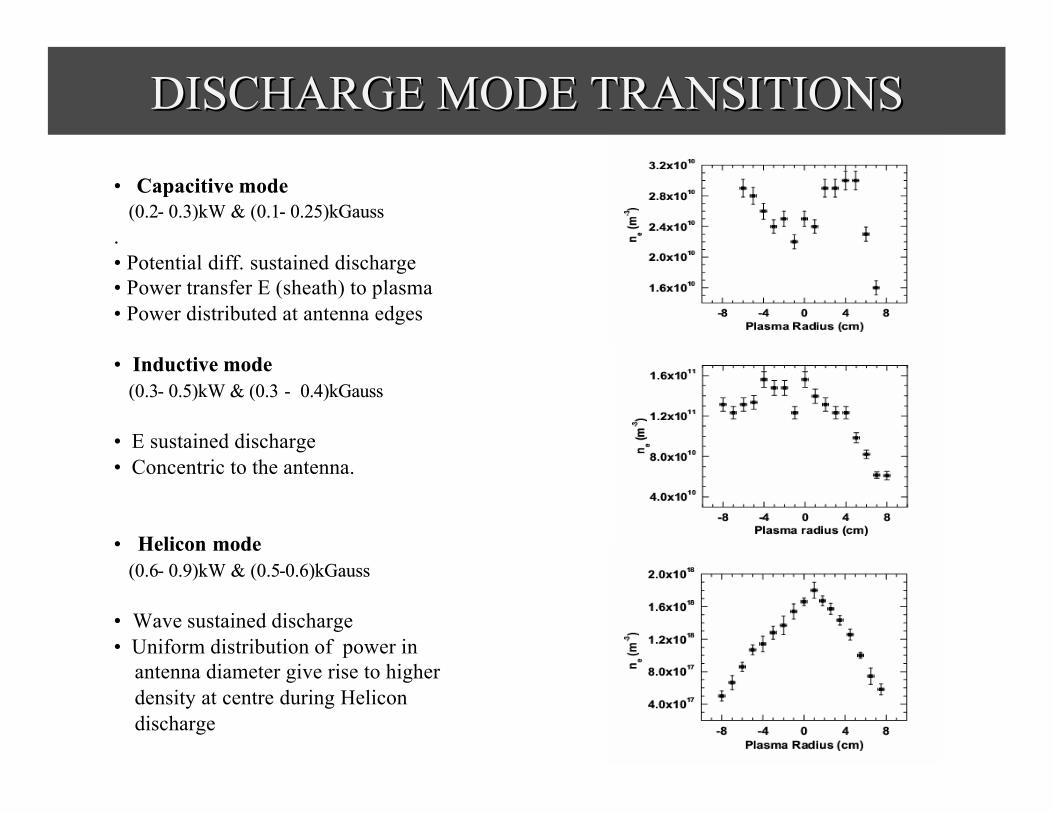
DISCHARGE MODE TRANSITIONSDISCHARGE MODE TRANSITIONS
•• Capacitive modeCapacitive mode(0.2(0.2-- 0.3)kW & (0.10.3)kW & (0.1-- 0.25)kGauss0.25)kGauss
. . •• Potential diff. sustained discharge • Power transfer E (sheath) to plasma • Power distributed at antenna edges
•• Inductive modeInductive mode(0.3(0.3-- 0.5)kW & (0.3 0.5)kW & (0.3 -- 0.4)kGauss0.4)kGauss
•• E sustained discharge • Concentric to the antenna.
•• Helicon modeHelicon mode(0.6(0.6-- 0.9)kW & (0.50.9)kW & (0.5--0.6)kGauss0.6)kGauss
•• Wave sustained discharge • Uniform distribution of power in
antenna diameter give rise to higher density at centre during Helicon discharge
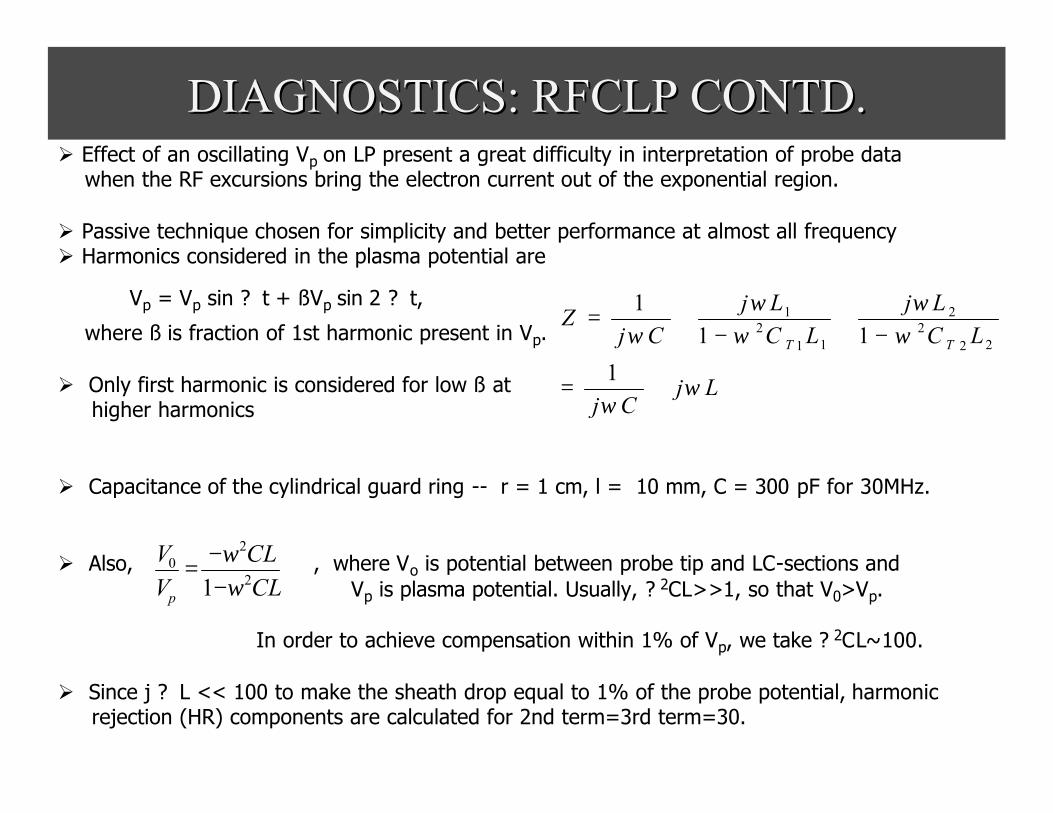
Ø Effect of an oscillating Vp on LP present a great difficulty in interpretation of probe data when the RF excursions bring the electron current out of the exponential region.
Ø Passive technique chosen for simplicity and better performance at almost all frequencyØ Harmonics considered in the plasma potential are
where ß is fraction of 1st harmonic present in Vp.
Ø Only first harmonic is considered for low ß at higher harmonics
Ø Capacitance of the cylindrical guard ring -- r = 1 cm, l = 10 mm, C = 300 pF for 30MHz.
Ø Also, , where Vo is potential between probe tip and LC-sections andVp is plasma potential. Usually, ? 2CL>>1, so that V0>Vp.
In order to achieve compensation within 1% of Vp, we take ? 2CL~100.
Ø Since j ? L << 100 to make the sheath drop equal to 1% of the probe potential, harmonic rejection (HR) components are calculated for 2nd term=3rd term=30.
Vp = Vp sin ? t + ßVp sin 2 ? t,
LjCj
LCLj
LCLj
CjZ
TT
ωω
ωω
ωω
ω
+=
−+
−+=
1
111
222
2
112
1
CLCL
VV
p2
20
1 ωω
−−=
DIAGNOSTICS: RFCLP CONTD.DIAGNOSTICS: RFCLP CONTD.
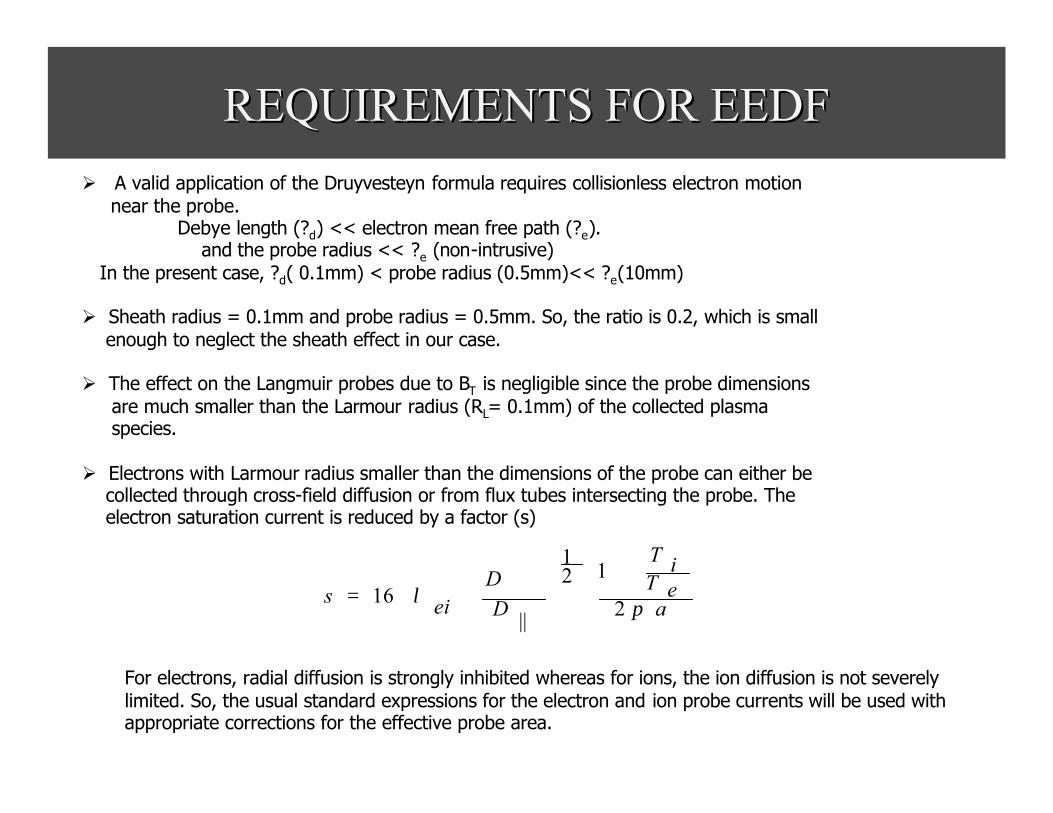
REQUIREMENTS FOR EEDFREQUIREMENTS FOR EEDFØ A valid application of the Druyvesteyn formula requires collisionless electron motion
near the probe. ⇒ Debye length (?d) << electron mean free path (?e).
and the probe radius << ?e (non-intrusive)In the present case, ?d( 0.1mm) < probe radius (0.5mm)<< ?e(10mm)
Ø Sheath radius = 0.1mm and probe radius = 0.5mm. So, the ratio is 0.2, which is small enough to neglect the sheath effect in our case.
Ø The effect on the Langmuir probes due to BT is negligible since the probe dimensions are much smaller than the Larmour radius (RL= 0.1mm) of the collected plasma species.
Ø Electrons with Larmour radius smaller than the dimensions of the probe can either becollected through cross-field diffusion or from flux tubes intersecting the probe. The electron saturation current is reduced by a factor (s)
+⊥= a
eTiT
DD
eis πλ 2
121
||16
For electrons, radial diffusion is strongly inhibited whereas for ions, the ion diffusion is not severely limited. So, the usual standard expressions for the electron and ion probe currents will be used with appropriate corrections for the effective probe area.
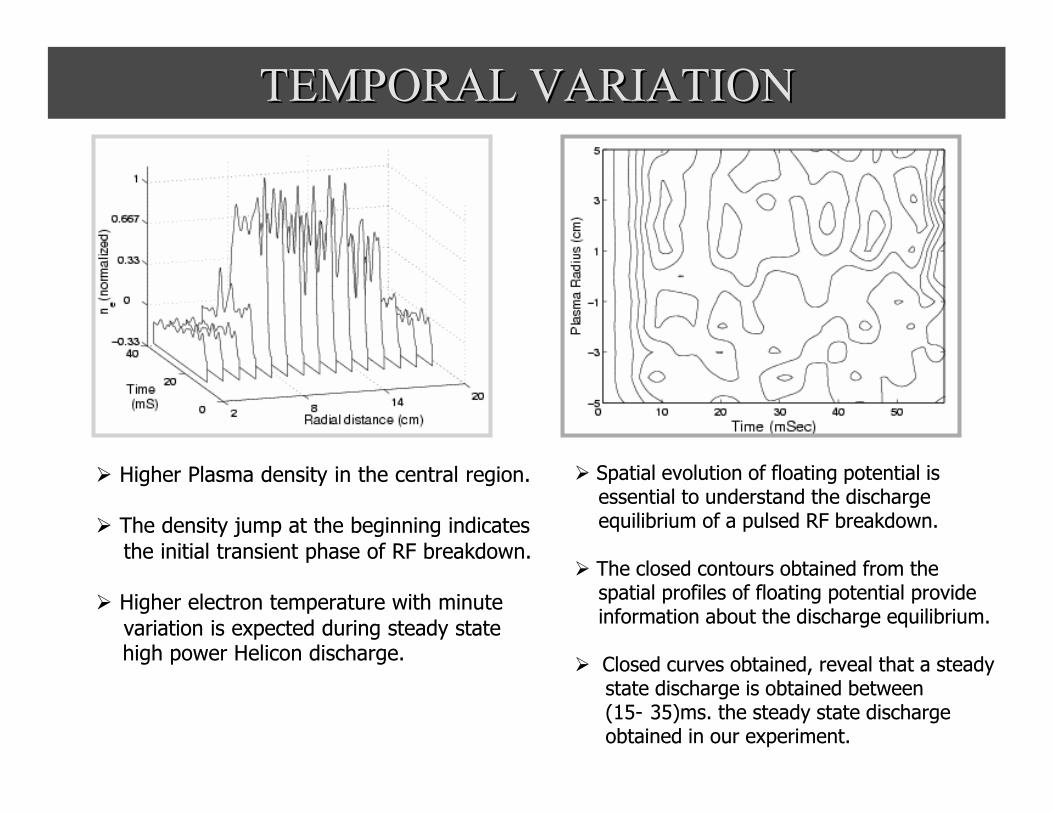
TEMPORAL VARIATIONTEMPORAL VARIATION
ØØ Spatial evolution of floating potential is Spatial evolution of floating potential is essential to understand the discharge essential to understand the discharge equilibrium of a pulsed RF breakdown. equilibrium of a pulsed RF breakdown.
ØØ The closed contours obtained from the The closed contours obtained from the spatial profiles of floating potential provide spatial profiles of floating potential provide information about the discharge equilibrium. information about the discharge equilibrium.
ØØ Closed curves obtained, reveal that a steady Closed curves obtained, reveal that a steady state discharge is obtained between state discharge is obtained between (15(15-- 35)ms.35)ms. the steady state discharge the steady state discharge obtained in our experiment.obtained in our experiment.
ØØ Higher Plasma density in the central region.Higher Plasma density in the central region.
ØØ The density jump at the beginning indicates The density jump at the beginning indicates the initial transient phase of RF breakdown.the initial transient phase of RF breakdown.
ØØ Higher electron temperature with minute Higher electron temperature with minute variation is expected during steady state variation is expected during steady state high power Helicon discharge.high power Helicon discharge.
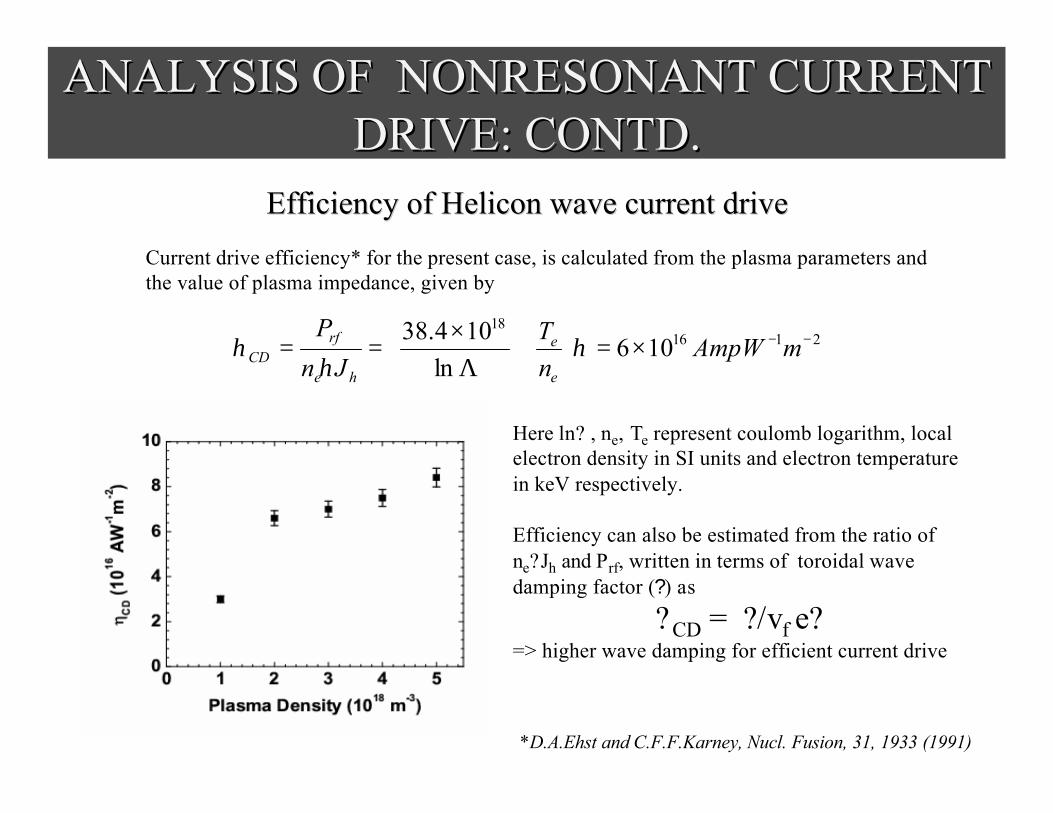
ANALYSIS OF NONRESONANT CURRENT ANALYSIS OF NONRESONANT CURRENT DRIVE: CONTD.DRIVE: CONTD.
Efficiency of Helicon wave current drive Efficiency of Helicon wave current drive
211618
106ln
104.38 −−×=
Λ
×== mAmpW
nT
Jn
P
e
e
he
rfCD η
ηη
Current drive efficiency* for the present case, is calculated from the plasma parameters and the value of plasma impedance, given by
Here ln? , ne, Te represent coulomb logarithm, local electron density in SI units and electron temperature in keV respectively.
Efficiency can also be estimated from the ratio of ne?Jh and Prf, written in terms of toroidal wave damping factor (?) as
?CD = ?/vf e?=> higher wave damping for efficient current drive
*D.A.Ehst and C.F.F.Karney, Nucl. Fusion, 31, 1933 (1991)