the top 6 canadian banks selected indicators of q3 and ytd 2015 results - d pershad
TRANSCRIPT

The Top 6 Canadian Banks:
Selected Indicators of Q3 and
YTD 2015 Results
August 2015
December 2014

Contents
Overview 3.
Key Performance Indicators 4.
Q3 2015 Total Revenue 5.
Q3 2015 Net Income 6.
Q3 2015 Return on Equity 7.
Q3 2015 Earnings Per Share 8.
YTD Q3 2015 Total Revenue 9.
YTD Q3 2015 Net Income 10.
YTD Q3 2015 Return on Equity 11.
YTD Q3 2015 Earnings Per Share 12.
Recap 13.
2

Canada's Top 6 Banks – Resilience in the face of global, recessionary and energy sector headwinds
• Contraction of the Canadian economy for five straight months, along with a continuing decline in oil prices and a volatile global economy, have all made for rough seas for Canada’s top 6 banks
• Taken as a group however, the combined net income for the top 6 Canadian banks for Q3 2015 declined only slightly vs. the same period a year ago, by around 1.2%
– YTD Q3 net income increased 2.8% overall for the top 6 banks
• CIBC turned in a relatively stellar performance, with a 17% increase in net income over the first 3 quarters of FY 2015
• CIBC also led the top 6 banks in reported ROE and EPS for the first 3 quarters to date – an 8.1% increase in ROE, and an 18.4% increase in EPS
3

Key Performance Indicators
Among the key performance indicators for the top 6 banks are:
• Total Revenue
• Net Income
• ROE (Return on Equity)
• EPS (Earnings per Share)
The following charts show how each bank performed in a universe of top 6 bank results.(Sources: Reported Top 6 Banks’ Q3 2015 results)
4
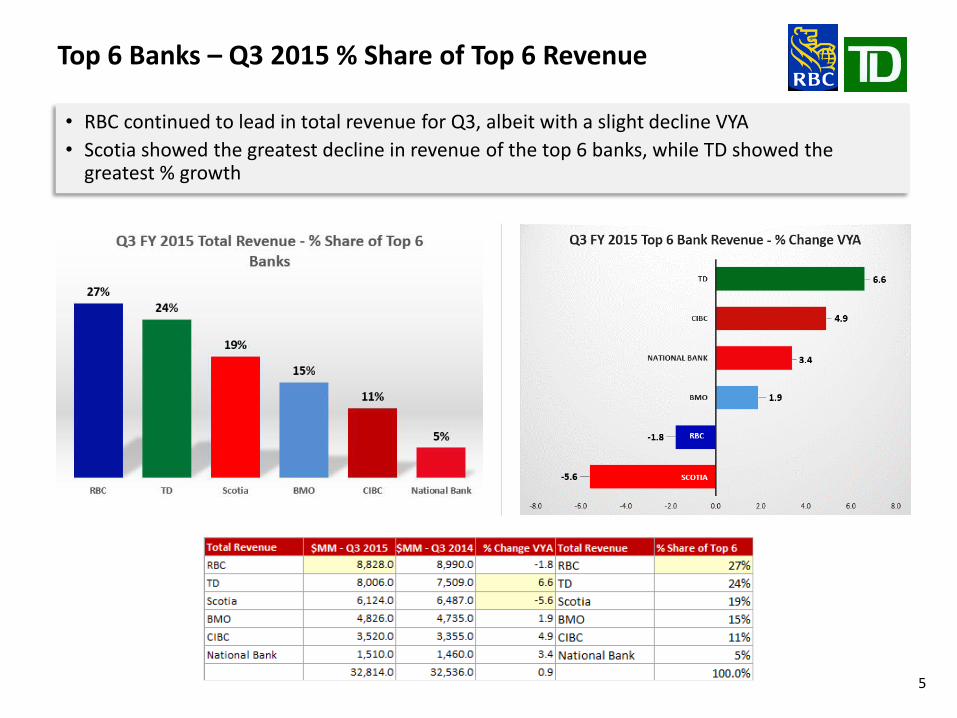
Top 6 Banks – Q3 2015 % Share of Top 6 Revenue
• RBC continued to lead in total revenue for Q3, albeit with a slight decline VYA
• Scotia showed the greatest decline in revenue of the top 6 banks, while TD showed the greatest % growth
5

Top 6 Banks – Q3 2015 % Share of Top 6 Net Income
6
• RBC continued to have the greatest share of top 6 net income for Q3, followed closely by TD
• TD showed the greatest % growth vs. Q3 2014, while Scotia showed the greatest decline
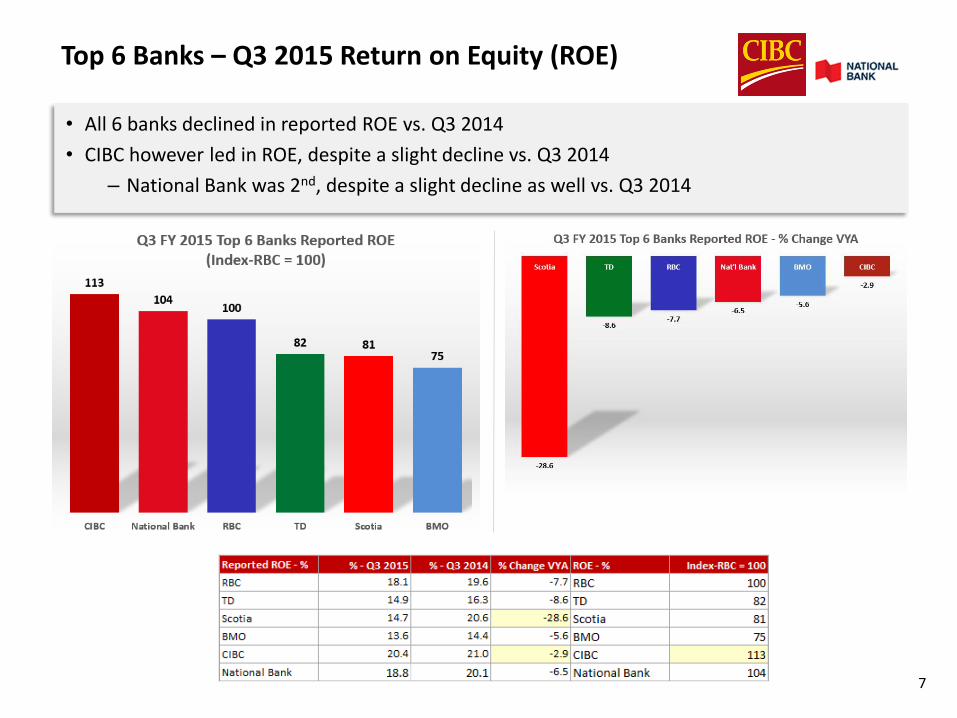
Top 6 Banks – Q3 2015 Return on Equity (ROE)
7
• All 6 banks declined in reported ROE vs. Q3 2014
• CIBC however led in ROE, despite a slight decline vs. Q3 2014
– National Bank was 2nd, despite a slight decline as well vs. Q3 2014

Top 6 Banks Q3 2015 Earnings Per Share (EPS)
8
• While BMO showed the greatest increase in reported EPS vs. Q3 2014, CIBC delivered the highest-by-far EPS, indexing at 146 vs. RBC as the benchmark index at 100

Top 6 Banks – YTD Q3 2015 % Share of Top 6 Revenue
• RBC and BMO led in % growth in total revenue for the cumulative 3 quarters of FY 2015
• As expected, RBC, TD and Scotia were the top 3 revenue leaders
9

Top 6 Banks – YTD Q3 2015 % Share of Top 6 Net Income
10
• While RBC continued to lead in terms of YTD Q3 net income, it was CIBC that showed the greatest % increase, at 17% vs. the first 3 quarters of 2014

Top 6 Banks – YTD Q3 2015 Return on Equity (ROE)
11
• CIBC led the top 6 in terms of YTD Q3 reported ROE, and was the only top 6 bank to show an increase vs. the same period a year ago

Top 6 Banks YTD Q3 2015 Earnings Per Share (EPS)
12
• In a very difficult year for the top Canadian banks, CIBC appears to be on a roll, leading by far in terms of reported EPS, and indexing at 139 vs. the RBC benchmark at 100


Deepak Pershad, Principal
www.insightsbydesign.ca
416.925.6536