the toa reinsurance company, limited and subsidiaries ... · the toa reinsurance company, limited...
TRANSCRIPT

The Toa Reinsurance Company, Limited
and Subsidiaries
Consolidated Financial Statements
For the years ended 31st March 2017 and 2016

The accompanying notes are an integral part of the statements.
1
The Toa Reinsurance Company, Limited and Subsidiaries
Consolidated Balance Sheet
As of 31st March 2017 and 2016
Millions of yen
Thousands of
U.S. dollars
(Note 1(2))
2017 2016 2017
Assets
Cash and deposits ¥ 12,684 ¥ 9,877 $ 113,058
Monetary receivables bought 5,999 2,999 53,471
Money held in trust 7,628 7,609 67,991
Securities (Notes 5(2), (4) and (5)) 564,544 561,795 5,032,034
Loans (Note 5(3)) 583 700 5,196
Tangible fixed assets (Note 5(1))
Land 6,747 6,755 60,139
Buildings 3,172 3,176 28,273
Leased assets 185 194 1,648
Other tangible fixed assets 223 244 1,987
10,329 10,371 92,067
Intangible fixed assets
Software 297 244 2,647
Software in progress 1,462 959 13,031
Other intangible fixed assets 2 2 17
1,762 1,207 15,705
Other assets
Foreign reinsurance accounts receivable 39,812 36,763 354,862
Rest of other assets 20,686 21,894 184,383
60,499 58,657 539,254
Deferred tax assets 34,440 35,086 306,979
Less: Allowance for doubtful accounts (54) (63) (481)
Total assets ¥ 698,418 ¥ 688,242 $ 6,225,314

The accompanying notes are an integral part of the statements.
2
The Toa Reinsurance Company, Limited and Subsidiaries
Consolidated Balance Sheet, continued
As of 31st March 2017 and 2016
Millions of yen
Thousands of
U.S. dollars
(Note 1(2))
2017 2016 2017
Liabilities
Underwriting funds
Outstanding claims ¥ 215,854 ¥ 229,336 $ 1,924,003
Underwriting reserves 216,780 206,363 1,932,257
432,634 435,700 3,856,261
Corporate bonds 30,000 30,000 267,403
Other liabilities 24,053 24,713 214,395
Net defined benefit liabilities 8,156 8,191 72,698
Accrued retirement benefits for directors 153 135 1,363
Reserve under the special law
Reserve for price fluctuation 10,683 8,020 95,222
10,683 8,020 95,222
Deferred tax liabilities 830 655 7,398
Total liabilities 506,510 507,416 4,514,751
Net assets
Shareholders’ equity
Capital stock 5,000 5,000 44,567
Capital surplus 124 27 1,105
Retained earnings 122,952 113,370 1,095,926
Treasury stock (3,132) (4,233) (27,916)
124,944 114,165 1,113,682
Accumulated other comprehensive income
Net unrealized gains on available-for-sale securities,
net of tax 61,478 57,475 547,981
Net foreign currency translation adjustments 6,755 11,093 60,210
Remeasurements of defined benefit plans (1,270) (1,908) (11,320)
66,963 66,661 596,871
Total net assets 191,907 180,826 1,710,553
Total liabilities and net assets ¥ 698,418 ¥ 688,242 $ 6,225,314

The accompanying notes are an integral part of the statements.
3
The Toa Reinsurance Company, Limited and Subsidiaries
Consolidated Statement of Income
For the years ended 31st March 2017 and 2016
Millions of yen
Thousands of
U.S. dollars
(Note 1(2))
2017 2016 2017
Ordinary income and expenses:
Ordinary income
Underwriting income
Net premiums written ¥ 223,749 ¥ 223,786 $ 1,994,375
Investment income on deposit premiums 207 261 1,845
Reversal of outstanding claims 10,073 - 89,785
Other underwriting income - 0 -
234,030 224,048 2,086,014
Investment income
Interest and dividends income 11,705 14,366 104,331
Gain on money held in trust 45 3 401
Gain on sales of securities 5,476 6,662 48,810
Gain on redemption of securities 124 55 1,105
Gain on derivatives 73 - 650
Other investment income 0 0 0
Transfer of investment income on deposit premiums (207) (261) (1,845)
17,217 20,826 153,462
Other ordinary income 214 239 1,907
251,462 245,114 2,241,394
Ordinary expenses
Underwriting expenses
Net claims paid 161,419 155,574 1,438,800
Commissions and brokerage (Note 6(1)) 45,171 44,325 402,629
Provision for outstanding claims - 4,992 -
Provision for underwriting reserves 11,104 9,809 98,974
Other underwriting expenses 640 1,492 5,704
218,336 216,194 1,946,127
Investment expenses
Loss on money held in trust 7 458 62
Loss on sales of securities 3,800 3,026 33,871
Impairment losses on securities 150 668 1,337
Loss on redemption of securities 178 165 1,586
Loss on derivatives - 549 -
Other investment expenses 1,082 1,340 9,644
5,219 6,208 46,519
Operating and general administrative expenses
(Note 6(1)) 12,215 11,394 108,877
Other ordinary expenses
Interest expenses 1,598 1,606 14,243
Loss on bad debts 17 6 151
Other expenses 52 47 463
1,667 1,661 14,858
237,439 235,459 2,116,400
Ordinary profit ¥ 14,022 ¥ 9,655 $ 124,984

The accompanying notes are an integral part of the statements.
4
The Toa Reinsurance Company, Limited and Subsidiaries
Consolidated Statement of Income, continued
For the years ended 31st March 2017 and 2016
Millions of yen
Thousands of
U.S. dollars
(Note 1(2))
2017 2016 2017
Extraordinary income and loss:
Extraordinary income
Gain on disposal of fixed assets ¥ 1 ¥ 1 $ 8
Reversal of reserve under the special law
Reversal of reserve for price fluctuation - 6 -
1 8 8
Extraordinary loss
Loss on disposal of fixed assets 17 3 151
Provision for reserve under the special law
Provision for reserve for price fluctuation 2,663 - 23,736
2,680 3 23,888
Income before income taxes 11,343 9,659 101,105
Income taxes:
Current 2,432 3,451 21,677
Deferred (1,601) 533 (14,270)
831 3,985 7,407
Net income 10,512 5,674 93,698
Net income attributable to owners of the parent ¥ 10,512 ¥ 5,674 $ 93,698

The accompanying notes are an integral part of the statements.
5
The Toa Reinsurance Company, Limited and Subsidiaries
Consolidated Statement of Comprehensive Income
For the year ended 31st March 2017 and 2016
Millions of yen
Thousands of
U.S. dollars
(Note 1(2))
2017 2016 2017
Comprehensive income
Net income ¥ 10,512 ¥ 5,674 $ 93,698
Other comprehensive income
Net unrealized gains on available-for-sale securities, net of
tax 4,002 (21,185) 35,671
Net foreign currency translation adjustments (4,338) (1,455) (38,666)
Remeasurements of defined benefit plans, net of tax 637 (988) 5,677
Total other comprehensive income (Note 7(1)) 302 (23,629) 2,691
¥ 10,814 ¥ (17,955) $ 96,390
(Breakdown)
Comprehensive income attributable to owners of
the parent ¥ 10,814 ¥ (17,955) $ 96,390
Comprehensive income attributable to non-controlling
interests - - -
The accompanying notes are an integral part of the statements.
6
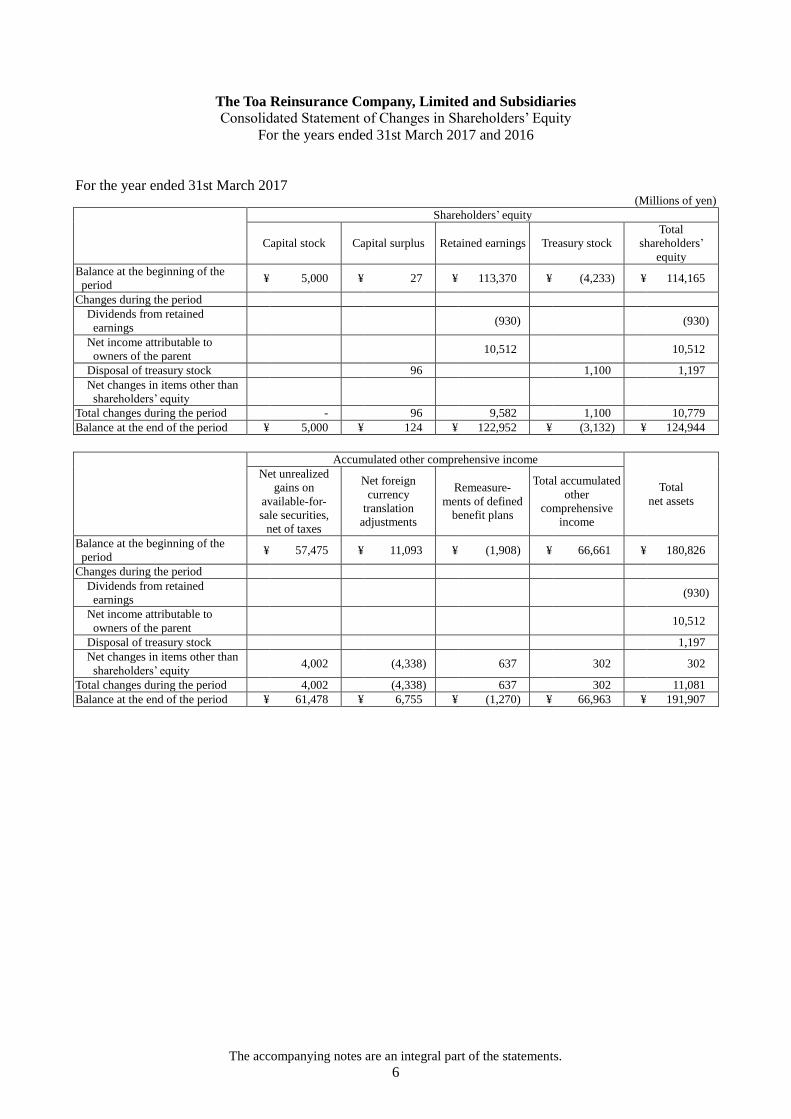
The Toa Reinsurance Company, Limited and Subsidiaries
Consolidated Statement of Changes in Shareholders’ Equity
For the years ended 31st March 2017 and 2016
For the year ended 31st March 2017 (Millions of yen)
Shareholders’ equity
Capital stock Capital surplus Retained earnings Treasury stock
Total
shareholders’
equity
Balance at the beginning of the
period ¥ 5,000 ¥ 27 ¥ 113,370 ¥ (4,233) ¥ 114,165
Changes during the period
Dividends from retained
earnings (930) (930)
Net income attributable to
owners of the parent 10,512 10,512
Disposal of treasury stock 96 1,100 1,197
Net changes in items other than
shareholders’ equity
Total changes during the period - 96 9,582 1,100 10,779
Balance at the end of the period ¥ 5,000 ¥ 124 ¥ 122,952 ¥ (3,132) ¥ 124,944
Accumulated other comprehensive income
Total
net assets
Net unrealized
gains on
available-for-
sale securities,
net of taxes
Net foreign
currency
translation
adjustments
Remeasure-
ments of defined
benefit plans
Total accumulated
other
comprehensive
income
Balance at the beginning of the
period ¥ 57,475 ¥ 11,093 ¥ (1,908) ¥ 66,661 ¥ 180,826
Changes during the period
Dividends from retained
earnings (930)
Net income attributable to
owners of the parent 10,512
Disposal of treasury stock 1,197
Net changes in items other than
shareholders’ equity 4,002 (4,338) 637 302 302
Total changes during the period 4,002 (4,338) 637 302 11,081
Balance at the end of the period ¥ 61,478 ¥ 6,755 ¥ (1,270) ¥ 66,963 ¥ 191,907

The accompanying notes are an integral part of the statements.
7
The Toa Reinsurance Company, Limited and Subsidiaries
Consolidated Statement of Changes in Shareholders’ Equity, continued
For the years ended 31st March 2017 and 2016
(Thousands of U.S. dollars (Note 1(2)))
Shareholders’ equity
Capital stock Capital surplus Retained earnings Treasury stock
Total
shareholders’
equity
Balance at the beginning of the
period $ 44,567 $ 240 $ 1,010,517 $ (37,730) $ 1,017,604
Changes during the period
Dividends from retained
earnings (8,289) (8,289)
Net income attributable to
owners of the parent 93,698 93,698
Disposal of treasury stock 855 9,804 10,669
Net changes in items other than
shareholders’ equity
Total changes during the period - 855 85,408 9,804 96,078
Balance at the end of the period $ 44,567 $ 1,105 $ 1,095,926 $ (27,916) $ 1,113,682
Accumulated other comprehensive income
Total
net assets
Net unrealized
gains on
available-for-
sale securities,
net of taxes
Net foreign
currency
translation
adjustments
Remeasure-
ments of defined
benefit plans
Total accumulated
other
comprehensive
income
Balance at the beginning of the
period
$ 512,300
$ 98,876
$ (17,006)
$ 594,179
$ 1,611,783
Changes during the period
Dividends from retained
earnings
(8,289)
Net income attributable to
owners of the parent
93,698
Disposal of treasury stock 10,669
Net changes in items other than
shareholders’ equity
35,671
(38,666)
5,677
2,691
2,691
Total changes during the period 35,671 (38,666) 5,677 2,691 98,769
Balance at the end of the period $ 547,981 $ 60,210 $ (11,320) $ 596,871 $ 1,710,553

The accompanying notes are an integral part of the statements.
8
The Toa Reinsurance Company, Limited and Subsidiaries
Consolidated Statement of Changes in Shareholders’ Equity, continued
For the years ended 31st March 2017 and 2016
For the year ended 31st March 2016 (Millions of yen)
Shareholders’ equity
Capital stock Capital surplus Retained earnings Treasury stock
Total
shareholders’
equity
Balance at the beginning of the
period ¥ 5,000 ¥ 21 ¥ 108,346 ¥ (4,324) ¥ 109,043
Changes during the period
Dividends from retained
earnings (650) (650)
Net income attributable to
owners of the parent 5,674 5,674
Disposal of treasury stock 6 90 97
Net changes in items other than
shareholders’ equity
Total changes during the period - 6 5,024 90 5,121
Balance at the end of the period ¥ 5,000 ¥ 27 ¥ 113,370 ¥ (4,233) ¥ 114,165
Accumulated other comprehensive income
Total
net assets
Net unrealized
gains on
available-for-
sale securities,
net of taxes
Net foreign
currency
translation
adjustments
Remeasure-
ments of defined
benefit plans
Total accumulated
other
comprehensive
income
Balance at the beginning of the
period ¥ 78,661 ¥ 12,549 ¥ (920) ¥ 90,290 ¥ 199,334
Changes during the period
Dividends from retained
earnings (650)
Net income attributable to
owners of the parent 5,674
Disposal of treasury stock 97
Net changes in items other than
shareholders’ equity (21,185) (1,455) (988) (23,629) (23,629)
Total changes during the period (21,185) (1,455) (988) (23,629) (18,508)
Balance at the end of the period ¥ 57,475 ¥ 11,093 ¥ (1,908) ¥ 66,661 ¥ 180,826

The accompanying notes are an integral part of the statements.
9
The Toa Reinsurance Company, Limited and Subsidiaries
Consolidated Statement of Cash Flows
For the years ended 31st March 2017 and 2016
Millions of yen
Thousands of
U.S. dollars
(Note 1(2))
2017 2016 2017
Cash flows from operating activities
Income before income taxes ¥ 11,343 ¥ 9,659 $ 101,105
Depreciation and amortization 428 389 3,814
Increase (decrease) in outstanding claims (10,073) 4,992 (89,785)
Increase (decrease) in underwriting reserves 11,104 9,809 98,974
Increase (decrease) in allowance for doubtful accounts (1) (10) (8)
Increase (decrease) in accrued retirement benefits for directors 17 (29) 151
Increase (decrease) in accrued bonuses for employees (2) (11) (17)
Increase (decrease) in net defined benefit liabilities 933 21 8,316
Increase (decrease) in reserve for price fluctuation 2,663 (6) 23,736
Interest and dividends income (11,705) (14,366) (104,331)
Loss (gain) on securities (1,469) (2,854) (13,093)
Interest expenses 1,598 1,606 14,243
Foreign exchange loss (gain) 105 128 935
Loss (gain) on tangible fixed assets 15 2 133
Loss (gain) on money held in trust (38) 454 (338)
Decrease (increase) in other assets (other than investing and financing
activities) (3,103) (908) (27,658)
Increase (decrease) in other liabilities (other than investing and
financing activities) (880) 480 (7,843)
Others, net 261 214 2,326
Subtotal 1,199 9,574 10,687
Interest and dividends received 13,197 16,382 117,630
Interest paid (1,602) (1,602) (14,279)
Income taxes paid (1,858) (3,185) (16,561)
Net cash provided by (used in) operating activities 10,936 21,168 97,477
Cash flows from investing activities
Net decrease (increase) in deposits 141 12 1,256
Increase in money held in trust - (2,000) -
Purchases of securities (167,638) (159,989) (1,494,232)
Proceeds from sales or redemption of securities 159,829 144,265 1,424,627
Loans made - (37) -
Proceeds from collection of loans 117 8 1,042
Total of net cash provided by (used in) investment transactions (7,550) (17,740) (67,296)
Total of net cash provided by (used in) operating activities and
investment transactions 3,385 3,428 30,172
Purchase of tangible fixed assets (260) (165) (2,317)
Proceeds from sales of tangible fixed assets 6 1 53
Purchase of intangible fixed assets (700) (634) (6,239)
Net cash provided by (used in) investing activities (8,505) (18,539) (75,808)
Cash flows from financing activities
Dividends paid (930) (650) (8,289)
Repayment for lease liabilities (126) (105) (1,123)
Proceeds from disposal of treasury stock 1,197 97 10,669
Net cash provided by (used in) financing activities 140 (658) 1,247
Effect of exchange rate changes on cash and cash equivalents (792) (140) (7,059)
Net increase (decrease) in cash and cash equivalents 1,778 1,830 15,848
Cash and cash equivalents at the beginning of the period 22,832 21,001 203,511
Cash and cash equivalents at the end of the period (Note 9(1)) ¥ 24,611 ¥ 22,832 $ 219,368

10
The Toa Reinsurance Company, Limited and Subsidiaries
Notes to the Consolidated Financial Statements
1. Basis of Presenting the Consolidated Financial Statements
(1) The accompanying consolidated financial statements of The Toa Reinsurance Company, Limited (the
“Company”) and its subsidiaries (collectively, the “Companies”) are prepared on the basis of accounting
principles generally accepted in Japan, which are different in certain respects as to both application and
disclosure requirements of International Financial Reporting Standards, and are compiled from the
consolidated financial statements prepared by the Company as required by the Financial Instruments
and Exchange Act of Japan.
The consolidated financial statements are not intended to present the consolidated financial position,
results of operations and cash flows in accordance with accounting principles and practices generally
accepted in countries and jurisdictions other than Japan.
The accompanying consolidated financial statements incorporate certain reclassifications and
rearrangements in order to present them in a form that is more familiar to readers outside Japan.
(2) Amounts in U.S. dollars are included solely for the convenience of readers outside Japan. The rate of
¥112.19 = US$1, the rate of exchange on 31st March 2017, has been used in translation. The inclusion
of such amounts is not intended to imply that Japanese yen has been or could be readily converted,
realized or settled in U.S. dollars at this rate or any other rate.
(3) Fractional amounts of less than ¥1 million or $1 thousand have been rounded down. Accordingly, the
totals in yen and US dollars do not necessarily agree with the sum of the individual amounts.
2. Principal Matters for Preparation of Consolidated Financial Statements
(1) Scope of Consolidation
A. Consolidated Subsidiaries
Of the Company’s subsidiaries, two subsidiaries are consolidated. The names of the consolidated
subsidiaries are as follows:
The Toa Reinsurance Co. of America (U.S.A.)
The Toa 21st Century Reinsurance Co., Ltd. (Switzerland)
B. Non-consolidated Subsidiary
The other subsidiary is a small-scale operation, in terms of total assets, ordinary profit (loss), net
income (loss) for the year and retained earnings, and is excluded from the scope of consolidation,
due to its insignificant effect on the consolidated financial statements of the Company as a whole.
The name of the non-consolidated subsidiary is as follows:
Sundai Company, Limited.
(2) Application of the Equity Method
Since the effect of the non-consolidated subsidiary on the net income (loss) for the year and the retained
earnings is negligible and it is considered immaterial, this company is not accounted for by the equity
method.

11
(3) Fiscal Years of Consolidated Subsidiaries
The fiscal year ends of both consolidated subsidiaries are 31st December. Since the differences in the
fiscal year ends do not exceed three months, financial statements as of the fiscal year end of each
subsidiary are used in preparing the consolidated financial statements. As for significant transactions
occurring between that date and the date of the Company’s fiscal year end, necessary adjustments are
made upon consolidation.
(4) Significant Accounting Policies
A. Financial Instruments
(a) Stocks of Non-consolidated Subsidiaries not Accounted for by the Equity Method
Stocks of non-consolidated subsidiaries not accounted for by the equity method are recorded
at cost determined by the moving-average method.
(b) Securities
Available-for-sale securities with fair value are carried at fair value based on the prices
prevailing in the market on the balance sheet date and others. Unrealized gains or losses, net of
tax are included in a separate component of net assets. Cost of sales is calculated using cost
determined by the moving-average method. Available-for-sale securities extremely difficult to
measure fair value are recorded at cost or amortized cost determined by the moving-average
method.
(c) Money Held in Trust
Securities included in money held in trust are carried at fair value.
(d) Derivatives
Derivatives are carried at fair value.
B. Depreciation Method for Fixed Assets
(a) Tangible Fixed Assets (Except for Leased Assets)
Depreciation of tangible fixed assets (except for leased assets) held by the Company is
calculated by the declining balance method.
However, the depreciation of buildings (except for fixtures attached to buildings) acquired on
or after 1st April 1998, and the depreciation of fixtures attached to buildings and structures
acquired on or after 1st April 2016, are calculated by the straight-line method.
Depreciation of property and equipment held by consolidated subsidiaries is calculated by the
straight-line method.
(b) Intangible Fixed Assets (Except for Leased Assets)
Amortization of intangible fixed assets (except for leased assets) is calculated by the
straight-line method. Amortization of software for internal use is calculated by the straight-line
method over its estimated useful life (5 years).

12
(c) Leased Assets
Depreciation of leased assets held by the Company with regard to finance leases for which
ownership does not transfer to the lessees is calculated by the straight-line method over a
period up to the length of the relevant lease contracts with no residual value.
C. Accounting Policies for Major Reserves
(a) Allowance for Doubtful Accounts
The Company books an allowance for doubtful accounts, in accordance with the standard for
self-assessment of assets and rules for write-offs and provisions, as follows:
(i) For debts of debtors who are legally or formally bankrupt (due to bankruptcy, special
liquidation or suspension of service at clearing houses, etc.) or virtually bankrupt, a
reserve is provided based on the amount that remains after anticipated proceeds from the
disposal of collateral and the anticipated recovery of debt through guarantees are
deducted from the debt balances.
(ii) For debts of debtors who are likely to become bankrupt, a reserve is provided based on
the amount considered to be necessary to cover the amount that remains after anticipated
proceeds from the disposal of collateral and the anticipated recovery of debt through
guarantees are deducted from the debt balances. This reserve amount is based on an
overall judgment regarding the solvency status of each debtor.
(iii) For debts other than those described above, a reserve is provided for an amount
determined by multiplying debt balances by the default rate, which is computed based on
historical loan loss experience in certain previous period.
All debts are assessed by each asset management department of the Company in
accordance with the standard for self-assessment of assets. The allowance for doubtful
accounts mentioned above is computed based on the result of this assessment and rules
for write-offs and provisions. These results are audited by the Internal Audit Department
which is independent from each department.
(b) Accrued Retirement Benefits for Directors
Accrued retirement benefits for directors are provided on the basis of the estimated amounts to
be paid based on internally established rules at the end of the fiscal year.
(c) Reserve for Price Fluctuation
The Company books a reserve for price fluctuation in accordance with Article 115 of the
Insurance Business Law to provide for contingent losses caused by price fluctuation on stocks
and other investments.
D. Retirement Benefits
(a) Method of Attributing Expected Retirement Benefits to Periods
In calculating retirement benefit obligations, the method of attributing the expected retirement
benefits to periods is mainly based on the benefit formula method.

13
(b) Method for Amortizing Actuarial Differences and Prior Service Costs
The Company fully amortizes actuarial differences in the following fiscal year.
The consolidated subsidiaries amortize prior service costs using the straight-line method
over a certain period within the average remaining service period of employees at the time of
occurrence (9.4 years).
E. Hedge Accounting
The fair value hedge accounting and the assignment accounting are applied to certain forward
foreign exchange contracts utilized to hedge future foreign exchange risk associated with monetary
credits and debts, etc. denominated in foreign currencies. Assessment of hedge effectiveness is
omitted since the hedge is highly effective because the principal conditions of the hedging
instruments and the hedged items are identical, and meets the required conditions to apply the
assignment accounting.
F. Cash and Cash Equivalents
Cash and cash equivalents in the consolidated statement of cash flows comprise cash on hand,
deposits able to be withdrawn on demand and short-term investments such as time deposits with
original maturities of three months or less and which have minimal risk of fluctuation in value.
G. Other Significant Accounting Policies
Consumption Tax Accounting Treatment
Consumption tax is accounted for separately from the transactions subject to such tax. However,
the consumption tax on certain expenses, such as operating and general administrative expenses, is
included in those expenses. Non-deductible consumption tax on the purchase of assets is included
in “Rest of other assets” and amortized evenly over a period of five years.
3. Changes in Accounting Policies
In accordance with the amendment in the Corporation Tax Act, the Company has adopted the “Practical
Solution on a change in depreciation method due to Tax Reform 2016” (ASBJ Practical Issue Task Force No.
32, issued on 17th June 2016) from the year ended 31st March 2017, and has changed the depreciation
method for fixtures attached to buildings and structures acquired on or after 1st April 2016, from the
declining balance method to the straight-line method.
The effect of this change on the ordinary profit and income before income taxes for the year ended 31st
March 2017 is immaterial.
4. Additional Information
The Company has applied the “Implementation Guidance on Recoverability of Deferred Tax Assets” (ASBJ
Guidance No. 26, issued on 28th March 2016) from the year ended 31st March 2017.

14
5. Notes to the Consolidated Balance Sheet
(1) The amounts of accumulated depreciation and advanced depreciation of tangible fixed assets are as
follows:
Millions of yen
Thousands of
U.S. dollars
(Note 1(2))
2017 2016 2017
Accumulated depreciation ¥ 9,513 ¥ 9,422 $ 84,793
Advanced depreciation 29 29 258
(2) The carrying amounts of stocks of a non-consolidated subsidiary are as follows:
Millions of yen
Thousands of
U.S. dollars
(Note 1(2))
2017 2016 2017
Securities ¥ 10 ¥ 10 $ 89
(3) Impaired Loans
There is no balance of impaired loans, including loans to borrowers under bankruptcy proceedings,
overdue loans, loans past due for three months or more and loans with altered lending conditions, as of
31st March 2017 and 2016.
The definitions of impaired loans are as follows:
A. “Loans to borrowers under bankruptcy proceedings” are non-accrual loans (excluding loans written
off) which apply to circumstances as stated in Article 96, paragraph 1, subparagraph 3 or Article 96,
paragraph 1, subparagraph 4 of the Order for Enforcement of the Corporation Tax Act (Government
Ordinance No. 97, 1965) which have no prospects for recovery or repayment of principal or
interest because payment of principal or interest has not been received for a substantial period or
for other reasons.
B. “Overdue loans” are those loans on which accrued interest income has not been recognized,
excluding loans to borrowers under bankruptcy proceedings and excluding loans for which interest
payments have been rescheduled with the aim of providing restructuring assistance and support.
C. “Loans past due for three months or more” are those loans for which payments of principal or
interest has not been received for a period of three months or more, beginning with the next day
following the last due date for such payments, and are not included in loans to borrowers under
bankruptcy proceedings or overdue loans.
D. “Loans with altered lending conditions” are those loans for which the Company has provided more
favorable terms and conditions than those contained in the original loan agreement (including
reducing interest rates, rescheduling interest and principal payments, or the waiving of claims on
the borrowers) to the borrowers with the aim of providing restructuring assistance and support.
Such loans exclude loans to borrowers under bankruptcy proceedings, overdue loans and loans past
due for three months or more.
(4) The carrying amounts of assets pledged as collateral are as follows:
Millions of yen
Thousands of
U.S. dollars
(Note 1(2))
2017 2016 2017
Securities ¥ 29,466 ¥ 29,209 $ 262,643

15
These securities are pledged to deposit for overseas operations and to establish letters of credit.
(5) The amounts of securities lent under loan agreements are as follows:
Millions of yen
Thousands of
U.S. dollars
(Note 1(2))
2017 2016 2017
¥ 1,647 ¥ - $ 14,680
6. Notes to the Consolidated Statement of Income
(1) The significant components of business expenses are as follows:
Millions of yen
Thousands of
U.S. dollars
(Note 1(2))
2017 2016 2017
Commissions, net of reinsurance ceded ¥ 45,171 ¥ 44,325 $ 402,629
Business expenses are the total of “Operating and general administrative expenses” and “Commissions
and brokerage” in the consolidated statement of income.
7. Notes to the Consolidated Statement of Comprehensive Income
(1) Reclassification Adjustments and Income Tax Effects of Other Comprehensive Income
Millions of yen
Thousands of
U.S. dollars
(Note 1(2))
2017 2016 2017
Net unrealized gains (losses) on available-for-sale
securities, net of tax:
Gains (losses) arising during the period ¥ 6,909 ¥ (28,048) $ 61,583
Reclassification adjustments (1,447) (2,857) (12,897)
Before income tax effect adjustments 5,461 (30,906) 48,676
Income tax effects (1,459) 9,720 (13,004)
Net unrealized gains (losses) on available-for-sale
securities, net of tax 4,002 (21,185) 35,671
Net foreign currency translation adjustments:
Gains (losses) arising during the period (4,841) (3,846) (43,150)
Reclassification adjustments 1,063 1,623 9,474
Before income tax effect adjustments (3,778) (2,223) (33,675)
Income tax effects (559) 767 (4,982)
Net foreign currency translation adjustments (4,338) (1,455) (38,666)
Remeasurements of defined benefit plans, net of tax:
Gains (losses) arising during the period (56) (1,466) (499)
Reclassification adjustments 952 35 8,485
Before income tax effect adjustments 896 (1,430) 7,986
Income tax effects (258) 442 (2,299)
Remeasurements of defined benefit plans,
net of tax 637 (988) 5,677
Total other comprehensive income ¥ 302 ¥ (23,629) $ 2,691

16
8. Notes to the Consolidated Statement of Changes in Shareholders’ Equity
For the year ended 31st March 2017
(1) Detailed Information for Outstanding Shares and Treasury Stock
(Thousand shares)
Number of shares
as of 1st April
2016
Number of shares
increased during
the period
Number of shares
decreased during
the period
Number of shares
as of 31st March
2017
Outstanding shares
Common stock 100,000 - - 100,000
Total 100,000 - - 100,000
Treasury stock
Common stock 6,978 - 1,814 5,164
Total 6,978 - 1,814 5,164
The number of shares decreased during the period in common treasury stock is 1,814 thousand shares,
as a result of disposal by third party allotment.
(2) Detailed Information for Cash Dividends
Dividends paid
Type of
shares Total dividends
Dividend per
share
Dividend
record date Effective date
General meeting
of shareholders on
28th June 2016
Common
stock
¥930 million
$8,289 thousand
(Note 1(2))
¥10
$0.09 (Note 1(2)) 31st March 2016 29th June 2016
Of dividends with record date within the year ended 31st March 2017, dividends with the effective date
after 31st March 2017
Type of
shares Total dividends
Source of
dividends
Dividend per
share
Dividend
record date
Effective
date
General meeting
of shareholders on
29th June 2017
Common
stock
¥1,043 million
$9,296 thousand
(Note 1(2))
Retained
earnings
¥11
$0.10 (Note 1(2))
31st March
2017
30th June
2017
For the year ended 31st March 2016
(1) Detailed Information for Outstanding Shares and Treasury Stock
(Thousand shares)
Number of shares
as of 1st April
2015
Number of shares
increased during
the period
Number of shares
decreased during
the period
Number of shares
as of 31st March
2016
Outstanding shares
Common stock 100,000 - - 100,000
Total 100,000 - - 100,000
Treasury stock
Common stock 7,128 - 150 6,978
Total 7,128 - 150 6,978
The number of shares decreased during the period in common treasury stock is 150 thousand shares, as
a result of disposal by third party allotment.

17
(2) Detailed Information for Cash Dividends
Dividends paid
Type of shares Total dividends
Dividend
per share
Dividend
record date Effective date
General meeting
of shareholders on
26th June 2015
Common stock ¥650 million ¥7 31st March 2015 29th June 2015
Of dividends with record date within the year ended 31st March 2016, dividends with the effective date
after 31st March 2016
Type of
shares
Total
dividends
Source of
dividends
Dividend
per share
Dividend
record date
Effective
date
General meeting
of shareholders on
28th June 2016
Common
stock ¥930 million
Retained
earnings ¥10
31st March
2016
29th June
2016
9. Notes to the Consolidated Statement of Cash Flows
(1) Reconciliation of the balance of cash and cash equivalents at the end of the period to the amounts shown
in the consolidated balance sheet is as follows:
Millions of yen
Thousands of
U.S. dollars
(Note 1(2))
2017 2016 2017
Cash and deposits ¥ 12,684 ¥ 9,877 $ 113,058
Monetary receivables bought 5,999 2,999 53,471
Securities 564,544 561,795 5,032,034
Time deposits with original maturities of more than
three months (48) (189) (427)
Securities other than cash equivalents (558,568) (551,650) (4,978,768)
Cash and cash equivalents ¥ 24,611 ¥ 22,832 $ 219,368
(2) Cash flows from investing activities include those related to insurance business.
10. Financial Instruments
(1) Outline of Financial Instruments
A. Policy for Financial Instruments
The Company underwrites non-life reinsurance (such as Fire, Marine, Personal accident, Motor,
General liabilities reinsurance) and life reinsurance. The Company invests in financial instruments
paying attention to adequate safety, liquidity and profitability, as a funding source of the
reinsurance claims to be paid securely and promptly.
The Company maintains Enterprise Risk Management system to control investment risk, to keep
adequate solvency in case of the risk occurrence.
Additionally, in order to further strengthen financial foundation, the Company substantially
enhanced capital adequacy by issuing subordinated notes with an established equity content level
recognized by major rating companies.
18
B. Types of Financial Instruments and Related Risk
The Company holds financial instruments mainly for the purpose of investment and business
cooperation. Main components of the instruments are bonds, stocks and investment trust funds,
which are exposed to price risk due to market fluctuation (interest rate, foreign exchange rate and
stock price), and credit risk of the issuers.
Derivatives utilized by the Company are forward foreign exchange contracts. Forward foreign
exchange contracts are utilized for hedging fluctuation risk in future foreign exchange rates, arising
from foreign bonds. The hedge accounting is applied to certain forward foreign exchange contracts.
Additionally, derivatives applying the hedge accounting are described in “Principal Matters for
Preparation of Consolidated Financial Statements”.
Derivatives are only taken out with counterparties or referenced entities with a high credit rating.
Loans are exposed to credit risk due to breach of contracts.
Subordinated notes issued by the Company are exposed to market risk due to interest-rate
fluctuation.
C. Risk Management for Financial Instruments
The board of directors establishes risk management policies and internal rules for investment, and
defines risk management department to be responsible for risk managements, management
processes and management methodologies. The department in charge performs the risk
managements in accordance with the policies and the rules, and condition of the risk is reported to
the board regularly or properly, to enable the board to recognize the actual condition of the risk.
Foreign consolidated subsidiaries establish investment policies and manage the risk in accordance
with the policies, and hold investment committee and other meetings regularly to discuss condition
of risk management and future investment policies. The third party investment management
arrangements are made in accordance with the investment guidelines and compliance with the
guidelines is monitored.
As part of the audit for the risk management, Internal Audit Department performs internal audit
under its internal audit plan for the risk management mentioned above.
(a) Market risk management
(i) Interest rate risk management
The department in charge recognizes risk amount by “Value at Risk” (hereafter “VaR”),
sensitivity analysis for interest rate and other methods, and monitors the compliance with
the rules. Then it reports to the board regularly.
(ii) Foreign exchange risk management
The department in charge recognizes risk amount by VaR of foreign bonds, sensitivity
analysis and other methods, and monitors the compliance with the rules. In addition, the
department in charge of integrated risk management recognizes overall foreign exchange
risk amount (offsetting foreign currency assets and liabilities). Then they report to the
board regularly.

19
(iii) Price fluctuation risk management
The department in charge recognizes risk amount by VaR, sensitivity analysis for market
and other methods, and monitor the compliance with the rules. Then it reports to the
board regularly.
(b) Credit risk management
With respect to credit risk of bond issuer, the department in charge regularly recognizes
market environments, financial condition, credit information and fair value. For loans, the
department in charge performs credit management such as credit screening, requiring
collaterals and guarantees, on individual debtor basis.
Compliance with the rules is reported to the board regularly.
(c) Liquidity risk management
The Company performs management for liquidity risk by holding assets with adequate
liquidity, obtaining committed lines of credit from several financial institutions and others in
order to pay the reinsurance claims securely and promptly in addition to appropriate fund
management.
Liquidity risk is monitored by the department in charge, and reported to the board regularly.
D. Supplementary Explanation for the Fair Value of Financial Instruments.
The fair value of financial instruments includes market price and price measured reasonably by the
Company if market price is not available. Because measurement for price of financial instruments
depends on certain assumptions, the use of different assumptions could result in a different price.
(2) Fair Value of Financial Instruments
The carrying amount, fair value and unrealized gain (loss) of financial instruments as of 31st March
2017 and 2016 is as follows. Financial instruments extremely difficult to measure fair value are not
included in the table. Also please see note (b) below.
As of 31st March 2017 Millions of yen
Carrying
amount Fair value
Unrealized
gain (loss)
Cash and deposits ¥ 12,684 ¥ 12,684 ¥ -
Money held in trust 7,628 7,628 -
Securities
Available for sale 562,465 562,465 -
Total assets ¥ 582,779 ¥ 582,779 ¥ -
Corporate bonds ¥ 30,000 ¥ 30,028 ¥ 28
Total liabilities ¥ 30,000 ¥ 30,028 ¥ 28

20
Thousands of U.S. dollars (Note 1(2))
Carrying
amount Fair value
Unrealized
gain (loss)
Cash and deposits $ 113,058 $ 113,058 $ -
Money held in trust 67,991 67,991 -
Securities
Available for sale 5,013,503 5,013,503 -
Total assets $ 5,194,571 $ 5,194,571 $ -
Corporate bonds $ 267,403 $ 267,653 $ 249
Total liabilities $ 267,403 $ 267,653 $ 249
As of 31st March 2016 Millions of yen
Carrying
amount Fair value
Unrealized
gain (loss)
Cash and deposits ¥ 9,877 ¥ 9,877 ¥ -
Money held in trust 7,609 7,609 -
Securities
Available for sale 555,150 555,150 -
Total assets ¥ 572,638 ¥ 572,638 ¥ -
Corporate bonds ¥ 30,000 ¥ 30,192 ¥ 192
Total liabilities ¥ 30,000 ¥ 30,192 ¥ 192
(Notes)
(a) Measuring method for fair value of financial instruments
(i) Assets
Cash and deposits
Fair value of cash and deposits is deemed as book value since it is scheduled to be settled in a
short period of time and fair value approximates book value.
Money held in trust
Fair value of the financial instruments managed as trust asset is as follows. Fair value of
deposits is deemed as book value since it is scheduled to be settled in a short period of time
and fair value approximates book value. Fair value of stocks is based on market quoted price.
Fair value of bonds is based on market quoted price, price released by Japan Securities Dealers
Association, price quoted by counterparty financial institutions and the over-the-counter
average price released by the price vendors. Fair value of quoted derivative is based on market
quoted price.
Securities
Fair value of stocks is based on market quoted price. Fair value of bonds is based on market
quoted price, price released by Japan Securities Dealers Association, price quoted by
counterparty financial institutions and the over-the-counter average price released by the price
vendors. Fair value of investment trust funds is based on publicly announced price or unit
price provided by counterparty financial institutions. With respect to investment in partnership,
partnership’s property is measured at fair value if available, and then the part of the
Company’s share is recorded to balance sheet as fair value.

21
(ii) Liabilities
Corporate bonds
Fair value of corporate bonds is calculated by counterparty financial institutions as the amount
of future cash flow discounted at the risk free rate for the corresponding period, adding rates to
be considered the factors of market environment and other similar securities with an
established equity content level.
(b) Financial instruments extremely difficult to measure fair value are as follows and are not included in
“Securities” in the above table:
Millions of yen
Thousands of
U.S. dollars
(Note 1(2))
2017 2016 2017
Foreign bonds ¥ 2 ¥ 2 $ 17
Other securities - 4,601 -
Non-listed stocks 2,076 2,040 18,504
Total ¥ 2,078 ¥ 6,644 $ 18,522
Above mentioned financial instruments where there are no available market prices and extremely
difficult to measure fair value, are not subject to disclosure of fair value.
(c) The redemption schedules as of 31st March 2017 and 2016 for monetary receivables and
available-for-sale securities with maturities are as follows:
As of 31st March 2017 Millions of yen
Due in
1 year
or less
Due after
1 year
through
5 years
Due after
5 years
through
10 years
Due after
10 years
Deposits ¥ 12,684 ¥ - ¥ - ¥ -
Securities
Available-for-sale securities
with maturities
Government bonds 12,170 20,900 - -
Municipal bonds 650 1,948 - -
Corporate bonds 23,559 82,996 5,936 1,000
Foreign securities 29,589 101,434 67,516 68,725
Total ¥ 78,653 ¥ 207,279 ¥ 73,452 ¥ 69,725

22
Thousands of U.S. dollars (Note 1(2))
Due in
1 year
or less
Due after
1 year
through
5 years
Due after
5 years
through
10 years
Due after
10 years
Deposits $ 113,058 $ - $ - $ -
Securities
Available-for-sale securities
with maturities
Government bonds 108,476 186,291 - -
Municipal bonds 5,793 17,363 - -
Corporate bonds 209,991 739,780 52,910 8,913
Foreign securities 263,740 904,126 601,800 612,576
Total $ 701,069 $ 1,847,571 $ 654,710 $ 621,490
As of 31st March 2016
Millions of yen
Due in
1 year
or less
Due after
1 year
through
5 years
Due after
5 years
through
10 years
Due after
10 years
Deposits ¥ 9,877 ¥ - ¥ - ¥ -
Securities
Available-for-sale securities
with maturities
Government bonds 21,310 29,470 3,600 -
Municipal bonds 2,200 2,262 - -
Corporate bonds 21,584 72,846 4,063 400
Foreign securities 33,630 107,622 63,140 59,342
Total ¥ 88,602 ¥ 212,201 ¥ 70,803 ¥ 59,742
(d) The repayment schedules as of 31st March 2017 and 2016 for corporate bonds are as follows:
As of 31st March 2017
(Millions of yen)
Due in
1 year
or less
Due after
1 year
through
2 years
Due after
2 years
through
3 years
Due after
3 years
through
4 years
Due after
4 years
through
5 years
Due after
5 years
Corporate bonds ¥ 30,000 - - - - -
(Thousands of U.S. dollars (Note 1(2)))
Due in
1 year
or less
Due after
1 year
through
2 years
Due after
2 years
through
3 years
Due after
3 years
through
4 years
Due after
4 years
through
5 years
Due after
5 years
Corporate bonds $ 267,403 - - - - -
As of 31st March 2016
(Millions of yen)
Due in
1 year
or less
Due after
1 year
through
2 years
Due after
2 years
through
3 years
Due after
3 years
through
4 years
Due after
4 years
through
5 years
Due after
5 years
Corporate bonds - - - - - ¥ 30,000
23
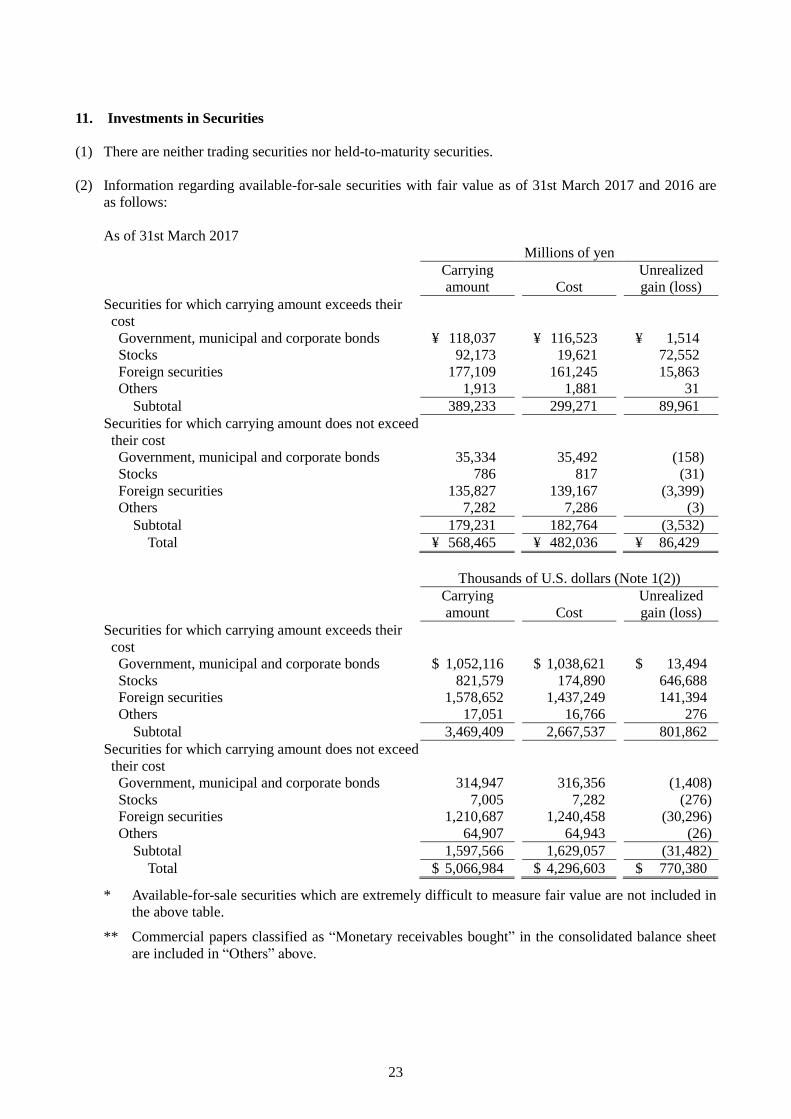
11. Investments in Securities
(1) There are neither trading securities nor held-to-maturity securities.
(2) Information regarding available-for-sale securities with fair value as of 31st March 2017 and 2016 are
as follows:
As of 31st March 2017
Millions of yen
Carrying
amount Cost
Unrealized
gain (loss)
Securities for which carrying amount exceeds their
cost
Government, municipal and corporate bonds ¥ 118,037 ¥ 116,523 ¥ 1,514
Stocks 92,173 19,621 72,552
Foreign securities 177,109 161,245 15,863
Others 1,913 1,881 31
Subtotal 389,233 299,271 89,961
Securities for which carrying amount does not exceed
their cost
Government, municipal and corporate bonds 35,334 35,492 (158)
Stocks 786 817 (31)
Foreign securities 135,827 139,167 (3,399)
Others 7,282 7,286 (3)
Subtotal 179,231 182,764 (3,532)
Total ¥ 568,465 ¥ 482,036 ¥ 86,429
Thousands of U.S. dollars (Note 1(2))
Carrying
amount Cost
Unrealized
gain (loss)
Securities for which carrying amount exceeds their
cost
Government, municipal and corporate bonds $ 1,052,116 $ 1,038,621 $ 13,494
Stocks 821,579 174,890 646,688
Foreign securities 1,578,652 1,437,249 141,394
Others 17,051 16,766 276
Subtotal 3,469,409 2,667,537 801,862
Securities for which carrying amount does not exceed
their cost
Government, municipal and corporate bonds 314,947 316,356 (1,408)
Stocks 7,005 7,282 (276)
Foreign securities 1,210,687 1,240,458 (30,296)
Others 64,907 64,943 (26)
Subtotal 1,597,566 1,629,057 (31,482)
Total $ 5,066,984 $ 4,296,603 $ 770,380
* Available-for-sale securities which are extremely difficult to measure fair value are not included in
the above table.
** Commercial papers classified as “Monetary receivables bought” in the consolidated balance sheet
are included in “Others” above.

24
As of 31st March 2016
Millions of yen
Carrying
amount Cost
Unrealized
gain (loss)
Securities for which carrying amount exceeds their
cost
Government, municipal and corporate bonds ¥ 152,116 ¥ 148,556 ¥ 3,559
Stocks 77,363 17,323 60,039
Foreign securities 218,190 196,923 21,266
Others 438 437 1
Subtotal 448,108 363,240 84,867
Securities for which carrying amount does not exceed
their cost
Government, municipal and corporate bonds 10,188 10,271 (82)
Stocks 2,101 2,266 (165)
Foreign securities 92,828 96,428 (3,599)
Others 4,923 4,976 (52)
Subtotal 110,042 113,942 (3,900)
Total ¥ 558,150 ¥ 477,183 ¥ 80,967
* Available-for-sale securities which are extremely difficult to measure fair value are not included in
the above table.
** Commercial papers classified as “Monetary receivables bought” in the consolidated balance sheet
are included in “Others” above.
(3) Sales of securities classified as available-for-sale and the aggregate gain and loss are as follows:
Millions of yen
Thousands of
U.S. dollars
(Note 1(2))
2017 2016 2017
Proceeds from sales
Government, municipal and corporate bonds ¥ 15,286 ¥ 2,208 $ 136,251
Stocks 155 2,241 1,381
Foreign securities 83,122 65,145 740,903
Others 445 - 3,966
Total ¥ 99,010 ¥ 69,594 $ 882,520
Gain on sales
Government, municipal and corporate bonds ¥ 995 ¥ 615 $ 8,868
Stocks 23 229 205
Foreign securities 4,456 5,817 39,718
Others - - -
Total ¥ 5,476 ¥ 6,662 $ 48,810
Loss on sales
Government, municipal and corporate bonds ¥ 137 ¥ - $ 1,221
Stocks 67 83 597
Foreign securities 3,540 2,942 31,553
Others 53 - 472
Total ¥ 3,800 ¥ 3,026 $ 33,871

25
(4) Securities for which impairment losses are recognized
For the year ended 31st March 2017, consolidated subsidiaries recognized impairment losses regarding
available-for-sale securities with fair value (Foreign securities) in the amount of ¥150 million ($1,337
thousand) in the consolidated statement of income.
For the year ended 31st March 2016, consolidated subsidiaries recognized impairment losses regarding
available-for-sale securities with fair value (Foreign securities) in the amount of ¥668 million in the
consolidated statement of income.
In principle, impairment losses on available-for-sale securities with fair value held by the Company are
recognized when the fair value has declined by 30% or more of their book value. Impairment losses on
available-for-sale securities with fair value held by consolidated subsidiaries are recognized when the
fair value has declined below their book value and the decline in fair value is deemed to be other than
temporary.
12. Money Held in Trust
(1) Money Held in Trust for Trading Purposes
Millions of yen
Thousands of
U.S. dollars
(Note 1(2))
2017 2016 2017
Net unrealized gains (losses) recognized for
the fiscal year ¥ 307 ¥ (355) $ 2,736
(2) Money Held in Trust for Being Held to Maturity
None.
(3) Money Held in Trust Not for Trading Purposes or Not Being Held to Maturity
None.
13. Derivatives
None.
14. Retirement Benefits
(1) Outline of Retirement Benefit Plans
The Company and consolidated subsidiaries have funded and unfunded defined retirement benefit plans
covering substantially all employees.
For defined benefit retirement plans, the benefit based on an employee’s salary and years of service are
paid in the form of lump-sum payment and pension.
For lump-sum payment retirement plans which are all unfunded plans, the benefit based on an
employee’s salary and years of service are paid in the form of lump-sum payment.

26
(2) Defined Benefit Plan
A. Changes in the retirement benefit obligations during the period
Millions of yen
Thousands of
U.S. dollars
(Note 1(2))
2017 2016 2017
Retirement benefit obligations at the beginning of
the period ¥ 16,384 ¥ 14,466 $ 146,037
Service cost 669 670 5,963
Interest cost 342 384 3,048
Actuarial differences 146 1,247 1,301
Benefit paid (359) (384) (3,199)
Others (222) 0 (1,978)
Retirement benefit obligations at the end of the
period ¥ 16,961 ¥ 16,384 $ 151,181
B. Changes in the plan assets during the period
Millions of yen
Thousands of
U.S. dollars
(Note 1(2))
2017 2016 2017
Plan assets at the beginning of the period ¥ 8,193 ¥ 7,728 $ 73,027
Expected return on plan assets 244 254 2,174
Actuarial differences 19 (219) 169
Employer contributions 723 746 6,444
Benefit paid (295) (317) (2,629)
Others (79) 1 (704)
Plan assets at the end of the period ¥ 8,805 ¥ 8,193 $ 78,482
C. Reconciliations of retirement benefit obligations and plan assets to net defined benefit liabilities
and assets recognized in the consolidated balance sheet at the end of the period
Millions of yen
Thousands of
U.S. dollars
(Note 1(2))
2017 2016 2017
Retirement benefit obligations for funded plan ¥ 13,964 ¥ 13,503 $ 124,467
Plan assets (8,805) (8,193) (78,482)
5,159 5,309 45,984
Retirement benefit obligations for unfunded plan 2,996 2,881 26,704
Net amount of liabilities (assets) recognized in
the consolidated balance sheet ¥ 8,156 ¥ 8,191 $ 72,698
Net defined benefit liabilities ¥ 8,156 ¥ 8,191 $ 72,698
Net amount of liabilities and assets recognized in
the consolidated balance sheet ¥ 8,156 ¥ 8,191 $ 72,698

27
D. Components of retirement benefit cost
Millions of yen
Thousands of
U.S. dollars
(Note 1(2))
2017 2016 2017
Service cost ¥ 669 ¥ 670 $ 5,963
Interest cost 342 384 3,048
Expected return on plan assets (244) (254) (2,174)
Amortization of actuarial differences 952 34 8,485
Amortization of prior service costs 0 2 0
Retirement benefit cost for defined benefit plan ¥ 1,720 ¥ 835 $ 15,331
E. Remeasurements of defined benefit plans included in other comprehensive income
Components of remeasurements of defined benefit plans included in other comprehensive income
before tax effect are as follows:
Millions of yen
Thousands of
U.S. dollars
(Note 1(2))
2017 2016 2017
Prior service costs ¥ 0 ¥ 2 $ 0
Actuarial differences 824 (1,433) 7,344
Others 71 1 632
Total ¥ 896 ¥ (1,430) $ 7,986
F. Remeasurements of defined benefit plans included in accumulated other comprehensive income
Components of remeasurements of defined benefit plans included in accumulated other
comprehensive income before tax effect are as follows:
Millions of yen
Thousands of
U.S. dollars
(Note 1(2))
2017 2016 2017
Unrecognized prior service costs ¥ - ¥ (0) $ -
Unrecognized actuarial differences (1,957) (2,853) (17,443)
Total ¥ (1,957) ¥ (2,854) $ (17,443)
G. Plan assets
(a) Major Components of plan assets
Percentages of total plan assets by major categories are as follows:
2017 2016
Bonds 23% 22%
Stocks 13 12
General accounts 63 64
Others 1 2
Total 100% 100%

28
(b) Determination of long-term expected rate of return
The long-term expected rate of return on plan assets has been estimated based on the current
and anticipated allocation to each asset class and the current and anticipated long-term rates of
returns on assets held in each category.
H. Actuarial assumptions
Major actuarial assumptions (based on weighted average) are as follows:
2017 2016
Discount rate Mainly 0.6% Mainly 0.6% Long-term expected rate of return Mainly 1.6% Mainly 1.5%
15. Deferred Tax
(1) Major Components of Net Deferred Tax Assets
Millions of yen
Thousands of
U.S. dollars
(Note 1(2))
2017 2016 2017
Deferred tax assets
Underwriting reserves ¥ 32,867 ¥ 30,250 $ 292,958
Outstanding claims 11,392 12,875 101,542
Tax loss carryforwards 9,904 12,756 88,278
Reserve for price fluctuation 2,991 2,245 26,660
Net defined benefit liabilities 2,621 2,625 23,362
Others 3,465 3,646 30,885
Subtotal of deferred tax assets 63,242 64,399 563,704
Valuation allowance (2,663) (4,908) (23,736)
Total deferred tax assets 60,579 59,491 539,967
Deferred tax liabilities
Net unrealized gains on available-for-sale securities (24,950) (23,491) (222,390)
Others (2,017) (1,569) (17,978)
Total deferred tax liabilities (26,968) (25,061) (240,377)
Net deferred tax assets ¥ 33,610 ¥ 34,430 $ 299,581
(2) The reconciliation of the statutory income tax rate to the effective income tax rate for the years ended
31st March 2017 and 2016 is as follows:
2017 2016
Effective statutory income tax rate of the Company 28.2% 28.9%
(Adjustments)
Valuation allowance (19.8) (1.0)
Effect of changes in the tax rate - 16.0
Non-taxable revenue such as dividends received (20.8) (25.8)
Elimination of dividends received from consolidated subsidiaries 14.5 17.8
Undistributed profits of foreign subsidiaries, etc. 2.8 2.5
Others 2.4 2.9
Effective income tax rate of the Companies 7.3% 41.3%

29
16. Segment Information
(1) Outline of Reportable Segments
The Companies’ reportable segments are components of the Companies about which separate financial
information is available that is evaluated regularly by the management in deciding how to allocate
resources and in assessing performance.
Our reportable segments are “The Toa Reinsurance Company, Limited (hereinafter Toa)”, “The Toa
Reinsurance Co. of America (TRA)” and “The Toa 21st Century Reinsurance Co., Ltd (TTFC)”.
The Companies’ business is assuming reinsurance, and within the company TRA is in charge of North
America area, Toa and TTFC are in charge of others in the main.
(2) Measurement of Sales, Profit or Loss, Assets, Liabilities, and Other Items for Each Reportable Segment
Accounting policies of each reported segment are in a manner consistent with that in the “Principal
Matters for Preparation of Consolidated Financial Statements”
Profit of each reportable segment shown in the following table represents “Net income attributable to
owners of the parent”.
Inter-segment revenues are measured on the basis of market transactions on arm’s length terms.
(3) Information about Sales, Profit or Loss, Assets, Liabilities, and Other Items on Each Reportable
Segment
For the year ended 31st March 2017
(Millions of yen)
Reportable segments
Toa TRA TTFC Total
Sales
Sales to external customers ¥ 172,418 ¥ 51,437 ¥ (106) ¥ 223,749
Inter-segment sales or transfers 2,551 (7,849) 5,288 (9)
Total 174,970 43,588 5,182 223,740
Profit by reportable segments 11,066 2,773 2,051 15,891
Assets by reportable segments 507,469 210,492 49,747 767,708
Liabilities by reportable segments 380,341 128,810 8,482 517,634
Other items
Depreciation 353 75 - 428
Interest and dividends income 11,662 5,192 671 17,526
Interest expenses 1,598 - - 1,598
Extraordinary income 1 - - 1
Gain on disposal of fixed assets 1 - - 1
Extraordinary loss 2,679 1 - 2,680
Loss on disposal of fixed assets 16 1 - 17
Reversal of reserve under the
special law 2,663 - - 2,663
Income tax expense (628) 740 703 815

30
(Thousands of U.S. dollars (Note 1(2)))
Reportable segments
Toa TRA TTFC Total
Sales
Sales to external customers $ 1,536,839 $ 458,481 $ (944) $ 1,994,375
Inter-segment sales or transfers 22,738 (69,961) 47,134 (80)
Total 1,559,586 388,519 46,189 1,994,295
Profit by reportable segments 98,636 24,716 18,281 141,643
Assets by reportable segments 4,523,299 1,876,210 443,417 6,842,927
Liabilities by reportable segments 3,390,150 1,148,141 75,603 4,613,904
Other items
Depreciation 3,146 668 - 3,814
Interest and dividends income 103,948 46,278 5,980 156,217
Interest expenses 14,243 - - 14,243
Extraordinary income 8 - - 8
Gain on disposal of fixed assets 8 - - 8
Extraordinary loss 23,879 8 - 23,888
Loss on disposal of fixed assets 142 8 - 151
Reversal of reserve under the
special law 23,736 - - 23,736
Income tax expense (5,597) 6,595 6,266 7,264
* Sales represent “Net premiums written”.
For the year ended 31st March 2016
(Millions of yen)
Reportable segments
Toa TRA TTFC Total
Sales
Sales to external customers ¥ 171,620 ¥ 52,249 ¥ (83) ¥ 223,786
Inter-segment sales or transfers 2,012 (8,207) 5,676 (518)
Total 173,632 44,042 5,592 223,267
Profit by reportable segments 2,191 6,773 2,807 11,772
Assets by reportable segments 491,993 213,601 51,920 757,514
Liabilities by reportable segments 382,319 125,748 9,379 517,447
Other items
Depreciation 313 75 - 389
Interest and dividends income 13,722 5,792 801 20,316
Interest expenses 1,606 - - 1,606
Extraordinary income 8 - - 8
Reversal of reserve under the
special law 6 - - 6
Extraordinary loss 3 - - 3
Loss on disposal of fixed assets 3 - - 3
Income tax expense 1,087 2,685 738 4,511
* Sales represent “Net premiums written”.

31
(4) Reconciliations of Total Reportable Segments Amount to Amount Presented in Financial Statements and
Descriptions of Reconciliations
A. Sales
Millions of yen
Thousands of
U.S. dollars
(Note 1(2))
2017 2016 2017
Total of reportable segments ¥ 223,740 ¥ 223,267 $ 1,994,295
Elimination of inter-segment transactions 9 518 80
Sales in consolidated financial statements ¥ 223,749 ¥ 223,786 $ 1,994,375
* Sales represent “Net premiums written”.
B. Profit
Millions of yen
Thousands of
U.S. dollars
(Note 1(2))
2017 2016 2017
Total of reportable segments ¥ 15,891 ¥ 11,772 $ 141,643
Elimination of inter-segment transactions (5,378) (6,097) (47,936)
Net income attributable to owners of the parent
in consolidated financial statements ¥ 10,512 ¥ 5,674 $ 93,698
C. Assets
Millions of yen
Thousands of
U.S. dollars
(Note 1(2))
2017 2016 2017
Total of reportable segments ¥ 767,708 ¥ 757,514 $ 6,842,927
Elimination of inter-segment transactions (69,290) (69,272) (617,612)
Total assets in consolidated financial statements ¥ 698,418 ¥ 688,242 $ 6,225,314
D. Liabilities
Millions of yen
Thousands of
U.S. dollars
(Note 1(2))
2017 2016 2017
Total of reportable segments ¥ 517,634 ¥ 517,447 $ 4,613,904
Elimination of inter-segment transactions (11,123) (10,031) (99,144)
Total liabilities in consolidated financial
statements ¥ 506,510 ¥ 507,416 $ 4,514,751

32
E. Other items
Millions of yen
Thousands of
U.S. dollars
(Note 1(2))
2017 2016 2017
Interest and dividends income
Total of reportable segments ¥ 17,526 ¥ 20,316 $ 156,217
Adjustments* (5,821) (5,950) (51,885)
Amounts in consolidated financial
statements ¥ 11,705 ¥ 14,366 $ 104,331
Income tax expense
Total of reportable segments ¥ 815 ¥ 4,511 $ 7,264
Adjustments* 15 (525) 133
Amounts in consolidated financial
statements ¥ 831 ¥ 3,985 $ 7,407
* Adjustment represents “elimination of inter-segment transactions”.
(5) Related Information
For the year ended 31st March 2017
A. Information about revenue derived from its products or services (Millions of yen)
Fire Marine Personal Accident Motor
General Liabilities Life Others Total
Sales to external customers
¥65,442 ¥8,730 ¥1,866 ¥28,101 ¥29,407 ¥70,931 ¥19,268 ¥223,749
(Thousands of U.S. dollars (Note 1(2)))
Fire Marine Personal Accident Motor
General Liabilities Life Others Total
Sales to external customers
$583,314 $77,814 $16,632 $250,476 $262,117 $632,239 $171,744 $1,994,375
* Sales represent “Net premiums written”.
B. Information by geographic area
(a) Sales
(Millions of yen)
Japan United States Others Total
¥ 125,254 ¥ 65,629 ¥ 32,865 ¥ 223,749
(Thousands of U.S. dollars (Note 1(2)))
Japan United States Others Total
$ 1,116,445 $ 584,980 $ 292,940 $ 1,994,375
* Sales are classified by country based on the geographic area of customers.
** Sales represent “Net premiums written”.

33
(b) Tangible fixed assets
(Millions of yen)
Japan Others Total
¥ 9,318 ¥ 1,010 ¥ 10,329
(Thousands of U.S. dollars (Note 1(2)))
Japan Others Total
$ 83,055 $ 9,002 $ 92,067
C. Information about major customers
None.
For the year ended 31st March 2016
A. Information about revenue derived from its products or services (Millions of yen)
Fire Marine Personal Accident Motor
General Liabilities Life Others Total
Sales to external customers
¥69,918 ¥9,447 ¥11,467 ¥23,434 ¥30,459 ¥62,168 ¥16,890 ¥223,786
* Sales represent “Net premiums written”.
B. Information by geographic area
(a) Sales
(Millions of yen)
Japan United States Others Total
¥ 111,895 ¥ 65,892 ¥ 45,999 ¥ 223,786
* Sales are classified by country based on the geographic area of customers.
** Sales represent “Net premiums written”.
(b) Tangible fixed assets
(Millions of yen)
Japan Others Total
¥ 9,295 ¥ 1,075 ¥ 10,371
C. Information about major customers
None.
(6) Information about Impairment Losses on Fixed Assets by Reportable Segments
None.
(7) Information about Amortization of Goodwill and Carrying Amount by Reportable Segments
None.
(8) Information about Gains on Negative Goodwill by Reportable Segments
None.
34
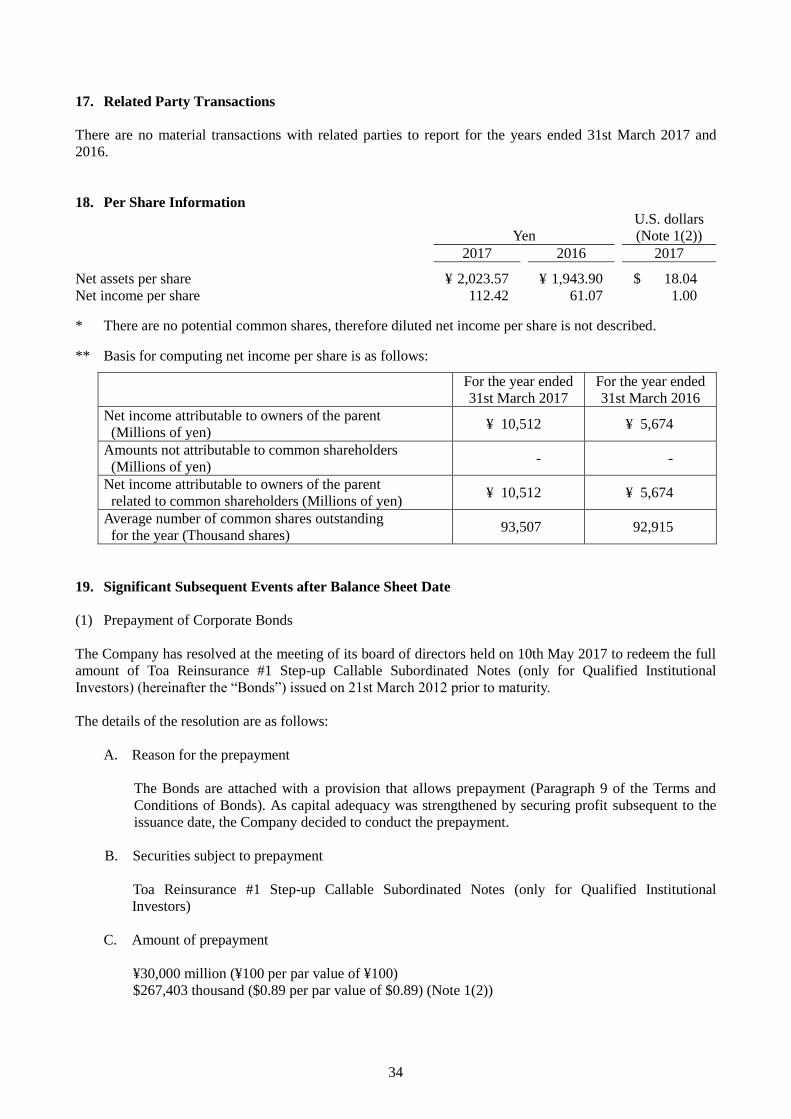
17. Related Party Transactions
There are no material transactions with related parties to report for the years ended 31st March 2017 and
2016.
18. Per Share Information
Yen
U.S. dollars
(Note 1(2))
2017 2016 2017
Net assets per share ¥ 2,023.57 ¥ 1,943.90 $ 18.04
Net income per share 112.42 61.07 1.00 * There are no potential common shares, therefore diluted net income per share is not described. ** Basis for computing net income per share is as follows:
For the year ended
31st March 2017
For the year ended
31st March 2016
Net income attributable to owners of the parent
(Millions of yen) ¥ 10,512 ¥ 5,674
Amounts not attributable to common shareholders
(Millions of yen) - -
Net income attributable to owners of the parent
related to common shareholders (Millions of yen) ¥ 10,512 ¥ 5,674
Average number of common shares outstanding
for the year (Thousand shares) 93,507 92,915
19. Significant Subsequent Events after Balance Sheet Date
(1) Prepayment of Corporate Bonds
The Company has resolved at the meeting of its board of directors held on 10th May 2017 to redeem the full
amount of Toa Reinsurance #1 Step-up Callable Subordinated Notes (only for Qualified Institutional
Investors) (hereinafter the “Bonds”) issued on 21st March 2012 prior to maturity.
The details of the resolution are as follows:
A. Reason for the prepayment
The Bonds are attached with a provision that allows prepayment (Paragraph 9 of the Terms and
Conditions of Bonds). As capital adequacy was strengthened by securing profit subsequent to the
issuance date, the Company decided to conduct the prepayment.
B. Securities subject to prepayment
Toa Reinsurance #1 Step-up Callable Subordinated Notes (only for Qualified Institutional
Investors)
C. Amount of prepayment
¥30,000 million (¥100 per par value of ¥100)
$267,403 thousand ($0.89 per par value of $0.89) (Note 1(2))
35
D. Date of prepayment
20th July 2017
E. Method of prepayment
Prepayment of the full amount of the outstanding balance
F. Funding of repayment
Repayment entirely by the Company’s own funds
G. Expected decrease in interest expenses resulting from repayment
¥1,543 million per annum
$13,753 thousand per annum (Note 1(2))
(2) Repurchase of Treasury Stock
The Company has resolved at its general shareholders’ meeting held on 29th June 2017 to repurchase the
treasury stock from certain shareholders pursuant to provisions of Article 156, paragraph 1 and Article 160,
paragraph 1 of the Companies Act.
Upon receiving an inquiry from some shareholders that they wish to sell the Company’s stock they hold, the
Company comprehensively considered factors such as the volume of the stock subject to repurchase, the
peculiarity of the Company’s business and changes in the business environment, and determined to conduct a
repurchase of treasury stock via negotiated transaction.
Details of the repurchase resolved at the general shareholders’ meeting are as follows:
A. Type of shares subject to repurchase
Common stock
B. Total number of shares to be repurchased
4,960,000 shares (maximum)
C. Total amount of shares to be repurchased:
¥3,799 million (maximum)
$33,862 thousand (maximum) (Note 1(2))
D. Repurchase period
From 29th June 2017 to 31st March 2018

36
The Toa Reinsurance Company, Limited and Subsidiaries
Related Information to the Consolidated Financial Statements
1. Detailed Information for Corporate Bonds
Issuer Series Issue Date
As of
1st April
2016
As of
31st March
2017
Coupon
(%) Collateral Maturity
The Toa
Reinsurance
Company,
Limited
Toa Reinsurance #1
Step-up Callable
Subordinated Notes
(only for Qualified
Institutional Investors)
21st March
2012
¥30,000 million
$267,403 thousand
(Note 1(2))
¥30,000 million
(¥30,000 million)
$267,403 thousand
(Note 1(2))
5.34 None 20th July
2062
(Notes)
(1) The figures denoted within ( ) in the columns for the balances as of 31st March 2017 are the amounts
of corporate bonds to be redeemed within 1 year.
(2) Principal amounts to be redeemed within 5 years following the consolidated balance sheet date are as
follows: (Millions of yen)
Due in 1 year
or less
Due after 1 year
through 2 years
Due after 2 years
through 3 years
Due after 3 years
through 4 years
Due after 4 years
through 5 years
¥ 30,000 - - - -
(Thousands of U.S. dollars (Note 1(2)))
Due in 1 year
or less
Due after 1 year
through 2 years
Due after 2 years
through 3 years
Due after 3 years
through 4 years
Due after 4 years
through 5 years
$ 267,403 - - - -

37
2. Detailed Information for Borrowings (Millions of yen)
As of
1st April
2016
As of
31st March
2017
Average
interest rate
(%)
The term of
repayment
Lease liabilities due in 1 year or less ¥ 103 ¥ 84 - -
Lease liabilities (except for those due in 1 year or
less) 101 111 -
From 8th April 2018
to 31st July 2022
Total ¥ 204 ¥ 196 - -
(Thousands of U.S. dollars (Note 1(2)))
As of
1st April
2016
As of
31st March
2017
Average
interest rate
(%)
The term of
repayment
Lease liabilities due in 1 year or less $ 918 $ 748 - -
Lease liabilities (except for those due in 1 year or
less) 900 989 -
From 8th April 2018
to 31st July 2022
Total $ 1,818 $ 1,747 - -
(Notes)
(1) The above amount is included in “Other liabilities” in the consolidated balance sheet.
(2) “Average interest rate” on lease liabilities is not stated above because lease liabilities in the consolidated
balance sheet are recognized without deducting lease interest included in the total lease charges.
(3) The repayment for the lease liabilities (except for those due in 1 year or less) scheduled within 5 years
following the consolidated balance sheet date are as follows: (Millions of yen)
Due after 1 year
through 2 years
Due after 2 years
through 3 years
Due after 3 years
through 4 years
Due after 4 years
through 5 years
Lease liabilities ¥ 57 ¥ 39 ¥ 10 ¥ 4
(Thousands of U.S. dollars (Note 1(2)))
Due after 1 year
through 2 years
Due after 2 years
through 3 years
Due after 3 years
through 4 years
Due after 4 years
through 5 years
Lease liabilities $ 508 $ 347 $ 89 $ 35
3. Detailed Information for Asset Retirement Obligations
None.