the timing of pigmentation lightening in europeans - good
DESCRIPTION
Interesting findings.TRANSCRIPT

The Timing of Pigmentation Lightening in Europeans
Sandra Beleza,*,y,1 Antonio M. Santos,2,3 Brian McEvoy,4 Isabel Alves,z,1 Claudia Martinho,§,1
Emily Cameron,5 Mark D. Shriver,6 Esteban J. Parra,5 and Jorge Rocha*,1,2,3
1IPATIMUP, Instituto de Patologia e Imunologia Molecular da Universidade do Porto, Porto, Portugal2CIBIO, Centro de Investigacao em Biodiversidade e Recursos Geneticos da Universidade do Porto, Vairao, Portugal3Departamento de Biologia, Faculdade de Ciencias da Universidade do Porto, Porto, Portugal4Department of Statistical Genetics, Queensland Institute of Medical Research, Brisbane, Queensland, Australia5Department of Anthropology, University of Toronto at Mississauga, Ontario, Canada6Department of Anthropology, Pennsylvania State UniversityyPresent address: Department of Genetics, Stanford UniversityzPresent address: Computational and Molecular Population Genetics Lab, Institute of Ecology and Evolution, University of Bern,
Switzerland§Present address: Plant Stress Signaling Unit, Instituto Gulbenkian de Ciencia, Oeiras, Portugal
*Corresponding author: E-mail: [email protected]; [email protected].
Associate editor: Matthew Hahn
Abstract
The inverse correlation between skin pigmentation and latitude observed in human populations is thought to have been shapedby selective pressures favoring lighter skin to facilitate vitamin D synthesis in regions far from the equator. Several candidate genesfor skin pigmentation have been shown to exhibit patterns of polymorphism that overlap the geospatial variation in skin color.However, little work has focused on estimating the time frame over which skin pigmentation has changed and on the intensity ofselection acting on different pigmentation genes. To provide a temporal framework for the evolution of lighter pigmentation, weused forward Monte Carlo simulations coupled with a rejection sampling algorithm to estimate the time of onset of selectivesweeps and selection coefficients at four genes associated with this trait in Europeans: KITLG, TYRP1, SLC24A5, and SLC45A2.Using compound haplotype systems consisting of rapidly evolving microsatellites linked to one single-nucleotide polymorphismin each gene, we estimate that the onset of the sweep shared by Europeans and East Asians at KITLG occurred approximately30,000 years ago, after the out-of-Africa migration, whereas the selective sweeps for the European-specific alleles at TYRP1,SLC24A5, and SLC45A2 started much later, within the last 11,000–19,000 years, well after the first migrations of modern humansinto Europe. We suggest that these patterns were influenced by recent increases in size of human populations, which favored theaccumulation of advantageous variants at different loci.
Key words: pigmentation genes, age of selection, selection coefficient, European populations.
IntroductionThe well-known correlation between skin pigmentation anddistance from the equator (Relethford 1997) strongly suggeststhat natural selection in response to environmental factorsplayed a major role in the geospatial patterning of human skinpigmentation variation. Decreased incident ultraviolet radi-ation (UVR) was a major environmental change faced byhuman populations migrating from Africa to higher latitudes.Because the levels of UVR required to synthesize vitamin Dare known to be higher in individuals with darker skin (Holick2003; Chen et al. 2007), it has been suggested that selectionfavored lighter skin to maximize the production of vitamin Din regions with lower UVR (Loomis 1967; Jablonski andChaplin 2000). However, lack of knowledge about the geneticbasis of natural variation in skin pigmentation has preventedthe evaluation at the molecular level of the role played bynatural selection in shaping the variation of this complexphenotype among human populations (Parra 2007).
Recently, several genes affecting melanin production andmelanin function have been shown to influence normal pig-mentation variation in human populations by using associ-ation approaches and/or direct functional assays (reviewed inParra 2007; Sturm 2009; Rees and Harding 2012). Most ofthese genes have geospatial patterns of genetic variationthat are correlated with the geographic distribution of skinpigmentation and display strong evidence for selectivesweeps in European and East Asian populations (Izagirreet al. 2006; McEvoy et al. 2006; Soejima et al. 2006; Voightet al. 2006; Lao et al. 2007; Myles et al. 2007; Norton et al.2007; Sabeti et al. 2007; Williamson et al. 2007; Pickrell et al.2009). In addition, the picture emerging from the genetic datasuggests that skin pigmentation has a complex evolutionaryhistory, with selection acting on different genes at differenttimes and geographic locations (McEvoy et al. 2006; Lao et al.2007; Myles et al. 2007; Norton et al. 2007; Pickrell et al.2009). Some genes, such as KITLG, have derived alleles
Article
FastT
rack
� The Author 2012. Published by Oxford University Press on behalf of the Society for Molecular Biology and Evolution. All rights reserved. For permissions, pleasee-mail: [email protected]
24 Mol. Biol. Evol. 30(1):24–35 doi:10.1093/molbev/mss207 Advance Access publication August 25, 2012
by Jaydeepsinh Rathod on A
pril 25, 2013http://m
be.oxfordjournals.org/D
ownloaded from
(associated with lighter pigmentation) that reach high fre-quencies both in European and East Asian populations andlikely began to be selected in a proto Eurasian population(Lao et al. 2007; Williamson et al. 2007; Pickrell et al. 2009).Other genes have derived alleles with a distribution primarilyrestricted to either Europe (SLC24A5, SLC45A2 and TYRP1) orEast Asia (DCT and ATRN), suggesting that different genesare responsible for the reduction of melanin content inEuropeans and East Asians (McEvoy et al. 2006; Lao et al.2007; Myles et al. 2007; Norton et al. 2007; Pickrell et al.2009). Additional evidence for convergent adaptation is pro-vided by genes such as OCA2, in which different skin lighten-ing alleles have likely experienced independent sweeps inEuropeans and East Asians (Lao et al. 2007; Edwards et al.2010; Donnelly et al. 2011).
Taken together, these findings are broadly consistent inshowing that human populations migrating to higher lati-tudes moved from a darkly pigmented ancestral state towardlighter pigmentation due to genetic adaptation in response tospatially varying selective pressures (Jablonski and Chaplin2000; Jablonski 2004; Parra 2007). However, limited workhas focused on estimating the time frame over which pig-mentation changed and on the intensity of selection actingupon different genes. Without this understanding, it is diffi-cult to discriminate between contrasting evolutionary scen-arios that are compatible with the available data. For example,some distributions of derived alleles in European populationsare consistent with both an early sweep, starting soon afterthe migration of anatomically modern humans into Europe,and with more recent dates occurring long after the arrival ofmodern human populations to the continent (Cavalli-Sforzaet al. 1994; Norton and Hammer 2008). Similarly, selectivesweeps at genes such as KITLG may have occurred imme-diately after the out-of-Africa migration or only shortlybefore the split between Europeans and Asians, following aperiod of coexistence of Eurasian populations in westernAsia (Gutenkunst et al. 2009; Laval et al. 2010; Rasmussenet al. 2011).
Here, we present an analysis of the evolutionary history ofhuman pigmentation focused on the estimation of the agesand strength of selective sweeps at four genes that are knownto influence normal variation in pigmentation levels: KITLG,SLC25A5, and SLC45A2, which explain a significant portion ofthe skin color differences between European and WestAfrican populations (Lamason et al. 2005; Miller et al. 2007;Norton et al. 2007), and TYRP1, which is associated with vari-ation in iris pigmentation and hair color within Europe(Frudakis et al. 2003; Sulem et al. 2008; Liu et al. 2010). Themodes of our age estimates indicate that the derived lineageshared by Europeans and East Asians at KITLG started to risein frequency approximately 30,000 years ago, after theout-of-Africa migration, whereas the selective sweeps forthe European-specific alleles at TYRP1, SLC24A5, andSLC45A2 occurred only within the last 11,000–19,000 yearsand not immediately after the first migrations of modernhumans into Europe. We suggest that this pattern was influ-enced by increases in European population size, which
lowered the levels of drift and favored the recent accumula-tion of advantageous variants at different loci.
Materials and Methods
DNA Samples
Pigmentation-associated single-nucleotide polymorphisms(SNPs) and linked microsatellite markers were typed in differ-ent collections of samples. The tag SNPs rs642742A>G andrs2733831A>G for KITLG and TYRP1, respectively, weretyped together with linked microsatellites in 50 Portugueseindividuals (all of European ancestry) and 70 individuals ofSub-Saharan African ancestry (30 Ovimbundu from Angolaand 20 Makhuwa, 18 Ronga, and 2 Shangaan fromMozambique). SNPs rs1426654 and rs16891982 at theSLC24A5 and SLC45A2 genes, respectively, were typed withthe associated microsatellite markers in 212 European-Americans. All research participants were recruited accordingto protocols and informed consent procedures approved bythe institutional review boards of participant institutions.We also typed all microsatellite markers in samples fromthe HapMap project with available genotype informationfor the selected SNPs (Frazer et al. 2007). This data set consistsof 30 parent–offspring trios of European ancestry(European-Americans collected by CEPH, CEU), 30 parent–offspring trios of African Ancestry (Yoruba from West Africa,YRI), and 90 unrelated individuals of East Asian ancestry(45 Japanese and 45 Han Chinese individuals), which werecombined into a single East Asian group in this work (EAS)(Frazer et al. 2007).
SNP and Microsatellite Selection and Genotyping
Tag SNPs at SLC24A5 (rs1426654G>A), SLC45A2(rs16891982C>G), KITLG (rs642742A>G) and TYRP1(rs2733831A>G) loci were chosen because of their previouslyreported association with normal pigmentation variation andlocation in extended haplotypes with signs of positive selec-tion (Frudakis et al. 2003; Lamason et al. 2005; Izagirre et al.2006; McEvoy et al. 2006; Soejima et al. 2006; Voight et al.2006; Lao et al. 2007; Miller et al. 2007; Myles et al. 2007;Norton et al. 2007; Sabeti et al. 2007; Stokowski et al. 2007;Williamson et al. 2007; Sulem et al. 2008). SNP rs642742 is ahighly conserved site, located 326 kb upstream of the KITLGtranscription start site, with a possible regulatory effect inKITLG expression and measured effects in skin pigmentationvariation between European and West Africans (Miller et al.2007). The tag SNPs at SLC24A5 and SLC45A2 (rs1426654 andrs16891982) are nonsynonymous polymorphisms thatexplain a substantial proportion of skin pigmentation differ-ences between Europeans and West Africans (Lamason et al.2005; Norton et al. 2007). The tag for TYRP1 is a highly con-served intronic SNP in strong linkage disequilibrium withvariants (rs2733832, r2 = 0.9 and rs1408799, r2 = 0.68) asso-ciated with iris pigmentation and hair color variation inEurope (Frudakis et al. 2003; Frazer et al. 2007; Sulem et al.2008).
To characterize the haplotype diversity (HD) associatedwith SNP-defined lineages at SLC24A5, SLC45A2, TYRP1,
25
Timing of Pigmentation Lightening in Europeans . doi:10.1093/molbev/mss207 MBE by Jaydeepsinh R
athod on April 25, 2013
http://mbe.oxfordjournals.org/
Dow
nloaded from

and KITLG, we screened these genes and their flanking se-quences for potential polymorphic repeat arrays, using theUCSC Genome browser website (http://genome.ucsc.edu).Microsatellites were selected according to the following cri-teria: 1) the repeat motif should exhibit �6 repetitive units;2) the repeat motif should be as simple (homogeneous) aspossible; and 3) the flanking regions should not harbor A andT repetitive stretches. Detailed information for the microsat-ellites studied including their physical map position can befound in supplementary table S1, Supplementary Materialonline.
Typing details for SNPs and microsatellite markers areprovided in supplementary protocol, SupplementaryMaterial online.
SNP/Microsatellite Haplotype Reconstruction andPhylogenetic Analysis
Haplotypes consisting of SNPs and linked microsatellite mar-kers were inferred with the PHASE v.2.1 software (Stephenset al. 2001; Stephens and Scheet 2005). We first reconstructedhaplotypes from the available father–mother–child trio datafrom the CEU and YRI HapMap reference populations, usingthe PHASE-P1 option. The phased trio data were then used tohelp inferring the haplotypes of the other individuals in thesample.
Allele frequencies, locus heterozygosity, and HD werecalculated with the Arlequin v3.1.1 software (Excoffier et al.2005).
The evolutionary relationships between haplotypes werereconstructed with the NETWORK 4.5 software (www.fluxus-engineering.com). The reduced median (Bandeltet al. 1995) and median-joining (Bandelt et al. 1999) algo-rithms were applied sequentially to resolve extensive reticu-lation at the microsatellite loci.
Neutrality Tests
We used the SIMCOAL2.1.2 (Laval and Excoffier 2004) soft-ware to perform coalescent simulations of multiple sets ofSNP/microsatellite haplotypes, assuming neutral evolutionand different demographic scenarios. For each demographicscenario, we ran enough simulations until we obtained atleast 5,000 sets of random coalescent trees, in which the fre-quency of the derived SNP clade was within ±5% of theobserved derived SNP allele frequency for the population inquestion. From each coalescent tree that matched this con-dition, we calculated on the background of the derived SNPclade the probability of drawing two different haplotypes(HD) and the average variance in microsatellite repeatnumber (V). This procedure allowed us to generate null dis-tributions of these two intra-allelic diversity statistics and cal-culate the proportion of simulated values that are lower thanthe observed values under neutrality for a given demographicmodel, as a measure of the probability of observing the databy chance alone.
Recombination rates (r) between microsatellite markersand between tag SNPs and adjacent microsatellite loci wereinterpolated from linkage-disequilibrium-based estimates
provided in release 23 of the HapMap Phase 2 data (Frazeret al. 2007), which combine the recombination maps for CEU,YRI, and EAS (supplementary table S1, SupplementaryMaterial online) and, as noted by Pickrell et al. (2009), areunlikely to be affected by population-specific selective sweepsand demography. This recombination map is more refinedthan the pedigree-based recombination map (Kong et al.2010), but both maps are highly correlated (Hinch et al.2011; Wegmann et al. 2011). The mutation rates (�) of simu-lated microsatellites (supplementary table S1, SupplementaryMaterial online) were calculated from allele frequency distri-butions in our African samples, which are not affected by theselective sweeps affecting Eurasian samples. We used thehomozygosity-based estimator proposed by Xu and Fu(2004), which is relatively robust to deviations from thepure stepwise mutation model and departures frommutation-drift equilibrium (Xu et al. 2005).
Recent studies have shown that the demographic modelmost compatible with the data for European and East Asianpopulations is a bottleneck scenario, with stronger geneticdrift in East Asian populations than European populations(Schaffner et al. 2005; Voight et al. 2005). Thus, in additionto the simple constant population-size model, we have simu-lated bottleneck scenarios compatible with plausible param-eter spaces estimated by Voight et al. (2005) for Europeanand East Asian populations. Although other models offermore detailed information about additional demographic fea-tures (Schaffner et al. 2005; Gutenkunst et al. 2009; Lavalet al. 2010), we chose to use the relatively simple scenariosexplored by Voight et al. (2005) because they provide a morestraightforward way to assess the impact of population sizechanges, while remaining compatible with globally observedpatterns of genetic variation.
The constant size model assumed an effective populationsize of Ne = 10,000. Demographic parameters for theEuropean bottleneck simulations included a bottleneck sever-ity (b), of 0.1 for 400 generations (tdur) starting 1,600 gener-ations ago (tstart). The severity of the East Asian bottleneckwas b = 0.005 for tdur = 300 generations, starting tstart = 1,600generations ago (Voight et al. 2005).
Estimation of Sweep Ages and Selection Coefficients
To jointly estimate the selection intensities (s) and the ages ofonset of selective sweeps (t), we performed Monte Carlo for-ward simulations of the trajectories of SNP/microsatellitehaplotypes carrying favored SNP alleles, taking genetic driftinto account, conditional on the alleles not being lost (thecode is available upon request). The simulated haplotypeswere designed to match the characteristics of the haplotypesystems used in the real data (fig. 1). At the initial state,starting from frequency 1/2Ne, a single derived SNP variantwas randomly assigned to an array of linked marker locidefining the chromosomal background in which the muta-tion originally arose. In each iteration of the simulations, asthe frequency of the derived allele increased due to selection,the original haplotype bearing the derived allele was erodedby mutation at the linked microsatellite loci and
26
Beleza et al. . doi:10.1093/molbev/mss207 MBE by Jaydeepsinh R
athod on April 25, 2013
http://mbe.oxfordjournals.org/
Dow
nloaded from
by recombination with chromosomes bearing the ancestralallele. Selection coefficients (s) were drawn from a uniformprior distribution s (0–1). To account for uncertainty in themutation rates (�) at each microsatellite locus,� values weredrawn from a gamma distribution with shape and scale par-ameters of k = 2 and � =�/k, respectively, so that the mean ofeach distribution corresponded to the value obtained withthe homozygosity-based estimator used for neutrality tests(Xu and Fu 2004).
We did not consider the regeneration of the original haplo-type due to reverse mutation in microsatellites, because it isexpected to be negligible given the relatively high number ofmicrosatellite loci used to define haplotypes. With this sim-plification, each microsatellite locus is defined by one of twostates, corresponding to the presence or absence of the allelethat became originally associated with the derived SNP vari-ant (supplementary text, Supplementary Material online).
For recombination rates, we used fixed values interpolatedfrom the HAPMAP data, as described earlier. To summarize
the levels of intra-allelic homogeneity, in each iteration wecalculated the proportion of haplotypes bearing the derivedallele that preserved the ancestral haplotype (Panc), which isknown to be sensitive to mutation age (Stephens et al. 1998).Although we assumed a constant effective population size of10,000 for most calculations, we have also assessed the effectsof population growth using initial Ne values and exponentialgrowth rates (�) fitting plausible alternative demographicscenarios (supplementary table S2, Supplementary Materialonline).
To match simulated and observed data, we used arejection-sampling approach only accepting s and t valuesfrom simulations with derived allele frequencies and Panc
values within ±2 binomial standard deviations around theobserved values. Resampling of accepted simulations usingsmaller acceptance intervals had no noticeable effect on theestimations (not shown). To calculate Panc values from thedata, we assumed that the haplotype combining the modalallele at each microsatellite locus represented the original
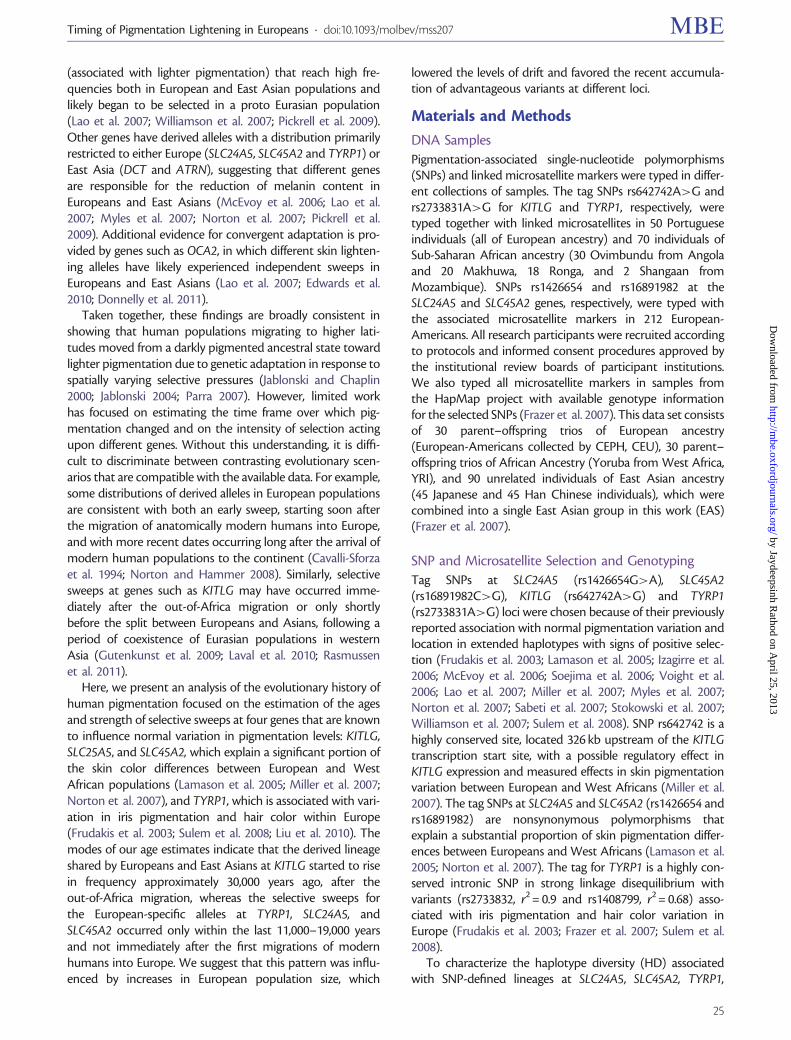
FIG. 1. Schematic representation of the genetic intervals including tag-SNPs and microsatellites used to characterize HD. The approximate locations ofpigmentation genes are indicated by black arrows. The full characterization of each tag-SNP and microsatellite is reported in supplementary table S1,Supplementary Material online. (A) TYRP1; (B) SLC24A5; (C) SLC45A2; and (D) KITLG.
27
Timing of Pigmentation Lightening in Europeans . doi:10.1093/molbev/mss207 MBE by Jaydeepsinh R
athod on April 25, 2013
http://mbe.oxfordjournals.org/
Dow
nloaded from

haplotype (Coelho et al. 2005). The s,t combinations with thehighest number of accepted simulations were used as pointestimates of selection intensities and times of onset of select-ive sweeps. All estimates are based on 10,000 accepted simu-lations and assume an additive or fully dominant fitnesseffect. Biplots for all s, t pairs displaying highest density regions(HDRs) contours were computed with R (www.r-project.org)using the package hdrcde (Hyndman 1996). A generation wasassumed to comprise 28 years (Fenner 2005).
To evaluate the accuracy of the simulation method, wesimulated 1,000 pseudodata sets using known t and s param-eter values drawn from uniform priors. For each pseudodataset, we reestimated t and s using the same approachemployed for the empirical data and calculated the fractionof known values falling within a given HDR (supplementaryfig. S1, Supplementary Material online).
ResultsBecause the most relevant evolutionary events in the historyof SLC24A5, SLC45A2, TYRP1, and KITLG are expected to haveoccurred within a relatively short time scale, we have basedour approach on the analysis of relatively long (237–887 kb)haplotypes consisting of several rapidly evolving microsatel-lites linked to one tag SNP in each gene (fig. 1). We selectedtag SNPs based on their previously reported association withmeasurable effects on pigmentation, location in genomic re-gions with signs of positive selection, and patterns of inter-species conservation (see Materials and Methods).
As expected, the tag SNP allele frequencies in our samplesmirrored previously described distributions in major geo-graphic groups (Lamason et al. 2005; Yuasa et al. 2006;Frazer et al. 2007; Miller et al. 2007; Norton et al. 2007;Soejima and Koda 2007) (table 1). The derived allelesSLC24A5*A and SLC45A2*G both have frequencies higherthan 90% in Europeans but are much more rare or absentin Africans and East Asians. The TYRP1*G allele, which is alsorare among Africans and East Asians, reaches an intermediatefrequency of 60% in Europeans. At the rs642742 SNP, thefrequency of the KITLG*G derived allele in Africans is 7%, incontrast to the high frequencies found in Europeans and EastAsians (�80%).
Patterns of Haplotype Variation
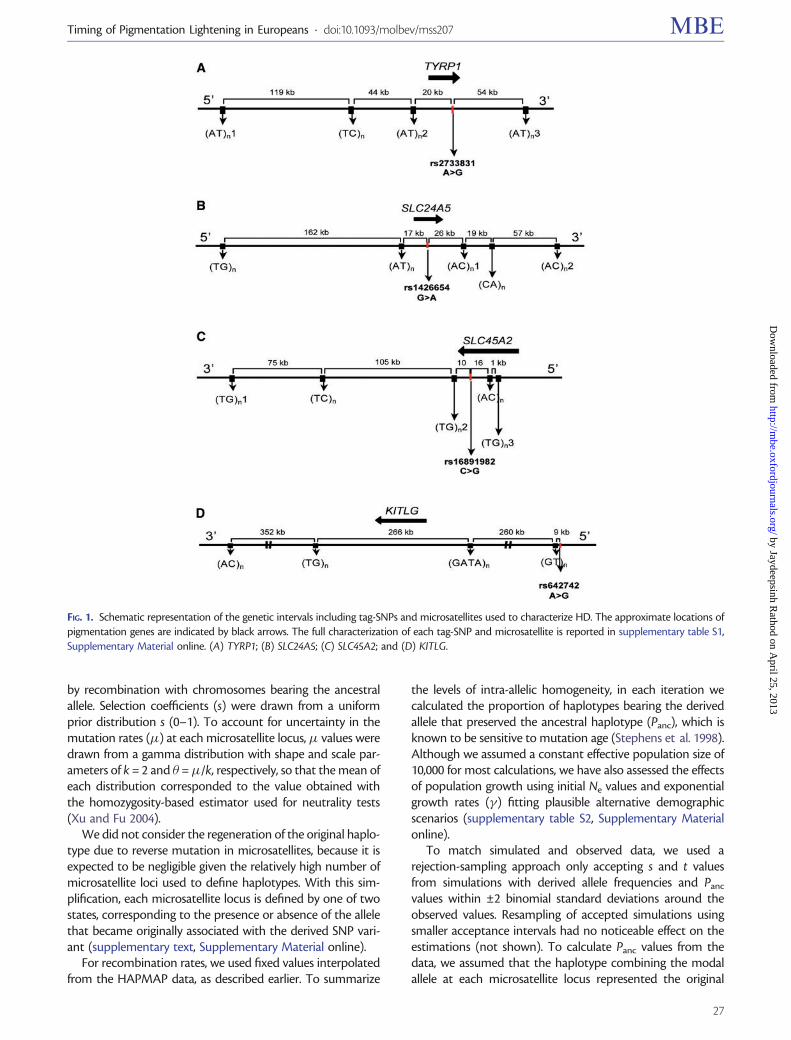
Figure 2 displays the relationships among haplotypes carryingancestral and derived alleles at pigmentation associated SNPs
for each studied gene. The reconstructed SNP/microsatellitehaplotypes clearly show that derived alleles at TYRP1,SLC24A5 and SLC45A2 are associated with only subsets ofpossible haplotypes (fig. 2A–C and supplementary fig. S2,Supplementary Material online). Haplotypes bearing thederived allele at the TYRP1 and SLC24A5 loci (fig. 2A and B)tend to be more tightly clustered than at the SLC45A2 gene(fig. 2C), which displays a more interspersed pattern, probablydue to early recombination between ancestral and derivedlineages.
In contrast with TYRP1, SLC24A5, and SLC45A2, KITLGdisplays more similar levels of intra-allelic diversity in ancestraland derived lineages (fig. 2D and supplementary fig. S2,Supplementary Material online). Moreover, approximately58% of chromosomes bearing the KITLG*G allele outsideAfrica are shared by Europeans and East Asians, suggestingthat an important fraction of the KITLG*G intra-allelic vari-ation was generated before the split of European and EastAsian populations (supplementary fig. S3, SupplementaryMaterial online).
Neutrality Tests
To test whether the observed patterns of haplotype variationwere consistent with neutrality, we performed coalescentsimulations under different demographic scenarios to gener-ate null distributions of two summary statistics of microsat-ellite intra-allelic diversity: the probability of observing twodifferent haplotypes, or HD, and the average variance ofrepeat number (V) (table 2). For TYRP1, SLC24A5, andSLC45A2, the probabilities of observing two different haplo-types within derived alleles (HD) were consistently lower thanexpected under neutrality, irrespectively of the demographicscenario (table 2). However, neutrality could not be rejectedfor SLC45A2 when intra-allelic diversity was measured by theaverage variance of repeat number (V) at linked microsatellitemarkers (table 2). This discrepancy is likely to have beencaused by the recombinational introgression of microsatellitealleles with very different sizes into the background of thederived SLC45A2*G clade, as reflected in the bimodal allelefrequency distributions at the microsatellite loci (TC)n and(TG)n3 (supplementary fig. S2, Supplementary Materialonline). Alternatively, this pattern is consistent with anearly multirepeat microsatellite mutational event on thederived haplotype.
Table 1. Allele Frequencies of Tag SNPs in Pigmentation Genes Studied in African, East Asian, and European Populations.
Gene/SNP Allele African ± SD East Asian ± SD European ± SD
SLC24A5/rs1426654 G 0.971 ± 0.002 0.989 ± 0.008 0.007 ± 0.004A 0.029 0.011 0.993
SLC45A2/rs16891982 C 1.00 ± 0.00 0.987 ± 0.01 0.049 ± 0.01G 0.00 0.013 0.951
TYRP1/rs2733831 A 0.965 ± 0.01 0.986 ± 0.01 0.415 ± 0.04G 0.035 0.014 0.585
KITLG/rs642742 A 0.932 ± 0.02 0.177 ± 0.03 0.164 ± 0.03G 0.068 0.823 0.836
28
Beleza et al. . doi:10.1093/molbev/mss207 MBE by Jaydeepsinh R
athod on April 25, 2013
http://mbe.oxfordjournals.org/
Dow
nloaded from
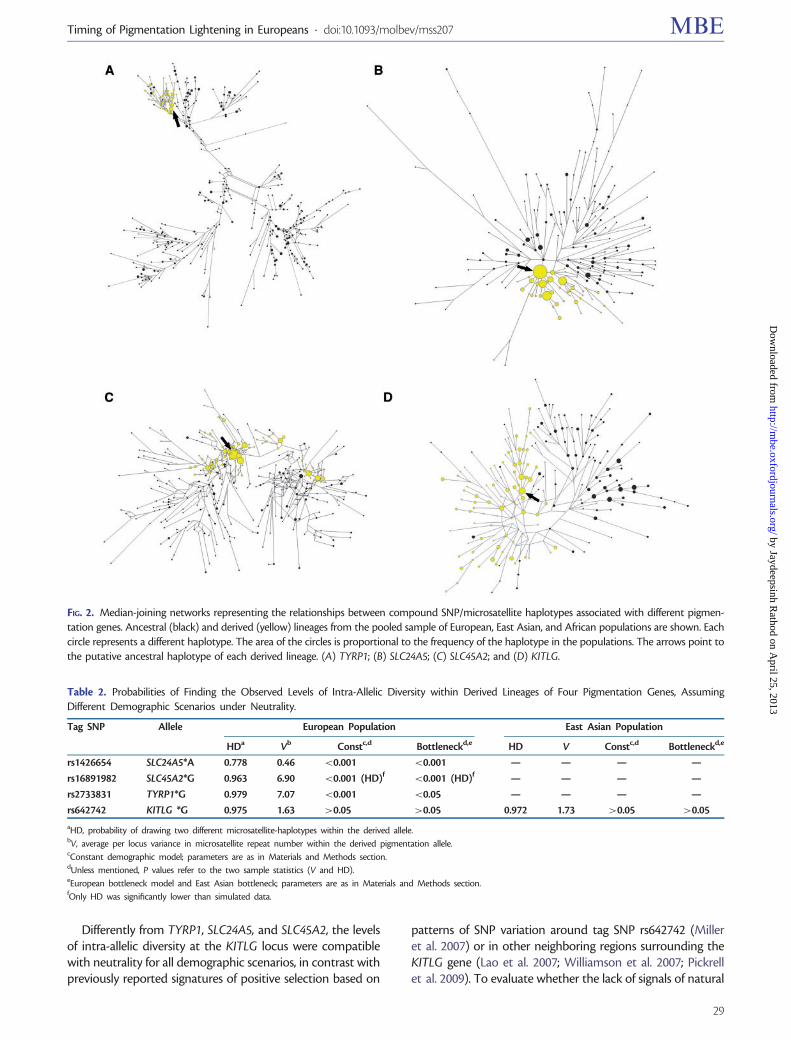
Differently from TYRP1, SLC24A5, and SLC45A2, the levelsof intra-allelic diversity at the KITLG locus were compatiblewith neutrality for all demographic scenarios, in contrast withpreviously reported signatures of positive selection based on
patterns of SNP variation around tag SNP rs642742 (Milleret al. 2007) or in other neighboring regions surrounding theKITLG gene (Lao et al. 2007; Williamson et al. 2007; Pickrellet al. 2009). To evaluate whether the lack of signals of natural
FIG. 2. Median-joining networks representing the relationships between compound SNP/microsatellite haplotypes associated with different pigmen-tation genes. Ancestral (black) and derived (yellow) lineages from the pooled sample of European, East Asian, and African populations are shown. Eachcircle represents a different haplotype. The area of the circles is proportional to the frequency of the haplotype in the populations. The arrows point tothe putative ancestral haplotype of each derived lineage. (A) TYRP1; (B) SLC24A5; (C) SLC45A2; and (D) KITLG.
Table 2. Probabilities of Finding the Observed Levels of Intra-Allelic Diversity within Derived Lineages of Four Pigmentation Genes, AssumingDifferent Demographic Scenarios under Neutrality.
Tag SNP Allele European Population East Asian Population
HDa Vb Constc,d Bottleneckd,e HD V Constc,d Bottleneckd,e
rs1426654 SLC24A5*A 0.778 0.46 <0.001 <0.001 — — — —
rs16891982 SLC45A2*G 0.963 6.90 <0.001 (HD)f <0.001 (HD)f — — — —
rs2733831 TYRP1*G 0.979 7.07 <0.001 <0.05 — — — —
rs642742 KITLG *G 0.975 1.63 >0.05 >0.05 0.972 1.73 >0.05 >0.05
aHD, probability of drawing two different microsatellite-haplotypes within the derived allele.bV, average per locus variance in microsatellite repeat number within the derived pigmentation allele.cConstant demographic model; parameters are as in Materials and Methods section.dUnless mentioned, P values refer to the two sample statistics (V and HD).eEuropean bottleneck model and East Asian bottleneck; parameters are as in Materials and Methods section.fOnly HD was significantly lower than simulated data.
29
Timing of Pigmentation Lightening in Europeans . doi:10.1093/molbev/mss207 MBE by Jaydeepsinh R
athod on April 25, 2013
http://mbe.oxfordjournals.org/
Dow
nloaded from
selection could be due to a distant location of rs642742 rela-tively to the true target of selection, we used the availablegenotype data from HapMap samples to perform selectiontests based on the microsatellite variation linked to threeadditional tag SNPs associated with clear signs of selectionat KITLG in European an East Asian populations:1) rs10732643, located within a target region previously iden-tified by a composite likelihood ratio approach (Williamsonet al. 2007); 2) rs3782181, located within a core haplotypecentered on the KITLG gene, displaying a significantly highextended haplotype homozygosity (Lao et al. 2007); and 3)rs1881227, previously used to characterize a SNP-based signalof natural selection around KITLG (Coop et al. 2009). Ourcoalescent-based tests failed to reject neutrality in all cases,showing that that the absence of signals of selection we ob-serve for the rs642742 locus may be a general feature of theKITLG gene when using this test.
Age and Selection Coefficient Estimates
To jointly estimate the magnitude (s) and age (t) of selectivesweeps, we used forward Monte Carlo simulations incorpor-ating drift, selection, recombination, and mutation at linkedmarker loci. The estimates were obtained by matching simu-lated data to the observed frequencies of the derived allelesand the proportion of derived lineages preserving the originalhaplotype in which the favored mutation arose (Panc, inverselycorrelated with intra-allelic diversity). Because the availableinformation from the KITLG, SLC24A5, and SLC45A2 genessuggests that phenotypic effects are consistent with modes ofinheritance that are between additive and dominant(Lamason et al. 2005; Miller et al. 2007; Norton et al. 2007),we used these two modes of inheritance to model fitness.
Table 3 presents the modes of the joint distributions ofselection coefficients and times of onset of selective sweeps atthe KITLG, TYRP1, SLC24A5, and SLC45A2 genes under dom-inant and additive fitness models, assuming a constant effect-ive population size of 10,000. Estimates for the KITLG*G allelewere based on data from either European or East Asian popu-lation samples. Estimates for TYRP1*G, SLC24A5*A, andSLC45A2*G were based on data from European samples.
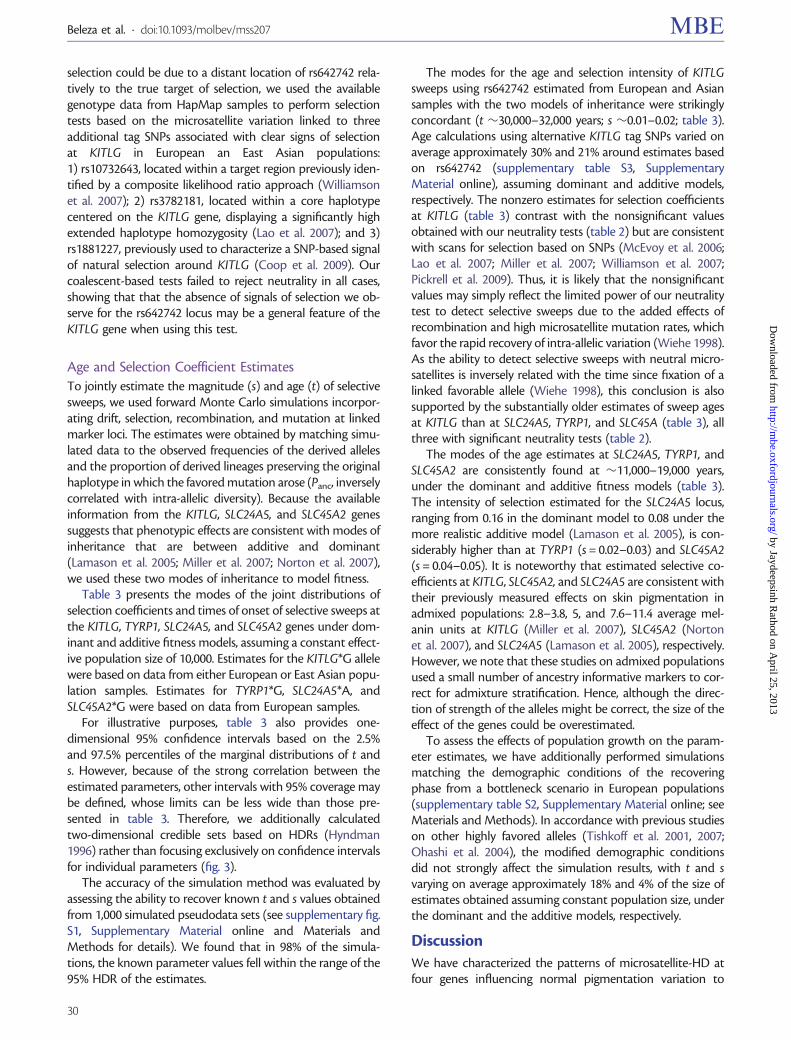
For illustrative purposes, table 3 also provides one-dimensional 95% confidence intervals based on the 2.5%and 97.5% percentiles of the marginal distributions of t ands. However, because of the strong correlation between theestimated parameters, other intervals with 95% coverage maybe defined, whose limits can be less wide than those pre-sented in table 3. Therefore, we additionally calculatedtwo-dimensional credible sets based on HDRs (Hyndman1996) rather than focusing exclusively on confidence intervalsfor individual parameters (fig. 3).
The accuracy of the simulation method was evaluated byassessing the ability to recover known t and s values obtainedfrom 1,000 simulated pseudodata sets (see supplementary fig.S1, Supplementary Material online and Materials andMethods for details). We found that in 98% of the simula-tions, the known parameter values fell within the range of the95% HDR of the estimates.
The modes for the age and selection intensity of KITLGsweeps using rs642742 estimated from European and Asiansamples with the two models of inheritance were strikinglyconcordant (t �30,000–32,000 years; s �0.01–0.02; table 3).Age calculations using alternative KITLG tag SNPs varied onaverage approximately 30% and 21% around estimates basedon rs642742 (supplementary table S3, SupplementaryMaterial online), assuming dominant and additive models,respectively. The nonzero estimates for selection coefficientsat KITLG (table 3) contrast with the nonsignificant valuesobtained with our neutrality tests (table 2) but are consistentwith scans for selection based on SNPs (McEvoy et al. 2006;Lao et al. 2007; Miller et al. 2007; Williamson et al. 2007;Pickrell et al. 2009). Thus, it is likely that the nonsignificantvalues may simply reflect the limited power of our neutralitytest to detect selective sweeps due to the added effects ofrecombination and high microsatellite mutation rates, whichfavor the rapid recovery of intra-allelic variation (Wiehe 1998).As the ability to detect selective sweeps with neutral micro-satellites is inversely related with the time since fixation of alinked favorable allele (Wiehe 1998), this conclusion is alsosupported by the substantially older estimates of sweep agesat KITLG than at SLC24A5, TYRP1, and SLC45A (table 3), allthree with significant neutrality tests (table 2).
The modes of the age estimates at SLC24A5, TYRP1, andSLC45A2 are consistently found at �11,000–19,000 years,under the dominant and additive fitness models (table 3).The intensity of selection estimated for the SLC24A5 locus,ranging from 0.16 in the dominant model to 0.08 under themore realistic additive model (Lamason et al. 2005), is con-siderably higher than at TYRP1 (s = 0.02–0.03) and SLC45A2(s = 0.04–0.05). It is noteworthy that estimated selective co-efficients at KITLG, SLC45A2, and SLC24A5 are consistent withtheir previously measured effects on skin pigmentation inadmixed populations: 2.8–3.8, 5, and 7.6–11.4 average mel-anin units at KITLG (Miller et al. 2007), SLC45A2 (Nortonet al. 2007), and SLC24A5 (Lamason et al. 2005), respectively.However, we note that these studies on admixed populationsused a small number of ancestry informative markers to cor-rect for admixture stratification. Hence, although the direc-tion of strength of the alleles might be correct, the size of theeffect of the genes could be overestimated.
To assess the effects of population growth on the param-eter estimates, we have additionally performed simulationsmatching the demographic conditions of the recoveringphase from a bottleneck scenario in European populations(supplementary table S2, Supplementary Material online; seeMaterials and Methods). In accordance with previous studieson other highly favored alleles (Tishkoff et al. 2001, 2007;Ohashi et al. 2004), the modified demographic conditionsdid not strongly affect the simulation results, with t and svarying on average approximately 18% and 4% of the size ofestimates obtained assuming constant population size, underthe dominant and the additive models, respectively.
DiscussionWe have characterized the patterns of microsatellite-HD atfour genes influencing normal pigmentation variation to
30
Beleza et al. . doi:10.1093/molbev/mss207 MBE by Jaydeepsinh R
athod on April 25, 2013
http://mbe.oxfordjournals.org/
Dow
nloaded from

evaluate the time frame over which European populationsevolved lighter pigmentation.
Our results based on the KITLG gene suggest that the initialstages of European skin lightening occurred in a proto-Eurasian population, approximately 30,000 years ago, afterthe out-of-Africa migration �60,000–70,000 years ago(Schaffner et al. 2005; Mellars 2006; Keinan et al. 2007; Lavalet al. 2010; Rasmussen et al. 2011) and slightly more recentlythan the earliest archaeological evidences for the dispersal ofanatomically modern humans in Europe, approximately40,000 years ago (Klein 1999; Mellars 2006). Recent estimatesbased on genome-wide patterns of variation have suggestedthat the European and East Asian divergence might haveoccurred as late as �25,000 years ago (Keinan et al. 2007;Gutenkunst et al. 2009; Laval et al. 2010; Rasmussen et al.2011), implying that the colonization of Europe could haveinvolved several migration movements at different ages (Lavalet al. 2010). Our estimates for the onset of selection at KITLGare consistent with these findings, although more ancientdates (>40,000 years) cannot be excluded, due to uncertaintyof age estimates. In any case, both the modal age estimates(table 3) and the extensive sharing of derived lineages be-tween European and East Asian populations (supplementaryfig. S3, Supplementary Material online) suggest that the onsetof the KITLG sweep occurred before the divergence of theancestors of present-day Europeans and East Asians, well aftermodern humans left Africa.
Our estimates additionally show that the onset of selectivesweeps at SLC24A5, SLC45A2, and TYRP1, the three genes inwhich the geographic distribution of the polymorphisms isprimarily restricted to European populations, was much morerecent than at KITLG and remarkably compressed within thelast 11,000–19,000 years (table 3), suggesting that lighter pig-mentation alleles at these three loci began to rise in frequencyonly in the latest phases of the Upper Paleolithic, encompass-ing the Solutrean and the Magdalenian cultures. One priorstudy has similarly suggested that the selective sweep at theSLC45A2 occurred long after the arrival of anatomicallymodern humans in Europe (Soejima et al. 2006).
Although the timing of the selective sweep(s) is clear fromthese analyses, it is less clear whether the genetic variantsunderlying this adaptive response originated in Eurasia orwere already present in Africa before the ancestors of
contemporary non-Africans left the continent. Previous stu-dies using several population samples from different contin-ents have shown that, unlike SLC45A2, derived alleles atSLC24A5, TYRP1, and KITLG are present at low frequenciesin some sub-Saharan populations (table 1, see also Yuasa et al.2006; Frazer et al. 2007; Norton et al. 2007; Soejima and Koda2007; Coop et al. 2009; Pickrell et al. 2009). We see threepossible explanations for these patterns: 1) the derived allelesarose in Europe (for SLC24A5 and TYRP1) or in the ancestralEurasian population (for KITLG) where they increased in fre-quency and were introduced later into Africa by gene flow, 2)the derived alleles arose in Africa, where they remain at lowfrequencies and spread out of Africa with the early migrationsof modern humans. These alleles were then lost from theancestral gene pools of East Asians (except for KITLG) andultimately increased in frequency in the ancestors ofEuropeans, and 3) the African and European alleles had inde-pendent mutational origins and are homoplastic, which is anunlikely scenario. It would be necessary to carry out a moreexhaustive study of the diversity of these loci, and particularly,the pattern of intra-allelic variation for the derived alleles inAfrican and Eurasian populations, to clarify these issues.
In any case, the SNP-haplotype structure around thederived alleles at all loci bear signals of Eurasian hardsweeps that are not expected under selection from standingvariation (Hermisson and Pennings 2005; Izagirre et al. 2006;McEvoy et al. 2006; Soejima et al. 2006; Voight et al. 2006; Laoet al. 2007; Myles et al. 2007; Norton et al. 2007; Sabeti et al.2007; Williamson et al. 2007; Pickrell et al. 2009).
In this setting, which are the most important factors thatinfluenced the sorting of pigmentation variants among dif-ferent populations? Recently, it has been suggested that thegeographic spread of selected variants essentially depends onthe timing of selective sweeps relative to major populationmovements (Coop et al. 2009). Our sweep age estimates forKITLG, SLC24A5, SLC45A2, and TYRP1 are consistent with thisinterpretation, because the onset of the Eurasian-wide sweepat KITLG precedes the split of Europeans and East Asians,whereas the European-specific sweeps at SLC24A5, SLC45A2,and TYRP1 started well after the separation of Europeanpopulations. However, it is important to understand whatfactors might have led to the temporal patterns revealed byour estimates.
Table 3. Modal Age (t) and Selection Coefficient (s) Joint Estimates and One-Dimensional 95% Confidence Intervals Based on the 2.5% and 97.5%Percentiles of the Marginal t and s Distributions.
Tag SNP Allele Dominant Model Additive Model
sa Age (Years)b sa Age (Years)b
rs1426654 SLC24A5*A 0.16 (0.05–0.73) 18,704 (5,824–38,332) 0.08 (0.02–0.55) 11,368 (1,036–55,832)
rs16891982 SLC45A2*G 0.05 (0.02–0.1) 15,932 (8,260–31,780) 0.04 (0.02–0.09) 13,720 (6,188–26,964)
rs2733831 TYRP1*G 0.02 (0.006–0.085) 12,796 (3,388–34,664) 0.03 (0.01–0.09) 14,000 (4,788–35,028)
rs642742 KITLG *G-Eurc 0.02 (0.003–0.073) 30,212 (5,152–97,188) 0.02 (0,004–0,091) 31,164 (5,796–77,900)
rs642742 KITLG *G-EAsid 0.01 (0.003–0.087) 31,836 (4,872–102,340) 0.02 (0.004–0.091) 30,940 (5,824–94,780)
NOTE.—Plots reporting two-dimensional credible regions for the t and s parameters are reported in figure 3.aSelection coefficient.bAssuming a generation interval of 28 years (Fenner 2005).cKITLG *G lineages sampled in the European population.dKITLG *G lineages sampled in the East Asian population.
31
Timing of Pigmentation Lightening in Europeans . doi:10.1093/molbev/mss207 MBE by Jaydeepsinh R
athod on April 25, 2013
http://mbe.oxfordjournals.org/
Dow
nloaded from

The period encompassing the onset of the SLC24A5,SLC45A2, and TYRP1 sweeps, between 11,000 and 19,000years ago, falls within the oxygen-isotope climatic stage 2(OIS-2), which lasted from 24,000 to 12,000 years ago andcomprised the last glacial maximum (LGM), approximately15,000–20,000 years ago (Klein 1999). As previously empha-sized (Jablonski and Chaplin 2000), it is likely that the climatic
conditions prevailing during the last glaciation favored cul-tural modifications that limited exposure to UVR, like shelterseeking and the wearing of more protective clothing.Moreover, seasonality (differences in solar radiation betweenthe summer and the winter) is thought to have significantlyincreased from 18,000 to 10,000 years ago, extending the dur-ation “vitamin D winters” and augmenting the risks of vitamin
FIG. 3. Biplots of the posterior densities of the times of onset of selective sweeps in generations (x axes) and selection coefficients (y axes), at each of fourtag SNPs at the KITLG (A–D), TYRP1 (E,F), SLC24A5 (G,H), and SLC45A2 (I,J) loci, assuming dominant (A, C, E, G, I) and additive (B, D, F, H, J) models ofselection. The mode is marked by a black dot. Shades of gray with decreasing intensity indicate 50, 75, 90, and 95% HDR.
32
Beleza et al. . doi:10.1093/molbev/mss207 MBE by Jaydeepsinh R
athod on April 25, 2013
http://mbe.oxfordjournals.org/
Dow
nloaded from

D insufficiency (COHMAP Consortium 1988; Gamble andSoffer 1990; Jablonski 2004; Parra 2007). Additionally, it isconceivable that population growth after the LGM was alsoan important factor in the onset of the selective sweepsobserved for these three genes in Europe. As previouslynoted (Hawks et al. 2007; Karasov et al. 2010; Pritchardet al. 2010), effective population size is one of the mostimportant factors limiting the availability of adaptive muta-tions. Because of this limiting effect, it has been proposed thatthe rate of adaptive evolution in humans before 50,000 yearswas relatively low, starting to increase only with the onset ofpopulation growth in the Upper Paleolithic and its subse-quent magnification during the Neolithic (Hawks et al.2007). In Eurasia, it is likely that demographic limits to adap-tation were prolonged by bottlenecks affecting populationsmigrating out of Africa (Schaffner et al. 2005; Voight et al.2005; Laval et al. 2010), and this could explain, in combinationwith weaker selection pressures related to UVR availability inthe ancestral Eurasian population, the presence of very fewskin-lightening alleles shared between Europeans and EastAsians (McEvoy et al. 2006), of which the derived KITLG lin-eage is the best-known example. On the contrary, during the11,000–19,000 years period over which selective sweeps atSLC24A5, SLC45A2, and TYRP1 started, effective populationsizes could have been high enough for advantageous muta-tions to accumulate in relatively short time at different locicontributing to light pigmentation. In support of this view arearcheological data indicating that there was a significantincrease in population sizes in Europe at the Magdalenian(16,500–11,500 years ago) (Bocquet-Appel and Demars2000; Bocquet-Appel et al. 2005). Moreover, the fact thatthe sweeps at SLC24A5, SLC45A2, and TYRP1 occurred wellafter the divergence of Europeans and East Asians increasedthe chance of convergent adaptation by shortening the delaybetween local adaptive mutations relative to the time neces-sary for advantageous variants to spread across Eurasia (Ralphand Coop 2010).
Recent theoretical work (Ralph and Coop 2010) has shownthat independent evolution may be an important determin-ant of geographic patterns of adaptation and could explainthe observed scarcity of continental-wide sweeps in humanpopulations (Coop et al. 2009; Pickrell et al. 2009), even whenselective pressures are homogeneous. In this framework, thetemporal patterns reported here for pigmentation lighteningare likely to be far from unique and may be exhibited by asubstantial proportion of other recently evolved traits.
Supplementary MaterialSupplementary protocol, figures S1–S3, and tables S1–S3are available at Molecular Biology and Evolution online(http://www.mbe.oxfordjournals.org/).
Acknowledgments
The authors thank Jose Pimentel and the Government ofNamibe for the Angolan samples, and Antonio Prista andall colleagues of the Human Biological Variability inMozambique project for the Mozambican samples. They
also acknowledge Nuno Ferrand for helpful discussions. Thiswork was supported by Fundacao para a Ciencia e aTecnologia (FCT) to S.B. and J.R. (PPCDT/BIA-BDE/56654/2004, PTDC/BIA-BDE/64044/2006, and PTDC/BIA-BDE/68999/2006) and National Institute of Health-NationalHuman Genome Research Institute (NIH NHGRI) to M.D.S.(HG002154). E.J.P. has received research support from theNatural Sciences and Engineering Research Council ofCanada (NSERC); the Canada Foundation for Innovation(CFI); the Ontario Innovation Trust (OIT); and theGovernment of Ontario Early Research Award (ERA). S.B.and I.A. were supported by FCT (SFRH/BPD/21887/2005and PTDC/BIA-BDE/68999/2006, respectively).
ReferencesBandelt HJ, Forster P, Rohl A. 1999. Median-joining networks for infer-
ring intraspecific phylogenies. Mol Biol Evol. 16:37–48.
Bandelt HJ, Forster P, Sykes BC, Richards MB. 1995. Mitochondrial por-traits of human populations using median networks. Genetics 141:743–753.
Bocquet-Appel JP, Demars PY. 2000. Population kinetics in the UpperPalaeolithic in Western Europe. J Archaeol Sci. 27:551–570.
Bocquet-Appel JP, Demars PY, Noiret L, Dobrowsky D. 2005. Estimatesof Upper Palaeolithic meta-population size in Europe from archaeo-logical data. J Archaeol Sci. 32:12.
Cavalli-Sforza L, Menozzi P, Piazza A. 1994. The history and geography ofhuman genes. Princeton (NJ): Princeton University Press.
Chen TC, Chimeh F, Lu Z, Mathieu J, Person KS, Zhang A, Kohn N,Martinello S, Berkowitz R, Holick MF. 2007. Factors that influencethe cutaneous synthesis and dietary sources of vitamin D. ArchBiochem Biophys. 460:213–217.
Coelho M, Luiselli D, Bertorelle G, Lopes AI, Seixas S, Destro-Bisol G,Rocha J. 2005. Microsatellite variation and evolution of human lac-tase persistence. Hum Genet. 117:329–339.
COHMAP Consortium. 1988. Climatic changes of the last 18,000 years:observations and model simulations. Science 241:1043–1052.
Coop G, Pickrell JK, Novembre J, Kudaravalli S, Li J, Absher D, Myers RM,Cavalli-Sforza LL, Feldman MW, Pritchard JK. 2009. The role of geog-raphy in human adaptation. PLoS Genet. 5:e1000500.
Donnelly MP, Paschou P, Grigorenko E, et al. (17 co-authors). 2012. Aglobal view of the OCA2-HERC2 region and pigmentation. HumGenet. 13:683–696.
Edwards M, Bigham A, Tan J, Li S, Gozdzik A, Ross K, Jin L, Parra EJ. 2010.Association of the OCA2 polymorphism His615Arg with melanincontent in East Asian populations: further evidence of convergentevolution of skin pigmentation. PLoS Genet. 6:e1000867.
Excoffier L, Laval G, Schneider S. 2005. Arlequin (version 3.0): an inte-grated software package for population genetics data analysis. EvolBioinform Online. 1:47–50.
Fenner JN. 2005. Cross-cultural estimation of the human generationinterval for use in genetics-based population divergence studies.Am J Phys Anthropol. 128:415–423.
Frazer KA, Ballinger DG, Cox DR, et al. (233 co-authors). 2007. A secondgeneration human haplotype map of over 3.1 million SNPs. Nature449:851–861.
Frudakis T, Thomas M, Gaskin Z, Venkateswarlu K, Chandra KS,Ginjupalli S, Gunturi S, Natrajan S, Ponnuswamy VK,Ponnuswamy KN. 2003. Sequences associated with human iris pig-mentation. Genetics 165:2071–2083.
33
Timing of Pigmentation Lightening in Europeans . doi:10.1093/molbev/mss207 MBE by Jaydeepsinh R
athod on April 25, 2013
http://mbe.oxfordjournals.org/
Dow
nloaded from
Gamble C, Soffer O. 1990. Pleistocene polyphony: the diversity of human
adaptations at the last glacial maximum. In: Soffer O, Gamble C,
editors. The world at 18,100 BP. London: Unwin Hyman.
Gutenkunst RN, Hernandez RD, Williamson SH, Bustamante CD. 2009.
Inferring the joint demographic history of multiple populations
from multidimensional SNP frequency data. PLoS Genet. 5:e1000695.
Hawks J, Wang ET, Cochran GM, Harpending HC, Moyzis RK. 2007.
Recent acceleration of human adaptive evolution. Proc Natl Acad
Sci U S A. 104:20753–20758.
Hermisson J, Pennings PS. 2005. Soft sweeps: molecular population gen-
etics of adaptation from standing genetic variation. Genetics 169:
2335–2352.
Hinch AG, Tandon A, Patterson N, et al. (81 co-authors). 2011. The
landscape of recombination in African Americans. Nature 476:
170–175.
Holick MF. 2003. Vitamin D: a millenium perspective. J Cell Biochem. 88:
296–307.
Hyndman RJ. 1996. Computing and graphing highest density regions.
Am Stat. 50:120–126.
Izagirre N, Garcia I, Junquera C, de la Rua C, Alonso S. 2006. A scan for
signatures of positive selection in candidate loci for skin pigmenta-
tion in humans. Mol Biol Evol. 23:1697–1706.
Jablonski NG. 2004. The evolution of human skin and skin color. Annu
Rev Anthropol. 33:585–623.
Jablonski NG, Chaplin G. 2000. The evolution of human skin coloration.
J Hum Evol. 39:57–106.
Karasov T, Messer PW, Petrov DA. 2010. Evidence that adaptation in
Drosophila is not limited by mutation at single sites. PLoS Genet. 6:
e1000924.
Keinan A, Mullikin JC, Patterson N, Reich D. 2007. Measurement of
the human allele frequency spectrum demonstrates greater
genetic drift in East Asians than in Europeans. Nat Genet. 39:
1251–1255.
Klein RG. 1999. The human career: human biological and cultural ori-
gins. Chicago: University of Chicago Press.
Kong A, Thorleifsson G, Gudbjartsson DF, et al. (14 co-authors). 2010.
Fine-scale recombination rate differences between sexes, popula-
tions, and individuals. Nature 467:1099–1103.
Lamason RL, Mohideen MA, Mest JR, et al. (25 co-authors). 2005.
SLC24A5, a putative cation exchanger, affects pigmentation in zeb-
rafish and humans. Science 310:1782–1786.
Lao O, de Gruijter JM, van Duijn K, Navarro A, Kayser M. 2007.
Signatures of positive selection in genes associated with human
skin pigmentation as revealed from analyses of single nucleotide
polymorphisms. Ann Hum Genet. 71:354–369.
Laval G, Excoffier L. 2004. SIMCOAL 2.0: a program to simulate genomic
diversity over large recombining regions in a subdivided population
with a complex history. Bioinformatics 20:2485–2487.
Laval G, Patin E, Barreiro LB, Quintana-Murci L. 2010. Formulating a
historical and demographic model of recent human evolution based
on resequencing data from noncoding regions. PLoS One 5:e10284.
Liu F, Wollstein A, Hysi PG, et al. (20 co-authors). 2010. Digital quanti-
fication of human eye color highlights genetic association of three
new loci. PLoS Genet. 6:e1000934.
Loomis WF. 1967. Skin-pigment regulation of vitamin-D biosynthesis in
man. Science 157:501–506.
McEvoy B, Beleza S, Shriver MD. 2006. The genetic architecture of
normal variation in human pigmentation: an evolutionary perspec-
tive and model. Hum Mol Genet. 15:R176–R181.
Mellars P. 2006. Going east: new genetic and archaeological perspectives
on the modern human colonization of Eurasia. Science 313:796–800.
Miller CT, Beleza S, Pollen AA, Schluter D, Kittles RA, Shriver MD,
Kingsley DM. 2007. cis-Regulatory changes in Kit ligand expression
and parallel evolution of pigmentation in sticklebacks and humans.
Cell 131:1179–1189.
Myles S, Somel M, Tang K, Kelso J, Stoneking M. 2007. Identifying genes
underlying skin pigmentation differences among human popula-
tions. Hum Genet. 120:613–621.
Norton H, Hammer M. 2008. Sequence variation in the pigmentation
candidate gene SLC24A5 and evidence for independent evolution of
light skin in European and East Asian populations. Presented at the
77th Annual Meeting of the American Association of Physical
Anthropologists; 2008 April 9–12; Columbus (OH).
Norton HL, Kittles RA, Parra E, McKeigue P, Mao X, Cheng K, Canfield
VA, Bradley DG, McEvoy B, Shriver MD. 2007. Genetic evidence for
the convergent evolution of light skin in Europeans and East Asians.
Mol Biol Evol. 24:710–722.
Ohashi J, Naka I, Patarapotikul J, Hananantachai H, Brittenham G,
Looareesuwan S, Clark AG, Tokunaga K. 2004. Extended linkage
disequilibrium surrounding the hemoglobin E variant due to mal-
arial selection. Am J Hum Genet. 74:1198–1208.
Parra EJ. 2007. Human pigmentation variation: evolution, genetic basis,
and implications for public health. Am J Phys Anthropol. Suppl 45:
85–105.
Pickrell JK, Coop G, Novembre J, et al. (11 co-authors). 2009. Signals of
recent positive selection in a worldwide sample of human popula-
tions. Genome Res. 19:826–837.
Pritchard JK, Pickrell JK, Coop G. 2010. The genetics of human adapta-
tion: hard sweeps, soft sweeps, and polygenic adaptation. Curr Biol.
20:R208–R215.
Ralph P, Coop G. 2010. Parallel adaptation: one or many waves of ad-
vance of an advantageous allele? Genetics 186:647–668.
Rasmussen M, Guo X, Wang Y, et al. (58 co-authors). 2011. An aboriginal
Australian genome reveals separate human dispersals into Asia.
Science 334:94–98.
Rees JL, Harding RM. 2012. Understanding the evolution of human
pigmentation: recent contributions from population genetics.
J Invest Dermatol. 132:846–853.
Relethford J. 1997. Hemispheric difference in human skin color. Am
J Phys Anthropol. 104:449–457.
Sabeti PC, Varilly P, Fry B, et al. (244 co-authors). 2007. Genome-wide
detection and characterization of positive selection in human popu-
lations. Nature 449:913–918.
Schaffner SF, Foo C, Gabriel S, Reich D, Daly MJ, Altshuler D. 2005.
Calibrating a coalescent simulation of human genome sequence
variation. Genome Res. 15:1576–1583.
Soejima M, Koda Y. 2007. Population differences of two coding SNPs in
pigmentation-related genes SLC24A5 and SLC45A2. Int J Legal Med.
121:36–39.
Soejima M, Tachida H, Ishida T, Sano A, Koda Y. 2006. Evidence for
recent positive selection at the human AIM1 locus in a European
population. Mol Biol Evol. 23:179–188.
Stephens JC, Reich DE, Goldstein DB, et al. (39 co-authors). 1998.
Datingthe origin of the CCR5-Delta32 AIDS-resistance allele bythe co-
alescence of haplotypes. Am J Hum Genet. 62:1507–1515.
Stephens M, Scheet P. 2005. Accounting for decay of linkage disequilib-
rium in haplotype inference and missing-data imputation. Am J
Hum Genet. 76:449–462.
34
Beleza et al. . doi:10.1093/molbev/mss207 MBE by Jaydeepsinh R
athod on April 25, 2013
http://mbe.oxfordjournals.org/
Dow
nloaded from
Stephens M, Smith NJ, Donnelly P. 2001. A new statistical method for
haplotype reconstruction from population data. Am J Hum Genet.
68:978–989.
Stokowski RP, Pant PV, Dadd T, et al. (11 co-authors). 2007. A genome-
wide association study of skin pigmentation in a South Asian popu-
lation. Am J Hum Genet. 81:1119–1132.
Sturm RA. 2009. Molecular genetics of human pigmentation diversity.
Hum Mol Genet. 18:R9–R17.
Sulem P, Gudbjartsson DF, Stacey SN, et al. (25 co-authors). 2008. Two
newly identified genetic determinants of pigmentation in
Europeans. Nat Genet. 40:835–837.
Tishkoff SA, Reed FA, Ranciaro A, et al. (19 co-authors). 2007.
Convergent adaptation of human lactase persistence in Africa and
Europe. Nat Genet. 39:31–40.
Tishkoff SA, Varkonyi R, Cahinhinan N, et al. (17 co-authors). 2001.
Haplotype diversity and linkage disequilibrium at human G6PD:
recent origin of alleles that confer malarial resistance. Science 293:
455–462.
Voight BF, Adams AM, Frisse LA, Qian Y, Hudson RR, Di Rienzo A. 2005.
Interrogating multiple aspects of variation in a full resequencing
data set to infer human population size changes. Proc Natl Acad
Sci U S A. 102:18508–18513.
Voight BF, Kudaravalli S, Wen X, Pritchard JK. 2006. A map of
recent positive selection in the human genome. PLoS Biol. 4:e72.
Wegmann D, Kessner DE, Veeramah KR, et al. (19 co-authors). 2011.
Recombination rates in admixed individuals identified by
ancestry-based inference. Nat Genet. 43:847–853.
Wiehe T. 1998. The effect of selective sweeps on the variance of the allele
distribution of a linked multiallele locus: hitchhiking of microsatel-
lites. Theor Popul Biol. 53:272–283.
Williamson SH, Hubisz MJ, Clark AG, Payseur BA, Bustamante CD,
Nielsen R. 2007. Localizing recent adaptive evolution in the
human genome. PLoS Genet. 3:e90.
Xu H, Chakraborty R, Fu YX. 2005. Mutation rate variation at human
dinucleotide microsatellites. Genetics 170:305–312.
Xu H, Fu YX. 2004. Estimating effective population size or mutation rate
with microsatellites. Genetics 166:555–563.
Yuasa I, Umetsu K, Harihara S, et al. (12 co-authors). 2006. Distribution
of the F374 allele of the SLC45A2 (MATP) gene and
founder-haplotype analysis. Ann Hum Genet. 70:802–811.
35
Timing of Pigmentation Lightening in Europeans . doi:10.1093/molbev/mss207 MBE by Jaydeepsinh R
athod on April 25, 2013
http://mbe.oxfordjournals.org/
Dow
nloaded from