the timing and magnitude of muscular activity patterns ...eprints.lincoln.ac.uk/9638/1/the timing...
TRANSCRIPT

THE TIMING AND MAGNITUDE OF MUSCULAR
ACTIVITY PATTERNS DURING A FIELD HOCKEY HIT
BY
Anthony J. Gorman
A thesis submitted in partial fulfilment of the requirements of the University of
Lincoln for the degree of MSc. by Research in Sports Science
School of Sport and Exercise Science
December 2012

i
Acknowledgements
I would like to express my gratitude to Dr. Sandy Willmott for his help, guidance
and endless patience throughout this study.
My thanks also to Andy Collinson for his help and support, and to those who gave
their time to participate.

ii
Abstract
The field hockey hit is one of the most important skills used in the game. However,
due to the paucity of empirical research, little is known about the biomechanics of
this movement. Muscular activation patterns have been shown to be major
contributing factors to performance variables in similar swinging motions in golf,
tennis and baseball but debate remains about which muscles are contributing to and
controlling such motions. Moreover, muscle studies have typically neglected the
contribution to movement from segmental interactions and have not related muscle
activity to the three-dimensional kinematics of the swing.
The aim of this study was to investigate the contributions from muscular activity and
from segmental interactions to the hits of ten male, university-level field hockey
players. The activity of sixteen upper body and trunk muscles was monitored using
surface electromyography alongside synchronized three-dimensional kinematics of
the upper body and hockey stick motions.
Surface electromyographic signals were recorded at 2000Hz bilaterally from the
biceps brachii, triceps brachii, the anterior and posterior deltoids, the upper trapezius,
the latissimus dorsi and the sternal and clavicular pectoralis major muscles. Three-
dimensional kinematic data were collected at 240Hz and each hockey hit was broken
down into four phases of the backswing, the early forward swing, acceleration and
the early follow-through. These kinematic and electromyographic data were then
synchronised and temporally normalised before the electromyographic data were
normalised to relative maximal reference contractions.
Right anterior deltoid, right pectoralis major and bilateral latissimus dorsi activity
initiates the downswing of the hockey hit, causing the early acceleration of the arms.
Segmental interactions, due to these accelerations, cause the hockey stick to lag and
the wrists to ‘cock’. A combination of left anterior deltoid, left latissimus dorsi and
bilateral pectoralis major activity continue to accelerate the shoulders during the
downswing whilst elbow musculature appears to control the effects of segmental
interactions. These segmental interactions then become involved in wrist
‘uncocking’ as the stick accelerates towards impact with the ball.
The effects of muscular activity and segmental interactions cause the right elbow to
flex then extend, whereas the left elbow demonstrates a more constant degree of
extension throughout the hit. Both wrists display the same pattern of ‘cocking’ then
‘uncocking’. These combined patterns lead the left arm and stick system to function
as a double pendulum whilst the right arm and stick more closely resemble a triple
pendulum.
Word Count
24, 262

iii
Contents
Acknowledgements…………………………………………………………………...i
Abstract………………………………………………………………………………ii
Word Count…………………………………………………………………………..ii
Contents……………………………………………………………………………...iii
List of Tables and Figures…………………………………………………………...vi
1. Introduction ………………………………………………………………………..1
1.1 The field hockey hit………………………………………………………2
2. Review of Literature……………………………………………………………….8
2.1 Phases of the field hockey hit…………………………………………….8
2.2 Phases of the golf swing………………………………………………….9
2.3 Biomechanical mechanisms…………………………………………….11
2.4 Kinematics of the hockey hit……………………………………………14
2.5 The role of the arms……………………………………………………..17
2.6 Muscular activity………………………………………………………..20
2.6.1 Backswing…………………………………………………….20
2.6.2 Early forward swing…………………………………………..23
2.6.3 Acceleration…………………………………………………...25
2.6.4 Early follow-through………………………………………….28
2.7 EMG Analysis…………………………………………………………..34
2.7.1 Fine wire and surface EMG…………………………………...35
2.7.2 Factors influencing the amplitude of the sEMG signal……….36
2.7.3 Normalisation…………………………………………………38
2.7.4 sEMG hardware……………………………………………….42

iv
2.7.5 Issues with golf based EMG…………………………………..42
2.8 The role of segmental interactions……………………………………...43
3. Methodology……………………………………………………………………...45
3.1 Participants……………………………………………………………...45
3.2 Electromyographic set-up……………………………………………….45
3.3 Motion analysis set-up…………………………………………………..47
3.4 Synchronisation…………………………………………………………48
3.5 Data collection protocol………………………………………………...48
3.6 Data analysis…………………………………………………………….49
3.6.1 Kinematic data………………………………………………...49
3.6.2 Swing phases………………………………………………….51
3.6.3 Elbow and wrist angles………………………………………..52
3.6.4 EMG analysis…………………………………………………52
4. Results……………………………………………………………………………54
4.1 Elbow and wrist joint kinematics……………………………………….54
4.2 Muscle activity………………………………………………………….58
4.2.1 Biceps brachii…………………………………………………60
4.6.2 Triceps brachii………………………………………………...61
4.6.3 Anterior deltoid……………………………………………….63
4.6.4 Posterior deltoid……………………………………………….64
4.6.5 Upper trapezius………………………………………………..65
4.6.6 Latissimus dorsi…………….…………………………………67
4.6.7 Clavicular pectoralis major……………………………………69
4.6.8 Sternal pectoralis major……………………………………….71

v
5. Discussion………………………………………………………………………...73
5.1 The role of the arms……………………………………………………..74
5.2 The backswing and wrist cocking ………………………………………75
5.3 Transition and the initiation of the early forward swing………………..77
5.4 The early forward swing………………………………………………...79
5.5 Elbow extension and wrist uncocking…………………………………..84
5.6 The early follow-through………………………………………………..87
5.7 Muscular activity and segmental interactions…………………………..88
5.8 Delimitations and limitations…………………………………………...90
5.9 Recommendations for future study……………………………………..93
5.10 Study implications and future directions………………………………94
6. Conclusions ………………………………………………………………………97
7. References……………………………………………………………………....100
8. Appendices……………………………………………………………………...105
Appendix 1. Participant Information Sheet………………………………..106
Appendix 2. Consent Form………………………………………………...108
Appendix 3. Pre-Physical Activity Questionnaire (PAR-Q)………………109
Appendix 4. Muscle-electrode interface sites and MVC tests….................111
vi
List of Tables and Figures
Tables
Table1. Peak muscular activity by swing phase during the field hockey hit……….58
Figures
Figure 1. The field hockey hit: a) initiation of the hit and the start of the
backswing; b) top of the hit, the end of the backswing and the
start of the early forward swing; c) stick horizontal in the downswing,
the end of the early forward swing and the start of the acceleration
phase; d) ball impact, the end of the acceleration phase and the start
of the early follow-through; e) stick horizontal, the end of the early
follow-through and the start of the late follow through; f) end
of the swing………………………………………………………………….4
Figure 2. Motion of the left and right arms and the hockey stick during the
downswing of a male penalty corner striker, demonstrating the
double pendulum motion of the left upper limb and hockey stick
system and the triple pendulum motion of the right upper limb,
right lower limb and hockey stick system…………………………………19
Figure 3. Left and right elbow angles during the field hockey hit. The
values shown are the mean angles across all participants for each
normalised percentage of each swing phase ± SD, whereby 180
degrees is full extension……………………..................................................54
Figure 4. Left and right wrist angles during the field hockey hit. The values
shown are the mean angles across all participants for each normalised
percentage of each swing phase ± SD, whereby 180 degrees is full
extension…………………………………………………………………………...56
Figure 5. Biceps brachii activation, by percentage of swing phase, during
the field hockey hit (mean % MVC ± SD across all participants)……….60
Figure 6. Triceps brachii activation, by percentage of swing phase, during
the field hockey hit (mean % MVC ± SD across all participants)……….61
Figure 7. Anterior deltoid activation, by percentage of swing phase, during
the field hockey hit (mean % MVC ± SD across all participants) ………63
Figure 8. Posterior deltoid activation, by percentage of swing phase, during
the field hockey hit (mean % MVC ± SD across all participants)……….64
Figure 9. Trapezius activation, by percentage of swing phase, during the
field hockey hit (mean % MVC ± SD across all participants)…………...65
Figure 10. Latissimus dorsi activation, by percentage of swing phase, during

vii
the field hockey hit (mean % MVC ± SD across all participants)……….67
Figure 11. Clavicular pectoralis major activation, by percentage of swing
phase, during the field hockey hit (mean % MVC ± SD across all
participants)………………………………………………………………69
Figure 12. Sternal pectoralis major activation, by percentage of swing
phase, during the field hockey hit (mean % MVC ± SD across all
participants)………………………………………………………………71

1
1. Introduction
The field hockey hit is a two-handed swing motion which, due to the production of a
high ball velocity, is generally used for long range passing and for shooting at goal
(Murtaugh, 2000; Brétigny et.al. 2011; Willmott and Dapena, 2012) and serves to
give velocity to the game (Brétigny et.al., 2008). During the performance of the hit,
both hands are typically placed at the proximal end of the stick grip and the
technique employed resembles that of the golf drive or of the baseball or softball hit.
Numerous coaching manuals exist describing the field hockey hitting technique (for
example, Anders and Myers, 1999); however, these accounts are subjective and
remain primarily qualitative accounts, relying heavily on the personal experiences of
the authors. As a result, discrepancies exist between manuals, which ultimately could
lead to poor coaching of the field hockey hitting technique.
There is also a lack of quantitative biomechanical studies in the scientific literature
focussing upon the field hockey hit despite it being one of the most fundamental and
most commonly used techniques in the game (Mackey, 1964; Chivers and Elliot,
1987). The application of biomechanics to the field hockey hit is of benefit to both
coaches and players (Chivers and Elliot, 1987) and studies to date have ascertained
the general shape of the hit (Willmott and Dapena, 2012), the utilisation of proximal-
to-distal sequencing (Okuda et.al., 2011), coordination profiles (Brétigny et.al.,
2011) and the planarity of the hockey stick face (Willmott and Dapena, 2012), yet
little is still known about how the hitting motion is generated or controlled.

2
1.1 The field hockey hit
Hitting the hockey ball, as opposed to sweeping or pushing the ball, can give rise to
an increased ball velocity. The ‘classic’ hit is the most common hitting technique
used in field hockey and is preferred to other hitting techniques, such as the short-
handle grip, due to the higher ball velocity developed (Brétigny et.al., 2008). The
classic hit utilizes a double ‘V’ grip for the duration of the hit (England Hockey,
2005) (Figure 1.). Field hockey is a ‘right-handed’ sport, whereby the head of the
stick is ‘flat on the left hand side only’ (FIH, 2012). Consequently, the stick is swung
from right to left during the downswing of the ‘classic’ hit (Murtaugh, 2000;
Brétigny et.al., 2011).
Techniques for hitting the hockey ball and mechanisms for increasing stick speed
and acceleration have been proposed in the coaching literature. It has been suggested
that the player should adopt a side-on stance with the left shoulder facing in the
direction of the target to increase weight transfer between the right foot and the left
during the hit (Wein, 1979). It has also been proposed that the player should
maintain a low body position during the backswing, keeping the left arm straight for
the entirety of this phase and that the right arm should flex at the elbow to
accommodate the movement of the stick to the right (Anders and Myers, 1999). At
the start of the backswing, whilst the stick is being drawn to the right, it is advised
that a step towards the ball with the left foot is taken to provide a large base of
support for increasing forward momentum by facilitating weight transfer (Gros,
1979). Both Gros (1979) and Wein (1979) proposed that a player could increase their
forward momentum prior to the hit if a run-up is adopted before the stride to the ball
is taken and that if a run-up is adopted, to account for a greater transfer of weight

3
onto the front foot, it is advised that the ball should be positioned slightly further
away from the lead foot than if the player was stationary before the stride (Wein,
1979). Gros (1979) suggested that during the backswing, weight is transferred from
the left foot to the right yet weight shifts back to the left foot before the end of this
phase, accompanied by rotation of the hips and shoulders back towards the target.
The shoulders should turn to facilitate a greater range of motion and the wrists
should ‘cock’ while the stick proceeds through the whole backswing.
Barnes and Kentwell (1979) suggested that momentum should be transferred from
the lower body, to the upper limbs and the stick during the downswing and that the
hands pull the stick towards the ball as weight is shifted back onto the left foot and
that this transfer of weight flattens the swing arc of the stick, helping to improve
accuracy during the downswing (Barnes and Kentwell, 1979). Chivers and Elliott
(1987) proposed that the acceleration of the stick in the late downswing comes from
the straightening of the right arm and from ‘uncocking’ of the wrists accompanied by
pronation of the right forearm prior to impact, and Read (1976) noted that at ball
impact the arm and hands lead the stick with the extension of the left elbow allowing
the stick to act as an extension of the left arm (Figure 1.).

4
Figure 1. The field hockey hit: a) initiation of the hit and the start of the backswing; b) top of the hit,
the end of the backswing and the start of the early forward swing; c) stick horizontal in the
downswing, the end of the early forward swing and the start of the acceleration phase; d) ball impact,
the end of the acceleration phase and the start of the early follow-through; e) stick horizontal, the end
of the early follow-through and the start of the late follow through; f) end of the swing.
Studies into other two-handed swing motions could provide biomechanical insights
into the hockey hit. Due to the unique nature of the field hockey hit though, the
differences that exist between the hit and other two-handed swinging motions should
therefore be appreciated. In field hockey the ball being struck is of a greater mass
than the golf ball and is usually moving, resulting in little time for a pre-rehearsed
address phase to a stationary ball, of the type seen in golf, unless the performer is
taking a hit out or a free hit. Even in situations where the hockey ball is not moving,
the step towards the ball is still utilised in an attempt to increase ball velocity.
Usually though, the field hockey hit is performed when both the player and the ball
are moving. Baseball players also aim to hit a moving ball that is travelling towards
them, yet the contact point between the bat and the ball is off the ground.
Changing environmental task conditions, for example the speed and direction in
which the hockey ball is travelling, affect temporal aspects of the hit (Franks et.al.,
1985) and this consequent variability in the kinematics of the hit would have a
a b c
d e f
5
relative influence on muscular activation patterns of the upper limbs and the trunk to
possibly produce, for each hit, a slightly different movement pattern. These
differences therefore make extrapolation of EMG data from other sports to the
hockey hit difficult.
Electromyographic (EMG) activity patterns have been studied in sports that utilise
similar movement patterns to those displayed when performing a field hockey hit;
for example, in baseball, softball and most extensively in golf (Jobe et.al., 1989;
Abernethy et.al., 1990; Ellenbecker et.al., 2006; Escamilla and Andrews, 2009).
However, contrasting findings with regard to the timing and magnitude of muscle
activity during other swing motions, and also the inherent differences in performance
between other two-handed swings and the field hockey hit, makes extrapolation to
the hockey hitting motion difficult. Knowledge of muscular activation patterns in
relation to the field hockey hit could begin to detail their contribution not only to the
production and control of the hit, but also to skilled performance and ball velocity.
Moreover, changes in technique, strength training programs and injury prevention
and rehabilitation strategies could be developed and initiated.
Underlying muscular activation patterns during the performance of the field hockey
hit have only briefly been presented in the scientific literature, despite their influence
on the production and control of such motions. To date, there has only been one
study focussing upon the collection of EMG data during the field hockey hit.
Murtaugh (2000) published an un-normalised linear envelope of EMG recorded from
four selected trunk muscles during a field hockey hit. This data though, provided
little quantitative information as to the contribution or the role of each muscle to the

6
hit. Therefore a description of muscular activity of the trunk and upper body during
the hit does not exist. Putnam (1993) however, provided evidence to show that
movement can be a consequence of the interactions between moving segments and
that muscular activity is not necessarily required to produce motion. Consequently,
the causes of the motions seen during the field hockey hit might not necessarily be
attributable to the muscles crossing the joint where the motion is seen.
Alongside ambiguity as to the timing and magnitude of muscular activity, the
kinematics of the hit also remain unclear with the role that each arm plays during the
field hockey hit being particularly uncertain. Chivers and Elliott (1987), in one of
only two studies - the other being Elliott and Chivers (1988) - proposed that the left
arm can be represented by a double pendulum model consisting of the left arm
system and the hockey stick and that the right arm can be represented by a three-
segment model consisting of the right upper arm, the right forearm and the hockey
stick during the field hockey hit.
The aim of this investigation was to establish muscular activity patterns during the
field hockey hit. This is the first study to detail the timing and magnitude of
muscular activation during the field hockey hit and in particular aimed to question
the contribution of the deltoids and the timing of pectoralis major and latissimus
dorsi to the hit. Moreover, this study aimed to synchronise EMG data with kinematic
data from the hockey hit to make meaningful kinetic assumptions as to the temporal
contributions of EMG activity to the performance of the hit and, where EMG activity
is not prevalent, to provide meaningful assumptions as to the possible cause of the
kinematic patterns observed. Furthermore, this will provide the basis for

7
investigation of the role of the trunk and arm musculature to the production and
control of the field hockey hit and allow investigation into the differing roles of the
arms based on previous speculations made by both Chivers and Elliott (1987) and
Elliott and Chivers (1988).

8
2. Review of Literature
2.1 Phases of the field hockey hit
Field hockey based studies have typically divided the hit into three phases: the
Backswing, the Downswing and the Follow-through (Franks et.al., 1985). The
backswing of the hockey hit has been defined as a hockey stick motion away from
the ground (Brétigny et.al., 2011) and involves lifting of the arms, initiated by a
rotation of the shoulders and of the trunk (Chivers and Elliott, 1987). However, at
the commencement of the field hockey hit, Franks et.al. (1985) found that prior to
the backswing itself, an initial preparatory phase is seen, termed the ‘initiation
phase’. This was characterised not by a movement of the stick head away from the
ground, but towards it. Despite this, Franks et.al. (1985) still showed the backswing
as beginning at the stick’s lowest point in relation to the ground, encompassing
motion of the stick head in the opposite direction to the motion seen during the
initiation phase (i.e. away from the ground). The backswing begins with backwards
rotation of the trunk and shoulders, ending with both the right shoulder and hip
higher than the left shoulder and hip (Chivers and Elliott, 1987). The downswing of
the stick face begins at its transition from the backswing (Brétigny et.al., 2008), and
corresponds to stick motion in an opposite direction to that of the backswing, back
towards the ball (Brétigny et.al., 2011). Chivers and Elliott (1987, pp. 7) noted that
this motion was not confined to the same plane as the backswing, rather, it ‘curved
backwards then downwards and forwards in an oblique plane’. The follow-through
was defined as stick motion from impact with the hockey ball to the end of the hit
(Brétigny et.al., 2011), with the body moving in an extended position during this
phase (Chivers and Elliott, 1987) (Figure 1.). These accounts though, provide little

9
explanation as to the definitions of the phases, stick or body movements during the
phases, or the events that define the transitions between them.
2.2 Phases of the golf swing
The golf swing is the swing motion that demonstrates the most similar movement
patterns to those of the hockey hit which has been analysed using EMG. Studies that
utilise EMG and motion analysis techniques within golf-orientated research have
categorised the golf swing as consisting of five phases: the Backswing (BSw), the
Early Forward Swing (EFSw), Acceleration (Acc), the Early Follow-through (EFTh)
and the Late Follow-through (LFTh). Each of these swing phases have been
described as beginning and ending with clearly definable temporal events, thus
providing more robust definitions of each phase. Alongside this, descriptions of the
movements made during each phase are more prevalent and more extensive in the
golfing literature.
The BSw of the golf swing has been defined as being from the first motion of the
club away from the ball at address to the top of the swing (Jobe et.al., 1986;
Mitchell, et.al., 2003; McHardy and Pollard, 2005, Okuda et.al., 2010). The BSw is
characterised by rotation of the shoulder complex to the right, with subsequent right
arm abduction, flexion and external rotation and simultaneous corresponding
adduction, flexion and internal rotation of the left arm to take the golf club
backwards (McHardy and Pollard, 2005). The purpose of the BSw is to align the
golfer’s hub centre and club head and to stretch the muscles and joints that are
responsible for power generation during the forward swing and acceleration (Hume
et.al., 2005). Throughout the BSw phase of the golf swing, muscle activity was

10
observed as being low to moderate. This therefore suggests that the lifting of the
arms and the golf club during the BSw is not a strenuous activity (Escamilla and
Andrews, 2009).
The next phase of the golf swing, the start of the downswing, has also been termed
the early forward swing (Jobe et.al., 1986; Escamilla and Andrews, 2009; Farber,
et.al., 2009). This phase begins at the transition from the BSw and finishes when the
club and the ground are again horizontal to each other (Jobe et.al., 1986; Jobe et.al.,
1989; McHardy and Pollard, 2005). The purpose of this phase is to initiate
downward motion of the club (Hume et.al., 2005) and is characterised by starting to
return the body back to the ball in preparation for contact, initiated by hip and pelvic
rotation to the left, producing a combined movement of left shoulder girdle rotation
and anti-clockwise scapular rotation (McHardy and Pollard, 2005).
The Acc phase of the downswing, sometimes termed the ‘late forward swing’ or the
‘late downswing’ (McHardy and Pollard, 2005) commences when the golf club is
horizontal with the ground, continuing through to ball contact (Jobe et.al., 1986;
Jobe et.al., 1989; McHardy and Pollard, 2005). In golf, it has been proposed that the
purpose of the Acc phase is to continue to return the club head to the ball in the
correct plane with maximum velocity, accelerating the club with the left arm
dictating the plane of the club and the right arm providing power in the latter part of
the downswing (Hume et.al., 2005), however, this is only an assumption and
remains untested. This phase has been termed the ‘most active’ of the entire golf
swing (McHardy and Pollard, 2005; Escamilla and Andrews, 2009) and is
characterised by a continuation of the movements seen during the EFSw. The left

11
arm demonstrates adduction and external rotation, whilst on the right side scapular
protraction is maintained before wrist un-cocking occurs, just before the point of
contact between the club head and the golf ball (McHardy and Pollard, 2005). A
delayed straightening of the left elbow maintains a lower moment of inertia (Loftice
et.al., 2004) and maximises stick head acceleration during the Acc phase of the golf
swing (Egret et.al., 2006; Zheng et.al., 2008). The golf swing has also been shown to
be planar with inclination of the golf swing plane to horizontal varying, falling
within a range of 59.1° when swinging a pitching wedge to 47.2° to when swinging a
driver, becoming more shallow with the use of longer clubs (Kwon et.al., 2012).
The EFTh phase starts immediately at the moment that ball contact is initiated and
continues until the club is horizontal to the ground, forward of the performer’s
original starting position (McHardy and Pollard, 2005). Also called the
‘deceleration’ phase (Escamilla and Andrews, 2009), the EFTh is characterised as
being the phase during which deceleration of the trunk rotation occurs accompanied
by left arm external rotation and right arm internal rotation (McHardy and Pollard,
2005). Lastly, the LFTh starts when the club reaches horizontal to the ground after
ball impact and continues to the completion of the swing (Jobe et.al., 1986;
McHardy and Pollard, 2005).
2.3 Biomechanical mechanisms
From kinematic studies of the golf swing, it has been suggested that movement of
the body segments in a sequential motion is one of the most predetermining factors
for the successful performance of the motion pattern for the golf swing (Okuda et.al.,
2010). Therefore, theoretically, more proximal body segments should attain their

12
peak velocities before more distal segments in order to implement a powerful and
coordinated motion during the swing (Okuda et.al., 2010). Through optimisation
calculations it has been confirmed that maximal golf club head speed is achieved
when the ‘torque generators commence in sequential order from proximal to distal’
(Hume, 2005, pp. 435). Joint contribution to the golf swing has been determined at
70% for the wrists, 20% for the shoulders and 5% for both the spine and the hips
(Hume, 2005). Okuda et.al. (2002) proposed that technique and proximal to distal
timing patterns of EMG activation were more important than stature or muscular
strength for the optimal transfer of momentum through the kinetic chain, however,
this study made assumptions based upon data from only one player. Moreover,
elements of technique are individual to the performer, necessitated by physical
stature. A skilled golf swing will use a conservation of angular momentum and
centrifugal force to maximise club head velocity at impact (Hume, 2005).
The earlier rotation of the hips back towards the target line whilst the shoulders are
still rotating backwards during the BSw promotes the stretch-shortening cycle (SSC)
(Ferdinands, 2010). The modern golf swing is a powerful SSC activity during which
the muscles of the trunk and upper limbs are ‘rapidly stretched prior to shortening’
(Hume et.al., 2005, pp. 436). The action of stretching and then shortening of a
muscle group in a short period of time should augment efficiency in a concentric
contraction thus the effective utilisation of the SSC will facilitate the golfer in hitting
the ball greater distances (Ferdinands, 2010). After the instigation of the SSC during
transition, the ‘major power accentuating muscles are most strongly activated during
eccentric contractions’ (Ferdinands, 2010, pp. 72). Hume et.al. (2005) proposed that
the left shoulder complex supplies a large portion of the power of the golf swing.

13
Thus, it is essential that the shoulder musculature and the other muscles that are
active during the downswing be stretched during the late BSw. Alongside this,
musculature of the shoulder may have already been activated at that point to help
bring the BSw to an end.
Increases in muscular activity of the agonists of the BSw, such as the left
subscapularis and the right upper trapezius and increased rotation of the trunk would
stretch the muscles utilised during the downswing thus increasing shoulder turn at
the top of the golf swing by increasing the rotation of the shoulders.
Whilst the stretching of the muscles involved in the downswing during the BSw may
be fundamental to performance of the golf swing, the magnitude of the subsequent
shoulder turn in relation to hip rotation at the top of the golf swing may be a more
pertinent measure of performance. McLean (1992) termed this the ‘X-factor’ and he
suggested that the X-factor might be of more importance than the absolute turn of the
shoulders. An offset between shoulder and hip rotation has been observed in both
skilled and lower skilled golfers (Cheetham, 2001) with increases in the X-factor at
the top of the golf swing being attributed to improved performance. Moreover,
increased X-factor at the top of the swing has also been used as an indicator of
ability level and of the performance of variables such as drive distance (McLean
et.al., 1992; McTeigue et.al., 1994; Burden et.al., 1998; Cheetham et.al., 2001).
The maximal X-factor generated during the EFSw has been termed the ‘X-Factor
stretch’ (Cheetham, 2001). During transition, muscles of the trunk are being
stretched because the shoulders are still rotating backwards even as the hips rotate
forwards. Okuda et.al. (2002) found that as the club head was completing the BSw

14
and musculature of the right shoulder continued to aid club elevation, musculature of
the right lower body was initiating abduction and extension of the right hip, possibly
providing additional eccentric contraction of the upper body as the hips return back
towards the target line.
The X-factor stretch has proven to be a more consistent measure of performance than
the X-factor at the top of the swing, with professional players having a significantly
greater X-factor stretch compared to amateur players (Cheetham, 2001). This
significant increase in X-factor stretch during the EFSw was a result of professional
players initiating the downswing ‘by rotating their hips back towards the hole’
(Hume, 2005, pp. 437), a trait more pronounced in higher skilled golfers (McTeigue
et.al., 1994; Burden et.al., 1998) as they continued to rotate their shoulders away
from the direction of the target as the hips began turning back to the target line
(Burden et.al., 1998). Continuing to turn the trunk and upper body away from the
target whilst leading with the hips would result in an increase in the X-factor stretch
during the EFSw, allowing the golfer to utilise a greater SSC and for the the transfer
of momentum from proximal to distal body segments to be its most effective (Okuda
et.al., 2010).
2.4 Kinematics of the hockey hit
The kinematics of the hockey hit have been previously studied, yet information still
remains sparse. The plane of the hockey stick face, the differing shapes of the
backswing and the variability of temporal parameters of the hit have all been studied
but only begin to provide an insight into the motion.

15
In field hockey, the shape of the path that the stick face follows during the BSw has
been shown to vary (Willmott and Dapena, 2012). In their work on the planarity of
the field hockey hit, Willmott and Dapena (2012) found that their participants
utilised two different stick face paths to execute the hit. The first stick face path was
a path that was similar during both the backswing and the downswing. The second
was a curved stick face path that was ‘above its path during the subsequent
downswing’ (Willmott and Dapena, 2012, pp. 373). These two techniques were
categorised as ‘straight’ and ‘looped’ respectively. Ultimately, the stick face path
and therefore the swing shape differed between the two groups, with the length of
the downswing being longer in the looped swing (2.88 ± 0.28m) compared to the
straight swing (2.45 ± 0.28m) (Willmott and Dapena, 2012). Due to the employment
of different swing shapes when executing a field hockey hit, it may be difficult to
define exactly where the BSw ends and the EFSw begins, especially when analysing
the looped hit. Willmott and Dapena (2012, pp. 373) proposed that the criterion for
determining the transition between the BSw and the EFSw to be the ‘instant when
the stick face began its final uninterrupted increase in speed through to impact’.
The motion of the stick face in the field hockey hit has been shown to be planar for
large portions of the downswing; on average being planar for the last 83 ± 12% of
the downswing (Willmott and Dapena, 2012). This is a trait more prevalently seen
with a straight swing yet is also apparent in the looped swing, with the portion of the
downswing over which the stick face motion is planar being similar to the planar
portion of the downswing of the club head in golf (Willmott and Dapena, 2012). In
field hockey, the planar region of the stick shaft in the downswing starts on average

16
35° and 20° above horizontal during the EFSw for straight and looped swings,
respectively (Willmott and Dapena, 2012).
In the field hockey hit, the straightening of the right arm (Wein, 1979) and wrist
uncocking (Anders and Myers, 1999) causes the final acceleration of the stick face
and the stick acts as an extension of a straight left arm at ball impact (Read, 1976;
Gros, 1979). At impact with the hockey ball, left arm extension reaches
approximately 170°, whilst extension of the right elbow during Acc causes the right
elbow to extend to approximately 140°. For the first half of the downswing the wrists
remain cocked (Chivers and Elliott, 1987), before extending to 165-170° at ball
impact (Chivers and Elliott, 1987). The angles of the elbows and wrists indicate that
the hands lead the stick head at ball impact (Chivers and Elliott, 1987; Elliott and
Chivers, 1988).
The inclination of the plane of the hockey hit was orientated at 42.2 ± 4.5° for the
straight swing and 38.2 ± 7.3° to horizontal for the looped swing (Willmott and
Dapena, 2012) and is much shallower than that of the golf swing. The hockey stick
shaft becomes planar before it becomes horizontal during the EFSw. Therefore, the
stick face motion for the ‘period when most speed is added to the stick face’ remains
planar throughout continuing to impact with the hockey ball (Willmott and Dapena,
2012, pp. 376).
Temporal parameters of the field hockey hit have been shown to be subject to
variability. Franks et.al. (1985) reported that with varying uncertainty of task
demand, hockey players utilised changes in the spatial location of the start of the

17
BSw and showed increases in BSw variability to ‘produce a consistent and ballistic
downswing’ (Franks et.al., 1985, pp. 91), with both novices and more experienced
hockey players conserving temporal consistency despite differing technical
parameters to employ a more temporally consistent and less variable downswing
(Burges-Limerick et.al., 1991; Kusuhara, 1993; Brétigny et.al., 2008). Bootsma
(1988) proposed that continuously, players attend to visual information and fine-tune
movement during its execution. The variability seen during repetitive actions is a
mechanism to adapt to interactions between organismic, environmental and task
constraints (Abernethy et.al., 1990). The step towards the ball in the hockey hit
would bring about variability in left foot placement in terms of distance and angle
from the ball being struck and produce differences in the angle between the trunk
and shoulders and the target line. Even if hitting a stationary ball, these changes
would therefore manifest themselves in subtle alterations in task performance,
possibly affecting underlying muscle recruitment and EMG activation patterns for
each hit. Brétigny et.al. (2011) proposed that the high standard deviation seen in
joint kinematics during the hockey hit were indicative of several different hit
solutions with movement coordination patterns changing as a determinant, not
necessarily of task variability, but of playing position. Differing muscular activation
patterns could cause the changes in temporal parameters and hit coordination profiles
demanded by task variability, or the hit shape differences based upon playing
position.
2.5 The role of the arms
Little is known to guide us about the kinematics of the hockey hit and the role that
each arm plays during the hit. The only studies that focus upon three-dimensional
kinematics of the stick and the body during the field hockey hit are provided by

18
Chivers and Elliot (1987) and Elliott and Chivers (1988), with little expansion on the
role of the upper limbs.
In sports where the main emphasis of the impact is on velocity, it would be
reasonable to assume that the optimal sequencing pattern of the upper limbs would
be one of three segments, consisting of the upper arm and the forearm in addition to
the striking implement, as suggested by Elliot and Chivers (1988), to theoretically
allow the maximisation of proximal-to-distal sequencing and to allow elbow
musculature to contribute to the movement. However, Milburn (1982) reported a
double pendulum, pivoting at the shoulder joint and hinged at the wrist, to be the
pattern during the golf swing. Elliot and Chivers (1988) theorised that the hockey hit
adopts a double pendulum for the left arm and stick system and a three-segment
model for the right upper arm, forearm and stick system (Figure 2). This figure
however, presents difficulties in its interpretation. Firstly, the figure makes the
presumption that the proximal ends of the arms rotate around a fixed axis mid-
shoulders throughout the hit, which, from photographic movement sequencing,
Elliott and Chivers (1988) show does not happen. Furthermore, the definition of the
left and right arms is unclear and there remain seven time instances before impact
presented alongside only three shoulder positions.

19
Figure 2. Motion of the left and right arms and the hockey stick during the downswing of a male
penalty corner striker, demonstrating the double pendulum motion of the left upper limb and hockey
stick system and the triple pendulum motion of the right upper limb, right lower limb and hockey
stick system. The values at each stick head position represent the time relative to ball impact (from
Elliott and Chivers, 1988).
It was suggested that much of the power in the field hockey hit is derived from the
lower limb action and the rotation of the trunk and the shoulders is such that the
upper limbs and then the stick are finally rotated towards the ball (Elliott and
Chivers, 1988). At the start of the EFSw of the field hockey hit, Chivers and Elliott
(1987) reported that, on a different plane to which the hockey stick was moved
during the BSw, the right elbow increases to 80°-90° of flexion. After this early
flexion of the right elbow, the left arm dictates the plane of the stick (Chivers and

20
Elliott, 1987) and ‘the left arm guides the stick motion, whereas the right arm serves
as a support to the movement’ (Brétigny et.al., 2011, pp. 342). Despite a few
studies, there remains little kinematic data on the hockey hit and no experimental
EMG data for musculature of the arms during the hit. The roles of the arms and the
contribution of muscular activity to the kinematics of the hockey hit have therefore
not been measured empirically and have only been speculatively summarised.
Budney and Bellow (1990) reported that during the golf swing the left arm applied
force to the golf club before the right arm did during the golf downswing and that the
left hand had control of the club at impact with no force from the right hand.
However, Hume (2005) assumes that the right arm does provide power in the latter
part of the downswing. The role of the arms therefore, remains unclear and there is
little biomechanical evidence to support any of the assertions made as to the roles of
the arms during the hockey hit, the golf swing or during other hitting motions.
2.6 Muscular activity
As there are no EMG analyses in the scientific literature on upper limb musculature
during the field hockey hit and data on trunk muscular data is sparse and speculative,
information must be gleaned from EMG studies into the closest comparable motions
to the hockey hit for which EMG analyses have been performed. Most extensively,
EMG analysis focuses upon the performance of the golf swing.
2.6.1 Backswing
During the BSw of the golf swing, to aid the rotation of the shoulder complex and
the abduction of the right arm, the muscles displaying the greatest amount of EMG
activity in the upper body on the right side during the golf swing are the upper

21
trapezius (working at 52% of its maximal manual muscle strength test (MMT)) and
the middle trapezius (37% MMT) (Kao et.al., 1995; McHardy and Pollard, 2005),
which display their highest activity during the BSw when compared to their activity
across the other phases of the golf swing. Alongside trapezius activity, Kao et.al.
(1995) also show notable activity from the levator scapulae and the rhomboids of the
right arm (29 ± 19% and 30 ± 18%, respectively).
The lower and middle trapezius, as well as the levator scapulae exhibit moderate
activity during the BSw to elevate and upward rotate the scapula (Escamilla and
Andrews, 2009) whilst the right levator scapulae also aids the rhomboids to retract
the scapular during the BSw then proceed to stabilise it throughout the rest of the
swing (Kao et.al., 1995).
The supraspinatus (approximately 45% MMT) was noted as being the ‘only active
muscle on the right side’ during the BSw (Jobe et.al., 1986, pp. 390) possibly
causing abduction of the right arm and aiding the stabilisation of the shoulder
complex (McChesney, 2004), however, lower activity was recorded by both Pink
et.al. (1990) and Jobe et.al. (1989). To cause lateral right arm humeral rotation and
to work in synergy with the supraspinatus to stabilise the shoulder, the right
infraspinatus demonstrated similar activity levels to that of the supraspinatus
throughout the BSw (Jobe et.al., 1989; Pink et.al., 1990). Both infraspinatus and
supraspinatus activity in the right arm were highest during the BSw, firing around
25% MMT (Pink et.al., 1990) and showed similar firing patterns after the
commencement of the EFSw with infraspinatus activity dropping to 13 ± 16% MMT
and supraspinatus activity falling to 14 ± 14% MMT (Jobe et.al. 1989), therefore

22
indicating contributory activation only during the BSw and implying relatively low
rotator cuff activity for the remainder of the swing (Escamilla and Andrews, 2009).
Jobe et.al. (1989) noted right arm posterior deltoid activity (17% MMT) as being a
contributory factor to the BSw, moving the arm backwards and aiding the lateral
rotation of the humerus. However, as the supraspinatus tendon and insertion is
attached to the joint capsule of the shoulder, it begins to abduct the arm prior to
contraction of the deltoid (McChesney, 2004), which may result in suppression of
deltoid activity, especially as the BSw is not a strenuous activity (Escamilla and
Andrews, 2009). Other muscular activity was recorded but was deemed low enough
to be non-contributory to the backswing motion (< 15% MMT; Jobe et.al., 1986).
In the left arm during the BSw of the golf swing, there was found minimal activity
from all the muscles studied except for the subscapularis, which was reported as
showing ‘marked’ activity of 33% MMT (Pink et.al., 1990). Pink et.al. (1990) also
showed activation of the left supraspinatus (21 ± 12% MMT) and of the left
pectoralis major (21 ± 32% MMT), possibly aiding the adduction and medial
rotation of the left upper limb during the BSw. Low levels of activity were also seen
from the latissimus dorsi (17 ± 13% MMT), infraspinatus (14 ± 12% MMT) and the
anterior deltoid (13 ± 13% MMT) (Pink et.al., 1990).
There was little activity of the scapular muscles of the left arm throughout the BSw
with the exception of the upper serratus anterior (30 ± 15% MMT) (Kao et.al., 1995)
and the lower serratus (27 ± 11% MMT) (Kao et.al., 1995). It was also proposed by
Kao et.al. (1995) that little left trapezius activity was recorded in the left arm as a
consequence of allowing for scapular protraction. Moreover, this explanation was

23
also attributed to account for the diminished levator scapulae and rhomboid muscle
activity recorded for the duration of this phase (Kao et.al, 1995). Therefore it could
be expected that pectoralis minor activity could be increased during this phase in
order to anteriorly rotate the left shoulder as the left arm moves across the body, yet
this has not yet been studied empirically.
2.6.2 Early forward swing
The muscle displaying the greatest amount of activation in the right arm during the
EFSw (65% MMT) (Jobe et.al., 1986) was the pectoralis major (Jobe et.al., 1986;
Jobe et.al., 1989; Pink et.al., 1990). Activation of the pectoralis major would cause
the flexion and adduction (McChesney, 2004) seen during the early downswing and
aid the medial rotation of the arm, and subsequently the golf club, prior to the Acc
phase. Also active, but firing at moderate levels (50 ± 38% MMT) were the
latissimus dorsi (Jobe et.al. 1986; Jobe et.al., 1989; Pink et.al., 1990) and the
subscapularis (49 ± 31% MMT) (Jobe et.al., 1986; Jobe et.al., 1989; Pink et.al.,
1990), both detailing activation to protract the scapula and to produce right arm
adduction and internal rotation (Escamilla and Andrews, 2009).
Opposed to the pectoralis major, Clarys and Cabri (1993) found that the latissimus
dorsi showed the greatest amount of activity in the downswing alongside marked
activity from the triceps, increasing right elbow extension, with only moderate
activity being collected from the pectoralis major accompanying the initiation of
adduction and medial rotation of the upper right limb throughout this phase. Being
the only segment of the deltoid to do so, the anterior deltoid showed an increase in
activity from the BSw, rising from 5 ± 6% MMT to 21 ± 23% MMT (Jobe et.al.,

24
1989), however this was not described as being significant. Pink et.al. (1990) also
documented activation of the anterior deltoid yet both the middle and posterior
deltoids of the right arm remained firing at low levels throughout the EFSw (Jobe
et.al., 1989). Despite increases in activation, it was noted that all segments of the
deltoid were still firing at only a minimal level throughout all phases of the golf
swing (Jobe et.al., 1986; Jobe et.al., 1989).
Kao et.al. (1995) attributed increased activation of both the right upper serratus
anterior and lower serratus anterior (58 ± 39% MMT and 29 ± 17% MMT,
respectively) to aiding scapula protraction, which subsequently stayed active for the
remainder of the swing. Right arm activity of the upper and lower trapezius, initiated
before the EFSw during the BSw, rapidly tapers off during the EFSw and remains
low for the remainder of the swing phases to allow for right arm scapula protraction
(Kao et.al., 1995).
Despite showing little activity during the BSw phase, the rhomboids (46 ± 27%
MMT) and the levator scapulae (38 ± 39% MMT) increase their activity into and
throughout the EFSw to retract the scapula (Kao et.al., 1995). The increases in
activity indicate that these muscles play a role in stabilisation and control of the
scapula rotation and protraction, possibly eccentrically, in the right arm (Kao et.al.,
1995). Despite reports by Pink et.al. (1990) and Kao et.al. (1995), it was
documented that the pectoralis major (64% MMT) was the most active muscle
during the EFSw, followed by the upper serratus (58% MMT) (Jobe et.al., 1989).

25
The latissimus dorsi is the most active muscle on the left side during the EFSw (46 ±
25% MMT) (Jobe et.al., 1986; Jobe et.al., 1989). There was more activation of this
muscle during the EFSw than in any other phase of the golf swing; however this was
not of a significant level (Pink et.al., 1990). Left subscapularis activity was also
recorded, dropping only slightly from 33% MMT during the BSw to 29% MMT
during EFSw, and was the second most active muscle behind the latissimus dorsi
(Jobe et.al., 1989). Alongside subscapularis activity, marked activity of the
supraspinatus and the posterior deltoid was recorded by Jobe et.al. (1989). However,
the rhomboids (68 ± 27% MMT), the middle trapezius (51 ± 26% MMT) and the
lower trapezius (49 ± 27% MMT) have also been shown to be highly active (Kao
et.al., 1995; McHardy and Pollard, 2005). The levator scapulae and rhomboid
muscles show increases in activity from the BSw into the EFSw as the arms move
the club towards ball contact to aid in scapula stabilization, retraction and elevation
(Kao et.al., 1995; Escamilla and Andrews, 2009). Data from Pink et.al. (1990) show
that left infraspinatus and the left supraspinatus demonstrated the least amount of
activity of the muscles they studied.
2.6.3 Acceleration
During Acc on the right side, the musculature recorded as being the most active were
the latissimus dorsi (Jobe et.al., 1986; Jobe et.al., 1989; Clarys and Cabri, 1993), the
pectoralis major (Jobe et.al., 1986; Jobe et.al., 1990; Pink et.al., 1990; Clarys and
Cabri, 1993), both reaching values in excess of 100% MMT, and the subscapularis
(Jobe et.al., 1986; Jobe et.al., 1990; Pink et.al., 1990).

26
Bursts of muscle activity, such as seen from both the latissimus dorsi and the
pectoralis major during Acc, can reach values in excess of 100% MMT as values
obtained from MMT normalisation contractions are for a sustained effort (Jobe et.al.,
1986) and not from dynamic, ballistic muscular contractions. The latissimus dorsi
and the subscapularis both fire at moderate levels during the EFSw before combining
with the pectoralis major to produce power and therefore club head speed during Acc
(Jobe et.al., 1986). The major drive of the Acc phase (the timing of latissimus dorsi
and pectoralis major activity) is such that the Acc phase drives the golf club toward
its maximum potential velocity just prior to impact (Jobe et.al., 1986). Thus, these
muscles may be the most important muscles of the upper extremity for producing
‘power’ and acceleration of the arm during the golf swing (Escamilla and Andrews,
2009).
From these studies it appeared that these were the only three active muscles on the
right side during the Acc phase, and consequently the only muscles to show
increases in activity during this phase compared to the EFSw: from 52 to 112%
MMT for the pectoralis major, from 44 to 82% MMT for the subscapularis and from
43% MMT to 81% for the latissimus dorsi (Jobe et.al., 1989). However, right
latissimus dorsi activation has been noted to drop between the EFSw and Acc, yet
remained considerably more than was observed throughout the BSw and the EFTh,
and was still the third most active muscle during Acc behind the pectoralis major and
the subscapularis, respectively (Pink et.al., 1990). Bilaterally, in the field hockey hit,
the latissimus dorsi and pectoralis major appear to be most crucial for power
development during the downswing (Murtaugh, 2000).

27
All other muscles, notably the supraspinatus, were found to demonstrate declines in
activity. No other rotator cuff muscle or any deltoid muscle on the right side was
significantly active during this phase (Jobe et.al., 1989). However, Clarys and Cabri
(1993) determined that muscular activity on the right side was not confined to the
pectoralis major, latissimus dorsi and the subscapularis. They showed a marked
activity burst from the triceps brachii prior to and at ball impact, causing late
extension of the right elbow and possibly aiding wrist un-cocking in the latter part of
the Acc phase. Also, Clarys and Cabri (1993) observed activity of the middle
trapezius, posterior deltoid and the wrist flexors and extensors, perhaps aiding power
production and club head velocity, stabilising the shoulder joint, or helping to un-
cock the wrists.
Kao et.al. (1995) found significant activity of the upper serratus (69 ± 29% MMT)
and lower serratus (51 ± 33% MMT) yet this was not compared to muscles
demonstrating activity from other studies, as the focus of this research was solely
upon scapular muscles. Serratus anterior activity, increasing from already marked
activity during the EFSw, can be seen during Acc suggesting that increases in club
head speed may be helped by a combination of protraction of the right scapula and
trunk rotation (Kao et.al., 1995).
Firing at levels in excess of 90% MMT, the muscles on the left side during Acc
firing at high rates are the pectoralis major (Jobe et.al., 1986; Jobe et.al., 1989; Pink
et.al., 1990), the latissimus dorsi (Jobe et.al., 1986; Jobe et.al., 1989; Pink et.al.,
1990) and the subscapularis (Jobe et.al., 1986; Jobe et.al., 1989). These are the only

28
muscles demonstrably to do so (Jobe et.al., 1986), with no other muscles showing
considerable firing activity on the left side during Acc (Jobe et.al., 1989).
Kao et.al. (1995), in their study of scapular muscles, found the most active muscle in
the left arm during the golf swing to be the levator scapulae (62 ± 46% MMT),
showing significantly more activation in this phase than at the extremes of the golf
swing (Kao et.al., 1995). The second highest activity was found from the rhomboid
muscles (Kao et.al., 1995) and activity was also found from all three portions of the
trapezius to retract and upwardly rotate the scapular with the upper portion during
Acc showing relative peak activity (Kao et.al., 1995).
As a possible aid to wrist un-cocking, Abernethy et.al. (1990) noted activity from the
left posterior deltoid in the late downswing, particularly prior to wrist un-cocking.
‘The need to provide muscle force is accentuated by the fact that the reaction force at
the wrist would tend to bring about an acceleration in the opposite direction to the
one required by the shot’ (Abernethy, et.al., 1990, pp. 3). Therefore, the increased
posterior deltoid activity and consequent muscular action is consistent with the need
to continue to provide a torque around the shoulders in order to keep the upper arm
moving in the direction of the target (Abernethy et.al., 1990). A greater force will be
applied to the hockey ball at impact if the joints of the arms are braced by muscle
activity (Gros, 1979; Wein, 1979).
2.6.4 Early follow-through
During the EFTh the pectoralis major (Jobe et.al., 1986; Jobe et.al., 1989; Pink
et.al., 1990), the latissimus dorsi (Jobe et.al., 1986; Jobe et.al., 1989; Pink et.al.,

29
1990) and the subscapularis (Jobe et.al., 1986; Jobe et.al., 1989; Pink et.al., 1990) of
the right arm continued to express high EMG activity, although the activity was
slightly smaller in magnitude and the muscular contraction more eccentric when
compared to the Acc phase (Escamilla and Andrews, 2009). These were the most
active muscles during the EFTh, with the subscapularis the only muscle in the right
arm to show increases from Acc (Jobe et.al., 1986).
The infraspinatus, supraspinatus and anterior deltoid all show low levels of activity
and the middle and posterior deltoids minimal activity (Jobe et.al., 1986). The
posterior was the most active portion of the deltoids yet still failed to fire
significantly (17 ± 16% MMT). All other muscles showed minimal activity also
(Jobe et.al., 1989). Kao et.al. (1995) found comparatively low activation of all the
scapula muscles on the right side, the highest being exhibited from the upper serratus
(52 ± 18% MMT) and the lower serratus (47 ± 25% MMT). All parts of the trapezius
fired between 23 and 26% MMT, rising from values obtained during Acc, and
displayed more activity during this phase than in any other with exception of the
BSw (Kao et.al., 1995). Both the rhomboid muscles and the levator scapulae
exhibited declining activity abating to 21 ± 12% MMT and 12 ± 12%MMT,
respectively (Kao et.al., 1995).
High subscapularis activity on the left side (>100% MMT) (Jobe et.al., 1986)
continues into the EFTh from the Acc phase (Jobe et.al., 1989; Pink et.al., 1990),
while left pectoralis major activation and left latissimus dorsi activation both subside
to moderate levels (Jobe et.al., 1986; Jobe et.al., 1989). Alongside this, the
infraspinatus was also found to be active (61 ± 32% MMT), showing significantly

30
more activity throughout this phase of the golf swing than any of the first three (Jobe
et.al., 1989; Pink et.al., 1990). Additionally, left anterior deltoid activity was more
active during the EFTh (21 ± 25% MMT) and the LFTh than in any other swing
phases and was most active of the three deltoids studied (Pink et.al., 1990).
Of the scapular muscles of the left arm, activity was greatest from the levator
scapulae (39 ± 26% MMT) (Kao et.al., 1995) however, the magnitude of the
activation during EFTh was significantly less than displayed during Acc. This was
followed by activity of the upper trapezius (34 ± 29% MMT), maintained from the
Acc phase, and the upper serratus (31± 18% MMT), which demonstrated no declines
in activation from the previous swing phase (Kao et.al., 1995).
Research into muscular activity during the golf swing asserts the concept of
synchrony of movement of scapular muscles and the muscles of the shoulder girdle
(Kao et.al., 1995; Pink et.al., 1990). Reinforcing the significance of specific roles
that each muscle plays throughout the golf swing - each muscle plays its part at a
given moment – the timing patterns of activity should assure rhythmic movement
(Pink et.al., 1990). These results of golf-EMG studies indicate that muscular
synchrony is paramount to provide a fluid swing, consistent from the scapular
muscles to muscles of the upper torso and upper limbs (Jobe et.al., 1989; Pink et.al.
1990, Kao et.al., 1995). Firing patterns of the scapular muscles demonstrate that the
golf swing is a movement that requires neither extremes of ranges of motion nor
extremes of muscular activity, but a balance of forces to present a normal swing
(Jobe et.al., 1989; Pink et.al., 1990; Kao et.al., 1995). Golf therefore, is not a
strenuous arm activity thus revealing subsequently small contributions to activation

31
patterns from the three deltoids bilaterally (Pink et.al., 1990). Despite not eliciting
maximal ranges of motion or muscular strength concerns, the golf swing is still a
rapid and ballistic movement requiring the rotator cuff muscles to fire in synchrony
to provide both ‘coordinated’ and ‘harmonious’ movement in order to protect the
glenohumeral complex (Pink et.al., 1990), as is reflected by the observed firing
patterns of rotator cuff musculature (Jobe et.al., 1989; Pink et.al., 1990).
From further analysis of data, Pink et.al. (1990), proposed that there were
identifiable and specific roles for each different muscle during the golf swing. Acting
in concert, both the infraspinatus and supraspinatus provide most activity when ‘the
club and ipsilateral shoulder are at the greatest height’ when the arm is in its
maximum external rotation and slight abduction (Pink et.al., 1990, pp. 140). As an
external rotator (McChesney, 2004) the infraspinatus, when compared to the
supraspinatus, has relatively high amplitude EMG throughout the swing. It is
together though, that these muscles act to ‘approximate and stabilize the
glenohumeral joint’ (Pink et.al., 1990, pp. 140). The subscapularis as an internal
rotator is differentiated from the infraspinatus and supraspinatus by displaying most
activity during Acc (Jobe et.al., 1986; Jobe et.al., 1989; Pink et.al., 1990).
Pink et.al. (1990) concluded that the left arm is displaying greater internal rotation
when compared to the right arm throughout the BSw, revealing higher magnitude
EMG throughout this phase. Moreover, movement of the left arm is less pronounced
in terms of internal rotation than in the right arm throughout the remainder of the
swing and as a consequence of this, lower relative EMG amplitudes are observed
(Pink et.al., 1990). The right arm begins to move into internal rotation during the

32
EFSw and continues this throughout the concluding swing phases. Across the Acc
phase, it was proposed that the right arm is moving internally the most forcefully
(Pink et.al., 1990).
It is notable during the EFSw and Acc phases that the power from the shoulder to
drive the club head from the top of the golf swing towards ball contact is generated
by the latissimus dorsi and the pectoralis major (Jobe et.al., 1989; Pink et.al., 1990;
Okuda et.al., 2002; Escamilla and Andrews, 2009). The latissimus dorsi contributes
higher amplitude activity and thus its mechanical power to the golf swing during the
EFSw and into Acc whereas the pectoralis major plays an increased role during Acc
and EFTh (Pink et.al., 1990; Escamilla and Andrews, 2009). It is proposed that the
earlier activation of the latissimus dorsi is a consequence of its role as an internal
rotator of the right arm (Pink et.al., 1990), which is more prevalent during the EFSw.
Additionally, the pectoralis major shows greater activity than the latissimus dorsi,
and more activity than any other muscle, probably due to the dual role of adduction
and internal rotation it has to perform to provide power to the swing (Pink et.al.,
1990).
Both Jobe et.al. (1986) and Jobe et.al. (1989) demonstrated data that concluded a
relatively non-contributory role to the golf swing from any of the three deltoid
muscles. Jobe et.al. (1986) demonstrated little deltoid activity in all phases of the
swing, describing the swing as being unlike other upper extremity sports by
presenting ‘a picture of deltoid quiescence and rotator cuff activity’ (Jobe et.al.,
1986, pp. 391). However, Pink et.al. (1990) concluded that the anterior deltoid was
active on the right side during the EFSw and most active on the left side during the

33
follow through; both these phases having ‘corresponding and reciprocal shoulder
heights’ (Pink et.al., 1990, pp. 140), thus it was concluded that the anterior deltoid
assisted with both flexing and lifting of the arm during the golf swing. Moreover,
integrated EMG collected by Abernethy et.al. (1990) show that the left posterior
deltoid is ‘extremely active’ in the late part of the downswing – in the latter of the
Acc phase – particularly as wrist un-cocking occurs. The role of the deltoids
therefore, remains questionable.
Serratus anterior firing patterns appear similar in both the upper and lower portions
in both the left and right arms (Kao et.al., 1995). Kao et.al. (1995) noted that this
was to be expected due to the lack of shoulder elevation during the golf swing,
affirming the assumption made by Jobe et.al. (1989) and Pink et.al. (1990). In sports
such as swimming and baseball pitching that elicit higher shoulder elevations and
increased upwards rotation in comparison with the golf swing, differences have been
recorded between the upper serratus and lower serratus (DiGiovine et.al., 1992; Pink
et.al., 1991; Scovazzo et.al., 1991). As each phase of the golf swing progresses, it is
the synchronous action of the medial scapula retractor muscles and the protractor
muscles that work to rotate, elevate, protract and retract the scapula (Kao et.al.,
1995).
Similarly, in baseball pitching, peak scapular muscle activity was high during the
arm cocking and arm deceleration phases of the pitch with peak EMG activity of the
serratus anterior being recorded at 69-106% MVIC, peak upper, middle and lower
trapezius activity being 51-78% MVIC, peak rhomboid activity 41-45% MVIC and
peak levator scapulae activity 33-72% MVIC (Escamilla and Andrews, 2009, pp.

34
588). Like the golf swing, the baseball pitch exemplifies and utilises ‘a synchronous
coiling and uncoiling motion to maximise performance’ (Kao, et.al., 1995, pp. 23).
In actions similar to that of the baseball pitch, during the windmill softball pitch
serratus anterior activity peaked at approximately 60% MVIC, during the tennis
serve and forehand and backhand volley, approximately 75% MVIC and during
baseball hitting, approximately 30-40% compared to approximately 70% MVIC
during the golf swing (Escamilla and Andrews, 2009, pp. 588). Shoulder muscle
activity in other upper extremity sports was also high. Rotator cuff activity was high
to resist distractive forces in excess of 100% bodyweight during arm cocking and
deceleration during overhead throwing (Escamilla and Andrews, 2009). In baseball
pitching during arm cocking, rotator cuff activity was shown to peak at 49-99%
MVIC and peak at 37-84% MVIC during the arm deceleration phases (Escamilla and
Andrews, 2009). 41-67% MVIC was peak rotator cuff activity in American football
throwing during arm cocking and 86-95% MVIC during deceleration (Escamilla and
Andrews, 2009). Escamilla and Andrews (2009) also noted high rotator activity in
the windmill softball pitch (75-93% MVIC), the volleyball serve and spike (54-71%
MVIC) and during baseball hitting (28-39% MVIC), compared to the golf swing
which educed 28-68% MVIC.
2.7 EMG Analysis
In the current literature there is a lack of specific information on the electrode
placement sites and on the methodologies, such as the MVC test position used to
determine the MVC reference values used for normalisation purposes. Moreover,
EMG signal processing techniques are again largely overlooked with information on

35
rectification and the filtering of the raw EMG signal remaining unreported.
Therefore, the rigor with which EMG data has been previously collected remains
questionable. From a methodological viewpoint, precautions must be taken to
quantify and normalise EMG data and to limit the impingement of the EMG
equipment on the performance of the swing.
2.7.1 Fine wire and surface EMG
When recording EMG data, the choice of the type electrode to be used depends
largely upon the muscles under investigation. For larger, superficial muscles, surface
electrodes should be used, whereas for small superficial muscles or for muscles
situated under others, intramuscular electrodes should be used (Türker, 1993). Both
types of electrodes have advantages and disadvantages. Fine wire electrodes can
record EMG from muscles located deeper in the body and can also record motor unit
activity (Rudroff, 2008) depending on the size of the uninsulated active area of the
injected electrode (Türker, 1993). Alongside giving access to deep musculature, fine
wire EMG is extremely sensitive and can record single muscle activity with a lower
concern for cross-talk detection (Rudroff, 2008). Because of this, for EMG
recordings of thin or deep muscles, the use of fine wire electrodes are preferable to
surface electrodes. However, fine wire EMG is invasive and can cause discomfort to
the participant (Rudroff, 2008), which could subsequently alter kinematic patterns of
the movement under observation. Moreover, fine wire EMG can only cover a small
detection area and presents problems in the repositioning of electrodes. Therefore, in
most EMG investigations focusing on superficial musculature, surface electrodes are
used due to their non-invasive nature (Konrad, 2005). Surface EMG, however, has
its own limitations.

36
2.7.2 Factors influencing the amplitude of the sEMG signal
A drawback of any EMG analysis is that amplitudes recorded are subject to
influences that can vary between given detection conditions. Recorded EMG
amplitudes can be different from one experimental session to the next, despite using
similar methodological procedures (Türker, 1993). Since EMG is often used as an
indicator of muscle activity it is important to appreciate the factors that can affect the
fidelity of the EMG signal.
DeLuca (1997) grouped the factors that affect the EMG signal into a number of
categories. The factors that affect the EMG at a basic level have been categorised as
intrinsic and extrinsic factors (DeLuca, 1997). Extrinsic factors are associated with
the electrode structure and placement. The electrode shape and size of the detection
zone determines the number of motor units that are detectable, due to the number of
muscle fibres in the detection zone. Larger detection zones render the sEMG
electrodes more susceptible to cross talk due to the volume conduction of
neighbouring musculature, making their use for measuring smaller, thinner
musculature undesirable (Konrad, 2005). Alongside this, the location of the electrode
with relation to the lateral edge of the muscle is also a determinant of the amount of
crosstalk that could be detected by the electrode (DeLuca, 1997). Moreover, the
orientation of the electrode with respect to the underlying muscle fibres affects the
measured conduction velocity of the action potentials and, consequently, the
amplitude of the signal (DeLuca, 1997). It is clear therefore that when placing EMG
electrodes it is best to ‘keep constant as many conditions as possible between

37
recording sessions and among subjects to minimise variability’ (Robertson et.al.,
2004, pp. 170).
Intrinsic factors are the physiological and anatomical factors that can affect the EMG
signal (DeLuca, 1997). DeLuca (1997) lists them as being: the number of active
motor units at a given time that contributes the amplitude of the signal; the fibre type
composition of the muscle; the fibre diameter which influences the amplitude and
conduction velocity of the action potentials that make up the signal; the depth and
location of the active fibres with respect to the electrode detection surface; and the
amount of tissue between the surface of the muscle and the electrode, including the
skin-electrode impedance which will also differ between electrode applications,
which may affect the shape of the underlying MUAPs (Burden, 2008).
During dynamic muscular contractions, which result in conditions where both force
and posture may change (Farina, 2006), three main influences emerge that can affect
the collection of EMG: the extent of signal nonstationarity, the comparative
electrode dislocation due to muscle migration with respect to action potential origin
(Konrad, 2005), and conductivity changes of the tissue separating the muscle fibres
and the electrode (Farina, 2006). In addition to this, these influences may be more
prevalent as the ballistic nature of the movement increases (Egret, 2004) or when
greater ranges of motion are utilised, which could further exacerbate the issues raised
by DeLuca (1997).
Despite the practical issues involved with sEMG data collection and analysis under
dynamic test conditions, its importance within movement analysis has led to its

38
widespread use with numerous relevant applications (Farina, 2006). However,
precautions must be taken to quantify and normalise EMG data and to limit the
impingement of the EMG equipment on task performance.
2.7.3 Normalisation
Due to the numerous factors that influence EMG signals, absolute EMG amplitude
recordings are not necessarily reliable for analysis (Farina, 2006). Thus, EMG
research is limited by the difficulties that arise in making comparisons between
values obtained from the same muscle from the same participant on different testing
occasions, different muscles of the same participant or the same muscle in different
participants (Kelly et.al., 1996). However, if the sEMG data are normalised, it is
possible to make quantitative evaluations between participants as this reduces the
variability of the EMG recordings (Türker, 1993), reduces the influence of detection
conditions (Konrad, 2005) and circumvents the problems of comparison (Kelly
et.al., 1996) whether inter or intra participant (Burden, 2010). Therefore, EMG
signal normalisation is essential for making accurate comparisons between test
sessions, muscles and participants (Kelly et.al., 1996; Burden and Bartlett, 1999).
All normalisation techniques have in common the conversion of absolute EMG
signal recordings from microvolts into relative values based upon comparison with a
measure of reference muscular electrical activity (Kelly et.al., 1996; Konrad, 2005;
Burden 2010) obtained during standardised and reproducible conditions (Mathiassen
et.al., 1995). Amplitude normalization only changes the ‘Y-axis’ scaling, not the
‘shape’ of the EMG traces (Konrad, 2005).

39
The Peak and the Dynamic Mean of the task EMG signal can both be used as a
reference value (Konrad, 2005) whereby each task EMG data point is divided by
either the peak or the mean EMG recorded during the same task (Burden, 20008).
Both Yang and Winter (1984) and Burden et.al. (2003) reported that the most
effective way of improving group homogeneity is to use either the Dynamic Peak or
the Dynamic Mean normalisation methods. Despite this, Knutson et.al. (1994)
reported that EMG records obtained from the gastrocnemius were more reliable
when they were normalised to a maximal isometric reference contraction as opposed
to either Peak or Mean dynamic EMG data. Moreover, Burden (2008) states that
neither the Peak nor the Mean Dynamic methods can be used when comparing the
amplitudes from different muscles and different individuals as any innervation level
information is eliminated when EMG is normalised in this way (Konrad, 2005).
Within the scientific literature, the most prevalent practice for normalisation has
involved expressing points of the processed task EMG as a percentage of the peak
EMG from an isometric MVC (MVIC) (Burden, 2008) of the same muscle, whereby
the peak EMG is collected from an arbitrary mid-range joint angle (Burden, 2010).
In addition to allowing comparison of EMGs from different muscles, Burden (2010)
notes that normalising task EMG to a maximal reference contraction could also
allow for assessment of what percentage of the maximal activation capacity of a
muscle the task EMG represents.
The use of MVICs has, however, been criticised. Clarys (2000) found that Isometric
MVCs are limited by the poor reliability of the EMG recorded. This would therefore
render the MVIC method unreliable and its value for comparing normalised EMG

40
and a muscle’s activation required to perform the movement under observation
limited. Furthermore, De Luca (1997) advocates the use of EMG traces from
contractions below maximal level (less than 80per cent MVC) to produce more
stable reference values from which normalisation can take place in comparison with
the MVIC method. When the focus of the investigation is towards muscular
activation, there has been debate as to whether or not a MVIC actually elicits the
maximal capacity potential of a muscle (Burden, 2008). Outputs from the MVIC
method of normalisation have been shown to be in excess of 100 per cent and this, as
Burden (2008) notes, therefore signifies amplitude recorded during a single task can
be larger than amplitude recorded during the isometric normalisation contraction
(e.g. Jobe et.al., 1994; Farber et.al., 2009).
Alongside isometric MVCs, the use of other maximal amplitude-based MVC
normalisation techniques is also debatable. Collected during a maximal contraction
of an individual muscle whilst performing a dynamic MVC with the same muscle
kinematics, the Isokinetic MVC method, despite accounting for changes in muscle
length and shortening rate, was found to be only minimally different in its output
compared to Isometric MVC normalisation output (Burden and Bartlett, 1999;
Burden et.al., 2003).
The MVIC method has been shown to produce more reliable reference values than
those obtained from non-isometric voluntary contractions with the same muscle
action and joint angle as the task EMG (Rouffet and Hautier, 2008), from isokinetic
voluntary contractions with the same demands as the task EMG (Burden et.al., 2003)

41
and from peak EMG from sub-maximal isometric voluntary contractions (Lehman,
2002).
Nieminen (1993) and Westgaard (1988) recommended that normalisation tests
should be performed in a postural position equivalent to the mid range of the
movement. However, they neglected to specify explicit test positions for the
performance of maximal isometric contraction normalisation tests. Despite MVC
normalisation providing an estimation of ‘invested’ neuromuscular effort (Konrad,
2005), predetermined identification of specific MVC test positions that reproducibly
illicit maximal muscular innervation have not been discussed in detail (Kelly et.al.,
1996). Comparison of EMG from isometric MVCs has shown that joint angle has
little effect on maximal EMG. Moreover, the modes of contraction and muscle/joint
kinematics have not yet been proven to affect EMG-angle and angular velocity
relationships (Burden, 2010). Therefore the use of isokinetic MVC methods that
recreate task conditions over isometric, arbitrary joint angle MVC methods remains
unjustified (Burden, 2010).
Resent research suggests that the use of isometric MVCs utilising a mid-range joint
angle, will provide results with good reliability and no strong evidence exists to
suggest that isokinetic MVC methods are preferable to isometric methods (Burden,
2010). If the study is interested in how active a muscle is in relation to maximal
activation, then an MVIC can be used to provide an indication of this, as well as to
compare EMG traces across participants and muscles as both ISEK (Merletti, 1999)
and SENIAM (Merletti et.al., 1999) recommend.

42
2.7.4 sEMG hardware
The sEMG hardware itself has been found to impact upon the detection of the EMG
signal. The participant’s range of motion and freedom of movement could be
restricted due to the wearing of ‘cumbersome’ EMG equipment (Egret et.al., 2004).
Results form Egret et.al., (2004) indicated that EMG equipment induced changes in
muscular activity patterns during performance of the golf swing when sEMG
electrodes are attached and related auxiliary hardware worn. There were significantly
greater shoulder joint angles attained at the top of the backswing when not wearing
EMG equipment, with lesser joint angles attributed to eventual cable tension on the
electrodes for trials where EMG hardware was worn. Moreover, right elbow flexion
amplitude was greater for the swings with EMG than those without EMG at both ball
address and at the top of the backswing. Again, it was assumed that cable tension
was the cause of this difference. Alongside this, EMG equipment also slowed club
head speed before ball impact.
Despite these changes, the wearing of EMG equipment induced no changes in the
timing of the golf swing. These results therefore signify the importance of electrode
wire placement (Egret et.al., 2004). If electrode wire placement is carefully
controlled it should reduce the extent to which EMG hardware might affect the
kinematics of the swing when under observation, particularly at the extremes of
ranges of motion exhibited.
2.7.5 Issues with golf based EMG
All current EMG studies of shoulder musculature during the golf swing use
indwelling electrodes (Jobe et.al., 1986; Jobe et.al., 1989; Pink et.al., 1990; Kao
et.al., 1995), which could affect the comfort of the participant, possibly altering the

43
mechanics of the golf swing. No studies exist in the literature that use surface
electromyography (sEMG) to assess shoulder muscle activity, despite sEMG being
considered less invasive than fine wire EMG and more representative of the overall
myoelectrical activity produced by a muscle (Marta et.al., 2012).
Jobe et.al. (1986) classified golf swing muscular activity into four categories;
minimal activity, low level, moderate and marked activity. These categories though
are arbitrary and based upon little more than the opinion of the researcher. No
justification was provided as to the choice for the ‘cut-off’ for each category and the
definitions not based upon the contribution of activity, but only to the amount of
activity recorded. To categorise EMG activity levels into such bands neglects the
temporal aspects of the EMG signal or the contribution of the activity to the
kinematics of the swing. Moreover, no indication is given as to when a muscle
becomes active or ceases it’s activation, which could further detail timing pattern
similarities or disparities. Furthermore, little kinematic data is provided to
accompany EMG data, resulting in very few links being made between recorded
muscular activity and the mechanics of the motion under analysis.
2.8 The role of segmental interactions
EMG-based studies also ignore the important role which segmental interactions have
been shown to have on movement. As demonstrated by Putnam (1993), a muscle
may not necessarily need to be active for a joint to move. Joint forces may be caused
by the interaction or acceleration of other segments in a system. ‘The interactive
moments resulting from the forward acceleration of the proximal segment and/or the
linear acceleration of the proximal end of the extremity play large roles in causing

44
the initial backwards acceleration of the distal segment’ (Putnam, 1993, pp. 134). If
the angular acceleration of a joint is in a given direction, the accompanying joint
moment does not necessarily have to be in the same direction. This would have the
effect of causing more distal segments, in turn, to lag behind more proximally
accelerating ones. Moreover, more distal segments would need to resist the angular
velocity and joint moment dependent interactions of a more distal segment angular
acceleration, which would cause the proximal segment to decelerate (Putnam, 1993).
In overarm pitching, lateral rotation of the shoulder and elbow flexion at the onset of
forward rotation has been seen to cause the forearm and hand to lag behind the
elbow and the shoulder (Putnam, 1993). Similar lagging of the pitching arm behind
the trunk during overhead pitching has been observed by Escamilla and Andrews
(1999) and of the tennis racquet during the serve, again attributed to lower extremity
and trunk rotation (Elliott et.al., 1986). Consequently, high muscle activity of the
shoulder is needed to keep the arm moving with the rapidly rotating trunk as well as
to control shoulder external rotation (Escamilla and Andrews, 1999). These
assumptions, though, are based upon single-handed techniques with greater amounts
of shoulder abduction than seen during the field hockey hit.
The contributions of segmental interactions to the hockey hit have not been
discussed in the scientific literature. Moreover, muscular activity throughout the field
hockey hit would have to contribute to the creation of the desired movement, brought
about by performance demands, as well as resisting the segmental joint moments,
torques and the lagging of more proximal segments, generated by segment
interactions during the hit.

45
3. Methodology
3.1 Participants
Ten male university standard hockey players volunteered for this study. Prior to
testing, each participant was given an information sheet outlining the nature of the
project (Appendix 1.). Participants completed an informed consent form (Appendix
2.) and were screened for injury by the completion of a physical activity readiness
questionnaire (PAR-Q) (Appendix 3.). Ethical approval for this study was granted by
the Ethics committee of the School of Sport and Exercise Science at the University
of Lincoln. All testing was conducted indoors in the Human Performance Centre at
the University of Lincoln. The mean age, height, mass and playing experience of the
participants were 21.3 ± 3.1 years, 180.3 ± 3.8 cm and 76.16 ±10.28 kg and 7±3
years, respectively. All participants were free from injury at the time of testing and
were right handed.
3.2 Electromyographic set-up
Based on previous EMG studies of various swing motions and the limitations of
surface EMG to collect EMG form smaller, thinner or deeper musculature, the
muscles investigated in this study were the biceps brachii, triceps brachii (lateral
head), anterior deltoid, posterior deltoid, upper trapezius, latissimus dorsi and
clavicular and sternal heads of the pectoralis major. All muscles were monitored
bilaterally.
Prior to electrode placement, and after location of the muscle electrode placement
site as detailed by Cram et.al. (1998), the skin-electrode interface for each muscle
detection site was rubbed vigorously and cleansed with an alcohol wipe to reduce

46
skin impedance and to aid adhesion of the electrodes (DeLuca, 1997). Sixteen DE-
2.3 single differential, rectangular, Ag sEMG electrode sensors with an inter-
electrode distance of 10 mm (Delsys Inc, Boston, MA, USA) with pre-amplifier gain
of 1000V/V were attached to skin muscle sites for the eight muscles on each side of
the body (Appendix 4.). All electrodes were orientated parallel to the underlying
muscle fibres and positioned to remain over the belly of the muscle for as much of
the expected range of motion as possible. As reference electrodes, two Dermatrode
HE-R (American Imex, CA, USA) round electrodes of 5.08cm diameter were
attached to the skin at electrically neutral locations over the greater trochanters of the
left and right femurs (Rutkowska-Kucharska et.al., 2009).
The pre-amplified lead wires were connected to a Myomonitor IV Wireless
Transmission & Data-logging System (Delsys Inc., Boston, MA, USA), which was
worn around the waist of the participant, positioned so as not to restrict the range of
motion of the participant or to obstruct the hitting motion. Loose lead wires were
taped together but not taped to the body as pilot testing suggested the latter
contributed to greater movement artefact being detected. All EMG data were
sampled at a rate of 2000Hz, were transmitted wirelessly and recorded using EMG
Works 3.6 Acquisition (Delsys Inc., Boston, MA, USA) computer software.
Behavioural tests, outlined by Cram et.al., (1998), by which voluntary muscle
activation was induced for each muscle were conducted to confirm correct placement
for each electrode, to check for signal contaminants such as volume conduction, and
to verify the quality of the preparation of the skin-electrode interface to ensure the
fidelity of the recorded signal (Burden, 2008).

47
3.3 Motion analysis set-up
Passive, spherical retro-reflective markers of 16mm diameter were affixed bilaterally
to the skin of the participant using double-sided adhesive tape over the acromion
process, the medial and lateral epicondyles of the humerus, and the ulnar and radial
styloid processes. Two hockey sticks, one 0.927 m long (mass 0.575 kg) and the
other 0.953 m (mass 0.595 kg) were used in this study. Four tracking markers were
attached onto the shaft along the midline of each stick; two were placed on the
anterior, or flat side, 0.1 m and 0.5 m proximally from the distal end of the stick
shaft, and two on the posterior, or curved, side, 0.1 m and 0.5 cm proximally from
the distal end of the stick shaft. These markers were termed the anterior stick shaft,
the anterior stick grip, the posterior stick shaft and the posterior stick grip,
respectively. One additional marker was attached to the stick face during a static trial
only at the position ball impact was expected to take place. All participants used one
of the pre-markered hockey stick for their hits, chosen dependent upon the length of
their usual playing stick. A 1cm2 piece of retro-reflective tape was attached to a non-
dimpled field hockey ball that complied with International Hockey Federation
regulations (FIH, 2012).
Eight ProReflex MCU500 motion capture units (Qualisys, Gothenburg, Sweden)
were orientated to capture the whole of the hit motion, sampling at a rate of 240Hz.
The origin of the system was at ground level below the centre of the ball at its pre-
impact position and the global reference frame was orientated so that the X-axis ran
horizontal and parallel to the target line, the Z-axis was vertical and the Y-axis was

48
the cross product of X and Z. The capture volume extended 2.5 m in the X-axis, 3 m
in the negative X-axis, 2 m in the Y-axis, 0.3 m in the negative Y-axis, 2.5 m in the
Z-axis and 0 m in the negative Z-axis. All motion capture data was recorded using
Qualisys Track Manager (QTM) (Qualisys, Gothenburg, Sweden). Calibration was
conducted using a calibration wand 500 mm in length and the cut-off for residuals
was 0.4 mm.
3.4 Synchronisation
A Myomonitor IV tethered trigger module (Delsys Inc., Boston, MA, USA) was
connected to the Myomonitor datalogger. A 5V leading edge output pulse emitted by
the trigger module as EMG collection started was A/D converted before being
inputted to a MCU500 motion capture unit, where it was recorded alongside the
motion capture data as an analogue channel in QTM. The timing of the leading edge
of the output pulse was subsequently identified to allow synchronisation of the EMG
and motion analysis data.
3.5 Data Collection Protocol
After ensuring neither the EMG nor motion analysis equipment restricted their range
of movement, each participant was allowed to warm up by exercising until they felt
comfortable. EMG data were then collected during functional Maximum Voluntary
Contraction (MVC) tests for each muscle under observation. These tests consisted of
three 5 second static, full effort contractions, with a rest period of 30 seconds
between each contraction, and were adaptations of both functional MVC test position
exercises and EMG behavioural tests documented by both Konrad (2005) and Cram
et.al. (1998) (Appendix 4.).

49
A 5 s static trial was then recorded with the participant holding the hockey stick in
his right hand and standing in the anatomical position. This trial was used for marker
identification and to determine the stick face marker’s position relative to the four
permanent stick markers, for use in reconstruction of the stick face marker’s path
during subsequent dynamic trials (see below). Once the static trial was collected, the
retro-reflective marker on the stick face was removed and a second warm up period
was permitted where participants were allowed to perform unlimited practice hits
until they felt comfortable with the execution of the experimental task. Before hitting
the hockey ball, it was orientated so that the ball marker was positioned parallel with
the negative Y-axis was visible to the camera system setup.
Participants hit a stationary hockey ball utilising a single step approach and ‘classic
drive’ technique (England Hockey, 2005) from a 3 m by 2 m piece of synthetic
cricket matting into an indoor net. To standardise the task, the ball was stationary
and the participants were allowed only to take a single step during their approach to
the ball. All participants were instructed to hit the ball with maximum possible
velocity in a straight line. Each subject performed five, full effort hits during which
synchronised EMG and motion capture data were recorded.
3.6 Data Analysis
3.6.1 Kinematic data
Identification of the markers in the static and dynamic trials was performed in QTM.
Positional data were then exported to MATLAB 7.11.0 (R2012b, MathWorks
Cambridge, UK) where all kinematic analysis and digital signal processing was

50
performed using custom-written code. The XYZ coordinate data for all landmarks
were smoothed using a 4th
order Butterworth filter with zero phase lag with a cut off
of 12Hz (Mitchell et.al., 2003).
A virtual distal stick landmark was calculated as the mid-point between the anterior
and posterior distal stick shaft markers. A second virtual proximal stick marker was
calculated as the mid-point between the anterior and posterior proximal stick shaft
markers. The vector running from the proximal to distal virtual stick shaft markers
defined the longitudinal axis of the hockey stick. Virtual elbow and wrist joint
centres were also created for each arm, half the distance between the medial and
lateral humeral condyles and half the distance between the ulnar and radial styloid
processes for the elbow and wrist joints, respectively.
The location coordinates of three of the stick markers were used to calculate the 3-
dimensional coordinates of the virtual stick face. A stick-based coordinate system
was defined for each frame of the trial, the origin of the system being the mean
position of the four tracking markers. Xs pointed from the mean position of the four
tracking markers to the anterior proximal stick marker. The cross product of Xs and a
vector pointing from the mean tracking marker position to the posterior stick shaft
marker gave Zs. The cross product of Zs and Xs gave Ys.
The position of the stick face marker was calculated in the stick coordinate system at
each instant, before the mean of the Xs, Ys and Zs values were taken across the static
trial. These offsets were then used to reconstruct the stick face location in each frame
of the dynamic trial from the direction of the stick-based coordinate system axes and

51
the projection of the average offsets along these axes, allowing quantifiable tracking
of the stick face for determination of the transition of the stick face between each
swing phase.
3.6.2 Swing phases
The hit motion was broken down into four phases; the Backswing, the early forward
swing, acceleration, and the early follow-through (McHardy and Pollard, 2005).
These phases were identifiable in all of the hits of all of the participants. Analysis of
the hit motion began at the start of the backswing, which was defined as the instant
at which the virtual stick face displayed its first movement in the negative X
direction (Franks et.al., 1985). The frame at which the virtual stick face commenced
its final uninterrupted increase in speed through to impact (Willmott and Dapena,
2012) was defined as the top of the swing (the transition between the backswing and
the early forward swing). The frame in which the longitudinal axis of the stick was
closest to horizontal marked the transition between the end of the early forward
swing and the commencement of the acceleration phase. Ball impact and the end of
the acceleration phase was defined as the last instant before the ball marker first
moved. After ball impact, the frame in which the longitudinal axis of the stick was
closest to horizontal defined the end of the early follow-through phase. Inter-
participant differences in the times that each swing phase took to complete were
normalised by interpolating both joint angle data and EMG amplitude data to 100
samples per swing phase, thus giving EMG data at the same time-normalised instants
as the kinematic data.

52
3.6.3 Elbow and wrist angles
For each frame of the dynamic trials, on both sides of the body, unit vectors were
created running from the mid-elbow to the acromion and from the mid-elbow to the
mid-wrist. The elbow angle was calculated as the inverse cosine of the dot product of
these two unit vectors. The angle between the forearm and the stick was calculated
as the cosine of the dot product between the unit vector running from the mid-wrist
to the mid-elbow and a unit vector parallel to the longitudinal axis of the stick and
was termed the ‘wrist angle’.
3.6.4 EMG analysis
All raw EMG signals were band-pass filtered automatically by the Delsys datalogger
with a bandwidth of 20 – 450Hz. For each static EMG signal, starting at each EMG
sample, the RMS of the following one-second period was calculated. The peak MVC
amplitude of each static EMG signal was then calculated as the RMS of the one-
second period demonstrating the largest sustained maximal muscle amplitude
activation from the three contractions for each muscle.
For each muscle, the dynamic EMG signal was full wave rectified and smoothed
using a 4th
order Butterworth filter with zero phase lag with a low-pass cut-off
frequency of 50Hz (Kamen and Gabriel, 2009). Both time and amplitude
normalisations were performed for each EMG channel at each instant of the dynamic
trials. After calculation of the duration of each swing phase and synchronisation of
the motion capture data with the dynamic EMG data, dynamic trial EMG samples
were ascertained for the same synchronised duration of each swing phase. These

53
EMG data were then linearly interpolated to 100 samples per swing phase to
generate time-normalised EMG amplitudes at 1% intervals of each swing phase. The
time-normalised EMG samples were then normalised to their respective MVCs
before mean percentage of MVC activation across participants was ascertained.

54
4. Results
Participants in this study utilised both of the swing techniques described by Willmott
and Dapena (2012). Eight of the participants adopted the ‘straight’ backswing hit,
with the remaining participants preferring the ‘looped’ backswing hit. As the
backswings of each type of hit elicited minimal levels of muscular activity, it was
chosen that, for this study, muscular activity from both swing types would be
combined for analysis.
4.1 Elbow and wrist joint kinematics
Figure 3. Left and right elbow angles during the field hockey hit. The values shown are the mean
angles across all participants for each normalised percentage of each swing phase ± SD, whereby 180
degrees is full extension.

55
At the commencement of the BSw, left and right elbow angles were 133° and 111°,
respectively (Figure 3.). This level of extension of the left elbow was apparent for
the first 90% of the BSw at which point the left elbow began to extend slightly. For
the duration of the hit, the left elbow remained more extended than the right elbow.
The left elbow angle remained relatively constant as wrist ‘uncocking’ occurs, from
the late EFSw through to the first 10% of the EFTh, and especially during the Acc
phase. At impact with the hockey ball, the left elbow angle was 154°.
The right elbow moved into flexion from the initiation of the hit up until
approximately 80% of the BSw. It, however, did not extend immediately from this
point but maintained flexion of approximately 78° through to 75% of the EFSw. At
this point the right elbow started to extend again, the commencement of which
corresponded with the timing of wrist ‘uncocking’. Extension continued throughout
the Acc phase with the right elbow reaching approximately 130° at impact. The
angle reached its maximum value of 152° during the mid EFTh.

56
Figure 4. Left and right wrist angles during the field hockey hit. The values shown are the mean
angles across all participants for each normalised percentage of each swing phase ± SD, whereby 180
degrees is full extension.
Up until ball impact, the both the left and right wrist angles followed the same
pattern of increasing and decreasing. The degree of ‘cocking’ and ‘uncocking’ of the
wrists also appeared similar and was relative to the initial wrist angles at the
initiation of the hit. Wrist angle at the start of the BSw was 136° and 121° for the left
and right wrist, respectively. The left wrist angle remained greater than the angle of
the right wrist due to the fact that the left hand was placed more proximally on the
stick grip than the right hand and that the hockey stick was drawn to the right during
the BSw before being swung from left to right during the downswing.

57
For approximately the first 60% of the BSw, the wrists maintained their initial angle
before beginning to cock for the remainder of the BSw. From the top of the swing,
the angle of both wrists increased during the EFSw and reached values of 104° for
the left wrist and 75° for the right wrist at 70% the duration of the EFSw. The wrist
angles then began to immediately become greater and continued to do so throughout
the Acc phase to reach 157° and 127° at impact for the left and right wrists,
respectively. This uncocking of the wrists is concurrent with the time over which the
right elbow demonstrated extension and the left elbow angle appeared to become
more ‘fixed’ (Figure 4.). At the start of the EFTh, the left wrist angle demonstrated
decreases whilst the right wrist angle continued to increase for the duration of this
phase. It appeared, therefore, that the wrists worked together for the first three phases
of the hit, up until ball impact and worked differently to aid the deceleration of the
stick during the follow through.

58
4.2 Muscle Activity
Table 1. Peak normalised amplitude of muscle activity by swing phase during the field hockey hit
(peak mean ± SD% MVC across all participants)
Muscle Swing Phase
BSw EFSw Acc EFTh
Left Biceps brachii 7 ± 3 33 ± 68 31 ± 34 30 ± 19
Triceps brachii 12 ± 21 60 ± 45 49 ± 39 25 ± 25
Anterior deltoid 18 ± 17 19 ± 25 50 ± 49 50 ± 49
Posterior deltoid 16 ± 25 49 ± 30 35 ± 26 25 ± 21
Upper trapezius 22 ± 39 85 ± 88 81 ± 48 61 ± 69
Latissimus dorsi 62 ± 59 153 ± 120 102 ± 90 33 ± 30
Clavicular p. major 16 ± 19 45 ± 37 67 ± 62 42 ± 28
Sternal p. major 17 ± 18 57 ± 73 54 ± 42 61 ± 145
Right Biceps brachii 14 ± 21 3 ± 3 11 ± 16 11 ± 15
Triceps brachii 43 ± 39 81 ± 37 67 ± 63 26 ± 23
Anterior deltoid 100 ± 81 115 ± 124 64 ± 76 26 ± 32
Posterior deltoid 10 ± 13 8 ± 12 12 ± 15 15 ± 18
Upper trapezius 35 ± 37 17 ± 13 51 ± 69 38 ± 37
Latissimus dorsi 54 ± 52 88 ± 85 79 ± 70 72 ± 78
Clavicular p. major 40 ± 36 76 ± 66 66 ± 70 26 ± 21
Sternal p. major 29 ± 16 81 ± 52 51 ± 26 27 ± 30
During the BSw, the only muscle on the left side to demonstrate highest activation
was the latissimus dorsi. On the right side, the anterior deltoid, the latissimus dorsi
and the triceps brachii are the three most active muscles. Activity of the right side
appeared to be higher for six of the eight muscles.
The left latissimus dorsi activity peaks during the EFSw, alongside the left upper
trapezius. It appears that these two muscles are the major contributors to the EFSw
on the left side; however, all of the muscles of the left side show increases in activity
from the BSw. High activation levels of over 75% are apparent from the anterior
deltoid, latissimus dorsi, triceps brachii, sternal pectoralis and the clavicular
pectoralis muscles of the right side. With exception of the biceps brachii, posterior
59
deltoid and the upper trapezius, all muscles of the right side demonstrate greater
activity during the EFSw compared to the BSw.
Activity of both the left latissimus dorsi (>100%MVC) and the left upper trapezius,
remain high during the Acc phase. Both portions of the left pectoralis major
demonstrate increases in activity from the EFSw into the Acc phase. On the right
side, both portions of the pectoralis major show declines in activity. All other
muscles on the right side also demonstrate diminishing activity with the exception of
the right biceps brachii the right posterior deltoid and the right upper trapezius.
The sternal pectoralis is the only muscle to show an increase in activity from Acc to
the EFTh on the left side. Alongside this, despite not showing increases, the left
anterior deltoid and the left upper trapezius remain active into the EFTh. All muscles
of the right side demonstrate declines in activity from Acc into the EFTh except for
the biceps brachii, which remains at 11%MVC. Although showing declines from
Acc, the right latissimus dorsi remains more active than any other muscle of the right
side.
As peak activation values do not provide information on activation changes within
each swing phase, the following figures show the time course of activation for the
duration of the hit for each of the individual muscles, comparing each bilaterally.
The figures show the average activation across all participants at each normalised
time instant.

60
4.2.1 Biceps Brachii
Figure 5. Biceps brachii activation, by percentage of swing phase, during the field hockey hit (mean
% MVC ± SD across all participants).
There was no appreciable activation of the left biceps brachii until 65% of the EFSw,
after which it was active at 20-30% MVC through to the middle of the EFTh, from
which a sharp increase in activity is seen peaking at 32% MVC at 90% of this phase.
From a small decline over the first 15% of the ACC phase, left biceps brachii,
activity climbs from 23 to 31% MVC, which remains for the rest of the phase. The
consistent level of activity, remaining around 30% MVC, persists for the first 40% of
the EFTh before beginning to decline for the remaining 60% of the EFTh to the end
of the phase.

61
Activity during the BSw for the right biceps is low (<14% MVC). Later in the BSw,
from 50% of the phase onwards, right biceps brachii activity diminishes and
plateaus, remaining that way for the rest of the BSw and into the EFSw. Throughout
the EFSw, little activity is demonstrated. During Acc, activity does climb yet
remains below 12% MVC. For the duration of the EFTh the right biceps remains
quiescent.
4.6.2 Triceps Brachii
Figure 6. Triceps brachii activation, by percentage of swing phase, during the field hockey hit (mean
% MVC ± SD across all participants).
Left triceps brachii activity stayed below 12% for the first 65% of the BSw at which
point activity started to increase. This increase continued through the transition from
the BSw into the EFSw, climbing steadily to 20% MVC at 18% of the EFSw before

62
increasing more rapidly to peak at 60% MVC at 80% of this phase. Activity from
here began to recede, decreasing progressively for the duration of the Acc phase,
dropping to 19% MVC at ball impact. In the EFTh, left triceps brachii activity
climbed slightly to 25% MVC before plateauing for the remainder of the phase.
During the first half of the BSw, right triceps activity remained below 5% MVC
before a considerable increase in activity was seen, climbing to 40% MVC. It is
notable that the point at which right triceps brachii activity increased, right biceps
brachii activity receded. A continuation of this increasing activity level remained
during the first 20% of the EFSw, before right triceps activity increased more
rapidly, peaking at 81%MVC at 61% of the EFSw. Despite remaining active, from
this peak, activity then declined for the rest of the EFSW and throughout Acc, before
activity plateaued around 23%MVC at the transition between Acc and the EFTh and
this plateau remained for the entirety of the EFTh.

63
4.6.3 Anterior Deltoid
Figure 7. Anterior deltoid activation, by percentage of swing phase, during the field hockey hit (mean
% MVC ± SD across all participants).
Activity of the left anterior deltoid for the duration of the BSw remained below 17%
MVC before activity started to increase during the mid-EFSw. This increase
continued up until 85% of the Acc phase where the activity increases quickened,
peaking at 50% MVC at impact with the hockey ball. After impact and into the
EFTh, the anterior deltoid remained active for the first 55% of the EFTh until
declines are apparent the end of the phase dropping to 17% MVC as the stick
becomes horizontal at the end of the EFTh.
Activity of the right anterior deltoid increased slowly from 30% up until 80% of the
BSw, before a sharp increase was seen form 19% MVC climbing to 100% MVC at

64
the end of the phase. Activity remained high into and through the EFSw, peaking at
115% MVC at 82% the duration of the EFSw. From this peak, activity dropped
throughout the Acc phase yet declines steadily, plateauing from 74% of Acc between
18 and 26% MVC through the EFTh.
4.6.4 Posterior Deltoid
Figure 8. Posterior deltoid activation, by percentage of swing phase, during the field hockey hit (mean
% MVC ± SD across all participants).
During the first half of the BSw, activity levels of the left posterior deltoid remained
below 2% MVC up until 50% of the BSw, at which point activity began to climb,
peaking during the BSw at 16% MVC at 93% of this phase. This incline continued
for the first 20% of the EFSw until activity started to increase more rapidly, climbing
from 17% MVC to peak at 49% MVC at 55% duration, matching closely the time
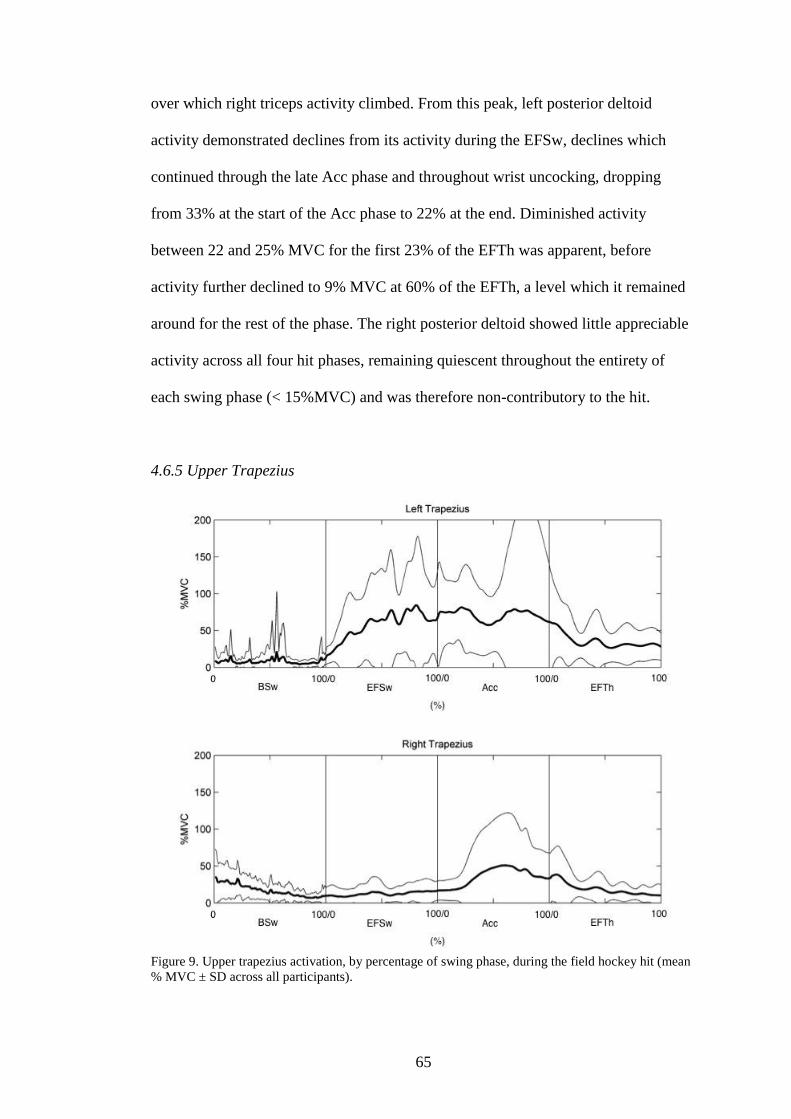
65
over which right triceps activity climbed. From this peak, left posterior deltoid
activity demonstrated declines from its activity during the EFSw, declines which
continued through the late Acc phase and throughout wrist uncocking, dropping
from 33% at the start of the Acc phase to 22% at the end. Diminished activity
between 22 and 25% MVC for the first 23% of the EFTh was apparent, before
activity further declined to 9% MVC at 60% of the EFTh, a level which it remained
around for the rest of the phase. The right posterior deltoid showed little appreciable
activity across all four hit phases, remaining quiescent throughout the entirety of
each swing phase (< 15%MVC) and was therefore non-contributory to the hit.
4.6.5 Upper Trapezius
Figure 9. Upper trapezius activation, by percentage of swing phase, during the field hockey hit (mean
% MVC ± SD across all participants).

66
During the BSw, the left upper trapezius demonstrated little activity, remaining for
the most part below 10% MVC, peaking only once at 21% MVC. Activity began to
increase during the final 10% of the BSw through to 59% of the EFSw, reaching
77% MVC before a second incline was seen, peaking at 85% MVC at 80% of the
EFSw, the peak here being the highest % MVC the left upper trapezius upper
reached over any phase of the field hockey hit. Activity of the left upper trapezius
then showed a decline from 80% through to 92% of the EFSw before commencing to
climb again through to 20% of the Acc phase, peaking during Acc at 80% MVC. A
decline in activity was then apparent between 20 and 45% of Acc, dropping to 57%
MVC. At 45% of the Acc phase, activity increased again and climbed to 79% MVC
at 69% the duration of this phase before declining into the EFTh. In the EFTh,
activity continued to decline up until 30% of the EFTh at which point activity levels
stabilise around 28%MVC.
During the early stages of the BSw, the trapezius was the most active of all the
muscles studied here, however, after the initiation of the BSw, right upper trapezius
activity declined from 34% MVC to 14% MVC. During the EFSw, right upper
trapezius activity remained low as a continuation from the latter part of the BSw.
From 10% of the Acc phase, activity levels began to increase rapidly from 17%
MVC to peak at 51% MVC at 59% of Acc. After this peak though, activity tapered
throughout the remainder of this phase and continued to taper for the duration of the
EFTh.

67
4.6.6 Latissimus Dorsi
Figure 10. Latissimus dorsi activation, by percentage of swing phase, during the field hockey hit
(mean % MVC ± SD across all participants).
During the early part of the BSw, activation of the left latissimus dorsi was low. The
first change in activity showed an increase starting at 40% of the BSw. This though
receded before activity increased again towards 80% of the BSw. From the start of
this increase late in the BSw, activity continued to increase into the EFSw phase to
peak at 153% MVC. The left latissimus dorsi was the most active muscle during this
phase, displaying the highest peak of any muscle studied over any of the swing
phases. Notably, after the left latissimus dorsi activity had peaked, the moment the
left latissimus dorsi activity level started to decrease was the same percentage of the
Acc phase (approximately 90%) at which left clavicular pectoral activity started to
increase. During the Acc phase, latissimus dorsi activity continued to recede up until

68
impact at which point activation plateaued through the EFTh, remaining above 22%
MVC and peaking at 33% MVC at 72% of the EFTh.
At the initiation of the BSw, activity of the right latissimus dorsi began to climb to
54% MVC at 40% of the phase before receding up until 70% of the BSw, where an
increase in activity was again apparent. Like the left latissimus dorsi, the right side
also displayed increases in activation during the EFSw, however, activity levels of
the right side did not climb as high as those displayed on the left side during the
EFSw. The right latissimus dorsi displayed peak activation (88% MVC) over any
swing phase during the EFSw just prior to the stick becoming horizontal near the
transition into the Acc phase. During the first 20% of Acc, the activity of the right
latissimus dorsi dropped before climbing again to 79% MVC. After dropping to 40%
MVC at 80% of Acc activity increased sharply to 68% MVC at 95% of Acc.
Activation into the EFTh declined to 43% MVC rising once to 72% at 77% the EFTh
before it declined to 47% MVC by the end of the phase.

69
4.6.7 Clavicular Pectoralis Major
Figure 11. Clavicular pectoralis major activation, by percentage of swing phase, during the field
hockey hit (mean % MVC ± SD across all participants).
BSw activity of the left clavicular pectoralis was low, remaining below 8% MVC.
Although slight, activity started to climb slowly halfway through the BSw, increases
occurring at the same time mid-BSw increases in left latissimus dorsi were apparent.
From 85% of the BSw, activity started to rise more significantly; again concurrent
with increases in left latissimus dorsi activity. At 90% of the EFSw, as left latissimus
dorsi activity receded, left clavicular pectoralis activity increased. This climb in
activity continues into Acc climbing from 60% MVC at 15% of Acc, up to and
peaking at 66% MVC at 55% of the Acc phase. After this peak, activity dropped for

70
the remainder of Acc yet activity was still apparent into the EFTh, remaining around
25% MVC.
Like the left side, activation of the right clavicular pectoralis major during the BSw
also remained low (<5% MVC) until a small incline was seen at 35% of the phase.
This incline continued up to 80% of the BSw before a further increase was evident
into the EFSw. Activation continued to rise up until 84% of the phase to peak at 76%
MVC. This peak in activation was later than the EFSw peak seen in right sternal
pectoral activity, yet was earlier than that of the right latissimus dorsi. Moreover, the
peak during the EFSw was the highest activation of the right clavicular pectoralis
across all the swing phases. Unlike sternal pectoral activity, clavicular activity
remained high throughout the late EFSw (>65% MVC). Throughout the duration of
the Acc phase, right clavicular pectoral activity declines and this continual decline
the EFTh.

71
4.6.8 Sternal Pectoralis Major
Figure 12. Sternal pectoralis major activation, by percentage of swing phase, during the field hockey
hit (mean % MVC ± SD across all participants).
Activity of the left sternal pectoralis major remained at low levels (<15% MVC)
before, between 34% and 65% of the BSw, sternal pectoralis activity increased and
increased to a level higher than the clavicular pectoralis over the same period. In the
late BSw, left sternal pectoral activity started to increase with activation increasing
after an increase in clavicular pectoral activity and after a larger increase in left
latissimus dorsi activity, which occurred during the mid BSw. Continuing the
increase in activity from the BSw, activity continued to climb for the first 70% of the
EFSw. During Acc, the left sternal pectoralis remained consistently active between
42% MVC and 54% MVC, appearing to work eccentrically like the left clavicular

72
pectoralis. The eccentric activity from the Acc phase and through impact with the
hockey ball remained into the EFTh and was higher through the transition than
activity of the left clavicular pectoralis. Activity peaked during this phase at 61%
MVC, which was also the highest activation seen during the whole hit.
For the first 35% of the BSw, right sternal pectoralis major activity remained low
before a small increase in activation is seen up until 85% of the phase at which point
activity starts to significantly climb. The activation level of the left sternal pectoralis
though, at the transition between the BSw and the EFSw, is comparably less than the
right clavicular pectoralis major yet climbs more rapidly and peaks earlier at 81%
MVC at 44% of the EFSw. From peak activation in the EFSw, activity declined and
continued to do so for the rest of the hit through Acc and the EFTh. From peak
activation in the EFSw, activity declined and continued to do so for the rest of the
hit. Despite showing declines during the field hockey hit, activity of the right sternal
pectoralis remained moderately high through the Acc phase.

73
5. Discussion
This study has produced the most detailed picture to date of muscle activity during
the field hockey hit. It has also provided detailed information on joint kinematics of
both the elbows and the wrists during the hit, and these joint kinematic data have
confirmed Elliott and Chivers’ (1988) suggestion about the roles of the left and right
arms. The left arm does tend to act as a single segment, whereas the right arm acts as
two segments, with flexion and extension of the right elbow. Adding a distal stick
segment to the two systems gives the double and triple pendulums for the left and
right arms, respectively, as described by Elliott and Chivers (1988).
This is also the first study in which EMG has been synchronised with three-
dimensional kinematics. The data presented in this study provide more accurate
three-dimensional kinematics of the upper limbs and the hockey stick and, in
combination with the EMG data, have allowed exploration of the underlying kinetics
of the field hockey hit. To provide a greater understanding as to the changes in
muscular activity during each swing phase and to provide a more thorough insight
into each muscle’s roles during the field hockey hit to begin to provide an
understanding into their effect on the kinematics of the hit, temporal aspects of
changes in muscular activity must not be overlooked. Together, these EMG and
kinematic data can suggest how the two and three-segment patterns are produced and
whether muscular activity alone is responsible for the production and control of the
field hockey hit or whether the observed kinematics are caused by a combination of
muscular activity and segmental interactions of the type described by Putnam (1993).
The EMG amplitude values in excess of 100% MVC recorded in this study could
have been caused by two main factors. Firstly, the amplitude of the reference

74
contraction may not have accurately reflected the participant’s potential to produce a
larger amplitude than the one recorded. This may have been due to the untrained
nature of the participant, or the fact that a static rather than dynamic contraction was
used as the reference. Secondly, the EMG signal collected from the dynamic trial
could have been significantly boosted by the presence of crosstalk from adjacent
muscles that were also active. While the closed kinetic loop formed by the arms and
stick complicates the making of definite statements about the causes of observed
motions, some inferences can be made.
5.1 The role of the arms
The coaching literature provides little information on the role of the arms during the
hit, reporting only evidence or qualitative observations. Little justification is
provided as to the assumptions made for the roles of the arms, just observations of
the movements seen are reported. From these data, quantitative observations can be
made, clarifying the movement patterns of the arms and suggestions made in the
coaching literature.
Both the left and right wrists display a similar pattern of decreasing wrist angles
during the late BSw before increasing from approximately 75% of the EFSw,
through the Acc phase and into the EFTh. The differing roles of the arms are thus
dependent upon the degree of flexion and extension of the elbows during the hit. As
wrist ‘cocking’ and ‘uncocking’ is a feature of in both the two and three-segment
systems, the two systems differ in whether or not the elbow angle changes and,
subsequently, whether the arm itself acts as one or two segments. Throughout the
field hockey hit, the left elbow angle remains relatively constant, especially during

75
Acc and as wrist ‘uncocking’ occurs. The right elbow however, demonstrates
considerable flexion during the BSw before extending during the late EFSw and
throughout the Acc phase. These elbow and wrist patterns remain consistent with
Elliot and Chivers’ (1988) description of the field hockey hit and supports Elliot and
Chivers’ (1988) assumption that the arms each have differing roles. From the greater
consistency of the left elbow angle, as compared to the right elbow angle, these data
show that a two segment sequencing pattern is applicable to describe the motion of
the left arm and stick system, whereas a three segment pattern would be a better
description of the right (Figure 3.).
Some suggestions about the functional role of these elbow kinematics may be made.
Maintaining an extended left elbow may serve to keep the stick away from the body
to increase the distance through which the stick head travels and could also
contribute to the left arm and forearm unit setting the plane of the hockey hit for the
stick head during Acc, as proposed by Chivers and Elliott (1987). The right arm
flexes at the elbow to allow a greater range of movement of the stick head to the
right during the BSw. Elliott and Chivers (1988) reported that the wrist joints of elite
penalty corner hitters remained relatively constant for the first half of the downswing
and that delayed wrist ‘uncocking’ which, combined with increased right elbow
flexion, caused the stick to rotate further backwards, a pattern similarly seen here
(Figure 3.). The extension of the right elbow to straighten the right limb during the
downswing is a possible cause of the increase in velocity of the stick head towards
impact (Chivers and Elliot, 1987).
5.2 The Backswing and wrist cocking

76
At the start of the BSw, right shoulder girdle rotation away from the ball is caused by
the right upper trapezius and the right latissimus dorsi. Furthermore, increased upper
right trapezius activity could possibly cause the initial elevation of the clavicle and
the scapula of the right side as the right shoulder begins to become abducted and
extended. Left latissimus dorsi activity may contribute to the internal rotation of the
left shoulder causing the stick to rotate about its longitudinal axis in the same
direction and the stick face to open during the mid-BSw is possibly caused by
increased left latissimus dorsi activity. Moreover, increases in trunk and shoulder
girdle rotation to the right, and the diminished left upper trapezius and increased
right upper trapezius activation could be caused by left side scapula protraction in
combination with right side scapula retraction. This pattern of trapezius activity is
apparent up until the latter stages of the BSw, at which point possible synergist
rotator cuff and scapular muscle activity may elevate the clavicle and cause scapular
retraction as opposed to right upper trapezius activity, hence the decline in activity
seen during the late BSw and through the EFSw. A similar explanation for declining
trapezius activity was proposed by Kao et.al. (1995), during their work on the golf
swing.
The decrease of the angle of the wrists seen during the EFSw could be caused by
forearm muscular activity or by segmental interactions where angular acceleration of
the arms will cause the hands to make forces on the proximal stick in the direction of
the hit. The resultant clockwise torque on the stick (as seen by the player) will tend
to produce wrist ‘cocking’. Segmental interactions due to the acceleration of the
upper arm, which would cause a joint force made on the forearm by the upper arm
would tend to flex the elbow if increasing triceps activity did not resist this. The

77
observed isometric left triceps activity would mean that the flexion does not occur at
the elbow but is transferred more distally to the wrists. Over this period, the left arm
is therefore acting as a single segment.
Both the left and the right wrists remain ‘fixed’ for most of the BSw, only ‘cocking’
at the end of the phase. To maintain possible elevation of the left shoulder at the
same time as left wrist ‘cocking’ begins, and maintenance of a torque about the left
shoulder to aid the left shoulder in rotating back to the left in the direction of the hit
during the late BSw, can largely be explained by activation increases of the left
upper trapezius and the left posterior deltoid. Moreover, retraction and upwards
rotation of the left scapula would possibly be apparent as the stick moves forward,
similar to patterns seen in golf (Kao et.al., 1995), concurrent with left upper
trapezius activity.
5.3 Transition and the initiation of the early forward swing
Alongside gravity, the slowing of the right humerus as the stick face nears the end of
the BSw is caused by activity of the right latissimus dorsi, the right anterior deltoid,
the right clavicular pectoralis and the right sternal pectoralis. Activity of these four
muscles would at first appear to be eccentric, slowing the right arm, before the
pectoralis muscles and the right anterior deltoid contract concentrically and initiate
the EFSw in the right arm by creating a torque about the right shoulder. They then
combine activity with a second burst of right latissimus dorsi activity to bring about
horizontal adduction and internal rotation of the right upper arm, thus causing
acceleration of the upper right arm during the EFSw. Throughout the BSw, right
anterior deltoid activity controls right shoulder flexion and extension after the stick

78
head’s initial movement away from the direction of the target and appears to be one
to the most active muscles during the late BSw and for the duration of the EFSw.
The right anterior deltoid therefore does not display the quiescence previously
reported in studies into the golf swing by Jobe et.al. (1986), Jobe et.al. (1989) and
Escamilla and Andrews (2009).
Maintenance of lumbar spine extension as the hips and the trunk rotate as the X-
factor at the top of the swing is produced is possibly caused by synergist right
latissimus dorsi activity. Unlike muscular activation studies on the golf swing which
have found suppressed activity of the latissimus dorsi on the right side during the
BSw (Jobe et.al., 1986; Jobe et.al., 1989; Pink et.al., 1990), the right latissimus dorsi
during the BSw of the field hockey hit is one of the most active, possibly due the
greater degree of flexion of the spine and the step towards the ball employed during
the field hockey hit compared to the golf swing and also due to its role of initiating
internal rotation of the right upper arm.
To cause the left arm to adduct and internally rotate, and to provide the resultant pull
along the stick by causing the initial angular acceleration of the left arm system, the
left latissimus dorsi and the left posterior deltoid show activation increases at the end
of the BSw, concurrent with the timing of activity increases of the right side pectoral
muscles and the right latissimus dorsi. Rotation of the hips and the trunk back
towards the target occurs as the stick head is still reaching the top of the swing, a
trait accentuated by increased wrist ‘cocking’ at the top of the swing before the stick
head itself starts its downswing. This earlier rotation of the hips and trunk initiating
the EFSw prior to the phase transition from the BSw, as measured from the stick

79
head, causes increases of more proximal musculature to be measured during the late
BSw.
Whilst the right biceps brachii is active during the right elbow flexion up to 70% of
the BSw, activity decreases during the late BSw and EFSw. During this period the
elbow angle is held constant by isometric triceps activity opposing a torque about the
forearm centre of mass, which arises from the force made on the forearm by the
upper arm as a result of the latter’s angular acceleration in the direction of the hit.
This torque is caused as a consequence of musculature producing a force at the
shoulder to accelerate the upper arm and would act to move the left elbow into
greater flexion, thus accounting for diminished right bicep brachii activity. However,
increasing right triceps brachii activity over this period resists this increasing joint
flexion torque and maintains a constant degree of elbow flexion until the wrists
‘uncock’.
5.4 The early forward swing
The initial angular acceleration of the right upper arm at the start of the EFSw can
largely be explained by increased activity of the right clavicular and right sternal
pectoral muscles. This continues up until the mid-late EFSw where activity declines
as the arm has moved into greater adduction and is moving across the trunk.
Moreover, activity continues to decrease during Acc after the initial acceleration of
the upper right arm has occurred. Furthermore, a shallower swing plane is employed
during the field hockey hit than during the golf swing (Willmott & Dapena, 2012),
possibly caused by greater flexion of the right shoulder. This flexion of the shoulder
could be attributed to increased right clavicular pectoral activity during the EFSw.

80
Activity of the right pectoral muscles appears earlier than activity of the left pectoral
muscles, possibly due to the right upper arm being more abducted than the left arm
and that the BSw and rotation about the trunk happen to the right and that the hockey
stick is swung from the left to the right during the downswing. Moreover, right
clavicular pectoral activity during the initial stages of the EFSw stops the humerus
lagging at the start of the downswing prior to acceleration of the upper arm. A
similar pattern of right clavicular pectoralis activity is also found during the golf
swing (McHardy and Pollard, 2005). In addition to this, increasing activity of both
portions of the left pectoralis major muscle during the late BSw and the start of the
EFSw aids left arm adduction and sustains the X-factor at the top of the swing and
into the EFSw as activity of the left sternal pectoralis works reciprocally with
activity of the left latissimus dorsi to control the rate of adduction and extension of
the left shoulder. This pattern is consistent with golf-based data which consistently
show increases in left pectoral activity from the EFSw into Acc (Jobe et.al., 1989;
Pink et.al., 1990; McHardy and Pollard, 2005; Escamilla and Andrews, 2009).
During the EFSw, the left shoulder moves in the direction of the hit (Chivers and
Elliott, 1987). The initial angular acceleration of the shoulders back towards the
target can be explained by left posterior deltoid and right anterior deltoid up until the
late EFSw, at which point declines in activity occur.
The extension of the right elbow during the EFSw and an increase in the angular
acceleration of the distal end of the hockey stick as it starts its downswing would
affect the angular displacement of the left arm. During this period, left posterior
deltoid activity remains consistent with the requirement to provide a torque about the

81
left shoulder to keep the left arm moving in the direction of the target, especially as
the wrists ‘uncock’, resisting an oppositional torque brought about by wrist
uncocking itself, a pattern similarly noted by Abernethy et.al. (1990) during the golf
swing.
The sharp increase in right anterior deltoid activity provides a torque at the right
shoulder, which is contributory to the initial acceleration of the right upper arm as
the shoulder begins to internally adduct the humerus. Furthermore, the torque at the
right shoulder applied by the right upper arm to the shoulder as a result of the
acceleration of the upper arm is resisted by right anterior deltoid activity, keeping the
upper arm moving in the direction of the target, stabilizing the shoulder joint and
possibly aiding internal rotation of the right arm and shoulder. The employment of a
shallower swing plane in the field hockey hit as opposed to the golf swing could
initiate greater extension of the right shoulder, which can mainly be explained by
increased right anterior deltoid activity.
The deltoids during the EFSw of the field hockey hit do not display the same latency
previously observed in the golf swing by Jobe et.al. (1986), Jobe et.al. (1989) and
Escamilla and Andrews (2009). In the field hockey hit, the left posterior deltoid
appears to show activation increases to provide a torque at the left shoulder during
the EFSw and the right anterior deltoid appears to be one of the most active muscles
during the late BSw and for the duration of the EFSw.
At the end of the BSw, and up until approximately 75% of the duration of the EFSw,
the right elbow angle remains constant whilst the right wrist continues to ‘cock’.

82
Over this period, as the right elbow ‘fixes’, the right arm system would therefore
work as a two-segment system and not as a triple pendulum system. The fixing of
the right elbow over this period would possibly allow segmental interactions caused
by the acceleration of the upper arm from activity of shoulder musculature to work
about the wrists and help them ‘cock’, as with the left side. If the right elbow did not
‘fix’ over this period, segmental interactions would cause the left and wrist wrists to
possibly oppose one another. This ‘fixing’ remains up until wrist ‘uncocking’, at
which point the right elbow moves into greater extension, therefore allowing
segmental interactions or muscular activity to increase the angle of the wrists.
The maintenance of the left elbow angle at approximately 140˚ and the ‘fixing’ of
the right elbow angle at approximately 80˚ (Figure 3.) at the start of the downswing
can be attributed to increased left triceps brachii activity and increased right triceps
brachii activity, respectively. The angular acceleration of the upper left and right
limbs during the EFSw causes a joint force at the distal end of these more proximal
segments, acting at the elbows, which, if triceps brachii activity were not apparent,
would cause the elbows to move into flexion. Both increased left and right triceps
brachii activity resist this moment acting at the elbows to maintain left elbow
extension and maintain the degree of flexion seen at the right elbow by overcoming
the joint moments generated by the initiation of the downswing from the shoulders,
preventing left elbow flexion and lagging of the stick as more proximal segments
begin to accelerate.
The left latissimus dorsi is active during trunk rotation to the left during the EFSw
but its activity declines during the late EFSw and into Acc. At the start of the EFSw,

83
activity of the left latissimus dorsi continues the abduction and extension of the left
shoulder seen during the late BSw. It appears that the left latissimus dorsi is the
primary mover of the left arm during the early downswing, providing ‘power’ during
the hit. The acceleration of the upper left arm and the power from the left shoulder
during the hit comes from the combination of left latissimus dorsi and left pectoral
muscle activity, with the left latissimus dorsi activity preceding increases in activity
of the left pectoral muscles, which are more active during Acc and into the EFTh,
possibly due to the latissimus dorsi’s role in causing trunk rotation to the left and
acceleration of the upper left arm during the EFSw. A similar pattern of activity was
found on the left side during the golf swing (Pink et.al., 1990). Activity of the left
pectoral muscles during Acc would maintain flexion of the shoulder as the wrists
‘uncock’ allowing the left arm to remain straight and this flexion of the shoulder
possibly aids maintenance of the swing plane during this phase. Notably, after left
latissimus dorsi activity has peaked, the moment the left latissimus dorsi activity
level starts to decrease considerably is the same percentage of the Acc phase
(approximately 90%) at which left clavicular pectoral activity starts to increase as
both muscles would be required to work in concert to promote flexion, adduction and
medial rotation of the left shoulder during the EFTh.
Activity of the right side during the EFSw appears to be sustained until wrist
‘uncocking’ is apparent. Activity of the right anterior deltoid and right pectoral
muscles provide a torque about the right shoulder up until the late EFSw, where
decreases in muscular activity at the shoulder on the right side possibly allow the
interactive moments caused as a reaction to wrist ‘uncocking’ and the acceleration of

84
the distal hockey stick to act about the right elbow to cause the right elbow to extend
through Acc.
5.5 Elbow extension and wrist uncocking
The slight increase in left elbow extension during the late BSw and through most of
the EFSw can be largely explained by increasing triceps brachii activity up until the
late EFSw. From this point, further elbow extension results from the slowing of the
shoulders whereby segmental interactions cause the extension of the left elbow
instead of the elbow extensor muscles, as demonstrated by Putnam (1993). Putnam
(1993) demonstrated that elbow extensor muscle activity is not a requirement for
elbow extension and that joint extension can instead be caused by segmental
interactions.
The deceleration of the left upper arm at the shoulder would create a force at the
distal end of the segment, acting at the elbow, which would tend to cause the right
forearm to rotate about its centre of mass creating a torque in the opposite direction
to the deceleration. This would subsequently cause the right elbow to tend to move
into greater extension. The left elbow retains its level of extension in order to keep
the stick away from the body and to increase the distance through which the stick
head travels. The ‘fixing’ of the left elbow joint in extension allows the left arm to
act as a double pendulum during the EFSw and through the Acc phase (Elliot and
Chivers, 1988), with the left arm pivoting at the shoulder and the stick pivoting
about the wrist.

85
A contribution to the initiation of the increase in the left wrist angle at the end of the
EFSw can possibly be explained by increases in left sternal and left clavicular
pectoralis activity over the same period. Activity increases of these muscles would
act to decelerate the upper left arm at the shoulder and the deceleration of the left
shoulder would consequently cause an interactive moment at the distal end of the left
arm segment, which, due to the ‘fixing’ of the left elbow, acts instead about the left
wrist, causing the left wrist angle to increase and wrist ‘uncocking’ to occur.
Actively slowing the shoulder may not be the only mechanism that possibly
produces wrist ‘uncocking’. A torque about the wrists produced by musculature of
the forearms to initiate wrist ‘uncocking’ would produce an interactive moment that
would act upon the left shoulder in the opposite direction to the hit, which would
subsequently cause the left shoulder to slow. Therefore, wrist ‘uncocking’ could be
caused by a combination of actively slowing the shoulder and the production of a
torque at the wrists.
However, as wrist ‘uncocking’ occurs, a reaction joint torque is created caused by
the angular acceleration of the hockey stick acting on the left forearm at the wrist.
This interaction possibly acts to move the left elbow into flexion, yet, as the left
elbow remains ‘fixed’, this acts instead about the shoulder. Therefore, after the
wrists begin to ‘uncock’, a further decrease in the angular velocity of the left arm
system is caused primarily by interactive moments resulting from the acceleration of
the distal stick. Consequently, the left upper trapezius and the left posterior deltoid
display activity to counteract the effects of the hockey stick’s angular acceleration on
the proximal end of left arm system at the shoulder, thereby decreasing the resulting
loss of angular momentum by providing a torque at the left shoulder to keep the left

86
arm moving the left arm system in the direction of the target during Acc. Wrist
‘cocking’ continues up until the late EFSw before rapid wrist ‘uncocking’ is seen
into and throughout the Acc phase.
The triceps brachii of both the left and right sides are active from the late BSw up
until the late EFSw to resist segmental interactions of wrist ‘cocking’ and to
maintain extension of the left elbow and to ‘fix’ the right elbow up until wrist
‘uncocking’. As little elbow extensor muscle activity is seen, from this point it
appears that segmental interactions are predominant at causing and maintaining
elbow extension and that elbow musculature activity is prevalent for the regulation
of these segmental interactions in order to maintain the double pendulum of the left
arm and the three-segment pattern of the right arm. As left triceps brachii activity
declines due to segmental interactions causing extension of the elbow rather than the
extensor muscles, consequent increases in left biceps brachii activity concentrically
resists this increasing joint moment and controls and regulates left elbow extension
through the late EFSw and the Acc phases. Over the same period, right biceps
brachii activity decreases to allow extension of the right elbow. Therefore, increases
in elbow extension during the Acc phase are likely to be caused by segmental
interactions. This would facilitate elbow extension throughout the EFSw and would
require lesser, or possibly no, direct contribution from triceps brachii activation for
the elbow to move into greater extension, hence the reduction in extensor activity
observed during the EFSw and for the duration of the Acc phase.
From the late EFSw and throughout Acc, the right elbow demonstrates extension
whilst right triceps brachii activity reduces (Figure 5.). The deceleration of the trunk

87
creates a force that would cause segmental interactions at the right elbow due to the
deceleration of the proximal end of the upper right arm acting on the distal end at the
elbow. However, as the right forearm lies approximately in the same plane as the
stick head yet the right upper arm is at about 60° to the plane of the swing (Willmott
& Dapena, 2009), the torque may cause the elbow to move into flexion. Change in
the right elbow angle might also follow torques made by the left hand on the stick,
yet this is difficult to define due to the nature of the closed loop created by having
both hands on the hockey stick.
As there is a lack of extensor muscle activity to actively straighten the right elbow
and segmental interactions would not produce the extension seen due to the angle of
the right forearm and right upper arm in relation to the plane of the stick head and
the subsequent forces acting on the right arm system, the right elbow could possibly
be passive in its extension, extending only as a consequence of allowing the left arm
to remain in greater extension as the wrists ‘uncock’ and towards impact with the
ball through the Acc phase due to the consequence of having both hands on the stick.
Greater contribution to the hockey hit from the right arm system would therefore
appear to be from internal rotation of the right upper arm during the EFSw and Acc,
rather than from extension of the right elbow. Therefore, Elliott and Chivers’ (1988)
pendulum model can only be used so far as a description of the hockey hit because
the upper arm segments do not lie, and the joints may not hinge freely, in plane
(Willmott & Dapena 2009).
5.6 The early follow-through

88
Deceleration of the left arm during the EFTh can be largely explained by sustained
left latissimus dorsi, left clavicular and left sternal pectoral activity. Before the arm
slows, the trunk has already started to decelerate and as the upper left arm starts to
abduct, extend and elevate away from the trunk, the eccentric activity of these
muscles would aid the deceleration of the left arm, yet a slight drop in left clavicular
pectoralis major activity allows for lateral rotation of the left humerus to continue
after ball impact. At the shoulder, the left posterior deltoid activity plays a role in the
deceleration of the left shoulder and the left arm after impact with the hockey ball.
Both pectoral muscles of the right side appear non-contributory to the slowing of the
right arm as activity demonstrates declines, unlike during the golf swing. Right side
deceleration of the upper arm during the field hockey hit is attributable to the
maintenance of activity of the right latissimus dorsi from the Acc phase and this
appears to be the only muscle of the right side that does not demonstrate declines in
activity during the EFTh. It would therefore appear that the left side is more
dominant in causing the deceleration of the stick.
5.7 Muscular activity and segmental interactions
It is apparent that the observed kinematics of the field hockey hit arise from a
combination of muscular activity and segmental interactions. It appears that
muscular activity is more predominant in accelerating both the left arm and right arm
systems during the EFSw. The acceleration of the stick during wrist ‘uncocking’ and
through the Acc phase causes muscular activity of the arms to maintain the double
pendulum of the left arm and the three-segment system of the right arm, controlling
the hit and the subsequent segmental interactions. Muscular activity of the trunk may
be more influential in creating the angular acceleration of the upper arms by acting at
89
the shoulders to accelerate the two arm systems before resisting interactive moments
at the shoulders during wrist ‘uncocking’ to maintain movement of the shoulders in
the direction of the hit during Acc.
Like Putnam (1993), this study has also provided evidence that local muscular
activity is not a requisite for joint movement to occur. During the field hockey hit,
muscular activity is apparent to firstly produce the initial acceleration of the left and
right arm systems and then to control segmental interactions, caused as a
consequence of those accelerations.
This study has confirmed Elliott and Chivers’ (1988) suggestion that during the field
hockey hit, the left upper limb system acts as a double pendulum consisting of the
left arm and hockey stick whereas the right upper limb works in three separate
segments consisting of the right upper arm, the right forearm and the hockey stick.
This assumption, however, can only provide an insight into the role of the arms. A
more complicated picture of the hit exists than simple pendular action because the
segments of the right arm system do not all lie in the stick head’s swing plane and
because of the nature of the closed loop system with two arms being connected
through the stick. This study has provided an increased understanding of the
techniques employed when performing a field hockey hit and has begun to detail the
mechanics of how the hit is performed and controlled, determining links between the
kinematics and the underlying kinetics of the field hockey hit.
Until the kinematics of the hit have been more fully investigated, biomechanical
mechanisms used during the hit remain hard to quantify. Measurement of the X-

90
factor and the SSC of muscles of the hit would benefit from more accurate
investigation of bodily kinematics. Without measurement of hip and shoulder
rotations, for example, the X-factor and it’s contribution to the hit will remain
unclear, yet would be worthy of investigation due to the consistency of an increased
X-factor stretch and performance in golf (Cheetham, 2001).
5.8 Delimitations and limitations
There are a number of factors that could limit the generality of the findings of this
study.
The use of participants that were male and of the same playing ability limits
the findings of the study to the same population.
There was an inability to measure all muscles that could possibly affect the
hit due to the use of sEMG. For example, due to issues with cross talk, EMG
from wrist musculature would have been difficult to analyse validly.
Moreover, more deep-seated muscles – or muscles on which the detection
site is close to the myotendinous junction, for example the upper serratus
anterior – would prove inaccessible to sEMG.
The use of a different stick to the participant’s own and by hitting a stationary
hockey ball effects the generality of the findings, yet was necessary for
standardisation of the task during data collection.
91
There were also a number of unforeseen pragmatic issues that became apparent once
pilot testing had begun, against which choices were made to limit their effect on the
study.
There was found to be slight contamination of the pectoral EMG signals by
EEG.
The placement of retro-reflective markers had to accommodate the
attachment of EMG electrodes. Especially for the shoulder, joint centres were
unable to be measured or tracked as accurately as would have been possible
without the auxiliary EMG hardware. This lead to assumptions being made
about the shoulder joint centre during analysis.
An issue with the tracking of the medial elbow markers was also apparent
due to the upper limbs obscuring the tracking systems view. Moreover,
marker movement due to the acceleration and velocity of the stick during the
downswing made tracking and digitising of the stick and wrists markers
difficult.
The hands presented an inability to be tracked due to consistent marker
detachment, therefore resulting in the calculation of a pseudo-wrist angle
between the forearm and the hockey stick.

92
A number of methodological limitations were also taken into consideration. All
possible precautions were taken to minimise the know limitations inherent with
EMG.
The consistency of electrode placement was carefully monitored to reduce
the possibility of cross talk boosting the recorded EMG signal. Furthermore,
minimising the effects of electrode migration was also considered during
placement.
Precautions were taken to limit the impingement of wearing EMG hardware
on the performance of the hit. The data logger and electrode lead wires were
carefully positioned so as not to affect the hitting motion and to reduce
movement artefact.
When normalising the EMG signal, the ability of the participant to perform
maximal contractions and the MVC test position used to isolate the tested
muscle most effectively would have limited the generation of the largest
EMG amplitude possible. Furthermore, the size of the moving window used
for the RMS calculations could have effected the amplitude used as the
reference value.
The Participant’s muscle composition also affected the collection of EMG.
Fibre type of the muscle being monitored and the amount of tissue between
EMG electrode and MUAP origin affected the fidelity of the signal, yet this
was beyond the control of the study methodology.

93
Lastly, electrical noise from the electrode lead wires and form other
extraneous electrical sources could have effected the EMG signal, yet were
accounted for when band-passing and filtering the collected EMG signal.
5.9 Recommendations for future studies
Future study should be focused towards detailing activation of a greater number of
muscles of the trunk and the upper limbs. Isolation of sixteen muscles of the arms,
shoulders and of the trunk can only begin to provide an insight into muscular activity
of a motion in which numerous joints and muscles are utilised. Due to difficulties in
measuring sEMG from smaller, thinner muscles, activity of forearm musculature was
not collected for this investigation. However, activity of forearm musculature and its
contribution to wrist ‘cocking’ and ‘uncocking’ would be worthy of further
investigation to begin to clarify the role of the wrists and the contribution of
segmental interactions to the field hockey hit. Alongside this, rotator cuff function
would be worthy of examination as it has been shown to be influential to the
performance of the golf swing (Jobe et.al., 1986) and could account for changes in
activity of shoulder musculature studied here. As it is proposed that the lower limbs
produce large amounts of power during the performance of the hit (Elliot and
Chivers, 1988), the influence of lower limb musculature must be gauged to provide
an overview of muscular activity of a movement that requires employment of the
whole body.
Due to restraints of task consistency, this study focused upon the hitting of a
stationary hockey ball. However, muscular recruitment could change if the ball being

94
hit is moving as has become more common with the introduction of the self-hit rule
(FIH, 2012). Changes in the kinematics of the hit have already been noted as the
speed of an approaching ball being hit increased (Franks et.al., 1985), yet changes in
the underlying kinetics remain unknown.
Experienced field hockey players have been shown to have more consistent hits than
less experienced players (Kusuhara, 1993). A comparison of the timing of muscle
activity, and of the consistency of that timing, between expert and novice players
could reveal activity of muscles more predominately used by more skilled
performers.
With further understanding of the muscles used during the hit, their magnitude, their
timing patterns and their contribution to the production and control of the hit,
changes in technique could be advocated with the aim of refining hit performance
variables such as maximising accuracy and ball velocity or minimising swing time.
5.10 Study implications and future directions
This study has made valuable additions to the understanding of the hockey hit,
especially through the combination of kinematics and muscle activation, and to what
is known about the possible contributors to stick motion. This does not yet present a
full picture, but has moved the discussion forwards, helping biomechanists and
coaches alike.
For biomechanists this is the first study to synchronise temporally normalised
EMG data with kinematic data in a swing motion with the presentation of

95
EMG data so that temporal aspects of muscle activity changes can be
assessed alongside kinematic variables. This has also provided evidence that
EMG is not solely responsible for the cause of movement in the hockey hit.
For coaches this study starts to address anecdotal accounts of the
performance of the hit, presenting valuable quantitative evidence of body and
stick motions. It also provides confirmation of previously suggested aspects
of technique, such as the two and three pendulum model for the arms and
stick. Furthermore, this study also highlights muscles that can be targeted for
strength training regimes.
Using this study as a basis for further research, future studies could take a number of
directions.
Studying the activity of more musculature that could contribute to the hit
would provide a greater overview of the associations between muscular
activity and segmental interactions, allowing a more in-depth overview of the
causes of movement. Using sEMG, this could incorporate lower body
musculature to assess the contribution of the lower limbs to the hit. Due to
the limitations of sEMG, musculature of the forearm, trunk and rotator cuff
could not be measured here. Investigation of the contributions of these
muscles to the hit would prove beneficial to further understanding the
movement and acceleration of the shoulders and arms, and the contribution of
wrist musculature to ‘cocking’ and ‘uncocking’ of the stick.
96
The changes in EMG activity could be measured during various conditions.
As variability of movement has been shown to be more prevalent in a hit
with task inconsistency, and especially since the introduction of the self-pass
rule, changes in EMG activity whilst hitting a moving hockey ball, and how
these changes differ as the direction and/or velocity of the ball changes,
would be worthy of investigation. Moreover, expert/novice differences in
terms of both the timing and consistency of EMG activity of the hits of both a
stationary and a moving hockey ball could start to detail modifications in
muscular activation, the control of segmental interactions and the adaptations
to technique of more skilled players.
With the identification of muscles that can be targeted for strength training
regimes, strength training interventions and their effects on hitting
performance could be studied.
If new techniques become available, a more detailed look at kinematics,
particularly of the wrist and elbow, would further confirm kinematic patterns
during the hit, and could give greater validity to the assumptions of the
contributions of muscular activity and segmental interactions.

97
6. Conclusions
This study has shown that the field hockey hit progresses as a result of a combination
and balance of muscular activity and segmental interactions. Muscular activation
appears to initiate the downswing of the hit and causes the initial acceleration of the
upper arms before being apparent to regulate the effects of segmental integrations,
caused by the acceleration of the trunk, the arms and the hockey stick.
The BSw of the field hockey hit requires little muscular activation from those
studied. Activity of trunk musculature generally peaks during the EFSw, consistent
with earlier rotation of the trunk and shoulders back towards the target line prior to
increased acceleration of the arms and hockey stick. As wrist ‘uncocking’ occurs,
shoulder musculature resists the segmental interactions to keep them moving in the
direction of the target, whilst arm musculature, particularly of the left side, regulates
the maintenance of a more extended left elbow and allows the right arm to become
more extended.
Muscular activity proceeds to resist segmental interactions during the late EFSw and
through Acc. The combined effects of muscular activity and segmental interactions
lead the left arm and stick system to function as a double pendulum consisting of the
left arm and the hockey stick whilst the right arm system more closely resemble a
triple pendulum consisting of the right upper arm, right forearm and the hockey
stick.
The left arm system acts as a double pendulum due to the maintenance of a more
extended left elbow throughout the hit and appears to be more predominant in setting

98
the plane of the hit. The right arm system acts in three segments, yet the right elbow
does not proceed immediately into extension after flexion. The ‘fixing’ of the right
elbow during the transition between flexion and extension allows segmental
interactions, caused by the acceleration of the trunk and the shoulder, to act about the
right wrist as opposed to at the right elbow as the wrists ‘cock’. The ‘fixing’ of both
elbows allows the shoulders to accelerate the arms and the hockey stick during most
of the EFSw before segmental interactions as the wrists ‘uncock’ cause extension of
the right elbow during the Acc phase. As wrist ‘uncocking’ occurs, trunk
musculature resists the interactions at the shoulders to keep them moving in the
direction of the target, whilst arm musculature, particularly of the left side, regulates
the maintenance of a more extended left elbow and allows the right arm to become
more extended.
Muscles acting about the shoulder joint, particularly the anterior and posterior
deltoids, do not provide a picture of quiescence as seen in other similar hitting
motions. Musculature of the shoulder during the field hockey hit appears responsible
for causing the initial acceleration of the arms at the shoulders and may also be
attributable to greater shoulder flexion during the downswing as a result of both a
shallower swing plane and the step taken towards the ball, both of which may also
account for lesser pectoralis activity recorded here compared to the golf swing.
Little activity of right side musculature after the EFSw suggests that the right arm is
relatively passive and does not contribute to the acceleration of the stick once the
elbow starts extending. The right arm therefore controls the stick and acts more with
a supporting role during the downswing. Acceleration of the hockey stick during the

99
downswing appears to come firstly from muscular activity at the shoulders before the
wrists ‘uncock’ and it is this ‘uncocking’ that continues to move the stick through
the Acc phase towards impact with the hockey ball. The cause of wrist uncocking
remains not entirely clear, however evidence suggests that the active slowing of the
shoulders may contribute to its initiation.
This study has shown that EMG analysis alone is not sufficient to explain the nature
of muscular activity patterns and that the temporal aspects of EMG analysis are
paramount to ascertaining the role of muscular activity during movement. A
combination of kinematic data and EMG analysis is needed to help fully explain
observed EMG activity patterns.

100
7. References
Abernethy, B., Neal, R.J., Moran, M.J. and Parker, A.W. (1990) Expert-novice
differences in muscle activity during the golf swing. In, Chochran A.J. (Editor)
(1990). Science and Golf. London: E&FN Spon. 54-60.
Anders, E. and Myres, S. (1999) Field Hockey: Steps to Success. Champaign, IL:
Human Kinetics.
Barnes, M.J. and Kentwell, R.G.R. (1979) Field hockey: The Coach and Player (2nd
ed.). Boston: Allyn & Bacon.
Bootsma, R.J. (1988) The Timing of Rapid Interceptive Actions. Amsterdam: Free
University Press.
Brétigny, P., Leroy, D., Button, C., Chollet, D. and Seifert, L. (2011) Coordination
profiles of the expert field hockey drive according to field roles. Sports
Biomechanics. 10(4): 399-350.
Brétigny, P., Seifert, L., Leroy, D. and Chollet, D. (2008) Upper-limb kinematics
and coordination of short grip and classic drives in field hockey. Journal of
Applied Biomechanics. 24: 215-223.
Budney, D.R. and Bellow, D.R. (1990) Evaluation of golf club control by grip
pressure measurement. In Cochran, A.J. (Editor) (1990) Science and Golf.
London: E & FN Spon. 30–35.
Burden, A.M., Grimshaw, P.N. and Wallace, E.S. (1998) Hip and shoulder rotations
during the golf swing of sub 10 handicap players. Journal of Sports Sciences.
16(12): 165-176.
Burden, A. (2008) Surface Electromyography. In Payton, C.J. and Bartlett, R.M.
(Editors) (2008) Biomechanical Evaluation of Movement in Sport and
Exercise. Oxon, Routledge. 77-103.
Burgess-Limerick, R., Abernethy, B. and Neal, R.J. (1991) Experience and
backswing movement variability. Human Movement Science. 10: 621-627.
Cheetham, P.J., Martin, P.E., Mottram, R.E. and St Laurent, B.F. (2001) The
importance of stretching the "X-Factor" in the downswing of golf: The "X-
Factor Stretch." In P.R. Thomas (Editor), Optimising Performance in Golf.
Brisbane, Australia: Australian Academic Press. 192-199.
101
Chivers, L. and Elliott, B.C. (1987) The penalty corner in field hockey. Excel. 4: 5-8.
Clayrs, J.P. and Cabri, J. (1993) Electromyography and the study of sports
movements: A review. Journal of Sports Sciences. 11(5): 379-448.
Cram, J.R., Kasman, G.S. and Holtz, J. (1998). Introduction to Surface
Electromyography. Gaithersburg, MD: Aspen Publishers.
DeLuca, C.J. (1997) The use of surface electromyography in biomechanics. Journal
of Applied Biomechanics. 13(2): 135-163.
DiGiovine, N.M., Jobe, F.W., Pink, M., and Perry, J. (1992) An electromyographic
analysis of the upper extremity in pitching. The Journal of Shoulder and Elbow
Surgery. 1(1): 15-25.
Egret, C.I., Weber, J., Dujardin, F.H. and Chollet, D. (2004) The effect of
electromyographic equipment on golf swing kinematics. Ioskinetics and
Exercise Science. 12: 199-202.
Egret, C.I., Nicolle, B., Dujardin, F.H., Weber, J. and Chollet, D. (2006) Kinematic
analysis of the golf swing in men and women experienced golfers.
International Journal of Sports Medicine. 27(6): 463-467.
Ellenbecker, T.S., Roetert, E.P. and Riewald, S. (2006) Isokinetic profile of wrist
and forearm strength in elite female junior tennis players. British Journal of
Sports Medicine. 40: 411-414.
Elliott, B., Marsh, A. and Blanksby, B. (1986) A three-dimensional cinematographic
analysis of the tennis serve. International Journal of Sport Biomechanics. 2(4):
260-270.
Elliott, B.C. and Chivers, L. (1988) A three dimensional cinematographic analysis of
the penalty corner hit in field hockey. In de Groot, G., Hollander, A.P.,
Huijing, P.A. and van Ingen Schunau G.J. (Editors) Biomechanics XI-B.
Amsterdam: Free University Press. 791-797.
England Hockey. (2005) Core Skills for Field Hockey. Birmingham; Westpoint
Printing.
Escamilla, R.F. and Andrews, J.R. (2009) Shoulder muscle recruitment and related
biomechanics during upper extremity sports. Sports Medicine. 39(7): 569-590.

102
Farber, A.J., Smith, J.S., Kvitne, R.S., Mohr, K.J. and Shin, S.S. (2009)
Electromyographic analysis of forearm muscles in professional and amateur
golfers. The American Journal of Sports Medicine. 37(2): 396-401.
Ferdinands, R.E.D. (2010) Advanced applications of motion analysis in sports
biomechanics. In Jensen, R., Ebben, W., Petushek, E., Richter, C. and
Roemer, K. (Editors) XXVIII International Symposium of Biomechanics in
Sports. Marquette, MI.
FIH (2012) Rules of hockey. Lausanne: The International Hockey Federation.
Franks, I. M., Weicker, D. and Robertson, D. G. E. (1985) The kinematics,
movement phasing and timing of a skilled action in response to varying
conditions of uncertainty. Human Movement Science. 4: 91-105.
Gros, V. (1979) Inside Field Hockey for Women. Chicago: Contemporary Books.
Hume, P.A., Keogh, J. and Reid, D. (2005) The role of biomechanics in maximizing
distance and accuracy of golf shots. Sports Medicine. 35(5): 429-449.
Jobe, F.W., Moynes, D.R. and Antonelli, D.J. (1986) Rotator cuff function during a
golf swing. The American Journal of Sports Medicine. 14: 388-392.
Jobe, F.W., Perry, J. and Pink, M. (1989) Electromyographic shoulder activity in
men and women professional golfers. The American Journal of Sports
Medicine. 17: 782-787.
Loftice, J., Fleising, G.S., Zheng, N. and Andrews, J.R. (2004) Biomechanics of the
elbow in sports. Clinics in Sports Medicine. 23(4): 519-530.
Kamen, G., and Gabriel, D.A. (2009) Essentials of Electromyography. Champaign,
IL: Human Kinetics.
Kao, J.T., Pink, M. and Jobe, F.W. (1995) Electromyographic analysis of the
scapular muscles during a golf swing. The American Journal of Sports
Medicine. 23: 19-23.
Konrad, P. (2005) The ABC of EMG. A Practical Introduction to Kinesiological
Electromyography. Scottsdale, AZ: Noraxon.
Kusuhara, K. (1993) Kinematic analysis of field hockey stroke. Abstracts of
International Society of Biomechanics. XIVth Congress, Paris 4-8 July. 743-
745.

103
Kwon, Y.H., Como, C.S., Singhal, K., Lee, S. and Han K.H. (2012) Assessment of
planarity of the golf swing based on the functional swing plane of the clubhead
and motion planes of the body parts. Sports Boimechanics. 11(2): 127-148.
Mackey, H. (1964) Field Hockey. An International Team Sport. New Jersey:
Prentice Hall.
Marta, S., Silva, L, Castro, M.A., Pezarat-Correia, P. and Cabri, J. (2012)
Electromyography variables during the golf swing: A literature review.
Journal of Electromyography and Kinesiology. 22(6): 795-1018.
McChesney, I. (2004) The New Book of Muscles. Lydney: Corpus Publishing.
McHardy, A. and Pollard, H. (2005) Muscle activity during the golf swing. British
Journal of Sports Medicine. 39: 799-804.
McLean, J. (1992) Widen the gap. Golf Magazine. 12: 49-53.
McTeigue, M., Lamb, S.R., Mottram, R. and Pirozzolo, F. (1994) Spine and hip
motion analysis during the golf swing. In: Cochran, A.J. and Farally, M.R.
(Editors) Science and Golf II. Proceedings of the 1994 World Scientific
Congress of Golf. London: E&FN Spon. 50-57.
Milburn, P.D. (1982) Summation of segmental velocities in the golf swing. Medicine
and Science in Sports and Exercise. 14(1): 60-64.
Mitchell, K., Banks, S., Morgan, D. and Sugaya, H. (2003) Shoulder motions during
the golf swing in male amateur golfers. The Journal of Orthopaedic and Sports
Physical Therapy. 33(4): 196-203.
Murtaugh, K. (2000) EMG analysis of the field hockey drive. In Dansereau, J.
(Editor) Proceedings of the XXVth Congress de la Société de la
Bioméchanique – XIth Congress of the Canadian Society for Biomechanics.
Lisse: Swets & Zeitlinger.
Okuda, I., Armstrong, C.W., Tsunezumi, H. and Yoshiike, H. (2002) Biomechanical
analysis of professional golfer’s swing: Hidemichi Tnanka. In Thain, E.
(Editor) (2005) Science and Golf IV. Proceedings of the World Scientific
Congress of Golf. Oxford: Routledge. 18-27.
Okuda, I., Gribble, P. and Armstrong, C. (2010) Trunk rotation and weight transfer
patterns between skilled and low skilled golfers. Journal of Sports Science and
Medicine. 9: 127-133.

104
Pink, M., Jobe, F.W. and Perry, J. (1990) Electromyographic analysis of the shoulder
during the golf swing. The American Journal of Sports Medicine. 18: 137-140.
Pink, M., Perry, J., Browne, A., Scovazzo, M.L. and Kerrigan, J. (1991) The normal
shoulder during freestyle swimming: An electromyographic cinematographic
analysis of twelve muscles. The American Journal of Sports Medicine. 19(6):
569-576.
Putnam, C.A. (1993) Sequential motions of body segments in striking and throwing
skills: descriptions and explanations. Journal of Biomechanics. 26 S1: 125-
135.
Read, B. (1976) Better Hockey for Girls. London: Kaye and Ward.
Rouffet, D.M. and Hautier, C.A. (2008) EMG normalisation to study muscle
activation in cycling. Journal of Electromyography and Kinesiology. 18: 866-
878.
Rutkowska-Kucharska, A., Szpala, A. and Pieciuk, E. (2009) Symmetry of muscle
activity during abdominal exercise. Acta of Bioengineering and Biomechanics.
11(1): 25-30.
Scovazzo, M.L., Browne, A., Pink, M., Jobe, F.W. and Kerrigan, J. (1991) The
painful shoulder during freestyle swimming: An electromyographic
cinematographic analysis of twelve muscles. The American Journal of Sports
Medicine. 19(6): 577-582.
Wein, H. (1979) The Science of Hockey. London: Pelham Press.
Willmott, A.P. and Dapena, J. (2009) The planarity of the stick and arm motion in
the field hockey hit. In Harrison, A.J., Anderson, R. and Kenny, I. (Editors)
(2010) Proceedings of the 27th
International Conference on Biomechanics in
Sport. Limerick, Ireland.
Willmott, A.P. and Dapena, J. (2012) The planarity of the stickface motion in the
field hockey hit. Journal of Sports Sciences. 30(4): 369-377.
Zheng, N., Barrentine, S.W., Fleisig, G.S. and Andrews, J.R. (2008) Kinematic
analysis of swing in pro and amateur golfers. International Journal of Sports
Medicine. 29(6): 487-493.
Zheng, N., Barrentine, S.W., Fleisig, G.S. and Andrews, J.R. (2008) Swing
kinematics for male and female pro golfers. International Journal of Sports
Medicine. 29(12): 965-970.

105
8. Appendices
Appendix 1. Participant Information Sheet
Appendix 2. Consent Form
Appendix 3. Pre-Physical Activity Questionnaire (PAR-Q)
Appendix 4. Muscle-electrode interface sites and MVC tests.

106
Appendix 1. Participant Information Sheet
Participant Information Sheet
Study Title: The Timing and Magnitude of Muscular Activity Patterns During a Field Hockey Hit.
You are invited to take part in the above research project. Before you decide to participate it is important for you to understand why the research is being done and what it will involve. Please take time to read the following information carefully and discuss it with others if you wish. Ask if anything is unclear or if you would like more information. What is the purpose of the study? This study will investigate the timing of activity of a range of arm and trunk muscles during the field hockey hit. What would be involved for me? At the start of the session, 16 electromyography (EMG) electrodes will be attached to your upper body using adhesive tape. These electrodes passively record muscle activity. Twenty spherical reflective markers will also be attached, to allow your motions to be tracked. You will then be asked to perform a warm-up, under the instruction of the researcher, before executing six hits. During these hits, your muscle activity and body movements will be recorded. The entire session should last approximately 60 minutes. Where will the research take place? All testing will occur in the Biomechanics Laboratory at the University of Lincoln’s Human Performance Centre. Why have I been invited? As an experienced hockey player you will be familiar with the hitting activity, and will be able to perform it in a consistent way. Do I have to take part? Your participation in this study is entirely voluntary. If you do decide to participate, you have the right to withdraw from the study at any point and to request that your data not be used. What do I need to do if I wish to take part? Please read this Information Sheet and ask any questions that you may have relating to the proposed study. If you still wish to proceed then please read and sign

107
the Consent Form, and return it to the investigator. The latter will ask you to complete a physical activity readiness questionnaire before confirming your participation. Will my taking part in the study be kept confidential? Your name will not be revealed in any report or publication, and no reference will be made which could link you to the study. All data collected will be handled in strict confidence, and will be seen only by the members of the research team. What are the possible disadvantages and risks of participation? There is a slight risk of injury associated with performing the hits, similar to the risks encountered when hitting a ball during regular practice or competition. These risks will be minimised by the warm-up and by a risk assessment carried out by the researcher prior to the testing session. Some people may experience minor skin irritation resulting from the adhesive tape used to attach the reflective markers or electrodes, or from the alcohol wipes used to clean the electrode sites. What are the possible benefits of taking part? The results of your EMG and motion analyses will be made available to you on request, as will the findings of the completed study. This information may help you to improve your performance. What if I have any concerns or queries? For issues relating to the project, please contact either the researcher (Anthony Gorman, [email protected], (07725194914) or the project supervisor (Sandy Willmott, [email protected], (01522) 886651). If you would like to talk to someone about ethical issues relating to the project please contact either Hannah Rigby ([email protected], (01522) 837092) or Sandy Willmott ([email protected], (01522) 886651) at the University of Lincoln. Thank you for taking the time to read this information. Anthony Gorman

108
Appendix 2. Consent Form
Consent Form
Study Title: The Timing and Magnitude of Muscular Activity Patterns During a Field Hockey Hit. I agree to take part in this research project, and acknowledge that I understand the following statements:
The full details of the research have been explained to me and I am fully aware of what is expected of me as a participant.
I am responsible for providing information relating to my health status and/or previous experiences of unusual sensations/reactions caused by physical activity.
I am not aware of any injury and/or illness that will affect my ability to perform the assessment.
I am also responsible for reporting any unusual feelings or discomfort felt by myself during the assessment.
I am aware that I am not obliged to complete the assessments and that I am able to stop at any point, for any reason.
I am aware that my research results and any information I provide are fully confidential and will only be communicated to others if agreed so in advance.
My participation in this study is completely voluntary. I understand that I may withdraw from the study at any time and may ask that any data concerning me that have been collected are destroyed.
I have read and understand the information above, and any questions that I had have been fully answered. I agree to participate in this study.
Name (Print): Signature of Participant: Date: I declare that I have explained the testing procedure in full and have made myself available for any questions the participant may wish to ask. Name (Print): Signature of Researcher: Date:

109
Appendix 3. Physical Activity Readiness Questionnaire (PAR-Q)
Pre-Physical Activity/Laboratory Questionnaire
Name: Date of Birth: ____/____/____ Age: ______ The purpose of this questionnaire is to ensure that you are physically able to complete the exercise test(s) outlined to you in the Participant Information Sheet. Please answer the questions below honestly and completely. All information provided is strictly confidential and will only be viewed by the appropriate departmental staff member. Your co-operation is greatly appreciated. *Please CIRCLE the most appropriate option/s and use BLOCK CAPITALS when providing further detail. 1. How would you describe your present level of activity?
Sedentary moderately active active highly active* 2. How would you describe your present level of fitness?
Very unfit moderately fit trained highly trained* 3. Have you had to consult your doctor within the last 6 months? Y/N* If YES, please give brief details and alert the test/activity supervisor _________________________________ 4. Are you presently taking any form of medication? Y/N* If YES, please give brief details and alert the test/activity supervisor _________________________________ 5. Do you suffer, or have you ever suffered from, any of the following:
Asthma? Y/N* Diabetes? Y/N* Bronchitis? Y/N* Epilepsy? Y/N* High blood pressure? Y/N*
6. Do you suffer, or have you ever suffered from, any form of heart complaint?
Y/N* 7. Is there history of heart disease in your family? Y/N* 8. Do you currently have any form of muscle or joint injury? Y/N*
9. Have you had any cause to suspend your normal training/activity during the past
two weeks? Y/N*
10. Is there anything to your knowledge that may prevent you from successfully completing the tests that have been outlined to you? Y/N*
OFFICE USE ONLY
Date checked: ____/____/____
Screened by:
Status: (circle) Passed Flag

110
Declaration I have completed this questionnaire honestly and completely and all questions were answered to my complete satisfaction. I undertake to ensure that any change to my ability to participate in physical activity safely is communicated to immediately to an appropriate Department of Sport, Coaching and Exercise Science staff member. Signature of Subject: _____________________________Date: ___________ I declare that I have reviewed this form in its entirety and have made myself available for any questions the student may wish to ask. Signature of Researcher: __________________________Date: ___________

111
Appendix 4. Muscle-electrode interface sites and Maximal Voluntary Contraction (MVC) tests.
Muscle Electrode Placement Site MVC Test
Biceps brachii On the muscle mass on the anterior of the upper
arm.
Standing with the shoulder in 0° adduction and 0° internal rotation,
the hand supinated and the elbow in 90° flexion, resistance on the
forearm was applied against flexion of the elbow joint.
Triceps brachii Two centimetres medial of the midline of the arm,
approximately fifty per cent of the distance between
the acromion process and the olecranon fossa.
Standing with the shoulder in 0° adduction, 0° flexion and 0° internal
rotation, the hand supinated and the elbow in 90° flexion, resistance
on the forearm was applied against extension of the elbow joint.
Anterior deltoid To the anterior aspect of the arm approximately
4cm below the clavicle.
Standing with the shoulder in 0° adduction, 0° internal rotation and in
45° flexion, the hand supinated and the elbow in 0° flexion, resistance
on the forearm was applied against forwards flexion of the shoulder
joint.
Posterior deltoid Approximately two centimetres below the lateral
border of the spine of the scapula and was angled
on an oblique angle towards the arm.
Standing with the shoulder in 0° adduction, 0° internal rotation and in
45° extension, the hand supinated and the elbow in 0° flexion,
resistance on the forearm was applied against extension of the
shoulder joint.
Latissimus dorsi Approximately four centimetres below the ridge of
the inferior tip of the scapula, half the distance
between the spine and the lateral edge of the torso,
orientated in a slightly oblique angle of
approximately twenty-five degrees.
In a seated position with the shoulder at 45° of abduction, 90°
external rotation and 0° of horizontal adduction and the elbow in 90°
of flexion, resistance was applied under the elbow against adduction
of the arm at the shoulder.
Upper trapezius Along the ridge of the right shoulder, slightly lateral
to and one half the distance between the cervical
spine at C7 and the acromion.
Standing with the shoulder in 0° adduction, 0° flexion and 0° internal
rotation, the hand supinated and the elbow in 0° flexion, resistance
over the acromion process was applied against elevation of the
shoulder.
Clavicular
pectoralis major
On the chest wall at an oblique angle towards the
clavicle, approximately two centimetres below the
In a prone, press-up position with the shoulder in 90° abduction and
0° internal rotation and the elbow in 90° of flexion, resistance on the

112
clavicle, just medial to the axillary fold. upper back was applied against extension of the elbow and flexion
and horizontal adduction of the arm at the shoulder. Sternal pectoralis
major
Horizontal on the chest wall, approximately two
centimetres medial to the axillary fold, over the
muscle mass that arose as the participant medially
rotated the arm under resistance.