the three best targets for attacking p&c insurance fraud · 3. after payment—find more fraud...
TRANSCRIPT

»» insights
the»three»best»targets»for»attacking»P&C»insurance»fraudTo reduce losses, detect fraud earlier by focusing on these key points in the property and casualty insurance process
Insurance fraud losses are rising in the US, the UK and many other markets across the globe. Insurers
are experiencing higher incidences of opportunistic fraud (exaggeration of legitimate claims), as well
as premium leakage due to misrepresentations and omissions on coverage applications. Crimes by
organized fraud rings are also increasing in number and sophistication.
The result for US property and casualty insurers is an estimated $30 billion lost to fraud each year,
driving up operational costs and rates.1 Insurance fraud in the UK is estimated to add over £40 to the
average annual household premium.2
To turn the tide, insurers need better fraud detection—invoked at the earliest
possible moment, before losses mount.
This white paper:
Number 44 —September 2010
www.fico.com»» Make every decision countTM
In a recent study for a UK auto insurer, 65% more fraud was detected by FICO™ Blaze Advisor® business rules management system and predictive analytics.
1Insurance Information Institute, April 20102“Fraud and personal injury claims drive sharp increase in cost of insurance,” The Times, January 28, 2010
• Reveals the three key places in the insurance process where fraud detection
delivers the biggest return on investment.
• Discusses how business rules management enables insurers to attack fraud in
a flexible, modular manner at specific points in the process.
• Shows how the ease with which analytics can now be added to rules-driven
processes is greatly improving fraud detection accuracy.

Monthly reduction in charge-off
Annual reduction in charge-off
Annual benefit per total account
Figure 8: Improvement of just 50 basis points per month adds $1.9 million a yearPortfolio: 500,000 accountsTotal receivables: $1.5 billionAccounts in 1-cycle: $120 million (8% of total receivables)
1-to-3 cycle roll rate
1-to-3 cycle roll amount
3-to-charge-off roll rate
3-to-charge-off roll amount
Baseline
20.0%
$24,000,000
67.0%
$16,080,000
Conservative (50 basis points improvement)
19.9%
$23,880,000
66.7%
$15,919,602
$160,398
$1,924,776
$3.85
Average(100 basis points
improvement)
19.8%
$23,760,000
66.3%
$15,760,008
$319,992
$3,839,904
$7.68
Optimistic(200 basis points
improvement)
19.6%
$23,520,000
65.7%
$15,443,232
$636,768
$7,641,216
$15.28
www.fico.com page 2
The three best targets for attacking P&C insurance fraud
»» insights»» insights
» DangerousTrends In the UK last year, sharply rising fraud losses contributed to the biggest percentage jump in car
insurance premiums ever recorded. As reported in The Times, the average annual premium paid by
British drivers for comprehensive coverage increased 18% during 2009, and household insurance
also rose more than 10% as insurers sought to absorb the losses and remain profitable.3
In the US, the National Insurance Crime Bureau reported a 14% increase in the number of suspicious
claims referred for investigation in 2009.4 A recent survey by the Coalition Against Insurance Fraud
indicates that referrals have continued to increase across all insurance categories during 2010.5
These worrisome trends reflect economic pressures and changing social mores around insurance
claims and insurance fraud. Incidents of opportunistic fraud, such as adding items to a theft loss
claim, and so-called “soft fraud,” such as putting an advantageous false garage location on an
application for coverage, are increasing. More consumers today are inclined to file claims after
an auto accident. And more of those who do, perhaps persuaded by the exhortations of some
unscrupulous personal injury lawyers, are inclined to embellish them for financial gain. A 2008
survey of British consumers reported a 1.4 million jump over just 12 months in the number of British
consumers who said they did not consider insurance fraud to be wrong.6
Intentional, planned “hard fraud” is also on the rise. In the US, according to the National Insurance
Crime Bureau, the incidence of staged auto accidents surged 46% from 2007 to 2009.7
This kind of crime is occasionally perpetrated by individual policyholders, but is more often a modus
operandi of organized fraud rings. One popular scheme involves packing an old, unsafe vehicle with
hired accomplices, then slamming on the brakes in front of an innocent driver following too closely.
All participants in the scheme then file claims for whiplash or more serious injuries, delivering their
payouts, less a small fee, to the organizers. Fraud rings capable of staging a succession of incidents
like these in multiple locations can defraud insurance companies of millions. A leading UK insurer
recently told FICO that organized fraud is the biggest factor in its soaring fraud losses.
How can insurers turn back this rising tide of fraud losses? How can they detect fraud more
accurately and manage it more efficiently using current operational systems and staffing levels?
To reduce fraud losses, insurers must detect suspicious activity with greater precision at the earliest
possible moment. Using a business rules management system (BRMS), they can attack fraud in a
coordinated manner across the insurance process while focusing appropriate resources—including
analytic models—at specific points in the process.
With this approach, fraud detection and decisioning can be deployed as services, callable by any
number of existing operational systems. Such shared services enable even incompatible systems
resulting from business acquisitions to perform detection and decisioning consistently. Another
advantage is that these flexible services can be quickly and easily modified and updated by the
business users with specific areas of expertise (e.g., underwriting, claims processing), without
needing help from IT.
» Focused Counter-Offensives
3 ibid4 “Insurance fraud rising,” McClatchy News Service, March 30, 20105 ibid6“The acceptable face of fraud?” money blog, guardian.co.uk, January 30, 20097“Staged Accident Questionable Claims Up,” NICB press release, June 28, 2010

Monthly reduction in charge-off
Annual reduction in charge-off
Annual benefit per total account
Figure 8: Improvement of just 50 basis points per month adds $1.9 million a yearPortfolio: 500,000 accountsTotal receivables: $1.5 billionAccounts in 1-cycle: $120 million (8% of total receivables)
1-to-3 cycle roll rate
1-to-3 cycle roll amount
3-to-charge-off roll rate
3-to-charge-off roll amount
Baseline
20.0%
$24,000,000
67.0%
$16,080,000
Conservative (50 basis points improvement)
19.9%
$23,880,000
66.7%
$15,919,602
$160,398
$1,924,776
$3.85
Average(100 basis points
improvement)
19.8%
$23,760,000
66.3%
$15,760,008
$319,992
$3,839,904
$7.68
Optimistic(200 basis points
improvement)
19.6%
$23,520,000
65.7%
$15,443,232
$636,768
$7,641,216
$15.28
www.fico.com page 3
The three best targets for attacking P&C insurance fraud
»» insights»» insights
There are three key points in the insurance process where a focused assault on fraud using business
rules and analytics delivers substantial results:
1. Pointofsale(POS)—avoid doing business with fraudsters and reduce premium leakage
by more accurately classifying and pricing risk. Business rules verify that applications are
complete and correct, accessing internal and external data sources as necessary. Analytics
detect suspicious behavior patterns and score applications for risk of premium leakage or fraud.
Based on scoring thresholds, rules then determine what happens next (e.g., accept, reject, refer
to a specific analyst queue).
2. Firstnoticeofloss(FNOL)throughclaimsadjudication—avoid paying fraudulent claims
and identify fraudsters and fraud rings. Business rules guide claims representatives
and automate online claims filing applications. Rules-powered intelligent forms ask only for
the information required based on the claim and coverage. They access data sources as
necessary, invoke analytic models to score the claim for risk of fraud, then recommend
or automate actions based on the fraud score. During the adjudication process, rules can
monitor claims for suspicious new information and re-invoke models to re-score claims for
fraud risk.
3. Afterpayment—find more fraud while gaining deeper behavioral insights to improve
POS and FNOL detection. Analytics examine large volumes of data to detect patterns
of fraudulent behavior not evident in smaller data sets, and discover the complex and often
subtle connections pointing to organized fraud rings.
With the foundation of the BRMS in place, insurers can address these key points in the process
in a modular, staged fashion. Insurers might start, for instance, by injecting into their rules-driven
originations decisioning processes the appropriate type of analytics to address fraud risk at
POS. They could subsequently add analytics for fraud detection at FNOL and throughout claims
adjudication, and later strengthen their after-payment fraud detection.
With the proliferation of direct sales channels that don’t rely on traditional agents, and the pressure
to deliver quotes and underwriting decisions quickly, it’s becoming more difficult for insurers to
accurately classify/price risk and detect fraud. The industry estimates that $0.20–$0.30 of every
premium dollar is being lost through premium leakage and fraud that starts at the point of sale.
Business rules and analytics are a superior means of addressing the POS issues because they
can assess the overall quality of an application, and guide or automate actions based on that
assessment. Best-in-class solutions don’t simply check to see if any rules have been violated, add up
the number of violations and deliver a binary (yes, no) result. They analyze numerous application
characteristics in a holistic manner, then assign a score that is a relative measure of risk. These scores,
along with the reason codes that accompany them, answer the question: Is this application highly
risky compared to other applications, or are there just a few problems that need addressing before
the policy is issued?
This type of relative (or “ranked”) risk scoring is extremely useful because scoring cutoff points can
be established so that different actions are invoked for applications scoring above and below these
thresholds. Other rules can direct a referred application, based on reason codes, to the queues of
underwriters or analysts with expertise in the specific problem area.
» PointofSale(POS)

Monthly reduction in charge-off
Annual reduction in charge-off
Annual benefit per total account
Figure 8: Improvement of just 50 basis points per month adds $1.9 million a yearPortfolio: 500,000 accountsTotal receivables: $1.5 billionAccounts in 1-cycle: $120 million (8% of total receivables)
1-to-3 cycle roll rate
1-to-3 cycle roll amount
3-to-charge-off roll rate
3-to-charge-off roll amount
Baseline
20.0%
$24,000,000
67.0%
$16,080,000
Conservative (50 basis points improvement)
19.9%
$23,880,000
66.7%
$15,919,602
$160,398
$1,924,776
$3.85
Average(100 basis points
improvement)
19.8%
$23,760,000
66.3%
$15,760,008
$319,992
$3,839,904
$7.68
Optimistic(200 basis points
improvement)
19.6%
$23,520,000
65.7%
$15,443,232
$636,768
$7,641,216
$15.28
www.fico.com page 4
The three best targets for attacking P&C insurance fraud
»» insights»» insights
Underwriting managers can control the business rules that determine these actions. They speedily
modify the rules—including simulating the impact of a change—as new fraud schemes and
premium avoidance behaviors come to light. For example, a simulation might be run to answer
the question: “Could we lift profit by moving the score cutoff for manual application review a few
points?” Simulation is also a valuable tool for exploring how conservative or aggressive to be in
pursuing fraud and premium leakage—and the trade-offs associated with those decisions.
When a claim is first filed is a critical moment for fraud management. By detecting suspicious
activity at this point, insurers not only avoid making payments on illegitimate claims, they also avoid
spending processing resources on them.
It’s also a delicate moment, since customers who’ve experienced a loss are highly sensitive to the
treatment they receive. The challenge, therefore, is to perform rigorous fraud detection in a manner
that is as invisible as possible to the customer. The experience should feel like a service, not an inquest.
FNOL decisioning services driven by business rules and analytics are ideal for this situation. Powering
intelligent web forms or guiding a claims representative, rules automatically verify coverage and
prompt for initial information. By asking only relevant questions based on the type of claim and
coverage, rules minimize filing time while giving customers the impression that they are known
by their insurer. Rules also initiate fraud scoring on the claim and generate follow-up questions, if
necessary, depending on the score.
Figure 1: A point of sale (POS) decision service
Marketing POS FNOL
Customer
ClaimsAdjudication
BRMS
Applicationscorecard for risk of fraud orpremium leakage
Direct SalesChannel
POS Decisioning
RuleRepository
Retrospective
» PointofFirstNotice ofLoss(FNOL)

Monthly reduction in charge-off
Annual reduction in charge-off
Annual benefit per total account
Figure 8: Improvement of just 50 basis points per month adds $1.9 million a yearPortfolio: 500,000 accountsTotal receivables: $1.5 billionAccounts in 1-cycle: $120 million (8% of total receivables)
1-to-3 cycle roll rate
1-to-3 cycle roll amount
3-to-charge-off roll rate
3-to-charge-off roll amount
Baseline
20.0%
$24,000,000
67.0%
$16,080,000
Conservative (50 basis points improvement)
19.9%
$23,880,000
66.7%
$15,919,602
$160,398
$1,924,776
$3.85
Average(100 basis points
improvement)
19.8%
$23,760,000
66.3%
$15,760,008
$319,992
$3,839,904
$7.68
Optimistic(200 basis points
improvement)
19.6%
$23,520,000
65.7%
$15,443,232
$636,768
$7,641,216
$15.28
www.fico.com page 5
The three best targets for attacking P&C insurance fraud
»» insights
A variety of fraud analytics are easily added to rules-driven FNOL decisioning services. Predictive
analytics simultaneously examine dozens of claim characteristics, and the relationships between
them, to detect patterns of behavior indicative of fraud. This analysis creates a more complete
picture of a claim’s fraud risk than can be arrived at by relying on a sequence of rules alone.
A recent study performed by FICO for a progressive UK auto insurer demonstrated the increased
detection accuracy from this type of predictive model. The study analyzed and scored 10,000 of the
insurer’s claims and ranked them by fraud risk level. The result was a 65% increase in fraud detection
at a less than 1.0 false positive rate (legitimate claims referred for fraud review). Within the 200 claims
receiving the highest scores for fraud potential:
• 85 had been referred for review by the insurer (56 of which were confirmed fraudulent).
• 103 additional claims had not been referred by the insurer. These overlooked, highly suspicious
claims represented a very significant potential for reducing the insurer’s fraud losses.
Link analysis provides an additional layer of protection at FNOL by identifying suspicious aspects of
claims that are invisible when examining individual claims. This type of analytic detects suspicious
connections between a claim and previously filed claims that have either scored high for fraud potential
or been proven fraudulent. Such connections are usually based on similar data elements, such as names
or addresses—and good pattern matching techniques will identify these similarities even when the
match is not exact.
Marketing POS FNOL
Customer
ClaimsAdjudication
Figure 2: A first notice of loss (FNOL) decision service
Predictive model scores & ranks claims for risk of fraud
BRMS
RuleRepository
Fraud Detection
Claim filed online or via call center; additional claim data as received
Retrospective
Monthly reduction in charge-off
Annual reduction in charge-off
Annual benefit per total account
Figure 8: Improvement of just 50 basis points per month adds $1.9 million a yearPortfolio: 500,000 accountsTotal receivables: $1.5 billionAccounts in 1-cycle: $120 million (8% of total receivables)
1-to-3 cycle roll rate
1-to-3 cycle roll amount
3-to-charge-off roll rate
3-to-charge-off roll amount
Baseline
20.0%
$24,000,000
67.0%
$16,080,000
Conservative (50 basis points improvement)
19.9%
$23,880,000
66.7%
$15,919,602
$160,398
$1,924,776
$3.85
Average(100 basis points
improvement)
19.8%
$23,760,000
66.3%
$15,760,008
$319,992
$3,839,904
$7.68
Optimistic(200 basis points
improvement)
19.6%
$23,520,000
65.7%
$15,443,232
$636,768
$7,641,216
$15.28
www.fico.com page 6
The three best targets for attacking P&C insurance fraud
»» insights»» insights
When a claim scoring low for fraud risk, that would normally not be reviewed, shows a link to a high-
scoring claim, rules can move it into an analyst’s queue. Claims processing managers easily create the
rules that make review decisions, and modify them based on current claims volume and review capacity.
Both predictive analytics and link analysis should continue from FNOL throughout the entire claims
adjudication process. A best practice is to automatically rescore and redo the link analysis whenever
a claim is updated. In this way, new information emerging during the life of the claim and gradually
developing suspicious behavior patterns can be caught at the earliest possible moment.
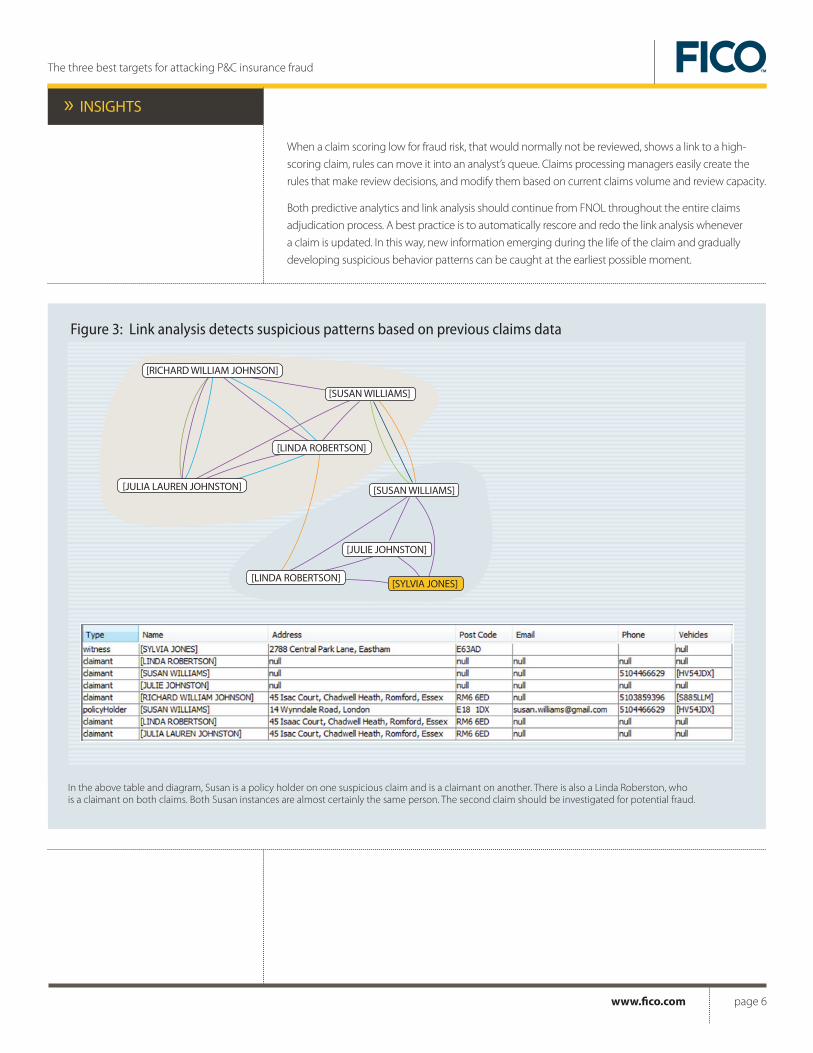
Figure 3: Link analysis detects suspicious patterns based on previous claims data
[RICHARD WILLIAM JOHNSON]
[JULIA LAUREN JOHNSTON]
[LINDA ROBERTSON]
[SUSAN WILLIAMS]
[LINDA ROBERTSON]
[SUSAN WILLIAMS]
[JULIE JOHNSTON]
[SYLVIA JONES]
In the above table and diagram, Susan is a policy holder on one suspicious claim and is a claimant on another. There is also a Linda Roberston, who is a claimant on both claims. Both Susan instances are almost certainly the same person. The second claim should be investigated for potential fraud.
Monthly reduction in charge-off
Annual reduction in charge-off
Annual benefit per total account
Figure 8: Improvement of just 50 basis points per month adds $1.9 million a yearPortfolio: 500,000 accountsTotal receivables: $1.5 billionAccounts in 1-cycle: $120 million (8% of total receivables)
1-to-3 cycle roll rate
1-to-3 cycle roll amount
3-to-charge-off roll rate
3-to-charge-off roll amount
Baseline
20.0%
$24,000,000
67.0%
$16,080,000
Conservative (50 basis points improvement)
19.9%
$23,880,000
66.7%
$15,919,602
$160,398
$1,924,776
$3.85
Average(100 basis points
improvement)
19.8%
$23,760,000
66.3%
$15,760,008
$319,992
$3,839,904
$7.68
Optimistic(200 basis points
improvement)
19.6%
$23,520,000
65.7%
$15,443,232
$636,768
$7,641,216
$15.28
www.fico.com page 7
The three best targets for attacking P&C insurance fraud
»» insights
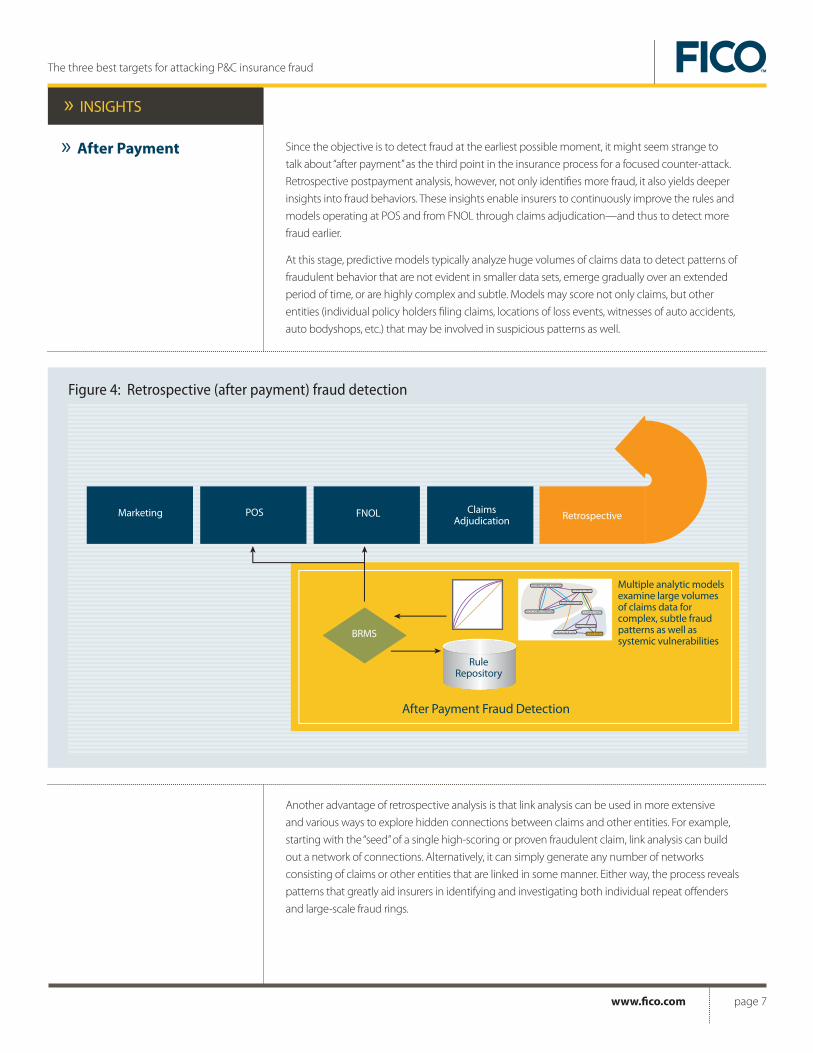
Since the objective is to detect fraud at the earliest possible moment, it might seem strange to
talk about “after payment” as the third point in the insurance process for a focused counter-attack.
Retrospective postpayment analysis, however, not only identifies more fraud, it also yields deeper
insights into fraud behaviors. These insights enable insurers to continuously improve the rules and
models operating at POS and from FNOL through claims adjudication—and thus to detect more
fraud earlier.
At this stage, predictive models typically analyze huge volumes of claims data to detect patterns of
fraudulent behavior that are not evident in smaller data sets, emerge gradually over an extended
period of time, or are highly complex and subtle. Models may score not only claims, but other
entities (individual policy holders filing claims, locations of loss events, witnesses of auto accidents,
auto bodyshops, etc.) that may be involved in suspicious patterns as well.
Another advantage of retrospective analysis is that link analysis can be used in more extensive
and various ways to explore hidden connections between claims and other entities. For example,
starting with the “seed” of a single high-scoring or proven fraudulent claim, link analysis can build
out a network of connections. Alternatively, it can simply generate any number of networks
consisting of claims or other entities that are linked in some manner. Either way, the process reveals
patterns that greatly aid insurers in identifying and investigating both individual repeat offenders
and large-scale fraud rings.
» AfterPayment
Marketing POS FNOL ClaimsAdjudication
Figure 4: Retrospective (after payment) fraud detection
BRMS
RuleRepository
Multiple analytic models examine large volumes of claims data for complex, subtle fraud patterns as well as systemic vulnerabilities
After Payment Fraud Detection
[RICHARD WILLIAM JOHNSON]
[JULIA LAUREN JOHNSTON]
[LINDA ROBERTSON]
[SUSAN WILLIAMS]
[LINDA ROBERTSON]
[SUSAN WILLIAMS]
[JULIA JOHNSTON]
[SYLVIA JONES]
Retrospective
TheInsightswhitepaperseries
providesbriefingsonresearch
findingsandproductdevelopment
directionsfromFICO.Tosubscribe,
gotowww.fico.com/insights.
The three best targets for attacking P&C insurance fraud
»» insights
Formoreinformation»» UStoll-free International email web +1 888 342 6336 +44 (0) 207 940 8718 [email protected] www.fico.com
FICO, Blaze Advisor and “Make every decision count” are trademarks or registered trademarks of Fair Isaac Corporation in the United States and in other countries. Other product and company names herein may be trademarks of their respective owners. © 2010 Fair Isaac Corporation. All rights reserved.2704WP 09/10 PDF
By implementing a BRMS, insurers gain a flexible means of delivering the right fraud detection and
decisioning services at specific points in the insurance process. They also establish a foundation for
continuous performance improvement.
Moreover, as insurers collect more application and claims data, they can speedily redeploy updated
analytic models into their operations. As analytic techniques advance, they can easily incorporate these
new methods. And always, fundamental control over the rules that govern their processes remains in
the hands of their business experts.
Find out how you can launch a focused counter-offensive against fraud:
• Learn about FICO fraud protection solutions for insurers.
• Download a free demo of FICOTM Blaze Advisor® business rules management system.
» Conclusion