the threat of social explosion in india
TRANSCRIPT
The Threat of Social Explosion
in India
Presented by,
Nithin Seenivasan (859867)
Introduction – The ugly Rich India
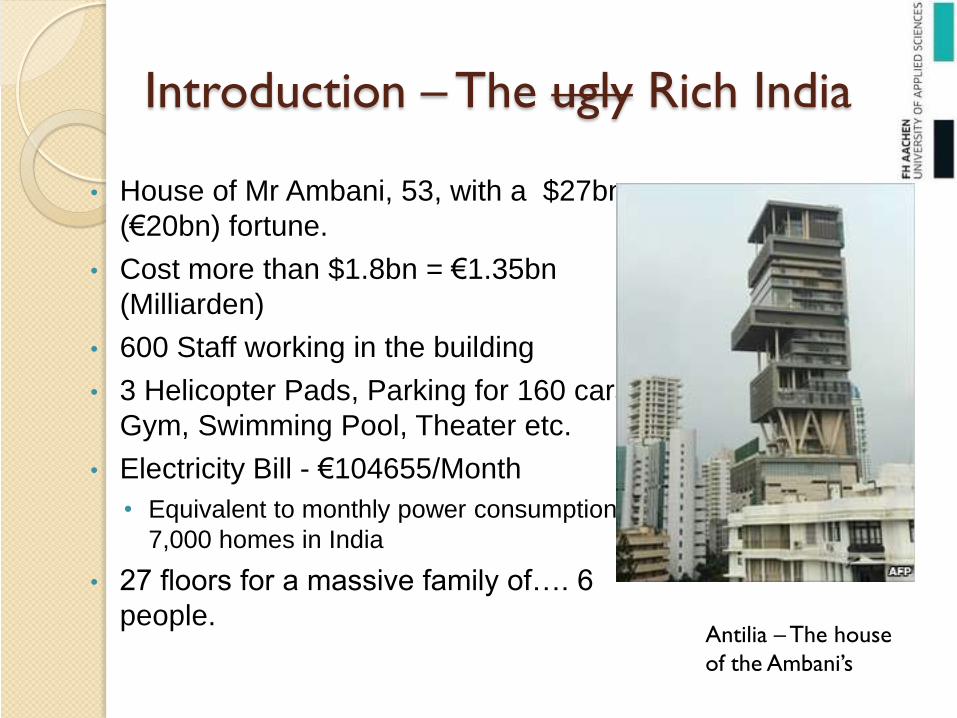
• House of Mr Ambani, 53, with a $27bn
(€20bn) fortune.
• Cost more than $1.8bn = €1.35bn
(Milliarden)
• 600 Staff working in the building
• 3 Helicopter Pads, Parking for 160 cars,
Gym, Swimming Pool, Theater etc.
• Electricity Bill - €104655/Month
• Equivalent to monthly power consumption of
7,000 homes in India
• 27 floors for a massive family of…. 6
people.
Antilia – The house
of the Ambani’s
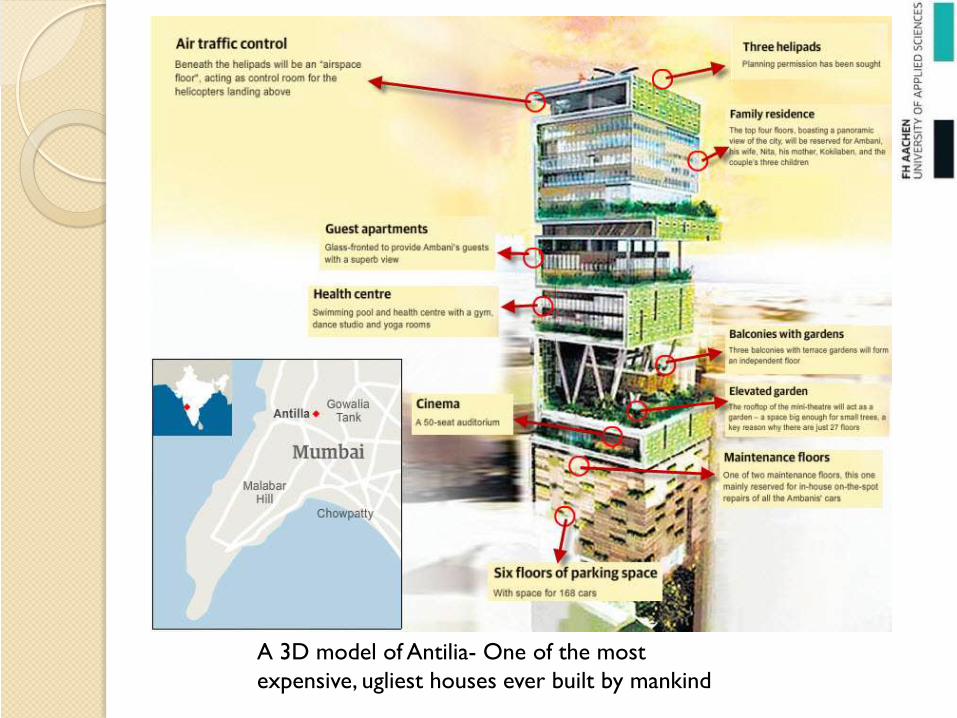
A 3D model of Antilia- One of the most
expensive, ugliest houses ever built by mankind

4 Major slums near Antilia
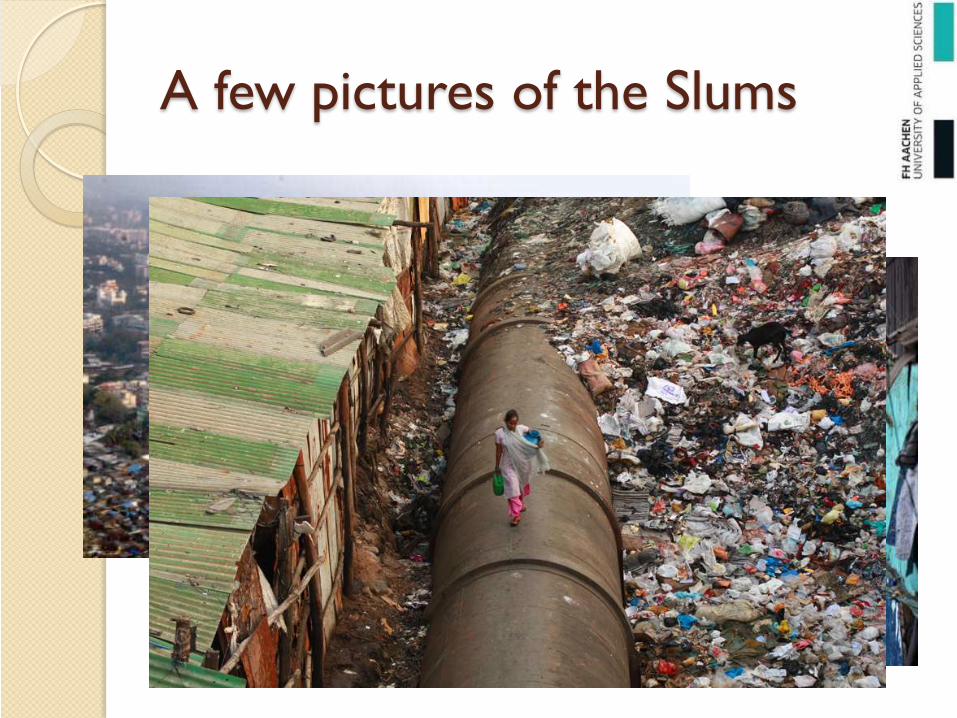
A few pictures of the Slums

The Social Divide
38% of India’s population (380 million) live Below
Poverty Line (BPL)
International poverty line- US$ 1.25, which is
INR 21.6 (0.31 EUR) a day in urban areas and
INR 14.3 (0.21 EUR) in rural areas (after PPP)
Six low-income states – Bihar, Chhattisgarh,
Jharkhand, Madhya Pradesh, Orissa and Uttar
Pradesh – are home to more than one third of
India's population – Have severe poverty,
unemployment and a general lack of development. PPP link

The Vicious Circle
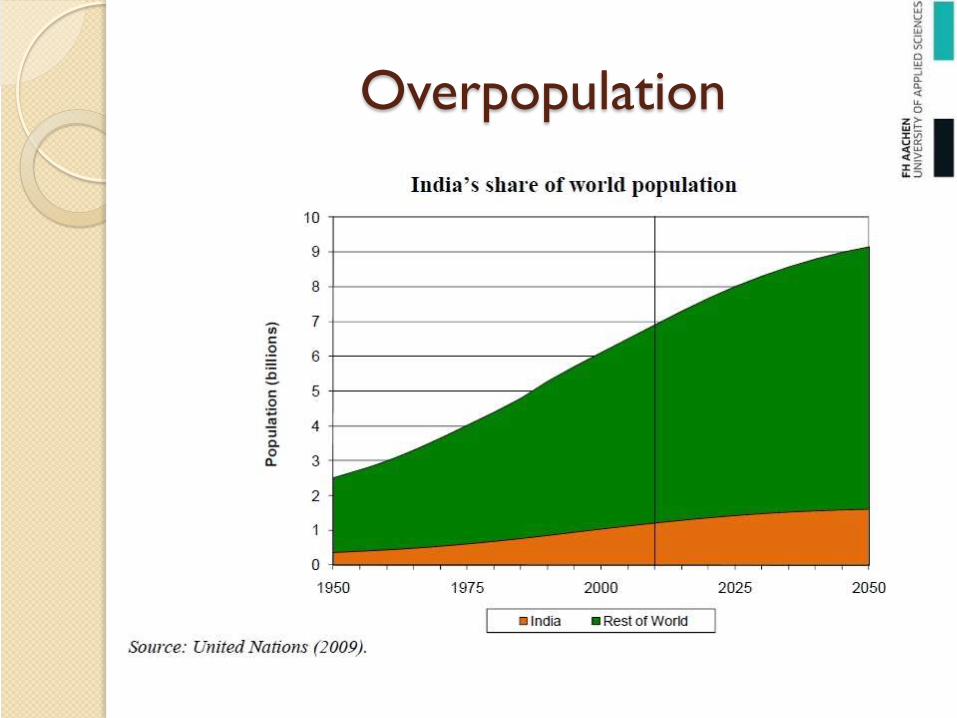
Overpopulation

Comparison of Population with
GDP, Energy Prices and Inflation
Source: CIA World Factbook
PopulationGDP (PPP)
(Billion $)
GDP
(Growth
Rate) (%)
Electricity Consumption
(Billion Kwh)
Electricity Production
(Billion Kwh)
Inflation (Consumer
Prices) (%)
2000 1,014,004,000 2,200 4.03 416.35 448.6 5.3
2001 1,029,991,000 2350 5.21 424.03 454.56 5.4
2002 1,045,845,000 2,660 3.76 509.89 547.12 5.4
2003 1,049,700,000 3,033 8.37 497.2 533.3 3.8
2004 1,065,071,000 3,319 8.27 497.2 533.3 4.2
2005 1,080,264,000 3,666 9.31 510.1 547.2 4.2
2006 1,095,352,000 4,156 9.27 519 556.8 5.3
2007 1,129,866,000 2,966 9.81 587.9 630.6 6.4
2008 1,147,996,000 3,297 6.23 517.2 665.3 8.3
2009 1,166,079,000 3,680 9.1 517.2 665.3 10.9
2010 1,173,108,000 4,060 9.71 568 723.8 11.7
2011 1,189,173,000 4,469 8.21 568 723.8 11.9

Population vs GDP
0
500
1.000
1.500
2.000
2.500
3.000
3.500
4.000
4.500
5.000
2000
2001
2002
2003
2004
2005
2006
2007
2008
2009
2010
2011
GDP (PPP) (Billion $)
GDP
(PPP)
(Billion $)
0
2
4
6
8
10
12
GDP (Growth Rate) (%)
GDP
(Growth
Rate) (%)
900.000.000
950.000.000
1.000.000.000
1.050.000.000
1.100.000.000
1.150.000.000
1.200.000.000
1.250.000.000
Population
Population

Population vs. Electricity Production/Consumption
900.000.000
950.000.000
1.000.000.000
1.050.000.000
1.100.000.000
1.150.000.000
1.200.000.000
1.250.000.000
Population
Population
0
100
200
300
400
500
600
700
800
2000
2001
2002
2003
2004
2005
2006
2007
2008
2009
2010
2011
Electricity Production (Billion
Kwh)
Electricity
Production
(Billion Kwh)
0
100
200
300
400
500
600
700
Electricity Consumption (Billion
Kwh)
Electricity
Consumption
(Billion Kwh)

Population vs. Inflation
0
2
4
6
8
10
12
14
Inflation (Consumer Prices) (%)
Inflation (Consumer
Prices) (%)
900.000.000
950.000.000
1.000.000.000
1.050.000.000
1.100.000.000
1.150.000.000
1.200.000.000
1.250.000.000
Population
Population

Installed Electricity capacity - 185.5 GW
Available peak load supply is 118.7 GW, but demand is 136 GW
Even major cities suffer from 1-2 hours of electricity blackouts occasionally
Electricity absolutely critical for EVERY sphere of development- Education, Manufacturing, Agriculture, etc.
300 million Indian citizens have no access to electricity. (One third of rural population, and 6% of the urban population)
A huge sense of Social Inequality arises when deprived of this basic “necessity”
Impending Energy Crisis

Impending Energy Crisis
India’s primary energy consumption is 524.2 MTOE.
(Coal 52.9% , Oil 29.6% and natural gas 10.6%)
Huge dependency on oil exporting countries- 73% of
the oil consumed is imported
Important to remember that there are only 13 million
cars currently on the Indian streets. This amount is
rising almost in accordance with the population rise.
With respect to Oil, Two scenarios feared- Disruption
and Price rise.
No Strategic Oil Reserves at all. If supply is disrupted,
13 million vehicles come to a stop.
According to Goldman Sachs, the increase in oil price
by $10 per barrel could potentially slow India’s GDP
growth by 0.2%.
Increase in Oil prices will also cause Exchange rates to
fluctuate, potentially causing inflation rates to increase
Current fuel prices are INR 73 (1.07 Eur) per liter of
Petrol and INR 45 (0.66 Eur) per liter of Diesel, which is
still too high for most of the population
More people are unable to afford to own a vehicle and
travel
Still many depend on wood and coal for domestic
energy requirements
Impending Energy Crisis

Risk of a Social Explosion
Growing Energy prices, overpopulation and poverty is
increasing the Social Divide between the rich and poor
every single day
Will result in a “hopeless” generation, who will never
have the chance to prosper even if they possess all the
necessary talent to succeed
Will lead to a social unrest, leading to a full scale
explosion of society
Public flaunting of wealth by the rich makes the problem
worse

Why should International
Managers know this?
More sensitive towards local customs,
traditions
Understand employees from such regions
better
To be aware of the situation in the
country and to behave appropriately and
ethically, to avoid exploitation

Final Thoughts
Queen Marie Antoinette - "Qu'ils mangent de la brioche” (English- “Let them eat Cake”), when they were starving due to severe drought, causing unrest among the French peasants and ultimately causing the French Revolution
Ratan Tata (2011) - "It makes me wonder why someone would do that. That's what revolutions are made of.” , commenting about Ambani’s huge and ugly $1.8 Bn house
Hopefully, Ratan Tata’s words are not prophetic

Thank you!