the thermo-mechanical performance of glass-fibre ... · the thermo-mechanical performance of...
TRANSCRIPT
The thermo-mechanical performance of glass-fibre reinforced Polyamide 66
during glycol-water hydrolysis conditioning.
J. L. Thomason, J.Z. Ali and J. Anderson
University of Strathclyde, Department of Mechanical Engineering, 75 Montrose
Street, Glasgow G1 1XJ, United Kingdom.
Abstract
Injection moulded glass-fibre reinforced polyamide 66 composites based on two glass
fibre products with different sizing formulations and unreinforced polymer samples have
been characterised by dynamic mechanical analysis and unnotched Charpy impact
testing both dry as moulded and during conditioning in a glycol-water mixture at 70°C
for a range of times up to 400 hours. Simultaneously weight and dimension changes of
these materials have been recorded. The results reveal that hydrothermal ageing in
glycol-water mixtures causes significant changes in the thermo-mechanical performance
of these materials. It is shown that mechanical performance obtained after conditioning
at different temperatures can be superimposed when considered as a function of the
level of fluid absorbed by the composite polymer matrix.
1

Introduction
Glass fibre reinforced polyamides, such as polyamide 6 and 66, are excellent composite
materials in terms of their high levels of mechanical performance and temperature
resistance. However, the mechanical properties of polyamide based composites decrease
markedly upon absorption of water and other polar fluids. The mechanical performance
of these composites in a hydrothermal environment results from a combination of the
fibre and matrix properties and the ability to transfer stresses across the fibre-matrix
interface. Variables such as the fibre content, diameter, orientation and the interfacial
strength are of prime importance to the final balance of properties exhibited by injection
moulded thermoplastic composites [1-5]. Short fibre reinforced thermoplastics have
been used in the automotive industry for many years and there has recently been a
strong growth in the use of polyamide based materials in under-the-hood applications
[6]. These applications place stringent requirements on such materials in terms of
dimensional stability and mechanical, temperature and chemical resistance. There has
been a rapid increase in the number of moulded composites exposed to engine coolant at
high temperatures [7-10] and this has led to a need for an improvement in our
understanding of the performance of glass-reinforced-polyamide under such conditions.
Typical testing for these applications involves measurement of mechanical properties
before and after conditioning of the test material in model coolant fluids for a fixed
time, up to 3000 hours, at temperatures in the 100-150°C range [10]. It is not always
easy to obtain a good understanding of the structure-performance relationships of a
material from such snapshots of performance taken at a single condition. However, it
has been known for sometime within the industry that the chemical nature of the glass
fibre sizing can have a strong influence on the retention of some mechanical properties
of composites exposed to such hydrothermal conditioning. It is also well known that
2

polyamide materials absorb relatively high levels of moisture when exposed to
hydrothermal conditioning in water and that this can cause significant dimensional
changes [11-17]. Despite this, and the fact that such hydrothermal testing has become
commonplace for under-the-hood applications, there has been little systematic
investigation of dimensional change of glass-fibre reinforced polyamide composites
during such conditioning in coolant fluid. Thomason [17] has recently reviewed the
mechanical performance and dimensional changes observed in glass fibre reinforced
polyamide 66 during conditioning in coolant fluid at 120°C and 150°C. A rapid
reduction was observed in both the modulus and strength of these composites and the
matrix polymer in the initial stage of conditioning. However, unnotched impact was
seen to initially increase significantly. Due to the rapid rate of fluid absorption and
dimensional change at these high temperatures it was not possible to examine these
effects in detail. The weight and dimensional changes in these materials during
condition at lower temperatures (70°C) has recently been reported [18]. This paper
presents the results of a study of the changes in the thermo-mechanical performance of
injection moulded glass reinforced polyamide 66 composites during hydrothermal
conditioning in model coolant fluid. Composites have been prepared using two chopped
glass products where one contains a sizing system which has been optimised to improve
the performance of composites subjected to hydrothermal treatments. To enable study of
the initial stages of the process the conditioning temperature has been limited to 70°C
for a range of conditioning times up to 400 hours. Data on the changes in the thermal
and mechanical performance of these composites are presented and discussed in this
paper.
3
Experimental
The injection moulded polymer and composite bars for this study were supplied by the
3B fibreglass company. The polyamide 66 (PA66) used was DuPont Zytel 101.
Composite samples with 30% weight fibre content were produced using this polymer and
two chopped AdvantexTM
E-glass products. AdvantexTM
is a boron free E-glass
formulation. These products were chopped to a length of 4 mm and the individual fibres
had a nominal average diameter of 10 μm. Both samples were coated with sizings which
are designed for polyamide reinforcement. DS1143 is a typical sizing designed to
maximise the �dry as moulded� (DaM) performance of glass reinforced polyamides. The
main ingredients of such sizings are typically aminosilane coupling agent and a
commercial polyurethane dispersion [19,20]. DS1110 sizing contains extra components
which enhance the retention of composite mechanical properties in elevated temperature
hydrolytic environments [21-23]. Three series of samples were moulded, series A using
DS1143 glass, series B using DS1110 glass, and series R containing only the PA66 resin.
The glass and polymer were compounded on a twin screw extruder and injection
moulded to produce end-gated rectangular bars of with nominal dimensions 80x10x4
mm.
The test bars for this study were received vacuum packed in a DaM state. On removal
from the packaging all samples were weighed and their three dimensions recorded at
room temperature prior to conditioning. A micrometer with an operating range between
0-50mm ± 0.005mm was used in order to measure the width and the thickness of the test
samples. It is well known that the cross section of injection moulded samples may not be
exactly rectangular and it was noted that the recorded dimension varied slightly
dependent on where the measurement was taken. To ensure consistency measurements
were therefore taken at the exact centre of each sample, as per ISO 179. The sample bars
4

length exceeded the range of the micrometer and so the length of the test samples was
measured using a Vernier calliper with an accuracy of ±0.01 mm was used. A digital
balance with an operating range between 0-20 g ± 0.0001 g was used to measure sample
weights. Each data point presented is the average of measurements on seven individual
samples. Since these samples were subsequently used for impact testing this means that
each data point for each conditioning time was obtained on a different set of seven
samples. Hydrolysis conditioning took place in a temperature controlled bath with
samples fully immersed in a 50:50 mixture of glycol and water (GW) at 70°C. Samples
were stacked vertically and individually in a specially constructed rack such that the fluid
had access to all surfaces of each sample. Conditioning times were chosen in the range 0-
400 hrs. On removal from the conditioning container surface fluid was removed from the
samples with tissue and then they were again weighed and their dimensions recorded.
These samples were then equilibrated at room temperature in a GW mixture for 24 hours
after which they were again weighed and measured and then transferred immediately to
the impact tester. Unnotched Charpy impact properties were measured on seven
specimens in accordance with the procedures in ISO179-1 using a Tinius Olsen model
IT503 Impact Tester set up with a 6.35J pendulum capacity. DMA measurements were
made using a Polymer Laboratories Dynamic Mechanical Thermal Analyser MKIII, at a
frequency of 1 Hz, a strain of x 4, scanning rate of 4°C per minute and the samples were
clamped with a torque of 40 Nm. Knife edged clamping was employed, using a frame
which gave a sample length of 12 mm. Bending modulus and tanδ were studied through a
temperature range of �100°C to 150°C.
5
Results and Discussion
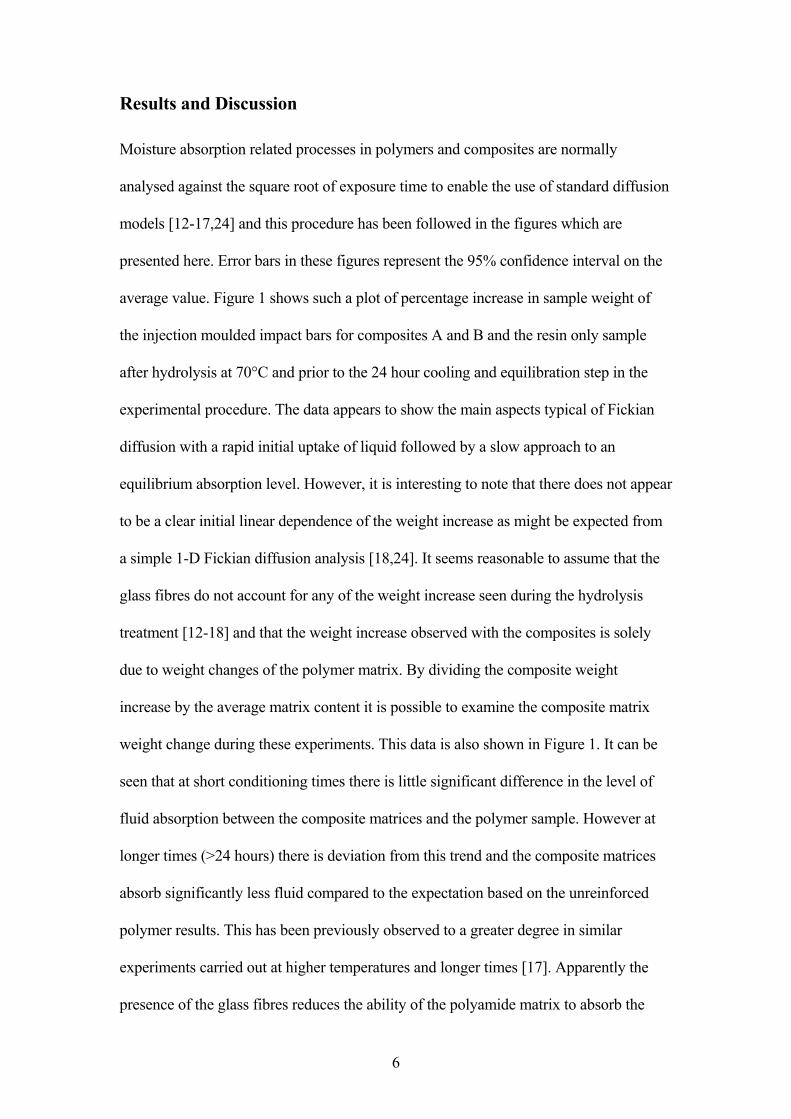
Moisture absorption related processes in polymers and composites are normally
analysed against the square root of exposure time to enable the use of standard diffusion
models [12-17,24] and this procedure has been followed in the figures which are
presented here. Error bars in these figures represent the 95% confidence interval on the
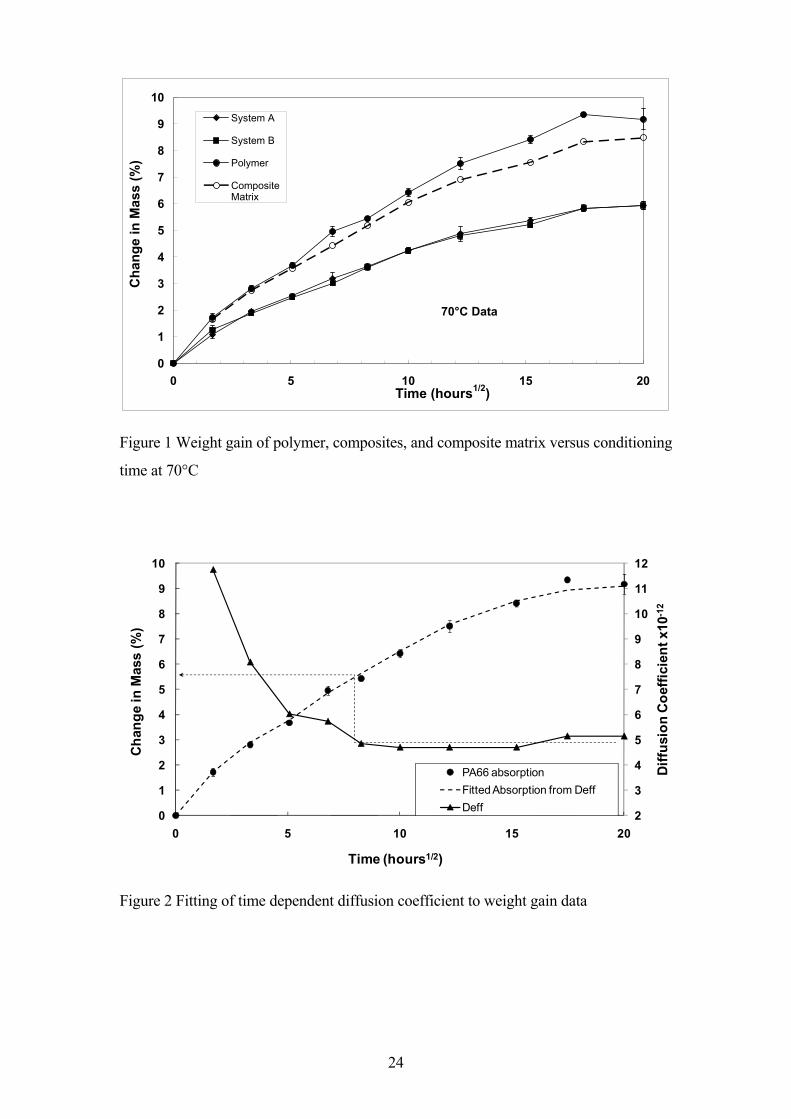
average value. Figure 1 shows such a plot of percentage increase in sample weight of
the injection moulded impact bars for composites A and B and the resin only sample
after hydrolysis at 70°C and prior to the 24 hour cooling and equilibration step in the
experimental procedure. The data appears to show the main aspects typical of Fickian
diffusion with a rapid initial uptake of liquid followed by a slow approach to an
equilibrium absorption level. However, it is interesting to note that there does not appear
to be a clear initial linear dependence of the weight increase as might be expected from
a simple 1-D Fickian diffusion analysis [18,24]. It seems reasonable to assume that the
glass fibres do not account for any of the weight increase seen during the hydrolysis
treatment [12-18] and that the weight increase observed with the composites is solely
due to weight changes of the polymer matrix. By dividing the composite weight
increase by the average matrix content it is possible to examine the composite matrix
weight change during these experiments. This data is also shown in Figure 1. It can be
seen that at short conditioning times there is little significant difference in the level of
fluid absorption between the composite matrices and the polymer sample. However at
longer times (>24 hours) there is deviation from this trend and the composite matrices
absorb significantly less fluid compared to the expectation based on the unreinforced
polymer results. This has been previously observed to a greater degree in similar
experiments carried out at higher temperatures and longer times [17]. Apparently the
presence of the glass fibres reduces the ability of the polyamide matrix to absorb the
6

same level of fluid that is absorbed by the polymer in an unrestrained environment. It
can also be seen in Figure 1 that there is no significant difference between the
absorption results obtained with two composite systems A and B at this conditioning
temperature.
In fluid absorption experiments in polymers, plate-shaped samples are generally
preferred so that the fluid absorption is mainly determined by the uptake through the
two broad faces of the plate. In this situation diffusion is approximated to occur in one
direction only. Consequently, if fluid uptake is determined by classical Fickian
diffusion, the fluid concentration can be approximated by the well known solution for
diffusion in an infinite plate, which yields a linear increase in the weight increase of the
sample with t1/2
over the initial part of the experiment. However, when samples with
different shapes are employed then corrections have to be made for edge effects where
the sample weight is also increased by fluid uptake via the other available surfaces of a
rectanguloid specimen. The necessary correction factors for such edge effects in
samples of the dimensions used in this study have recently been reviewed [18]. If
moisture uptake is determined by classical 1D Fickian diffusion, for diffusion in an
infinite plate the moisture concentration then the mass of fluid adsorbed in time t, M(t),
as a fraction of the final equilibrium of Me is given by [24]
( ) ( )∑=
−
⎥⎥⎦
⎤
⎢⎢⎣
⎡⎟⎟⎠
⎞⎜⎜⎝
⎛+−+−=
02
222
212exp12
81
)(
n
x
e a
tDnn
M
tM ππ
(1)
Where Dx is the diffusivity in the x direction and a is the thickness in the x direction.
When Dxt << 0.05a2 equation 1 can be reduced to
2/1
22/1
4)(⎟⎠⎞
⎜⎝⎛=a
tD
M
tM x
e π (2)
7

And thus the diffusivity can be obtained from the initial linear portion of the absorption
curve and the final equilibrium absorption level. In the case of fluid adsorption into a
real 3-dimensional monolithic rectanguloid of dimensions a,b,c in the x,y,z directions
where Dc=Dx=Dy=Dz an edge correction factor f can [18,25] be introduced into
equation 1 to give the effective diffusion coefficient
ceff DfD 2= (3)
bc
a
c
a
b
af
2
33.054.054.01 +++= (4)
The dimensions a,b,c correspond to the thickness, width and length of the injection
moulded bars which results in a value of f=1.212. Using the above analysis and the
initial slopes taken from the first data points in Figure 1 results in values of Deff= 12.0
x10-12
m2/s for the PA66 polymer and 10.4x10
-12 m
2/s for the composites, which is in
reasonable agreement with the values reported by Ishak and Berry [12]. However, given
the apparent curvature of lines in Figure 1 it was also decided to fit the full curves using
equation 1. The results of this exercise gave a better fit over a greater proportion of the
curve is obtained using a value of Deff=5.3 x10⁻¹²
m2/s or Dc=3.6 x10
-12 m
2/s for both
polymer and composites. It was recently proposed [18] that these psuedo-Fickian effects
could be explained by time dependent changes in Dc caused by changes in polymer
crystallinity caused by the elevated temperature hydrolytic environment. This is shown
in Figure 2 which shows the values of time dependent diffusion coefficient required to
obtain a predicted weight gain which matches the experimentally observed values. In
terms of later discussion, it should be noted in Figure 2 that the required value of time
dependent diffusion coefficient reaches an approximately constant value after the
polymer has absorbed 5-6% wt. of the GW fluid.
8

The results for the Charpy Unnotched impact strength are presented in Figure 3. It can
be seen that glass B gives a significant higher DaM unnotched impact despite having the
same fibre content. This difference is systematically maintained across the range of the
hydrolysis experiments. In the early stages of the hydrolysis conditioning there is a
small but significant drop in impact strength of both composites which reaches a
minimum at approximately 12 hours conditioning. At longer times the unnotched
impact starts to increase again and reaches a maximum value (+35-40% above the DaM
value) at approximately 150 hours. At yet longer conditioning times the unnotched
impact starts a slow decline but is still well above the DaM value at the maximum
conditioning time of 400 hours. The polymer samples also exhibited a significant
decrease in impact resistance which also reached a minimum after approximately 12
hours conditioning time. Further conditioning resulted in a rapid increase in the polymer
impact strength, however it was observed that in the experiments where samples were
conditioned longer than 25 hours not all of the samples could be broken in the impact
test. This is reflected in the increase in the confidence limits observed on the last two
points for the polymer samples in Figure 3. At conditioning times greater than 68 hours
only �no breaks� (>160 kJ/m2) were obtained with the polymer samples and so no
further data points are shown in Figure 3. The unnotched impact performance of the
PA66 polymer and composites is examined further in Figure 4 where the data are
plotted as a function of the mass of fluid absorbed by the polymer or composite matrix.
When presented in this manner it becomes clear that during the early stages of the GW
conditioning the trends in impact performance of the composites correlates well with
that of the polymer. Up to approximately 4% fluid uptake the impact performance
decreases. When the level of absorbed fluid exceeds approximately 5-6% there is clear
evidence of a change in impact performance with a sharp increase in both the polymer
and composite impact strength. From a study of the viscoelastic behaviour of PA66
9

during condition in water at 60°C it has been suggested that a large scale change in the
molecular structure of injection moulded PA66 takes place when the level of absorbed
water exceeds 5% wt [26]. It is certainly an interesting correlation that the results on
impact performance in this work also show an abrupt change in performance at
approximately the same level of GW absorption.
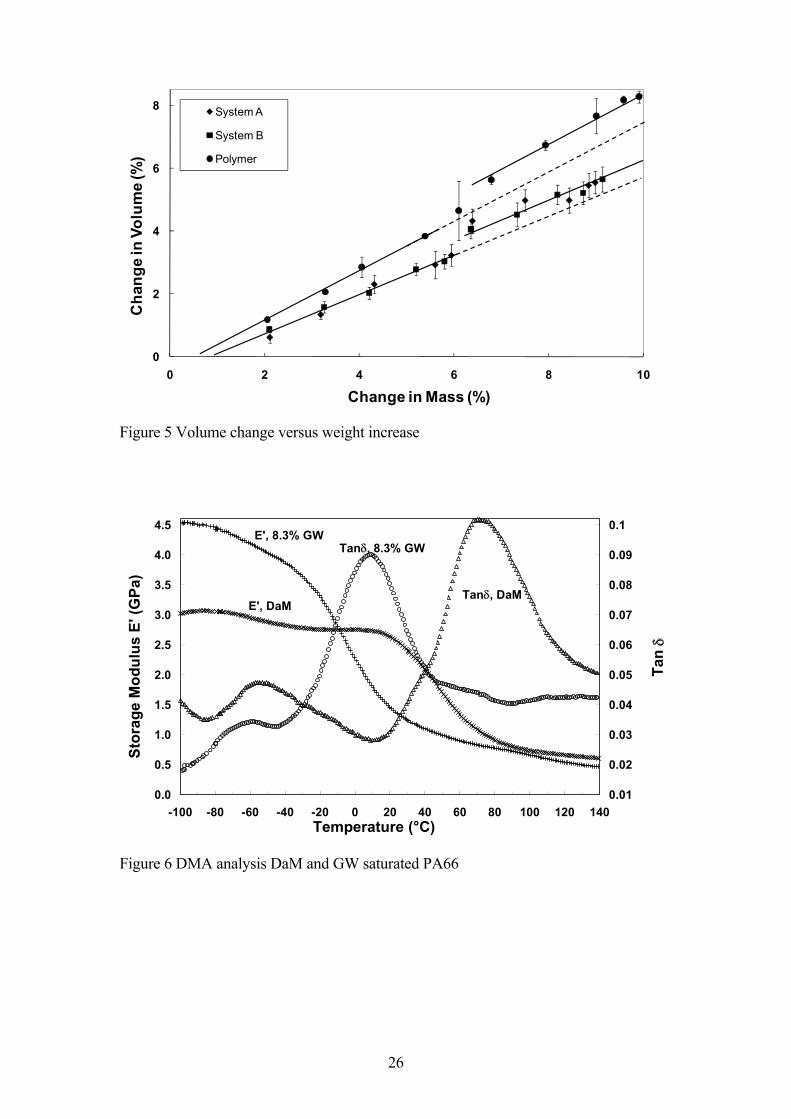
The hydrolysis conditioning also resulted in significant changes in the dimensions of the
polymer and composite samples [18]. The volume swelling of the polymer and
composite samples after 70°C GW conditioning and equilibration at 23°C prior to
impact testing is presented as a function of the polymer/matrix mass change in Figure 5.
Both polymer and composite samples exhibit a linear relationship between the
volumetric swelling and the mass of adsorbed fluid. However, there is clear evidence in
the data in Figure 5 of a step increase in this relationship which occurs at approximately
6% fluid absorption in both the polymer and the composite matrix. Consequently, we
have two independent measurements (Charpy impact and dimensional change) which
appear to indicate some abrupt change taking place in the PA66 when the GW
absorption level exceeds 5-6% wt. at 70°C. One possible explanation of this
phenomenon is analogous to the Brill transition [27] which is well known in PA66. This
is a broad transition of the crystal structure reported in dry PA66 between 160°C and
200°C but which has been observed to start as low as 80°C [28] and which is
accompanied by changes in the thermal and mechanical properties [29]. This transition
is observed crystallographically as a gradual transformation from the diffraction patterns
with triclinic to pseudo-hexagonal symmetry, accompanied by a significant increase in
volume [30] which is thought to contribute significantly to the relatively high level of
thermal expansion observed in PA66 in this temperature range. The Brill transition has
been considerably studied in dry PA66 and other polyamides as a function of
10
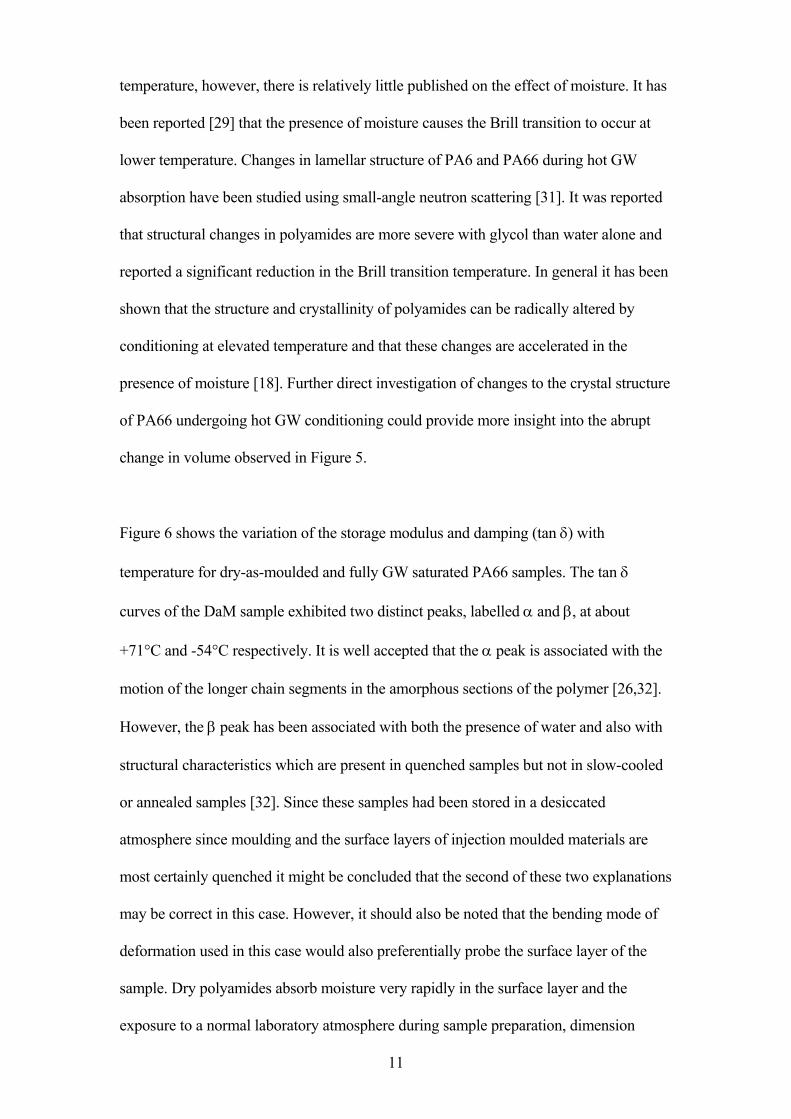
temperature, however, there is relatively little published on the effect of moisture. It has
been reported [29] that the presence of moisture causes the Brill transition to occur at
lower temperature. Changes in lamellar structure of PA6 and PA66 during hot GW
absorption have been studied using small-angle neutron scattering [31]. It was reported
that structural changes in polyamides are more severe with glycol than water alone and
reported a significant reduction in the Brill transition temperature. In general it has been
shown that the structure and crystallinity of polyamides can be radically altered by
conditioning at elevated temperature and that these changes are accelerated in the
presence of moisture [18]. Further direct investigation of changes to the crystal structure
of PA66 undergoing hot GW conditioning could provide more insight into the abrupt
change in volume observed in Figure 5.
Figure 6 shows the variation of the storage modulus and damping (tan δ) with
temperature for dry-as-moulded and fully GW saturated PA66 samples. The tan δ
curves of the DaM sample exhibited two distinct peaks, labelled α and β, at about
+71°C and -54°C respectively. It is well accepted that the α peak is associated with the
motion of the longer chain segments in the amorphous sections of the polymer [26,32].
However, the β peak has been associated with both the presence of water and also with
structural characteristics which are present in quenched samples but not in slow-cooled
or annealed samples [32]. Since these samples had been stored in a desiccated
atmosphere since moulding and the surface layers of injection moulded materials are
most certainly quenched it might be concluded that the second of these two explanations
may be correct in this case. However, it should also be noted that the bending mode of
deformation used in this case would also preferentially probe the surface layer of the
sample. Dry polyamides absorb moisture very rapidly in the surface layer and the
exposure to a normal laboratory atmosphere during sample preparation, dimension
11

measurement and loading into the DMA instrument may have allowed enough moisture
absorption into the sample to produce the β peak. The position of the α and β peaks for
the DaM PA66 is well in line with the results of other published results [26,32,33]
especially when taking into account that thermal analysis data on transition temperatures
is always dependent on instrument, deformation mode, sample dimensions and thermal
history and heating rate. The room temperature level of storage modulus for the DaM
PA66 polymer (2.6 GPa) also agrees well with the value of Young�s Modulus obtained
on almost identical materials using standard tensile testing [3]. The curves in Figure 6
for the GW saturated polymer sample indicate the strong effect on the thermo-
mechanical properties of PA66 caused by GW fluid absorption. Both α and β peaks are
shifted to lower temperature, the α peak shows a greater shift of approximately 63°C to
8°C whereas the β peak shifts by only 6°C to -60°C. The storage modulus curves
indicate a strong plasticisation of the polymer at room temperature. However there is an
anti-plasticisation of the polymer at sub-ambient temperatures.
Figure 7 follows the evolution of the damping curve for PA66 polymer submerged in
GW at 70°C with increasing time. It can be seen that �shift� of the DaM α peak to lower
temperature is not evidenced by a continuous shift in the peak temperature with
increasing fluid uptake. The magnitude of the α peak at 71°C rapidly decreases with
increasing exposure to hot GW and can no longer be resolved after 70 hours exposure.
Simultaneously a damping peak (α*) appears at approximately 10°C and grows in
intensity with increasing fluid uptake. There is little evidence in Figure 7 of a shift in the
α peak position to lower temperatures. Instead there appears to be a simultaneous
decrease in the α peak height and an increase in the α* peak height. There does not
appear to be clear resolvable trend in the low temperature β peak in Figure 7. The trends
12

for the magnitude of the α and α* peaks for the PA66 polymer are summarised in
Figure 8. The data in Figure 8 clearly reveals the correlation between the reduction in
the α peak and the increase in the α* peak with the mass of absorbed fluid in the PA66
polymer. However this trend is not enough to fully explain the appearance of the α*
peak at 10°C which clearly indicates a separate underlying phenomenon related to the
polymer fluid uptake.
Figure 9 follows the evolution of the storage modulus curve storage modulus for PA66
polymer submerged in GW at 70°C for increasing time. The principal observations in
Figure 9 consist of a clear reduction of modulus in the 0-40°C temperature range with
increasing fluid uptake. Simultaneously, an increase in the modulus in the sub-ambient
temperature range is observed. The high temperature plasticisation of polyamides due to
the ingress of moisture is well known [3,4,10-17,26,32]. Less well known is the low
temperature increase in modulus. This has been attributed to the ability of water to form
bonds between chain segments at low temperatures which are sufficiently stable to
produce an increase in modulus [32]. The change in storage modulus at various
temperatures compared to the weight of absorbed fluid in the PA66 polymer samples is
presented in Figure 10. At -80°C there appears to be a significant increase in storage
modulus with fluid content whereas at 25°C and 50°C there is an approximately linear
decrease in the polymer modulus with the ingress of fluid. A further interesting
observation in Figure 9 is the crossing of all the curves in the -10°C to 0°C temperature
range. This is further highlighted in Figure 10 where it can be seen that the storage
modulus at 0°C appears approximately independent of the polymer fluid uptake. At
80°C, above the DaM PA66 glass transition temperature, there is little evidence of a
significant dependence of the storage modulus of fluid uptake. However, at this
temperature (and higher) there must be considerable uncertainty in the actual fluid
13

content of the DMA sample which will be gradually drying out during the DMA
measurement due to the elevated temperature.
Figures 11 and 12 present the summarised results for a similar analysis of the DMA
performance of the series A composites. Figure 11, which shows the overview of the tan
δ peak analysis, reveals almost identical trends for the PA66 composite matrix as for the
PA66 polymer results in Figure 8. It can be noted that the tan δ level of the composite
matrix material is significantly reduced by the presence of the glass fibre reinforcement.
This phenomenon has been interpreted as an indication of the reduction of molecular
mobility of the polymer molecules in the composite due to interaction with the fibre
reinforcement [33]. As expected, the glass reinforcement also results in a significant
increase in the modulus of the material across the whole temperature range of the
measurements although it can be seen to have a proportionally larger effect at
temperatures above the α transition which results in a 90% reduction in the stiffness of
the polymer but only a 50% reduction in the stiffness of the composite.
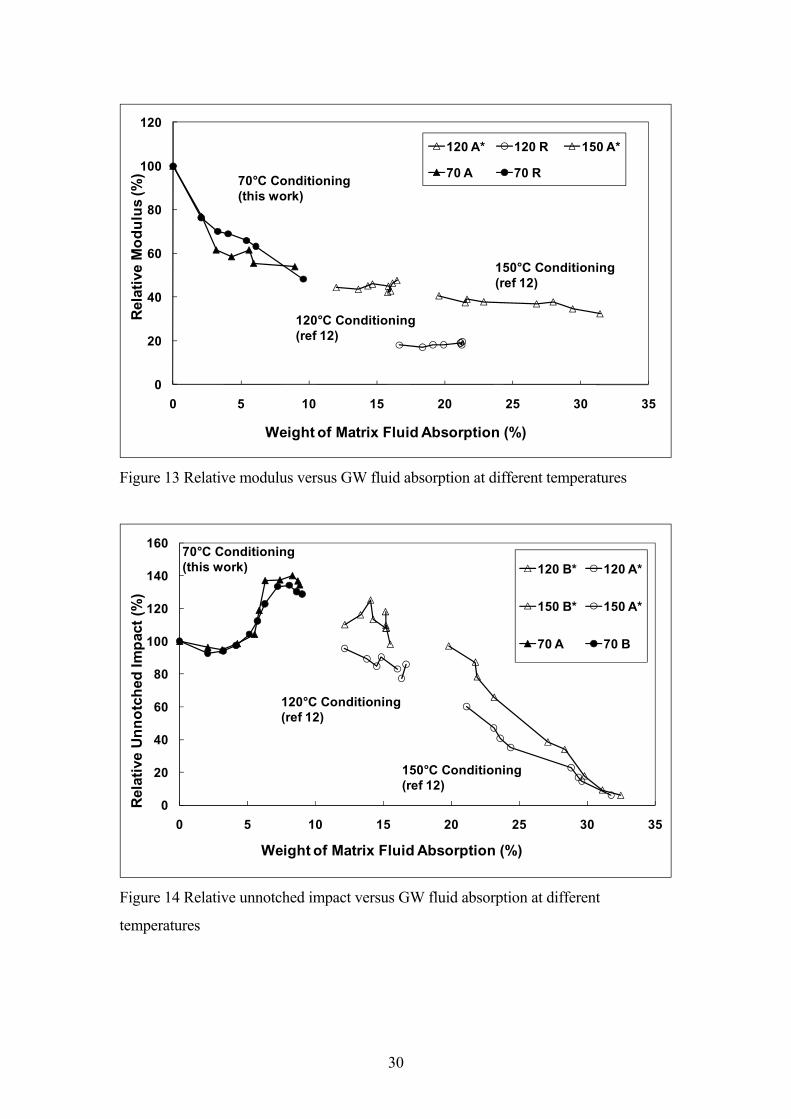
As discussed above, typical testing for these composites in automotive applications
involves measurement of mechanical properties before and after conditioning of the test
material in model coolant fluids for a fixed time at temperatures in the 100-150°C range.
In a previous report it was suggested that the results of mechanical property testing such
as unnotched impact measured after different conditioning times and temperatures may
be better understood when considered as a function of the level of fluid absorption
and/or swelling obtained at any individual condition [17]. This possibility is examined
further in Figures 13 and 14. These two figures present the mechanical performance of
PA66 polymer and composites as a function of the level of fluid absorbed by the
polymer (i.e. in the composites, the absorption level is normalised to the polymer
14

content). Data from this work obtained in GW mixtures at 70°C are compared with
previously published [17] values obtained at 120°C and 150°C. The materials used in
the previous report were based on the same grade of PA66, composite A* contained
Owens Corning 123D chopped glass (a similar DaM optimized product) and composite
B* contained Owens Corning 173X chopped glass (an older hydolysis resistance
optimized product). In Figure 13 the results for Young�s modulus are presented, where
the values have been normalised to the appropriate DaM value to eliminate small
differences in testing conditions. The three groups of data in the Figure represent the
different conditioning times at each temperature. It can be seen that there appears to be a
good correlation between the trends observed in Young�s modulus for both polymer and
composite samples conditioned at three different temperatures when the data is
considered in terms of the level of fluid uptake in the polymer (or composite matrix).
The Young�s modulus of these materials appears to decrease in a continuous manner
with the increasing level of fluid uptake.
Figure 14 presents data for unnotched impact in a similar manner. Although the overall
trend for unnotched impact is more complex than for Young�s modulus it is clear that
the data from the three conditioning temperatures do appear to fit well with each other.
In particular the apparent peak in unnotched impact observed in the data from this work
in Figure 3 is well confirmed when considered in reference to the results from higher
temperature conditioning which appears to fit well with the reduction in impact
observed as the level of fluid uptake is increased past the peak impact level of 7-8%
fluid uptake. A further point to note in Figure 14 is the influence of the glass fibre sizing
on the unnotched impact performance at different levels of fluid uptake. At short
conditioning times (and/or low conditioning temperatures) the normalised data for
composites A and B show little significant difference in relative performance. The
15

influence of the hydrolysis resistance optimised sizing only begins to become apparent
at conditions which result in a fluid uptake of greater than 5% weight. This difference
appears to become greater in the range 5-20% fluid uptake. However, under extreme
conditioning (longer times at high temperatures) the influence of the fibre sizing is
reduced as the unnotched impact of all composites falls to a very low level. Overall,
these results would seem to offer the possibility of predicting performance at any
conditioning time and temperature from data obtained under different conditions. This is
an area which requires further investigation.
16
Conclusions
This study of injection moulded glass-fibre reinforced polyamide 66 composites has
revealed that hydrothermal conditioning in water-glycol mixtures results in significant
changes in the weight, dimensions, and thermo-mechanical performance of these
materials. All materials showed a weight increase due to hydrothermal conditioning at
70°C which was typical of a pseudo-Fickian diffusion process. It was noted that the
presence of the glass fibres reduced the fluid uptake by an amount significantly greater
than would be expected from a simple scaling with the polymer content of the
composites. DMA analysis indicated a large reduction in glass transition temperature of
the PA66 after saturation in glycol-water mixtures. However, further investigation
revealed that this was not due to a continuous downward shift in the tan δ α peak, but
due to the simultaneous decrease in the high temperature α damping peak and
appearance and growth of a low temperature α* damping peak. Glycol-water absorption
caused a significant reduction in the DMA storage modulus in the 0-40°C range.
However, the sub-ambient storage modulus was significantly increased by fluid
absorption. The modulus of the conditioned polymer and composite samples decreased
continuously with increasing condition time and fluid absorption levels. The unnotched
Charpy impact performance exhibited more complicated trends. Initially the impact
strength fell with increasing conditioning time but after approximately 25 hours went
through a sharp rise reaching a maximum level approximately 40% above the DaM
values. Further increase in conditioning time was followed by a gradual decrease in
impact performance. When compared to mechanical performance after conditioning at
higher temperatures these data appeared to form continuous performance curves when
considered as a function of the level of adsorbed fluid in the composite matrix. The
results on dimensional change and unnotched impact indicated the presence of an abrupt
17

change in the structure-performance relationship of PA66 after absorbing 5-6% wt.
glycol-water mixture at 70°C.
Acknowledgement
The author gratefully acknowledges the support of 3B Fibreglass, Battice, Belgium with
the preparation and moulding of the materials used in this study.
18

References
1. Sato N, Kurauchi T, Sato S, and Kamigaito O. Reinforcing mechanism by small
diameter fiber in short fiber composites. J. Compos. Mater. 1998:22;850-873
2. Hassan A, Yahya R, Yahaya AH, Tahir ARM, Hornsby PR. Tensile, Impact and
Fiber Length Properties of Injection-molded Short and Long Glass Fiber-reinforced
Polyamide 6,6 Composites. J.Reinforced Plastics and Composites 2004;23:969-986.
3. Thomason JL. Structure-property relationships in glass reinforced polyamide: 1)
The effect of fibre content. Polym.Composites 2006:27:552-562.
4. Thomason JL. Structure-property relationships in glass reinforced polyamide: 2)
The effects of average fibre diameter and diameter distribution. Polym.Composites
2007:27:331-343.
5. Mouhmid B, Imad A, Benseddiq N, Benmedakhène S, Maazouz A. A study of the
mechanical behaviour of a glass fibre reinforced polyamide 6,6. Polymer Testing
2006;25:544-552.
6. Carlson E, Nelson K. Nylon under the hood: history of innovation. Automotive
Engineering 1996;104:84-89.
7. Harrison AR. Automotive Composite Components, Chapter 11 in Integrated Design
and Manufacture Using Fibre-reinforced Polymeric Composites. Eds. Owen MJ.
Middleton V. Woodhead Publishing, 2000.
8. Rudd CD. Composites for Automotive Applications, Rapra Review Reports Volume
11, number 6, 2000, page 12. Published by iSmithers Rapra, 2001
9. Page IB. Polyamides As Engineering Thermoplastic Materials. Rapra Review
Reports Volume 11, number 1, 2000, page 13. Published by iSmithers Rapra, 2001.
19

10. Gavenonis J, McIlvaine JE. Polyamide Resin Technologies for High Temperature
and Automotive Chemical Exposure Environments, Society of Automotive
Engineers Technical Paper Series, 2009, 2009-01-1297.
11. Valentin D, Paray F, Guetta B. The Hygrothermal Behaviour of Glass Fibre
Reinforced Pa66: a study of the effect of water absorption on their mechanical
properties. J.Mater.Sci. 1987;22:46-56.
12. Mohd Ishak ZA, Berry JP. Hygrothermal Aging Studies of Short Carbon Fiber
Reinforced Nylon 6.6. J.Appl.Polym.Sci. 1991;54:2145-2155.
13. Takeda N, Song D, Nakata K. Effects of temperature and water content on impact
properties on injection-molded glass nylon-6 composites . Adv. Composite Mater.
1996;5:201-212.
14. Bergeret A, Pires I, Foulc MP, Abadie B, Ferry L, Crespy A. The hygrothermal
behaviour of glass fibre reinforced thermoplastic composites. Polym Testing
2001;20:753-763.
15. Jia N, Fraenkel HA, Kagan VA. Effects of moisture conditioning methods on
mechanical properties of injection molded nylon 6. J.Reinforced Plastics and
Composites 2004;23:729-737.
16. I. Carrascal, J.A. Casado, J.A. Polanco, F. Gutiérrez-Solana, Absorption and
diffusion of humidity in fiberglass-reinforced polyamide. Polymer Composites
2005;26:580-586.
17. Thomason JL. Structure-property relationships in glass reinforced polyamide: 3)
Effects of hydrolysis ageing on the dimensional stability and performance of short
glass-fibre reinforced Polyamide 66. Polym.Composites 2007:27:344-354.
18. Thomason JL and Ali JZ. The dimensional stability of glass-fibre reinforced
Polyamide 66 during hydrolysis conditioning. Composites Part A 2009;40:623-634.
20

19. Coakley TA, Rubadue JE, Forman CE, Schweizer RA. Non-discoloring glass strand
size. United States Patent 4,255,317 (1981)
20. Thomason JL, Adzima LJ. Sizing up the interface: an insider�s guide to the science
of science. Composites Part A 2001;32:313-321.
21. Cossement M, Masson N, Piret W. Size composition. United States Patent 5,236,982
(1993)
22. Masson N, Henrion JM, Thomason JL, Adzima LJ, Cheney TL, Piret W, Cossement
M. System for preparing glass fiber pellets having low discoloration. United States
Patent 6,365,272 (2002)
23. Cossement M, Henrion JM. Two-part sizing composition for reinforcement fibers
Patent United States Patent Application 20070154697 (2007)
24. Crank J, Park GS. (eds) Diffusion in Polymers, Academic Press, New York, 1968
25. Starink MJ, Starink LMP, Chambers AR. Moisture uptake in monolithic and
composite materials: edge correction for rectangularoid samples. J.Mater.Sci.
2002;37;287-294.
26. Valle´S-Lluch A, Camacho W, Ribes-Greus A, Karlsson S. Influence of Water on
the Viscoelastic Behavior of Recycled Nylon 6,6. J.Appl.Polym.Sci. 2002;85: 2211�
2218.
27. Brill R. J Prakt Chem 1942:161;49-64.
28. Murthy NS, Curran SA, Aharoni SM and Minor H. Premelting Crystalline
Relaxations and Phase Transitions in Nylon 6 and 6,6. Macromolecules
1991;24:3215-3220.
29. Xenopoulos A and Clark ES. Chapter 5 Nylon plastics handbook, Kohan MI, Editor
Hanser Gardener, Cincinnati (1995).
30. Starkweather HW and Jones GA. Crystalline transitions in powders of nylon 66
crystallized from solution. J.Polym.Sci. Polym.Phys.Ed. 81;19:467
21

31. Murthy NS, Akkapeddi MK, and Orts W. Analysis of Lamellar Structure in
Semicrystalline Polymers by Studying the Absorption of Water and Ethylene Glycol
in Nylons Using Small-Angle Neutron Scattering. Macromolecules 1998;1:142-152
32. Starkweather HW. Chapter 6 Nylon plastics handbook, Kohan MI, Editor Hanser
Gardener, Cincinnati (1995).
33. Klein N, Marom G, Pegoretti A and Migliaresi C. Determining the role of interfacial
transcrystallinity in composite materials by dynamic mechanical thermal analysis.
Composites 1995;26:707-712.
22
List of Figures
Figure 1 Weight gain of polymer, composites, and composite matrix versus conditioning
time at 70°C
Figure 2 Fitting of time dependent diffusion coefficient to weight gain data
Figure 3 Unnotched Charpy impact versus conditioning time at 70°C
Figure 4 Unnotched Charpy impact versus polymer/matrix weight increase
Figure 5 Volume change versus weight increase
Figure 6 DMA analysis DaM and GW saturated PA66
Figure 7 DMA tan δ curves for PA66 at different GW conditioning times
Figure 8 DMA tan δ trends for conditioned PA66
Figure 9 DMA storage modulus curves for PA66 at different GW conditioning times
Figure 10 DMA storage modulus trends for GW conditioned PA66
Figure 11 DMA Tan δ trends for conditioned GFPA66
Figure 12 DMA storage modulus trends for GW conditioned GFPA66
Figure 13 Relative modulus versus GW fluid absorption at different temperatures
Figure 14 Relative unnotched impact versus GW fluid absorption at different
temperatures
23
0
1
2
3
4
5
6
7
8
9
10
0 5 10 15 20Time (hours
1/2)
Ch
an
ge in
Ma
ss (
%)
System A
System B
Polymer
CompositeMatrix
70°C Data
Figure 1 Weight gain of polymer, composites, and composite matrix versus conditioning
time at 70°C
2
3
4
5
6
7
8
9
10
11
12
0
1
2
3
4
5
6
7
8
9
10
0 5 10 15 20
Dif
fusio
n C
oeff
icie
nt
x10
-12
Ch
an
ge in
Mass (
%)
Time (hours1/2)
PA66 absorption
Fitted Absorption from Deff
Deff
Figure 2 Fitting of time dependent diffusion coefficient to weight gain data
24

0
20
40
60
80
100
120
140
160
0 2 4 6 8 10 12 14 16 18 20
Time (hours1/2
)
Ch
arp
y U
nn
otc
he
d Im
pa
ct
(kJ
/m^
2)
System A
System B
Polymer
Figure 3 Unnotched Charpy impact versus conditioning time at 70°C
40
60
80
100
120
0 2 4 6 8
Ch
arp
y U
nn
otc
hed
Im
pact
(kJ/m
^2)
Polymer/Matrix Weight Increase (%)
10
System A
System B
Polymer
Figure 4 Unnotched Charpy impact versus polymer/matrix weight increase
25
0
2
4
6
8
0 2 4 6 8
Ch
an
ge in
Vo
lum
e (%
)
Change in Mass (%)
10
System A
System B
Polymer
Figure 5 Volume change versus weight increase
0.0
0.5
1.0
1.5
2.0
2.5
3.0
3.5
4.0
4.5
-100 -80 -60 -40 -20 0 20 40 60 80 100 120 140
Temperature (°C)
Sto
rag
e M
od
ulu
s E
' (G
Pa
)
0.01
0.02
0.03
0.04
0.05
0.06
0.07
0.08
0.09
0.1
Ta
n δ
E', DaM
E', 8.3% GWTanδ, 8.3% GW
Tanδ, DaM
Figure 6 DMA analysis DaM and GW saturated PA66
26

0.02
0.03
0.04
0.05
0.06
0.07
0.08
0.09
0.10
-100 -80 -60 -40 -20 0 20 40 60 80 100 120 140Temperature (°C)
Ta
n D
elt
a
0 hrs
2.8 hrs
11 hrs
26 hrs
46 hrs
68 hrs
305 hrs
DaM
1.7% GW
8.3% GW
4.4% GW
3.6% GW
2.8% GW
5.2% GW
Figure 7 DMA tan δ curves for PA66 at different GW conditioning times
0
10
20
30
40
50
60
70
0.00
0.02
0.04
0.06
0.08
0.10
0.12
0 2 4 6 8 10
Peak T
em
pera
ture
(°C
)
Pe
ak H
eig
ht (t
an
δ)
Weight Increase (%)
Ηα Η
Τα Τ
Figure 8 DMA Tan δ trends for GW conditioned PA66
27

0.0
0.5
1.0
1.5
2.0
2.5
3.0
3.5
4.0
4.5
-100 -80 -60 -40 -20 0 20 40 60 80 100 120 140
Temperature (°C)
Sto
rag
e M
od
ulu
s E
' (G
Pa
)
0 hrs
2.8 hrs
11 hrs
26 hrs
46 hrs
68 hrs
305 hrs
8.3% GW
5.2% GW
4.4% GW
3.6% GW
2.8% GW
DaM
1.7% GW
Figure 9 DMA storage modulus curves for PA66 at different GW conditioning times
0.5
1.0
1.5
2.0
2.5
3.0
3.5
4.0
4.5
0 2 4 6 8
Sto
rag
e M
od
ulu
s E
' (G
Pa)
Polymer Weight Increase (%)
10
-80°C 0°C
+23°C +50°C +80°C
Figure 10 DMA storage modulus trends for GW conditioned PA66
28

0
10
20
30
40
50
60
70
0.00
0.01
0.02
0.03
0.04
0.05
0.06
0.07
0 2 4 6 8 10
Peak T
em
pera
ture
(°C
)
Peak H
eig
ht (t
an
δ)
Matrix Weight Increase (%)
Figure 11 DMA Tan δ trends for conditioned GFPA66
0.0
2.0
4.0
6.0
8.0
10.0
12.0
0 2 4 6 8
Sto
rag
e M
od
ulu
s E
' (G
Pa)
Matrix Weight Increase (%)
10
-80°C
+23°C
+80°C
Figure 12 DMA storage modulus trends for GW conditioned GFPA66
29
0
20
40
60
80
100
120
0 5 10 15 20 25 30 35
Rela
tive M
od
ulu
s (%
)
Weight of Matrix Fluid Absorption (%)
120 A* 120 R 150 A*
70 A 70 R70°C Conditioning
(this work)
120°C Conditioning
(ref 12)
150°C Conditioning
(ref 12)
Figure 13 Relative modulus versus GW fluid absorption at different temperatures
0
20
40
60
80
100
120
140
160
0 5 10 15 20 25 30 35
Rela
tive U
nn
otc
hed
Im
pact
(%)
Weight of Matrix Fluid Absorption (%)
120 B* 120 A*
150 B* 150 A*
70 A 70 B
70°C Conditioning
(this work)
120°C Conditioning
(ref 12)
150°C Conditioning
(ref 12)
Figure 14 Relative unnotched impact versus GW fluid absorption at different
temperatures
30