the temperature dependence of the spectral and e†ciency ... · pdf filethe temperature...
TRANSCRIPT
The temperature dependence of the spectraland e�ciency behavior of Si solar cell under
low concentrated solar radiation
M.A. Mosalam Shaltouta,*, M.M. El-Nicklawyb, A.F. Hassanb,U.A. Rahomaa, M. Sabrya
aNational Research Institute of Astronomy and Geophysics, Helwan, Cairo, EgyptbPhysics Department, Faculty of Science, Helwan University, Helwan, Cairo, Egypt
Received 16 November 1999; accepted 25 November 1999
Abstract
Relative spectral response of monocrystalline silicon solar cell is measured at di�erent celltemperatures. At room temperature, the spectral response is found to have its maximumpeak in the infrared (IR) range (800±1100 nm). By increasing the cell temperature,
modi®cation in the shape of the spectral response is observed and a shift of the peaktowards the IR part of the spectrum is found. This behavior is of special importance thatthe temperature of highly illuminated thin ®lm coated solar cells will be elevated. Other cell
parameters as maximum power, ®ll factor, and cell e�ciency are also studied at ®veillumination levels, viz., 1154, 1329, 1740, 2812, and 4010 W/m2 and temperature rangingfrom ÿ3 to 908C. 7 2000 Elsevier Science Ltd. All rights reserved.
1. Introduction and theory
Photovoltaic cells illuminated with low concentrator systems around 5 suns
(about 4000 W/m2) ®nd increasing interest. This is because of the low cost of
static concentrators (parabolic, V-trough, etc.) which do not need any subsystem
0960-1481/00/$ - see front matter 7 2000 Elsevier Science Ltd. All rights reserved.
PII: S0960 -1481 (00)00075 -6
Renewable Energy 21 (2000) 445±458
www.elsevier.com/locate/renene
* Corresponding author. Tel.: +2-010-5156-443; fax: +2-02-556-8020.
E-mail address: [email protected] (M.A. Mosalam Shaltout).
(cooling and tracking subsystems) and thus, they are illuminated with di�use anddirect sun light [1]. They also give the possibility of using the one-sun solar cells.Cell temperatures inside these concentrators are about 20±308C above ambienttemperature, especially in hot desert areas [2,3]. Therefore, spectral and e�ciencyvariation with temperature must be studied well before attempting to use suchsystems.
Spectral responsivity systems measure how a device responds to selected narrow(spectral) bands of irradiance. Responsivity is reported in terms of quantume�ciency (QE) Ð a measure of how e�ciently a device converts incomingphotons to charge carriers in an external circuit.
Measurement of the wavelength dependence of the photocurrent Ð the spectralresponse of the solar cell, is a valuable tool for evaluating the material and devicecharacteristic of solar cells [4].
The main reason to measure the spectral response is to use it as a tool tounderstand the performance of the solar cell. For example, the red response isgoverned by the minority carrier lifetime in the base or pÿ-region. The blueresponse depends on the charge collection from the emitter or n+-region, which inturn depends upon the surface recombination velocity and junction depth. Byappropriate modeling and curve ®tting of the spectral response data, values of thevarious important cell parameters can be evaluated [5]. Previous studies [2]showed that using the polycrystalline type of solar cells in the V-troughconcentrator has less current gain in comparison with the amorphous type. This isbecause of the mismatch between the spectral re¯ectivity of the commercialmirrors that are coated with aluminum and the spectral response of thepolycrystalline solar cell, which is considered another proof of the importance ofthe solar cell's spectral response analysis.
The e�ciency of photovoltaic energy conversion is de®ned as the ratio of themaximum electrical power output to the incoming radiation. It essentially de®nesthe economy of converter systems.
Maximum electrical power output is achieved under optimum operatingconditions as [6]:
MPP � FF � Isc � Voc
where FF is the ®ll factor.The short circuit current Isc is directly proportional to the e�ective radiation
and can be expressed as:
Isc � q ��1v�Eg=h
pv �Qv dv
where q is the electronic charge, pv the spectral distribution function of incomingradiation and Qv the collection e�ciency of minority charge carriers.
The open circuit voltage Voc is related to Isc by
M.A. Mosalam Shaltout et al. / Renewable Energy 21 (2000) 445±458446
Vcc � A � k � Tq
� ln�Isc
Isp
� 1
�The e�ciency, therefore, can be expressed by
Z �FF � V1 � q �
�1v�Eg=h
Pv �Qv dv�1v�0
Pv dv
Therefore, the behavior of the spectral response of the cell allows a bettermodeling and calculation of the cell parameters and e�ciency.
In addition, spectral response measurements are equally important inperformance measurements and calibration. Spectral response data can be used todirectly compute the short circuit current of a solar cell by folding the spectralresponse with the solar irradiance, according to the preceding equation of Isc.
Also, the temperature is a parameter that has direct in¯uence on the cellperformance. Temperature coe�cients provide the change (derivative) of di�erentphotovoltaic performance parameters with respect to the temperature. Thecoe�cients can be determined for short circuit current (Isc), open circuit voltage(Voc), and maximum power point (Im, Vm), as well as ®ll factor (FF) ande�ciency �Z� [7].
2. Experimental setup and measurements
The experimental setup used, as shown in Fig. 1, consists of:
1. 1000 We halogen lamp to produce variable illumination up to about 15 kW/m2
over the cell under test.2. Cell temperature-controller with a large serpentine of brass connected to a
closed-path water circulator (Polyscience) to control the cell temperature fromÿ20 to 1208C.
3. 32 metallic interference ®lters (Karl±Zeiss) for spectral response (SR)measurements. These are narrow band ®lters from 350 to 1100 nm with spacingof 25 nm.
4. Data acquisition system (DAS) with word length 16 bit, connected to acomputer for fast I±V characteristic curve scan, and determination of cellparameters.
The measurements were carried out on a conventional square shaped Simonocrystalline solar cell of length 1.8 cm.
The incident irradiance measurement on the solar cell in both the spectralresponse measurements and the I±V measurements is done by a calibratedthermopile type pyrometer (Kipp and Zonen). This is characterized by its nearly
M.A. Mosalam Shaltout et al. / Renewable Energy 21 (2000) 445±458 447

constant spectral response (spectral selectivity =25% in the range 350±1500 nm),to make it a good and precise tool to measure the irradiance.
The temperature dependence of the relative spectral response of the solar cell ismeasured by placing it on a temperature-controlled mount, irradiating ituniformly from the monochromatic source, and measuring the short circuitcurrent, the open circuit voltage, and the irradiance at ®xed wavelength intervalsover the spectral range of interest. The cell temperature was ®xed at 5, 23, 45, 66and 838C, respectively. The power spectral response (not the maximum powerspectral response, as it is experimentally di�cult to calculate FF from the I±Vcurve at certain wavelength) is then calculated by multiplying the spectralresponses of short circuit current by the open circuit voltage spectral response.
The I±V curves were recorded for each cell temperature and various values ofthe illumination level, viz., 1154, 1329, 1740, 2812, and 4020 W/m2 by convertingthe current to voltage and simultaneously recording both cell voltage and cellcurrent-converted voltage through two channels in the DAS. The cell temperaturewas varied from ÿ3 to 908C.
Fig. 1. Experimental setup for SR measurement.
M.A. Mosalam Shaltout et al. / Renewable Energy 21 (2000) 445±458448
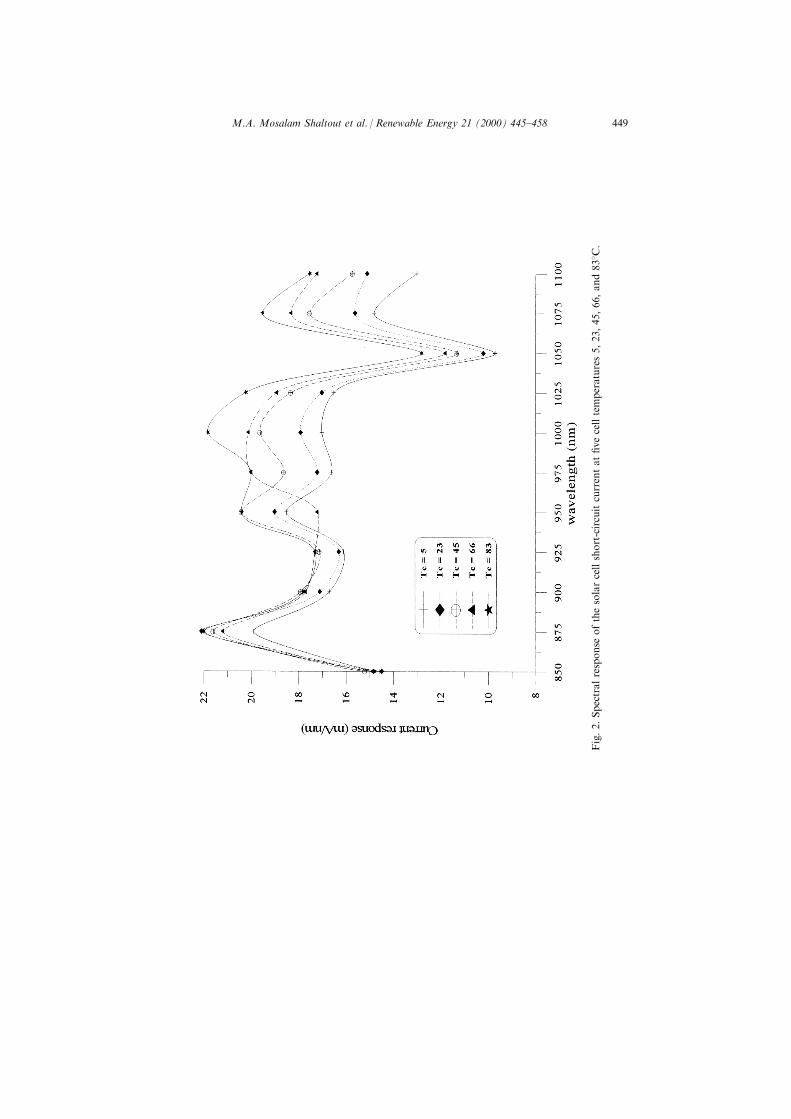
Fig.2.Spectralresponse
ofthesolarcellshort-circuitcurrentat®vecelltemperatures5,23,45,66,and838C
.
M.A. Mosalam Shaltout et al. / Renewable Energy 21 (2000) 445±458 449

3. Results and discussion
3.1. Spectral response measurements
Increasing the temperature of the cell modulates the spectral response of thesolar cell. This resembles the current response represented in Fig. 2; only theregion of interest of the spectrum is shown. A shift of the peak in the infrared(IR) range from l � 950 nm at temperature Tc = 58C to l � 1000 nm at Tc =838C is observed. This is because the elevation of the cell temperature makes theelectrons require less photon energy, causing a shift in the spectral responsetowards the longer wavelengths.
This shift is of considerable importance especially in case of optical coating ofthe cell surface, provided that the operating temperature of the uncoated cell isknown. Iterative procedures could be done in order to optimize the celltemperature with the actual transmitted spectrum.
The percentage of change of the current (or power) spectral response withtemperature relative to the spectral response at Tc = 58C is calculated bysubtracting the current (or power) spectral response at Tc = 58C from the current(or power) spectral response at this temperature, and then dividing the obtainedresult by the current (or power) spectral response at Tc = 58C.
Fig. 3. Percent of change of current spectral response.
M.A. Mosalam Shaltout et al. / Renewable Energy 21 (2000) 445±458450

Fig. 3 shows the percentage of change of the current response. At l � 875 nm,
the percentage of change is nearly equal for the three curves corresponding to the
three temperatures. Changes in relative spectral response increase towards the IR
part of the spectrum; it is about 17% at Tc = 238C, whereas it is about 35% at
Tc = 838C.Fig. 4 shows the percentage of change of the power spectral response, which is
the result of multiplying the short circuit current and the open circuit voltage
spectral responses at the measuring temperature, and then dividing by the power
spectral response of the cell at Tc = 58C. The ®gure shows an increase of the
percentage of change of the power spectral response with decreasing the
temperature.
All the three curves represented in this ®gure have negative values, except the
Fig. 4. Percent of change of power spectral response.
Table 1
Change of the short circuit current and the maximum power with the temperature at di�erent
illumination levels
1154 W/m2 1329 W/m2 1740 W/m2 2812 W/m2 4010 W/m2
dIsc/dTc 0.063 0.055 0.194 ÿ0.54 ÿ1.8d(m.p.)/dTc ÿ0.11 ÿ0.16 ÿ0.43 ÿ0.53 ÿ1.01
M.A. Mosalam Shaltout et al. / Renewable Energy 21 (2000) 445±458 451

curve for Tc = 238C at wavelength 875 nm, and also at the IR edge. Thisindicates that operating at cell temperature Tc = 238C for the wavelength 875 nmis optimum since its variation with the temperature is positive, a result that agreeswith [8].
3.2. Short circuit current and open circuit voltage
The experimental results show, as seen in Fig. 5, that the short circuit currentincreases slightly for low illumination levels as the back cell temperature increases.For high illumination levels, the short circuit current shows a drastic decreasewith increase in the temperature. This behavior is due to high temperature to ashort circuit current less dependent on the illumination level. This behavior is seenfor low illumination levels due to the increase in generation of electronhole pairsby thermal energy. In higher illumination levels like 2812 and 4010 W/m2, theillustrated behavior is due to the increase in the series resistance of the cell andcables. Table 1 shows the change of the short circuit current with the temperature�dIsc=dTc� at di�erent illumination levels. The obtained results are positive for the®rst three illumination levels and negative for the higher illumination levels.
Fig. 6 shows the variation of Isc by increasing the illumination levels with theback cell temperature as a parameter. It shows that at Tc = 08C, the increase is
Fig. 5. Variation of short-circuit current as a function of back cell temperature at di�erent
illuminations.
M.A. Mosalam Shaltout et al. / Renewable Energy 21 (2000) 445±458452

linear, whereas at Tc = 908C, saturation is seen due to the increase of the seriesresistance of the cell.
Fig. 7 shows the decrease of the open circuit voltage Voc for di�erentillumination levels with increasing the back cell temperature.
3.3. Maximum power (m.p.) and e�ciency
Fig. 8 show that the m.p. generally decreases linearly with the temperature ofthe cell at constant illumination. The change of the m.p. with respect to celltemperature is high for higher illumination levels.
From the ®gure, it can be seen that by using illumination of 4010 W/m2 at 908Ctemperature, electric gain will be about 8% relative to the illumination of 2812 W/m2 at the same temperature. This indicates that there is no need for highillumination levels when working in very hot climates.
Table 1 shows the change of m.p. with the temperature (d(m.p.)/dTc) atdi�erent illumination levels.
Maximum power variation with illumination levels at three temperature values0, 50, and 908C is shown in Fig. 9. The solar cell delivers about 150 mW at Tc =08C, about 95 mW at Tc = 508C, and about 55 mW at Tc = 908C. At 08C, themaximum power is increasing linearly with illumination; while at very high
Fig. 6. Variation of short-circuit current with increasing illumination at di�erent cell temperatures.
M.A. Mosalam Shaltout et al. / Renewable Energy 21 (2000) 445±458 453

Fig. 7. Variation of open circuit voltage with increasing illumination at di�erent cell temperatures.
Fig. 8. Cell's m.p. decrease with temperature at di�erent illumination levels.
M.A. Mosalam Shaltout et al. / Renewable Energy 21 (2000) 445±458454

Fig. 9. Maximum power variation of the cell with illumination levels at three cell temperatures.
Fig. 10. Variation of ®ll factor with cell temperature at di�erent illuminations.
M.A. Mosalam Shaltout et al. / Renewable Energy 21 (2000) 445±458 455

temperature (908C), saturation is shown with nearly no power gain after 4000 W/m2.
Fig. 10 shows the ®ll factor as a function of the back cell temperature atdi�erent illumination levels. It is high at low illumination level and back celltemperature and decreases by increasing both illumination and cell temperature.This can be attributed to the e�ect of the increase of the series resistance of thecell as the temperature and/or illumination increases.
Fig. 11 gives the variation of the cell e�ciency as a function of the back celltemperature. From the ®gure, it is evident that while its value decreases withincreasing the cell temperature, its slope increases with increasing the illuminationlevels leading to the crossing in the curves with low illumination levels. Thevariation of the cell e�ciency with increasing illumination levels for di�erent celltemperatures is shown in Fig. 12. At low cell temperatures such as Tc = 38C,maximum e�ciency lies around 1700 W/m2; whereas it lies around 1300 W/m2 forhigher cell temperatures.
4. Conclusion
Solar cell's spectral response is found to be temperature dependent. Changes ofthe relative spectral response are found in the IR part of the spectrum. It could be
Fig. 11. E�ciency behavior of the cell with its temperature at ®ve illumunations.
M.A. Mosalam Shaltout et al. / Renewable Energy 21 (2000) 445±458456

of special importance for thin ®lm coating researches, especially the response atwavelength 875 nm and cell temperature Tc = 238C at which the percentage ofchange of power spectral response is positive.
Also high illumination is applied on a one-sun Si solar cell, and its behavior istested. One-sun solar cells can be used in soft concentrators depending on thecell's temperature. At high temperatures, high illumination is of no use in the cellunless some type of cooling is used. At high temperature and illumination value,the cell has its lowest value of e�ciency. Therefore, the likely optimumconcentration ratio is around 4� or about 3000 W/m2.
Therefore, local modeling and test of each ®eld should be done in order todetermine the most appropriate illumination level and its accompanied celltemperature.
References
[1] Twidell JW, Weir AD. Renewable energy resources, E. & F.N. Spon Ltd., 1987. New Felter,
London EC4P 4EE.
[2] Mosalam Shaltout MA, Ghettas A, Sabry M. V-trough concentrator on photovoltaic full tracking
system at hot desert climate. Renewable Energy 1995;6:527±32.
[3] Mosalam Shaltout MA, El-Dessouki TA, Ghettas A, Sabry M. Solar concentrator on photovoltaic
Fig. 12. Cell e�ciency variation with increasing illumination at three temperatures.
M.A. Mosalam Shaltout et al. / Renewable Energy 21 (2000) 445±458 457

full tracking system at hot desert climate. Advances in Energy, Development and Environment
1994;1:415±20 Cairo, Egypt.
[4] Bell RO, Freedman GM. Minority carrier di�usion length from spectral response measurements.
In: Proceedings of the 13th IEEE PVSC. 1978. p. 89.
[5] Bell RO. Automated spectral response measurement and analysis of solar cells. In: Proceedings of
the 11th E. C. Photovoltaic Solar Energy Conference. 1992. p. 348.
[6] Beghi G, editor. Performance of solar energy converters: thermal collectors and photovoltaic cells,
1979. p. 147±62.
[7] King David L, Kratochvil Jay A, Boyson William E. Temperature coe�cients for PV modules and
arrays: measurements, di�culties, and results. In: 26th IEEE Photovoltaic Specialists Conference,
California. 1996.
[8] Mosalam Shaltout MM, Hassan AH. Solar cells radiospectroscopy measurements in the outdoor
conditions at Helwan, Egypt). In: ISECS '97, Egypt, vol. 2. 1997. p. 776±80.
M.A. Mosalam Shaltout et al. / Renewable Energy 21 (2000) 445±458458