the technion libraries · the technion libraries ... this work, in whole or in part, may not be...
TRANSCRIPT
ספריות הטכניוןThe Technion Libraries
בית הספר ללימודי מוסמכים ע"ש ארווין וג'ואן ג'ייקובס Irwin and Joan Jacobs Graduate School
©All rights reserved to the author
This work, in whole or in part, may not be copied (in any media), printed, translated, stored in a retrieval system, transmitted via the internet or
other electronic means, except for "fair use" of brief quotations for academic instruction, criticism, or research purposes only.
Commercial use of this material is completely prohibited.
©כל הזכויות שמורות למחבר/ת
אין להעתיק (במדיה כלשהי), להדפיס, לתרגם, לאחסן במאגר מידע, להפיץ באינטרנט, חיבור זה או כל חלק ממנו, למעט "שימוש הוגן" בקטעים קצרים מן החיבור למטרות לימוד, הוראה, ביקורת או
מחקר. שימוש מסחרי בחומר הכלול בחיבור זה אסור בהחלט.
© T
echn
ion
- Isr
ael I
nstit
ute
of T
echn
olog
y, E
lyac
har C
entra
l Lib
rary

Development of a quantitative approach for
Environmental Impact Assessment of a desalination
plan: Shavei-Zion case study
Research Thesis in Partial Fulfillment of the
Requirements for the Degree of
Master of Science in Environmental Engineering
Gili Noi Harpaz
Submitted to the Senate of
the Technion - Israel Institute of Technology
Tishrei, 5775 Haifa October 2014
© T
echn
ion
- Isr
ael I
nstit
ute
of T
echn
olog
y, E
lyac
har C
entra
l Lib
rary

The research was done under the supervision of Associate Prof. David Broday
and Associate Prof. Yohay Carmel in the Faculty of Civil and Environmental
Engineering.
The generous financial help of the Technion is gratefully acknowledged.
Acknowledgements
I sincerely want to thank Associate Prof. David Broday and Associate Prof. Yohay Carmel
for their guidance, support and non-obvious time devoted for this work.
The help and advice of my fellows at the Technion Ecology and Environment GIS Lab is
greatly appreciated.
I would like especially to thank my family- for their patience and support.
Last but not least- I would like to thank my husband Elad and my son Meiron for their
endless love and support at home that allowed me to center on this work.
© T
echn
ion
- Isr
ael I
nstit
ute
of T
echn
olog
y, E
lyac
har C
entra
l Lib
rary

Table of Contents
Abstract ................................................................................................................................. 1
Abbreviations ........................................................................................................................ 3
1.1 Desalination ..................................................................................................................... 4
1.1.1Desalination in Israel .......................................................................................... 5
1.2 Impact assessments ....................................................................................................... 8
1.2.1 Environmental Impact Assessment ................................................................... 8
1.2.2 Marine ecology impact assessment ................................................................... 9
1.2.3 Air pollution and health impact assessment .................................................... 12
1.2.4 Environmental Impact Statement .................................................................... 15
2. Research Objectives ....................................................................................................... 17
3. Study area ........................................................................................................................ 18
4. Marine ecology impact assessment ............................................................................... 20
4.1 Database ...................................................................................................................... 20
4.2 Marine ecology impact assessment method ................................................................ 23
4.2.1 Primary production .......................................................................................... 23
4.2.2 Decomposition ................................................................................................. 24
4.2.3 Species diversity .............................................................................................. 25
4.2.4 Statistical analyses ........................................................................................... 26
4.3 Marine ecology impact assessment results ................................................................. 27
4.3.1Primary production ........................................................................................... 27
4.3.2 Decomposition ................................................................................................. 28
4.3.3 Species diversity .............................................................................................. 29
4.4 Ecological impact assessment conclusion and discussion .......................................... 31
5. Air pollution and public health impact assessment ..................................................... 34
5.1 Air pollution and health database ............................................................................... 34
5.2 Air pollution and public health impact assessment methods ...................................... 34
5.2.1 Energy consumption and emissions ................................................................ 35
5.2.2 Ambient concentration: ................................................................................... 35
5.2.3 Impact assessment ........................................................................................... 37
© T
echn
ion
- Isr
ael I
nstit
ute
of T
echn
olog
y, E
lyac
har C
entra
l Lib
rary

5.2.4 Monetary valuation .......................................................................................... 38
5.3 Air pollution and public health impact assessment results ......................................... 39
5.3.1 National scale impact assessment ............................................................................ 39
5.3.1.1 Emissions ...................................................................................................... 39
5.3.1.2 Monetary value ............................................................................................. 40
5.3.2 Local scale impact assessment ................................................................................. 41
5.3.2.1 Emissions ...................................................................................................... 41
5.3.2.2 Ambient concentrations ................................................................................ 41
5.3.2.3 Impact assessment: Relative Risk (RR) and Impact Fraction (IF) ............... 44
5.3.2.4 DALY ........................................................................................................... 44
5.4 Air pollution and public health impact assessment discussion and conclusion .......... 45
6. Discussion and Conclusions ........................................................................................... 47
Appendix: Lists of species and taxes used for the statistical analysis ............................ 49
Reference List ..................................................................................................................... 59
© T
echn
ion
- Isr
ael I
nstit
ute
of T
echn
olog
y, E
lyac
har C
entra
l Lib
rary

List of Tables
Table 1. Sampling stations location in the marine environment near the brine discharge of
the Palmachim desalination plant………………………………………………………....22
Table 2. Primary production scale for degree of impact……………………………….....24
Table 3. Scale of the impact of decomposition changes on the marine environment…….25
Table 4. Scale used for the degree of impact based on species diversity…………………26
Table 5. Jaccard values of for all stations and years relative to 2004 baseline…………...30
Table 6. External cost prices due to industry, electricity production and transportation
updated for 2014…………………………………………………………………………..40
Table A1. List of species and organisms number collected in September 2004………….49
Table A2. List of species and organisms number collected in September 2008………….51
Table A3. List of species and organisms number collected in September 2009…………..53
Table A4. List of species and organisms number collected in September 2010…………..55
Table A5. List of species and organisms number collected in September 2011…………..57
© T
echn
ion
- Isr
ael I
nstit
ute
of T
echn
olog
y, E
lyac
har C
entra
l Lib
rary

List of Figures
Figure 1.Top 10 countries by total installed desalination capacity as of 2003…………..4
Figure 2.The function of RO Membrane…………………………………………............5
Figure 3. Simple diagram of a desalination plant from the seawater feeding to the clean
water and brine discharge…………………………………………………………………6
Figure 4. Leopold matrix………………………………………………………………...11
Figure 5. Expected ecological impacts of two alternatives and the "ecological Dow Jones
index" according to "Impact-Amoeba" approach………………………………………...12
Figure 6.Conceptual scheme of the Impact Pathway Approach………………………....14
Figure 7.Plannedlocation of the Western Galilee desalination plant at Shavei Zion…....18
Figure 8. Study area………………………………………………………………...……19
Figure 9. Marine environment study area………………………………………………..19
Figure 10.Bathymetric map of the continental terrace of Israel........................................20
Figure 11.Palmachim desalination plant…………………………………………...…….21
Figure 12.Location of the VM1-VM4, VM6 and VM9 Palmachim marine monitoring
stations…………………………………………………………………………………....22
Figure 13. Differences of Chlorophyll-a concentrations on the sea surface and in deep
water…………………………………………………………………………………...….28
Figure 14.Differences of organic carbon (wt %) in the sediment layer………………….29
Figure 15.Species richness at all stations………………………………………………...30
Figure 16.Jaccard index values for all stations and time intervals……………………….31
Figure 17. The research methodology for air pollution and public health impact assessment
according to IPA approach………………………………………………………………..35
Figure 18. Windrose for the Shavei Zion study area based on the Israel Meteorological
Service data from1/1/2010-1/12/2013…………………………………………………….43
Figure 19. Estimated ambient PM2. 5concentrations in Nahariya and Akko during the day
according to the sensitivity analysis………………………………………………………43
© T
echn
ion
- Isr
ael I
nstit
ute
of T
echn
olog
y, E
lyac
har C
entra
l Lib
rary

1
Abstract
Desalination is a technology that involves several processes that remove salts and minerals
from the water and produce potable drinking water. The total annual production of
desalinated water in Israel increases constantly. Seawater desalination plant is planned to
be constructed at the Western Galilee in 2018, near Shavei-Zion. By the year 2020, the
plant is expected to increase its water supply, so it may require the construction of a small
power plant on-site. Desalination plants are, in most cases, associated with high energy
consumption, potential damage to marine life as a result of brine discharge to the marine
environment, and use of land along the coast.
An Environmental Impact Assessment (EIA) is a procedure conducted in order to
evaluate potential effects that are likely to arise as a result of a major project or action.
Different methods for EIA are applied for different projects. Yet, in general, the methods
applied today have several disadvantages. First, current EIA methods are mainly qualitative
rather than quantitative, creating an assessment which is based on qualitative rather than
quantitative data. Second, decision makers often lack the necessary knowledge required to
achieve the best environmental decision, since they are exposed to unclear indices and
inconclusive information. Presenting the EIA results in a quantitative way could help
dealing with the problem.
The main goal of this work is to develop a new and better method for assessing the
impacts of desalination plants on the environment. This research will focus on the two
major environmental effects of desalination activities: air pollution and brine discharge to
the marine environment. The marine ecology impact assessment method is based on three
main ecosystem parameters: primary production, species diversity and decomposition. For
each parameter a degree of impact scale was designed. The estimation of the cost resulted
from the effect on air pollution and public health in this work followed a fixed pathway
adopted from the European Commission project, the ExternE project, and was improved,
using the Impact Pathway Approach (IPA), to enable applying it in other areas. The method
is illustrated for assessing the impact of on-site and off-site power production for the
desalination plant, and accounts for either local or national air pollution related health
effects. We demonstrated the method for estimating the effects of PM2.5 emissions due to
the facility power requirements and cardiopulmonary mortality in Nahariya and Akko.
The results of the above methods were demonstrated for the proposed Shavei Zion
desalination plant. We found that the degree of ecological impact on the three parameters
© T
echn
ion
- Isr
ael I
nstit
ute
of T
echn
olog
y, E
lyac
har C
entra
l Lib
rary
2
that were studied is expected to be minimal based on Palmachim desalination plant
monitoring data. Regarding air pollution and public health impact assessment, at the
national scale, describing all health outcome resulted from the increased PM2.5
concentration (with health related monetary value of 1,896,800 NIS), and the local scale,
describing mortality from cardiopulmonary diseases in Akko and Nahariya in people older
than 45 as a result of increased PM2.5 concentration (with health related monetary values
in the range of 74,500-1,585,500 NIS).
Since there are no concrete construction plans for the Shavei-Zion desalination
plant at this point, the expected accuracy of the current impact assessment is not high.
Nevertheless, important concepts were set on the way for EIA to gain more popularity and
possibly broaden their use.
The research did not suggest an integration between these two assessments. Two possible
paths for integration are suggested, and the idea of examine the benefits and weaknesses of
the integration in every impact assessment study.
© T
echn
ion
- Isr
ael I
nstit
ute
of T
echn
olog
y, E
lyac
har C
entra
l Lib
rary
3
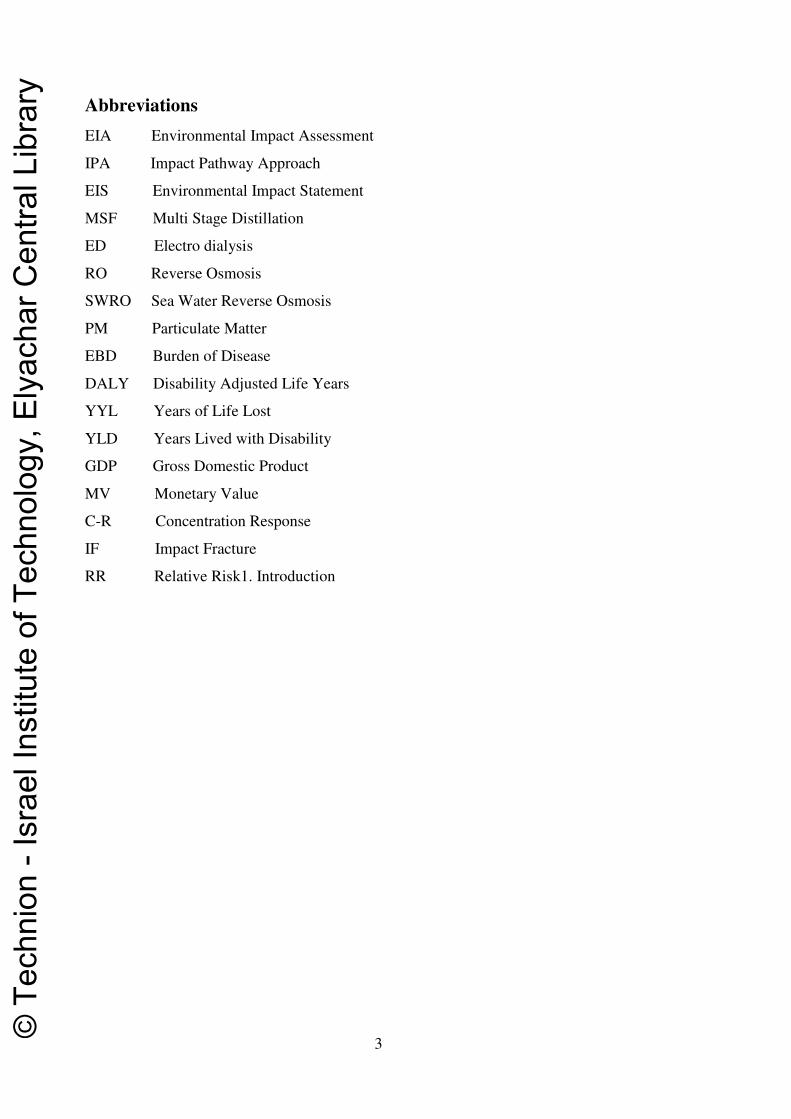
Abbreviations
EIA Environmental Impact Assessment
IPA Impact Pathway Approach
EIS Environmental Impact Statement
MSF Multi Stage Distillation
ED Electro dialysis
RO Reverse Osmosis
SWRO Sea Water Reverse Osmosis
PM Particulate Matter
EBD Burden of Disease
DALY Disability Adjusted Life Years
YYL Years of Life Lost
YLD Years Lived with Disability
GDP Gross Domestic Product
MV Monetary Value
C-R Concentration Response
IF Impact Fracture
RR Relative Risk1. Introduction
© T
echn
ion
- Isr
ael I
nstit
ute
of T
echn
olog
y, E
lyac
har C
entra
l Lib
rary
4
1.1 Desalination
Many areas worldwide suffer from water shortage, in particular semi-arid and arid regions.
The water shortage results from droughts as well as from growing water demand and
population growth. One of the popular technological solutions is desalination. Desalination
is a technology that involves several processes that remove salts and minerals from the
water and produce potable drinking water (Danoun, 2007). Desalination of sea and brackish
water is very common around the world. According to the International Desalination
Association (2013), the "hot spots" of desalination are the Arabian Gulf, the Mediterranean
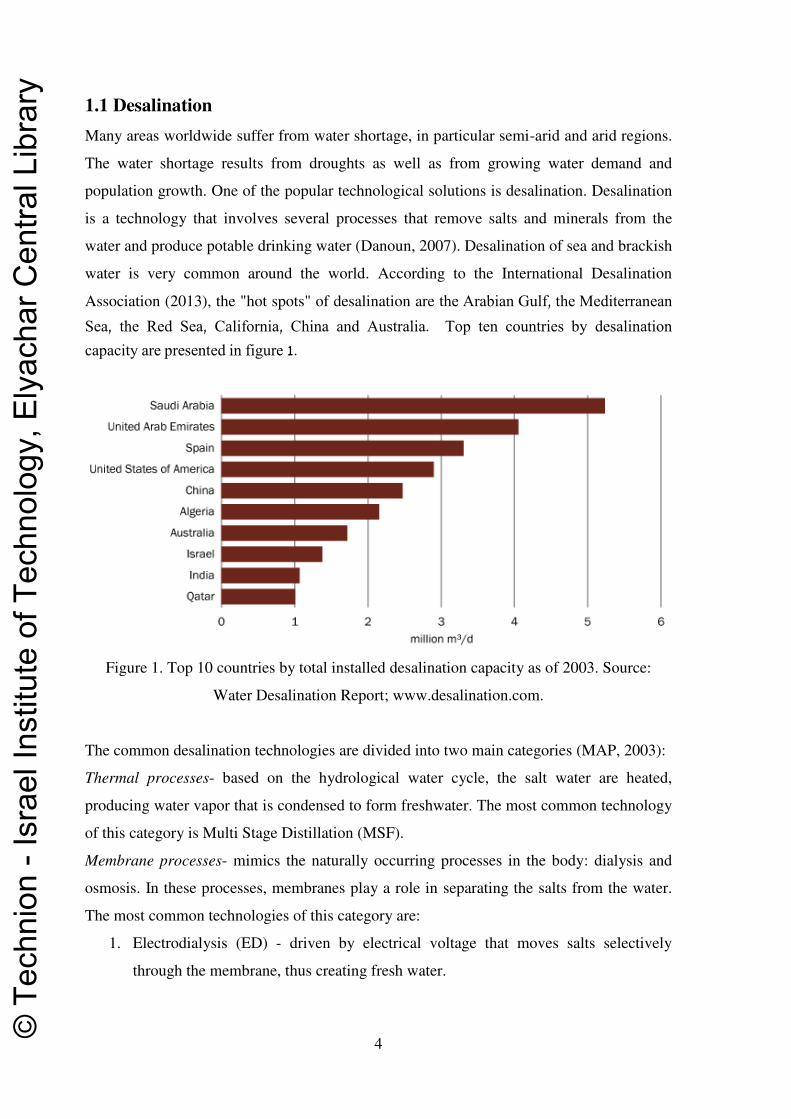
Sea, the Red Sea, California, China and Australia. Top ten countries by desalination
capacity are presented in figure 1.
Figure 1. Top 10 countries by total installed desalination capacity as of 2003. Source:
Water Desalination Report; www.desalination.com.
The common desalination technologies are divided into two main categories (MAP, 2003):
Thermal processes- based on the hydrological water cycle, the salt water are heated,
producing water vapor that is condensed to form freshwater. The most common technology
of this category is Multi Stage Distillation (MSF).
Membrane processes- mimics the naturally occurring processes in the body: dialysis and
osmosis. In these processes, membranes play a role in separating the salts from the water.
The most common technologies of this category are:
1. Electrodialysis (ED) - driven by electrical voltage that moves salts selectively
through the membrane, thus creating fresh water.
© T
echn
ion
- Isr
ael I
nstit
ute
of T
echn
olog
y, E
lyac
har C
entra
l Lib
rary

5
2. Reverse osmosis (RO) - separation of water from solutes (the dissolved material) by
pressurizing the solution as it flows through the membrane. The pressure is used to
overcome the osmotic pressure. The RO mechanism is described at figure 2.
Other common desalination technologies are freezing processes, membrane distillation and
solar humidification.
Figure 2.The function of RO Membrane (Mediterranean Action Plan, 2003).
1.1.1Desalination in Israel
Over the past decades, several multi-year droughts, as well as an increase in water
consumption and population growth, have created water shortage in Israel. As a result of
this shortage, water managers and policy makers decided to develop a large-scale
desalination projects in Israel. A series of government decisions have set the requirement
for desalination of seawater as part of the national water balance. According to the current
national planning program for desalination (TAMA 34 / B / 2 / 2), the total annual
production of desalinated water will reach 1.75 billion cubic meters (BCM/year) by 2040,in
order to meet the predicted 2.7 BCM/year water consumption requirement (Tenne, 2012).
Currently, there are four seawater desalination plants along the Israeli shoreline in
Ashkelon, Palmachim, Hadera, and Soreq, producing 500 MCM/year altogether. Another
plant, in Ashdod, is expected to start producing another 100 MCM/year of desalinated
water in 2014. These plants are all operated with Sea Water Reverse Osmosis (SWRO)
technology (Water Authority, 2013). As part of the national planning program for
desalination (TAMA 34 / B / 2 / 3), another seawater desalination plant is planned at the
Western Galilee, near Shavei-Zion. This plant (to be built in 2018) is planned to provide 50
MCM/year for water to the growing population of Haifa and the Western Galilee area. By
© T
echn
ion
- Isr
ael I
nstit
ute
of T
echn
olog
y, E
lyac
har C
entra
l Lib
rary

6
the year 2020, the plant is expected to increase its water supply to 100 MCM/year (Water
Authority, 2013). At this time, the Shavei-Zion desalination plant may require the
construction of a small on-site power plant (TAMA 34 / B / 2 / 3).
Desalination plants are, in most cases, associated with three major environmental
effects (Höpner and Windelberg, 1997;Lattemann and Höpner, 2008;Christie and
Bonnélye, 2009; Einav et al., 2003;Einav and Lokiec, 2003;Becker et al., 2012):
1. High energy consumption that leads to air pollution and greenhouse gas emissions -
3.75 kWh of electricity is required to produce 1 m3 of desalinated water (Semiat,
2008). When this energy demand is multiplied by the current 500 MCM/year
desalinated water production the total electricity requirement amounts to
1,875GWh, about 20% of the annual electricity consumption of the industrial sector
in Israel in 2011 (The Israel Electric Corp., 2013). This high electricity demand
results in increased air pollutant emissions (SO2, NOX, PM, CO, CO2, etc.). The
possible deterioration of air quality as a result of these emissions may have
numerous effects, including global warming, damage to crops and buildings, acidity
and eutrophication, morbidity and mortality (Europian Commission, 2003).
2. Potential damage to marine life as a result of brine discharge to the marine
environment. The effluent of a SWRO desalination plant is characterized by high
loads of suspended solids that contain biological, mineral and organic matter, high
salt concentration (generally 1.3-2.5 times higher than seawater; UNEP/MED,
2002; Mauguin and Corsin, 2005), an acidic pH (about 5.5 – the normal seawater
pH is close to 8; Mauguin and Corsin, 2005), and chemicals (i.e., coagulants, anti
scalants, pH adjustors) (Kress & Galil, 2008).
Figure 3. Simple diagram of a desalination plant from the seawater feeding to the clean
water and brine discharge (Danoun, 2007).
© T
echn
ion
- Isr
ael I
nstit
ute
of T
echn
olog
y, E
lyac
har C
entra
l Lib
rary

7
Changes in salinity in the marine environment may influence (Neuparth et al.,
2002a):
Species development, propagation activity and individual growth
Survival of larval stages and shortening/lengthening of the generation period
Population density –increasing/decreasing the population growth period
Breeding of species and reproductive traits.
The effects of desalination plants’ brine discharge were examined by a number
of methods, including biological monitoring, laboratory experiments and field
experiments. Ruso et al.(2007) examined the effect of brine discharge over soft
bottom communities along the Alicante coast for a two-year period. Close to the
discharge, they found a substitution of up to 98% of a community that has been
characterized by the presence of Polychaeta, Crustacea and Mollusca by a
community that was characterized by nematodes. Sánchez-Lizaso et al. (2008)
examined the effects of hyper saline discharges on the sea grass P. oceanic and
found significant effects on the seagrass structure and vitality at salinities of 39.1
and 38.4 psu, respectively. According to Danoun (2007), changes in water salinity
can benefit certain organisms with high salinity tolerance, such as shellfish, but
have an adverse effect on other species with almost no salinity tolerance.
Whereas most work to these days focused on damage to marine life at the
species and the community levels (Dupavillon and Gillanders, 2009; Kress and
Galil, 2008; Neuparth et al., 2002; Raventos et al., 2006; Ruso et al.,
2007;Sandoval-Gil et al., 2012), some studies looked at the damage to the marine
environment at the ecosystem level (Brink et al., 1991; Latterman et al., 2008;
Halpern et al., 2012), referring to ecological parameters such as production and
decomposition.
3. Use of land along the coast - the Israel national plan from 2004 for establishing of
desalination plants (TAMA 34 / B / 2 / 2) set 8 sites along the Israeli coastline for
desalination plants. As the Israeli population and the demand for water is expected
to increase over the years, additional desalination plants will be required. The direct
consequence will be exploitation of the scarce coastal resources and preventing
public access to these resources(Becker et al., 2012).
© T
echn
ion
- Isr
ael I
nstit
ute
of T
echn
olog
y, E
lyac
har C
entra
l Lib
rary

8
Additional environmental effects are noise and impacts on the costal aquifer (Einav et al.,
2003). High pressure pumps and energy recovery systems produce a noise level over 90
dbs. Therefore, they must be located far from populated areas and equipped with
appropriate acoustic technology in order to reduce noise level to a minimum (5 dB above
background noise). Pipe leaking over permeable areas can cause a serious danger of salting
the aquifer waters. These salt water are pumped and used as part of the water consumption
and can contain poisonous substances that may cause a serious damage to human health
and the environment. To minimize the possible impact of such occurrences on aquifer
water, proper sealing techniques must be in use (Sadhwani et al., 2005).
1.2 Impact assessments
1.2.1 Environmental Impact Assessment
An Environmental Impact Assessment (EIA) is a procedure that is conducted in order to
evaluate potential effects that are likely to arise as a result of a major project or action. The
procedure is assigned to assist decision makers in considering certain strategies and action
plans involving a project or an action (Jay et al., 2007). The origin of the EIA as a
legislative procedure is in the National Environmental Policy Act (NEPA) in the United
States in 1969 (Canter, 1977). According to the Environmental Protection Agency (2014),
some projects must conduct an EIA while others may not. Projects that are obligated to do
EIA are those with a feasibility to damage the environment, such as construction of thermal
and nuclear power stations, extraction of petroleum and gas, and storage of chemical
products. Industrial plans, like desalination plants, may be required by the authorities to
conduct an EIA, based on their infrastructure, processes and material fluxes. Several EIAs
of desalination projects have been done to date (e.g. Hoepner, 1999; Sadhwani et al., 2005;
Danoun, 2007; Lattemann et al., 2008). Yet, it is generally agreed that the impact of
desalination plants on the environment still lacks fundamental principles that could make
the impact assessment easier to conduct and to communicate. In particular, Lattemann et al.
(2008) suggested ten basic steps for an EIA of desalination projects:
1. Screening and deciding if an EIA is required for the proposed project
2. Scoping to determine the EIA content and extent
3. Identifying administrative aspects that are relevant for the EIA of the project
4. Describing the processes and technical design of the project
5. Describing the environmental baseline of the project site
© T
echn
ion
- Isr
ael I
nstit
ute
of T
echn
olog
y, E
lyac
har C
entra
l Lib
rary
9
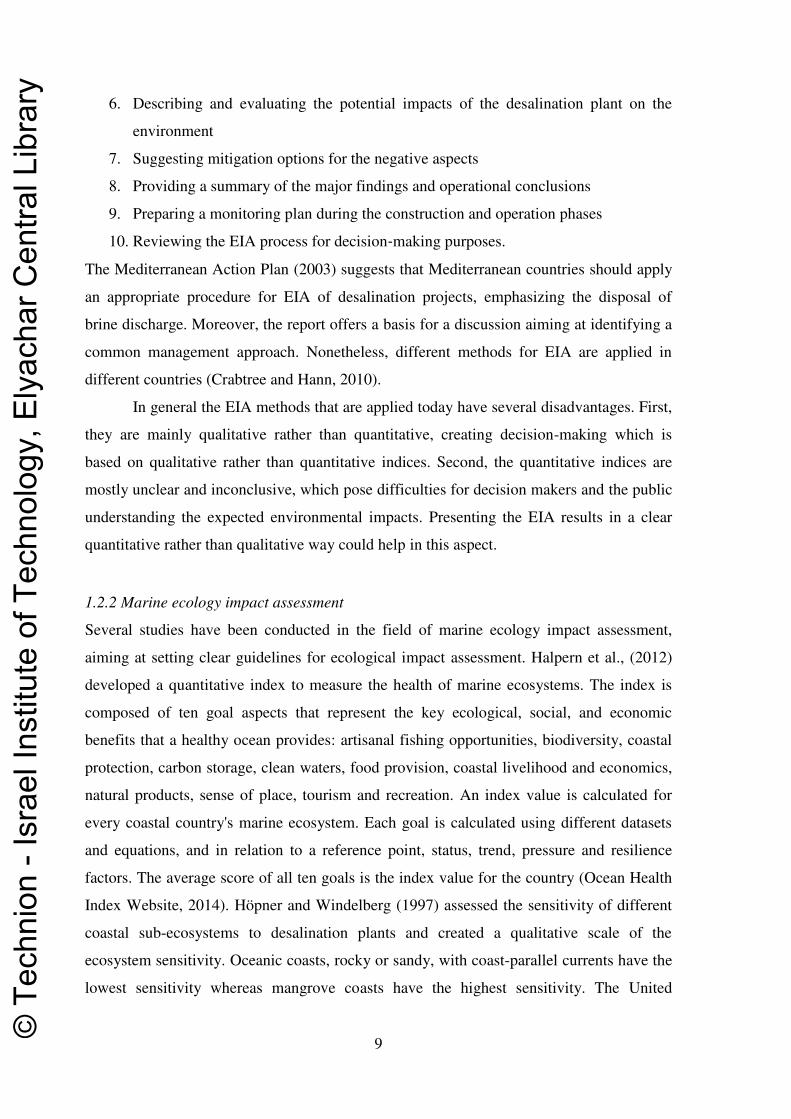
6. Describing and evaluating the potential impacts of the desalination plant on the
environment
7. Suggesting mitigation options for the negative aspects
8. Providing a summary of the major findings and operational conclusions
9. Preparing a monitoring plan during the construction and operation phases
10. Reviewing the EIA process for decision‐making purposes.
The Mediterranean Action Plan (2003) suggests that Mediterranean countries should apply
an appropriate procedure for EIA of desalination projects, emphasizing the disposal of
brine discharge. Moreover, the report offers a basis for a discussion aiming at identifying a
common management approach. Nonetheless, different methods for EIA are applied in
different countries (Crabtree and Hann, 2010).
In general the EIA methods that are applied today have several disadvantages. First,
they are mainly qualitative rather than quantitative, creating decision-making which is
based on qualitative rather than quantitative indices. Second, the quantitative indices are
mostly unclear and inconclusive, which pose difficulties for decision makers and the public
understanding the expected environmental impacts. Presenting the EIA results in a clear
quantitative rather than qualitative way could help in this aspect.
1.2.2 Marine ecology impact assessment
Several studies have been conducted in the field of marine ecology impact assessment,
aiming at setting clear guidelines for ecological impact assessment. Halpern et al., (2012)
developed a quantitative index to measure the health of marine ecosystems. The index is
composed of ten goal aspects that represent the key ecological, social, and economic
benefits that a healthy ocean provides: artisanal fishing opportunities, biodiversity, coastal
protection, carbon storage, clean waters, food provision, coastal livelihood and economics,
natural products, sense of place, tourism and recreation. An index value is calculated for
every coastal country's marine ecosystem. Each goal is calculated using different datasets
and equations, and in relation to a reference point, status, trend, pressure and resilience
factors. The average score of all ten goals is the index value for the country (Ocean Health
Index Website, 2014). Höpner and Windelberg (1997) assessed the sensitivity of different
coastal sub-ecosystems to desalination plants and created a qualitative scale of the
ecosystem sensitivity. Oceanic coasts, rocky or sandy, with coast-parallel currents have the
lowest sensitivity whereas mangrove coasts have the highest sensitivity. The United
© T
echn
ion
- Isr
ael I
nstit
ute
of T
echn
olog
y, E
lyac
har C
entra
l Lib
rary

10
Nations Environmental Programe (2002) created a similar qualitative matrix of adverse
environmental impacts associated with different desalination processes. Disinfectants and
eutrophication were categorized as high level impacts; thermal pollution, increased salinity,
heavy metals toxicity, air pollution and effect on sediment organisms were categorized as
middle level impacts; and pH increase and noise were categorized as low level impacts. All
the above methods could not be adopted for the purpose of this research, since they are
qualitative assessments of the marine ecosystems whereas this research focuses on
quantitative assessment.
Lattemann et al. (2008) used an alternative approach, the “ecological risk
assessment” approach, to identify and estimate relationships between stressors due to
anthropogenic activity (exposure analysis) and the resulting impacts on the receptors
(effects analysis). This approach is based on the analysis of how exposure to stressors
occurs and how significant are the associated impacts. The result is a list of stressor-
response relationships, also called cause‐effect relationships. It is typically summarized in a
risk matrix (also called preference or Leopold matrix), where the columns represent the
stressors and the rows represent the environmental receptors. The indexes for which rows
and columns intersect appear in Figure 4 with numbers that represent the importance and
the significance of the impact. The higher the number, the more important and significant is
the impact. A clear disadvantage of this approach is the possibility to obtain a matrix that
contains a lot of stressor-response relationships, which makes it difficult to analyze and
examined each relationship. Moreover, not all the relationships are relevant to all the
planning alternative, so there is a need to simplify each alternative matrix and examine the
relevance of its terms.
© T
echn
ion
- Isr
ael I
nstit
ute
of T
echn
olog
y, E
lyac
har C
entra
l Lib
rary

11
Figure 4. Leopold matrix. (Source: Leopold, 1971).
Brink et al. (1991) developed a quantitative method, AMOEBA-approach, for describing
and assessing ecological parameters of ecosystems. The method accounts for three
ecosystem categories: production and yield, species diversity and self-regulation, using
reference systems and target species. The reference systems are the same ecosystems in the
past or similar ecosystems. The target species must be expressed in terms of numbers,
distribution and health. The differences in target species are commonly discussed based on
a "radar diagram", with all the distances between the reference and the examined
ecosystems added together to a measure called the "ecological Dow Jones index". No
distinction is made between the values of different species. Clearly, the smaller the distance
from the reference system, the better is the ecosystem condition. The current research used
some characteristics of the AMOEBA-approach and improved them by producing a more
accurate assessment in terms of numbers instead of distances.
© T
echn
ion
- Isr
ael I
nstit
ute
of T
echn
olog
y, E
lyac
har C
entra
l Lib
rary

12
Figure 5. Expected ecological impacts of two alternatives and the "ecological Dow Jones
index" according to "Impact-Amoeba" approach (Brink et al., 1991). The smaller the
distance from the reference system, the better is the ecosystem condition
1.2.3 Air pollution and health impact assessment
Impact assessment of air pollution and its effect on human health can be evaluated by
several different ways. Ostro (2004) presented a method for assessing the Environmental
Burden of Disease (EBD) due to exposure to ambient air pollution as part of 26 risk factors
analyzed in the World Health Report (WHO, 2002). The pollutants examined were airborne
particulate matter (PM), particles with a diameter less than 10 micrometers (PM10) and
particles with a diameter less than 2.5 micrometers (PM2.5). Particulate pollutants pose a
© T
echn
ion
- Isr
ael I
nstit
ute
of T
echn
olog
y, E
lyac
har C
entra
l Lib
rary
13
serious health risk, since they can be inhaled and accumulate in the respiratory system (U.S
Environmental Protection Agency, 2014). The health outcomes examined in the WHO
report were mortality and morbidity as a result of respiratory and cardiovascular disease as
well as lung cancer. The associations between these parameters were calculated using
concentration-response functions that were derived from the epidemiological literature on
long-term and short-term exposures. The expected number of deaths due to air pollution
was calculated as the product of the population-wise incidence rates of the given health
effects times the relevant exposed population. For example, the Israel Ministry of
Environmental Protection (2003) estimated the health risks from exposure to PM, ozone
(O3), sulfur dioxide(SO2) and nitrogen dioxide (NO2) in the metropolitan areas of Tel Aviv
and Ashdod. The population exposure was based on ambient concentrations and the
concentration response functions were those used in North America. The results were
presented as the regional death and illness that was attributed to local air pollution
exposure.
An alternative approach was suggested by Prüss-Üstün et al. (2003), based on the
concept of disability-adjusted life year (DALY). This measure combines the number of
years of healthy life lost due to premature mortality and due to disability, and is calculated
using regional or national information about a certain risk factor or disease rates in the
population. The DALY value must be linked to the distribution of exposure and exposure
response relationships in order to get the final DALY value for a risk factor or a disease at
the regional or national level.
A different approach was promoted by the External Costs of Energy (ExternE)
project, which evaluated the impacts and external costs resulting from production and
consumption of energy related activities. The impacts analyzed within this project were
human health, building material, yield change of crops, global warming, amenity losses due
to noise exposure, and acidity and eutrophication as a result of releases to the environment
(Europian Commission, 2003; ExternE, 2014). The results are presented in terms of cost
(Euros) per impact parameter per country. The assessments were made using an impact
pathway approach. The impact pathway approach follows the pathway of pollutants from
source emissions to the increase in ambient concentration, to impact calculated based on
concentration response functions, and finally to a monetary value - the cost of a certain
impact (Ecosense Web, 2014).The project uses an integrated software online tool, the
Ecosense model (http://ecosenseweb.ier.uni-stuttgart.de/), for estimating and calculating
different pathway stages of different categories. Technical input data on emission sources © T
echn
ion
- Isr
ael I
nstit
ute
of T
echn
olog
y, E
lyac
har C
entra
l Lib
rary

14
in EU countries is entered and output data is obtained regarding the effects on human
health, crops, building materials, ecosystems and impacts on climate change. The
advantage of this tool is its simplicity, since it serves as a black box that hides the
complicated mathematical calculations from the user. However, a number of noticeable
disadvantages make this method useful only in specific cases. First, the Ecosense software
tool is tailored only to European Union countries. Second, since the models implemented
within the software are fixed, they cannot be tuned to other conditions in which its
estimates may be less accurate. Third, the software requires very specific input data to
obtain its estimates. In case not all the data are available, the tool cannot be used.
Figure 6. Conceptual scheme of the Impact Pathway Approach. (Source:
http://ecosenseweb.ier.uni-stuttgart.de/).
Based on the results of the ExternE project in Europe, Pareto (2008) estimated the external
costs of human health in Israel that result from production and consumption of energy. The
pollutants examined were PM10, SO2, NOX and CO2. The study used a fixed price per ton
emission for every pollutant, based on the prices suggested by the ExternE project. These
prices described the external costs related only to health impacts and did not accounted for
damages to crops, ecosystems and buildings (unlike the Extern project). On the other hand,
the method provides a relatively simple approach for assessing the impacts of desalination
plants, although at a low accuracy level, since the model does not account for
meteorological differences between European Union countries and Israel. Namely, the
adaptation to local (Israeli) conditions is done only by accounting for economic and
demographic differences between Israel and European countries.
© T
echn
ion
- Isr
ael I
nstit
ute
of T
echn
olog
y, E
lyac
har C
entra
l Lib
rary

15
An approach that provides monetary value for the impact of air pollution from a
facility was suggested by Sachs (2002), who suggested monetary value for a healthy life
year,
� = ∗ �� ∗ (1)
Namely, according to eq. (1) each healthy life year lost values about three times the annual
earnings, to account for the loss of annual earnings, leisure time and market consumption.
The poor longevity effect is also taken into account. Assuming that each year of life lost is
equal to per capita income, it is possible to multiply it by three and then divide it by the
country or region population, to get the percent of gross domestic value of the region or
country lost (the currency presented in the result will be the gross domestic value
currency). Hence, this approach can be used to estimate the monetary value of the impact of
exposure to air pollution both on a national scale (based on the national GDP) and on a
local scale (based on the regional/local GDP).
All above methods, except the ExternE and Sachs (2002), are quantitative
assessment methods that present a numerical value for the consequences of air pollution in
terms of health outcome incidences or years of life lost due to morbidity and mortality. A
monetary value for the air pollution impact can improve the above methods by presenting a
more effective (“easy to understand”) value for the air pollution costs that result from its
effects on human health. The ExternE project already presents the outcome in monetary
values but as we mentioned above, it is applicable only for European Union countries.
1.2.4 Environmental Impact Statement
An Environmental Impact Statement (EIS) is the legislative application of the
Environmental Impact Assessment, submitted to the authorities prior to a construction of a
new project or a development decision. The Environmental Impact Statement provides the
necessary information to the decision-makers for determining whether to approve a project,
change its environmental aspects, or find ways of mitigating its negative environmental
impacts (Israel Ministry of Environmental Protection, 2013). Environmental Impact
Statement provides a tool for discussing project alternatives and their environmental
effects, including the no action alternative (United Nations Environmental Protection
Agency, 2013). The environmental aspects described in the EIS involve land, water, air,
© T
echn
ion
- Isr
ael I
nstit
ute
of T
echn
olog
y, E
lyac
har C
entra
l Lib
rary

16
structures, living organisms, and other environmental aspects (Eccleston, 2000). The EIS
format is similar in
most countries and includes:
o Description of the project and of the current situation of the affected environment
o Description of the potential environmental impact
o Different location and design alternatives
o Means of mitigating negative impacts on all environmental aspects.
© T
echn
ion
- Isr
ael I
nstit
ute
of T
echn
olog
y, E
lyac
har C
entra
l Lib
rary
17
2. Research Objectives
The main goal of this work was to develop an improved method for assessing the impacts
of desalination plants on the environment. The research focused on the two major
environmental effects of desalination activities: air pollution and brine discharge to the
marine environment.
To achieve this goal, the following sub tasks were defined:
1. Developing a quantitative method of assessing the impacts of desalination plants on
air pollution, public health, and marine ecology.
2. Transforming these impacts (in particular air pollution and its effects on public
health) to monetary value.
3. Demonstrating the above concept for the planned desalination plant near Shavei
Zion.
In terms of public health, the research suggests possible alternatives regarding the local and
national impact of the proposed Shavei-Zion desalination plant and its power requirements,
and demonstrates the calculation of the estimated costs. Specifically, this research aims at
improving the methods currently used for assessing the negative impacts of desalination
plants on the environment and on human health by developing a quantitative approach that
includes monetary value considerations that can be used by decision makers to achieve
better policies. The proposed approach can be used in the future for quantitative impact
assessment of desalination plants in Israel.
© T
echn
ion
- Isr
ael I
nstit
ute
of T
echn
olog
y, E
lyac
har C
entra
l Lib
rary

18
3. Study area
The study area is a field in the Western Galilee, Israel, where the construction of a new
desalination plant is planned according to TAMA 34/B/2/2. The 100 dunam area is an
agricultural land close to Shavei-Zion rural community, and is proximate to the two main
western Galilee coastal towns of Nahariya ,about 5.5 km north to the proposed plant
location, and Akko, about 8 km south to the proposed plant location. Other small rural
communities are also situated nearby. The field is located 1.7 km away from the sea, close
to a main transportation route (road number 4). The population residing in the study area is
about 110,000. The study area is portrayed at figures 7 and 8. The marine study area is part
of the continental shelf of Israel and is portrayed at figures 9 and 10 (Bathymetric map of
the continental terrace of Israel).
The meteorological conditions along the Israeli shoreline are characterized by long
summer and winter and short spring and autumn. The main synoptic pattern in the summer
is a Persian trough. This synoptic pattern, together with the land and sea breeze cycle,
creates a daily cycle: southeasterly winds during the night that change gradually to westerly
winds during the day and evening and then change at once to easterly-southeasterly winds
in the late night. The winter is characterized by easterly winds that creates a dry weather,
and by lows from the north-west, which bring low temperatures and precipitation. The
spring and autumn are characterized by unstable meteorological conditions - sunny and dry
to cloudy and stormy (Haim, 2011).
Figure 7. Planned location of the Western Galilee desalination plant at Shavei Zion.
(Source: TAMA 34/B/2/2).
© T
echn
ion
- Isr
ael I
nstit
ute
of T
echn
olog
y, E
lyac
har C
entra
l Lib
rary

19
Figure 8. Study area. The blue triangle represent the area examined for the air pollution and
public health impact assessment.
Figure 9. Marine environment study area.
© T
echn
ion
- Isr
ael I
nstit
ute
of T
echn
olog
y, E
lyac
har C
entra
l Lib
rary
20
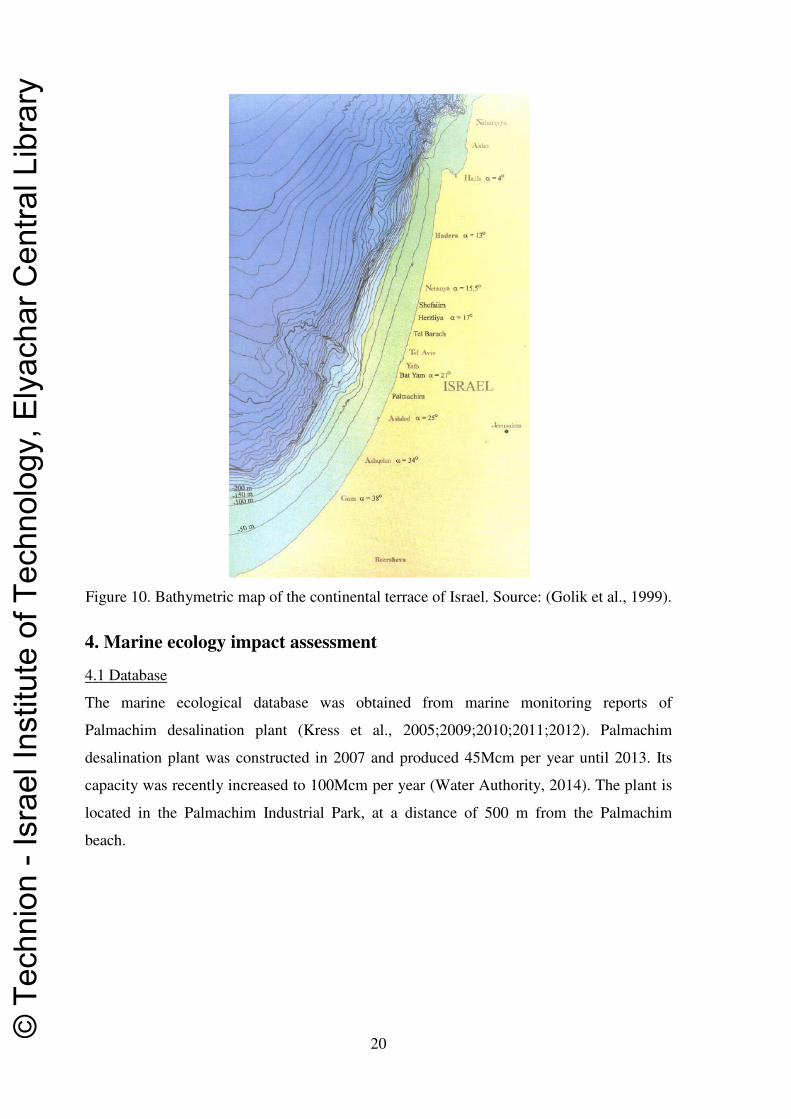
Figure 10. Bathymetric map of the continental terrace of Israel. Source: (Golik et al., 1999).
4. Marine ecology impact assessment
4.1 Database
The marine ecological database was obtained from marine monitoring reports of
Palmachim desalination plant (Kress et al., 2005;2009;2010;2011;2012). Palmachim
desalination plant was constructed in 2007 and produced 45Mcm per year until 2013. Its
capacity was recently increased to 100Mcm per year (Water Authority, 2014). The plant is
located in the Palmachim Industrial Park, at a distance of 500 m from the Palmachim
beach.
© T
echn
ion
- Isr
ael I
nstit
ute
of T
echn
olog
y, E
lyac
har C
entra
l Lib
rary
21
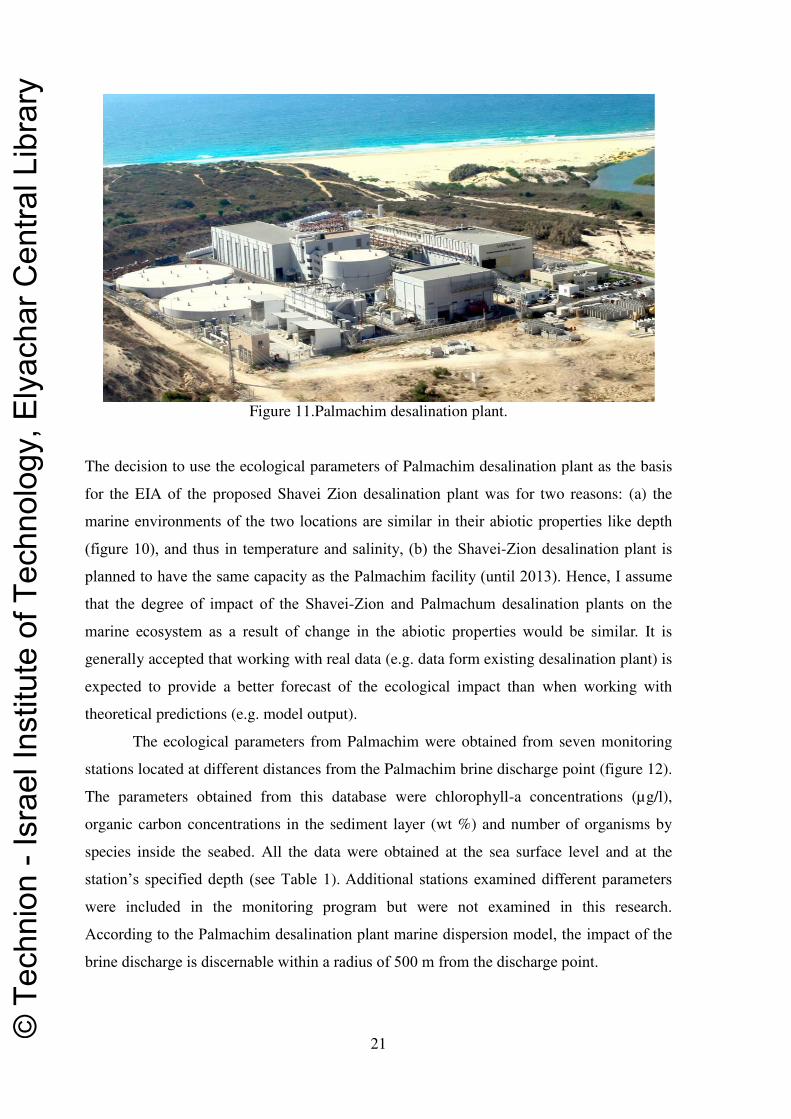
Figure 11.Palmachim desalination plant.
The decision to use the ecological parameters of Palmachim desalination plant as the basis
for the EIA of the proposed Shavei Zion desalination plant was for two reasons: (a) the
marine environments of the two locations are similar in their abiotic properties like depth
(figure 10), and thus in temperature and salinity, (b) the Shavei-Zion desalination plant is
planned to have the same capacity as the Palmachim facility (until 2013). Hence, I assume
that the degree of impact of the Shavei-Zion and Palmachum desalination plants on the
marine ecosystem as a result of change in the abiotic properties would be similar. It is
generally accepted that working with real data (e.g. data form existing desalination plant) is
expected to provide a better forecast of the ecological impact than when working with
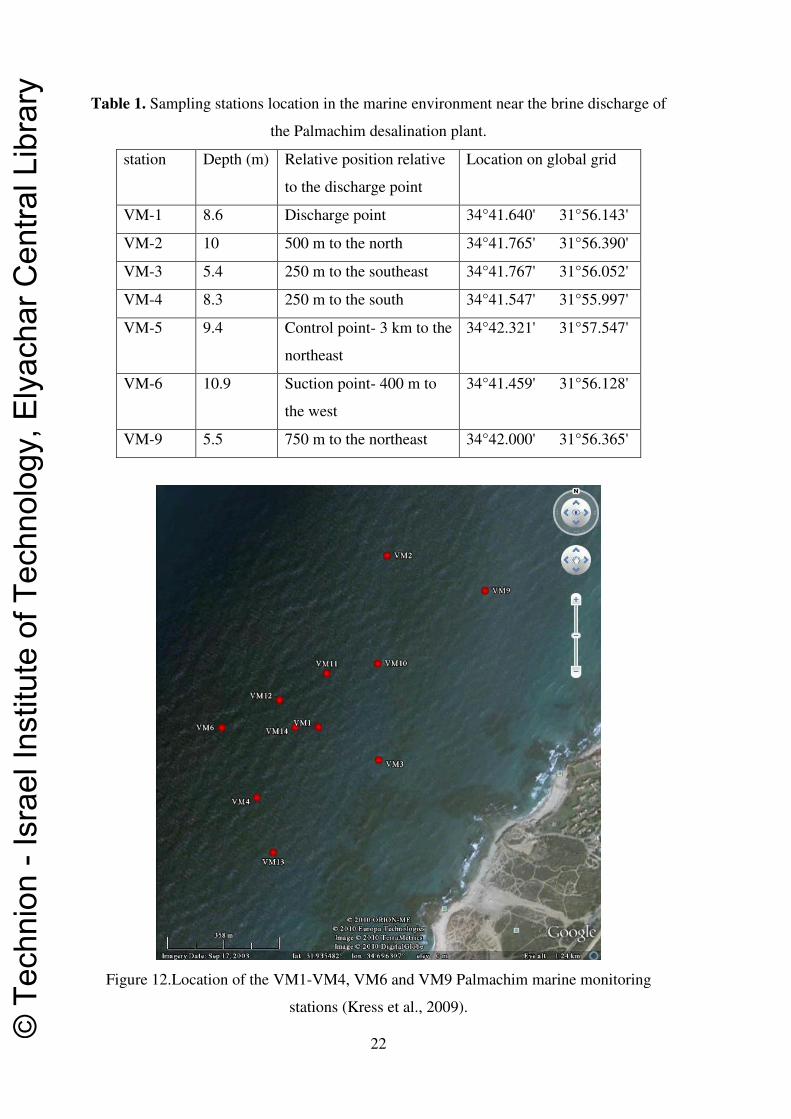
theoretical predictions (e.g. model output). The ecological parameters from Palmachim were obtained from seven monitoring
stations located at different distances from the Palmachim brine discharge point (figure 12).
The parameters obtained from this database were chlorophyll-a concentrations (µg/l),
organic carbon concentrations in the sediment layer (wt %) and number of organisms by
species inside the seabed. All the data were obtained at the sea surface level and at the
station’s specified depth (see Table 1). Additional stations examined different parameters
were included in the monitoring program but were not examined in this research.
According to the Palmachim desalination plant marine dispersion model, the impact of the
brine discharge is discernable within a radius of 500 m from the discharge point.
© T
echn
ion
- Isr
ael I
nstit
ute
of T
echn
olog
y, E
lyac
har C
entra
l Lib
rary
22
Table 1. Sampling stations location in the marine environment near the brine discharge of
the Palmachim desalination plant.
station Depth (m) Relative position relative
to the discharge point
Location on global grid
VM-1 8.6 Discharge point 34°41.640' 31°56.143'
VM-2 10 500 m to the north 34°41.765' 31°56.390'
VM-3 5.4 250 m to the southeast 34°41.767' 31°56.052'
VM-4 8.3 250 m to the south 34°41.547' 31°55.997'
VM-5 9.4 Control point- 3 km to the
northeast
34°42.321' 31°57.547'
VM-6 10.9 Suction point- 400 m to
the west
34°41.459' 31°56.128'
VM-9 5.5 750 m to the northeast 34°42.000' 31°56.365'
Figure 12.Location of the VM1-VM4, VM6 and VM9 Palmachim marine monitoring
stations (Kress et al., 2009).
© T
echn
ion
- Isr
ael I
nstit
ute
of T
echn
olog
y, E
lyac
har C
entra
l Lib
rary

23
4.2 Marine ecology impact assessment method
The current research presents a new methodology for marine ecology impact assessment
based on three main ecosystem parameters:
1. primary production,
2. Decomposition,
3. Species diversity.
These three parameters are good indicators of ecosystem function (Brink et al., 1991). I
assume that the degree of change in these three parameters reflects the impact of a given
project on the marine ecosystem as a whole. In order to carry out this method, data on all
three parameters are required before- and after the construction of the desalination plant.
4.2.1 Primary production
Primary production is the base level of the food web and slight changes to the system can
lead to significant impact on the ecosystem as a whole. Primary production impact
assessment is carried out using chlorophyll-a concentration data from the Palmachim
marine area before and after the construction of the Palmachim desalination plant in 2007.
The impact on primary production is defined as the change in the chlorophyll-a
concentration. In order to reveal these changes, the normalized difference of chlorophyll-a
concentrations was calculated: ℎ − ℎℎ (2)
Where Chl is the chlorophyll-a concentration, t0 is pre-construction, and t1 is post
construction of the desalination plant. The calculation was carried out for each of the
stations in two depths (layers) and for four years after the construction (2008, 2009, 2010,
and 2011) relative to data before the construction (2004) separately.
An increase and decrease in the primary production does not have a symmetric
effect. Thus, the scale for degree of impact was defined separately for an increase and
decrease in primary production. A decrease in primary production reflects a greater damage
to the marine environment than an increase since it reflects in lack of necessary energy for
the whole ecosystem. The levels were set arbitrarily.
© T
echn
ion
- Isr
ael I
nstit
ute
of T
echn
olog
y, E
lyac
har C
entra
l Lib
rary

24
Once the proportion difference is calculated, the largest change among all the stations and
time intervals was defined as the impact of the desalination plant on the primary
production. The degree of impact scale of primary production is presented in Table 2.
Table 2. Primary production scale for degree of impact.
An increase
in production
A decrease in
production
Impact level
up to 50% up to 5% 1-minimum impact
50%-200% 5%-20% 2- moderate impact
200%-500% 21%-50% 3- heavy impact
500%-1000% 51%-80% 4-severeimpact
>1000% 81%-100% 5- complete alteration of the ecosystem
4.2.2 Decomposition
Since decomposition is the final level of the food chain, and its products usually sink to the
sediment layer or drifted by marine currents, changes in decomposition are less significant
to the impact on the whole ecosystem than primary production and species diversity.
Moreover, whereas primary production reflects the recycle materials of the whole water
column, decomposition reflects the recycled materials of the sediment layer only.
Decomposition is examined using the weight percentage of organic carbon in the sediment
layer. As decomposition rate is changing, the amount of organic carbon inside the sediment
is changing at the opposite direction - an increase in organic carbon indicates a decrease in
biodegradation, and vice versa. The normalized difference is calculated for each station
before and after the construction of the desalination plant in 2007:
)4 ( −
where OC is the concentration of organic carbon in the sediment, t0 is pre-construction, and
t1 is post construction of the desalination plant. The calculation has been done separately
for the years 2008, 2009, 2010, and 2011 relative to 2004. The impact of decomposition is
defined as the change in organic carbon concentrations in the sediment layer. Unlike
primary production, where negative impact of the desalination plant on the environment is
represented as a lower value of the indices, a negative impact on decomposition is
represented by a higher value of the index, as a result of the opposite direction effect
© T
echn
ion
- Isr
ael I
nstit
ute
of T
echn
olog
y, E
lyac
har C
entra
l Lib
rary
25
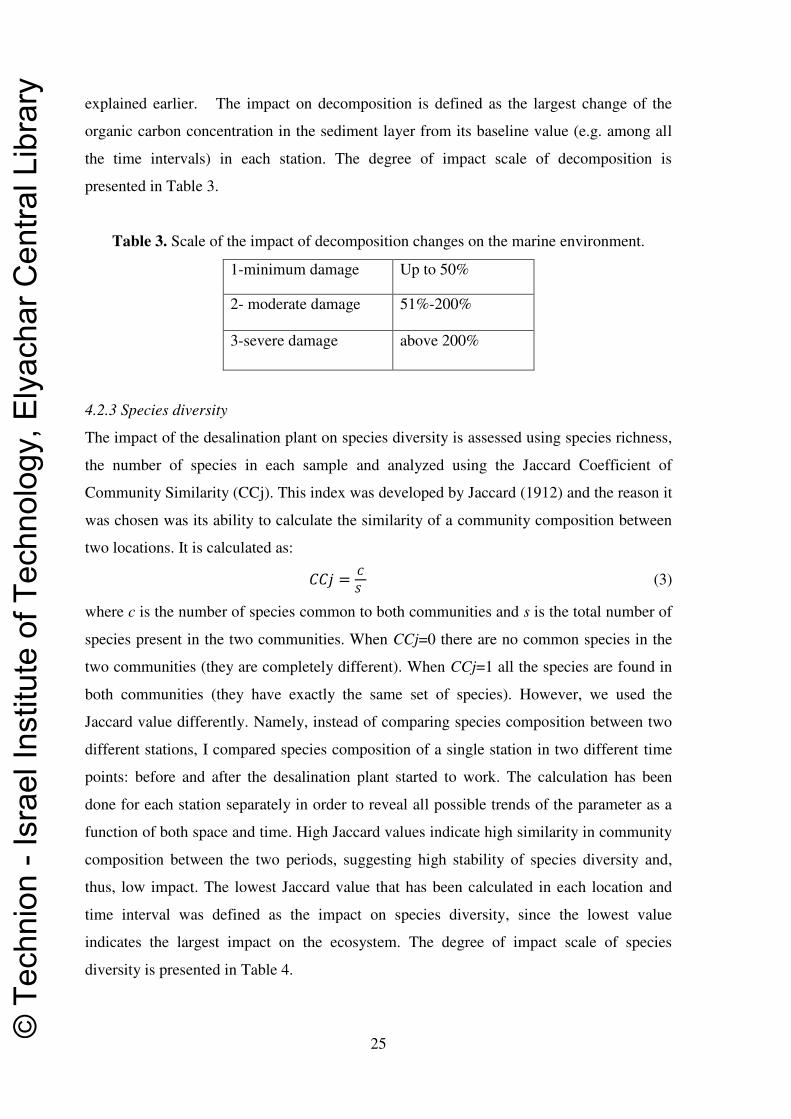
explained earlier. The impact on decomposition is defined as the largest change of the
organic carbon concentration in the sediment layer from its baseline value (e.g. among all
the time intervals) in each station. The degree of impact scale of decomposition is
presented in Table 3.
Table 3. Scale of the impact of decomposition changes on the marine environment.
Up to 50% 1-minimum damage
51%-200% 2- moderate damage
above 200% 3-severe damage
4.2.3 Species diversity
The impact of the desalination plant on species diversity is assessed using species richness,
the number of species in each sample and analyzed using the Jaccard Coefficient of
Community Similarity (CCj). This index was developed by Jaccard (1912) and the reason it
was chosen was its ability to calculate the similarity of a community composition between
two locations. It is calculated as: � = � (3)
where c is the number of species common to both communities and s is the total number of
species present in the two communities. When CCj=0 there are no common species in the
two communities (they are completely different). When CCj=1 all the species are found in
both communities (they have exactly the same set of species). However, we used the
Jaccard value differently. Namely, instead of comparing species composition between two
different stations, I compared species composition of a single station in two different time
points: before and after the desalination plant started to work. The calculation has been
done for each station separately in order to reveal all possible trends of the parameter as a
function of both space and time. High Jaccard values indicate high similarity in community
composition between the two periods, suggesting high stability of species diversity and,
thus, low impact. The lowest Jaccard value that has been calculated in each location and
time interval was defined as the impact on species diversity, since the lowest value
indicates the largest impact on the ecosystem. The degree of impact scale of species
diversity is presented in Table 4.
© T
echn
ion
- Isr
ael I
nstit
ute
of T
echn
olog
y, E
lyac
har C
entra
l Lib
rary

26
Table 4. Scale used for the degree of impact based on species diversity.
Impact level Jaccard value
1-minimumimpact 0.81-1
2- moderate impact 0.51-0.8
3- heavy impact 0.21-0.5
4-severe impact 0.05-0.2
5- complete alteration of the ecosystem 0-0.05
4.2.4 Statistical analyses
Naturally, biological parameters fluctuate over time (Groom et al., 2005; Becker et al.,
2011). Hence, small changes of these three parameters may be part of these fluctuations. In
order to separate these natural variations from the true impact of the desalination plant on
the ecosystems statistical testing is required. Ideally, we would like to have measurements
from the site for several years before constructing the desalination plant, in order to
characterize the natural fluctuation of these parameters. In this case, we only had a single
measurement before the construction (2004) and four measurements after the construction
(2008-11) for every stations However, we could still compare the fluctuations in parameter
values between stations located near discharge and stations located far from it. We used the
four different values obtained per station per index, representing the available data in the
four years after the construction of the desalination plant. We assumed that if the discharge
had a strong impact on the ecosystem, these parameters would show a stronger and
directional change in stations near the discharge, compared to stations further away. The
very small sample required using a non-parametric test for small samples - the Friedman
test. Friedman test can detect differences among treatments by comparing the average
values of multiple attempts of the same treatments. I used it to detect differences across
multi-year sampling for every station. The repeating attempts are the four values for each of
seven station at the years 2008-2011 (28 samples total). A sizeable impact is defined if the
differences between stations located nearby the discharge point and stations far from it are
statistically significant. According to the Palmachim desalination plant marine dispersion
model (personal communication with M. Sladkevich, August15, 2012), the impact of the
brine discharge is discernable within a radius of 500 m from the discharge point. We
therefore compared stations located less than 500 m from the discharge point (1, 3, 4, and
© T
echn
ion
- Isr
ael I
nstit
ute
of T
echn
olog
y, E
lyac
har C
entra
l Lib
rary
27
6) to stations located more than 500 m from it (2, 5, and 9). If the differences are not
statistically significant, then the impact of the desalination plant, as reflected by the
parameter examined, is defined as a minimum impact.
4.3 Marine ecology impact assessment results
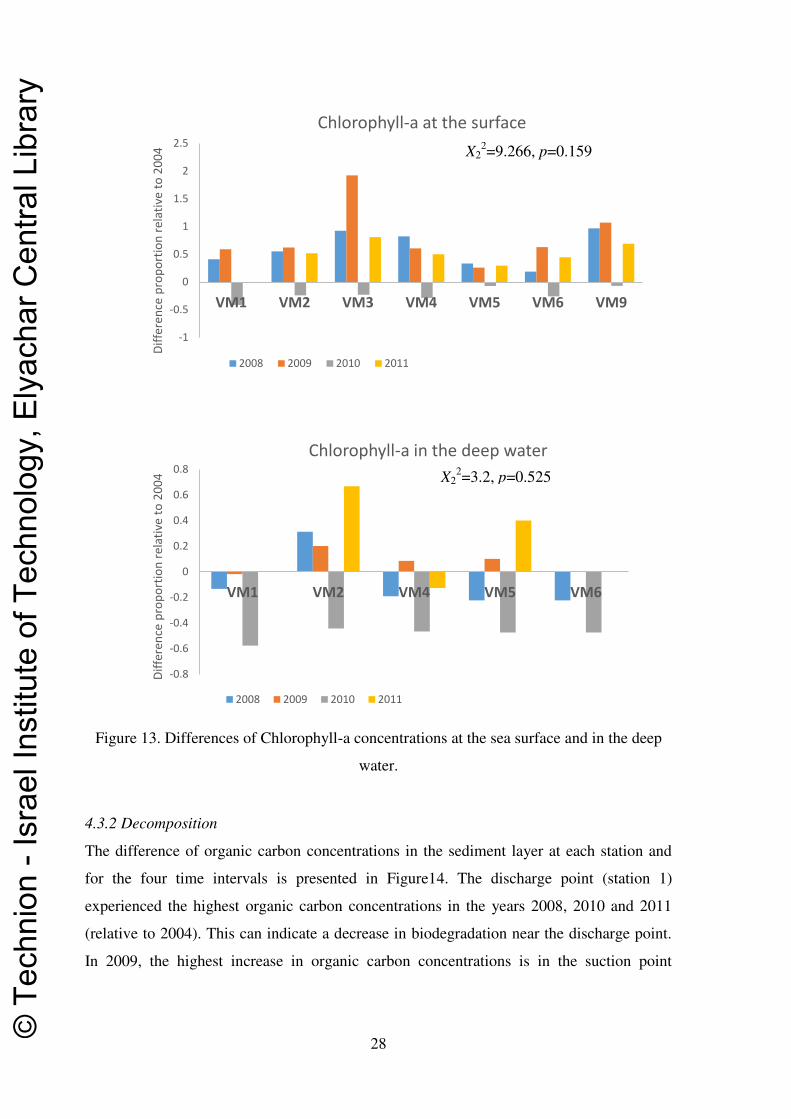
4.3.1Primary production
Changes in Chlorophyll-a in each of the marine monitoring stations (Table 1) in the four
years are presented in Figure 13. The differences of surface level Chlorophyll-a
concentrations in 2008, 2009 and 2011 relative to baseline (year 2004) at all the stations are
positive, which represents an increase in primary production. All stations in 2010 revealed
negative differences, meaning a decrease in primary production relative to baseline. Since
this decrease is apparent in only one year, it is more likely to assume that the cause of this
decrease is natural fluctuation of primary production rather than an anthropogenic impact
of the desalination plant.
The differences of Chlorophyll-a in the deep water is negative for all time intervals
in stations 1 and 6 (discharge and suction points, see Table 1). Moreover, in 2010 all the
stations showed negative differences. Stations 2, 4 and 5 (Table 1, Figure 13) show mixed
negative and positive differences in 2008, 2009 and 2011. Also, there is no apparent
difference between stations 1 and 6 (discharge and suction points, respectively) and all the
other stations in both the surface and the deep measurements. The largest decrease in
concentration of Chlorophyll-a (57.7%) was in station 1 (discharge point) at the deep
measurement point in the year 2010 (relative to baseline). The Friedman test did not reveal
statistical significance, meaning that no sampling site was significantly different across
time than other sampling sites, thus the hypothesis that sites near the discharge point would
be affected from the brine received no support. Hence, the impact of the Palmachim
desalination plant on primary production is considered to be minimal.
© T
echn
ion
- Isr
ael I
nstit
ute
of T
echn
olog
y, E
lyac
har C
entra
l Lib
rary
28
Figure 13. Differences of Chlorophyll-a concentrations at the sea surface and in the deep
water.
4.3.2 Decomposition
The difference of organic carbon concentrations in the sediment layer at each station and
for the four time intervals is presented in Figure14. The discharge point (station 1)
experienced the highest organic carbon concentrations in the years 2008, 2010 and 2011
(relative to 2004). This can indicate a decrease in biodegradation near the discharge point.
In 2009, the highest increase in organic carbon concentrations is in the suction point
-1
-0.5
0
0.5
1
1.5
2
2.5
VM1 VM2 VM3 VM4 VM5 VM6 VM9
Dif
fere
nce
pro
po
rtio
n r
ela
tive
to
20
04
Chlorophyll-a at the surface
2008 2009 2010 2011
-0.8
-0.6
-0.4
-0.2
0
0.2
0.4
0.6
0.8
VM1 VM2 VM4 VM5 VM6
Dif
fere
nce
pro
po
rtio
n r
ela
tive
to
20
04
Chlorophyll-a in the deep water
2008 2009 2010 2011
X22=3.2, p=0.525
X22=9.266, p=0.159
© T
echn
ion
- Isr
ael I
nstit
ute
of T
echn
olog
y, E
lyac
har C
entra
l Lib
rary

29
(station 6). The suction point has a potential for affecting decomposition in the sediment
layer, since the intake system is usually placed on the ocean floor.
Stations 1, 3 and 5 show consistent increase in the organic carbon in the sediment,
suggesting decrease in biodegradation. Stations 2, 4, 6 and 9 also show mostly increase in
the organic carbon concentrations. Yet, these stations could have been influenced by
natural processes that caused this mixed pattern (increase and decrease in organic
carbon/decomposition in the sediment).
Figure 14. Differences of organic carbon (wt %) in the sediment layer.
The highest increase in organic carbon (decrease in biodegradation) relative to 2004 is seen
in station 1 (the discharge point) in 2008. The Friedman test did not reveal statistical
significance for these results, hence decomposition changes as a result of the operation of
the Palmachim desalination plant are probably negligible and the impact of the plant seems
to be minimal.
4.3.3 Species diversity
Species richness at all stations and years examined are presented in Figure 15. All stations
were monitored during all years examined. Station or year without a value represents zero
species found. Species richness was relatively low in 2004 and 2008 in all stations, higher
in 2009 and 2010, and lower again in 2011. There is no apparent trend of differences
between stations 1 and 6 (discharge and suction points, respectively) and the other stations.
-0.45
-0.25
-0.05
0.15
0.35
0.55
0.75
0.95
1.15
1.35
VM1 VM2 VM3 VM4 VM5 VM6 VM9
Dif
fere
nce
pro
po
rtio
n r
ela
tive
to
20
04
Organic Carbon in the sediment
2008 2009 2010 2011
X22=8.123, p=0.229
© T
echn
ion
- Isr
ael I
nstit
ute
of T
echn
olog
y, E
lyac
har C
entra
l Lib
rary

30
Figure 15. Species richness at all stations. The location of the stations relative to the
discharge point is summarized in Table 1.
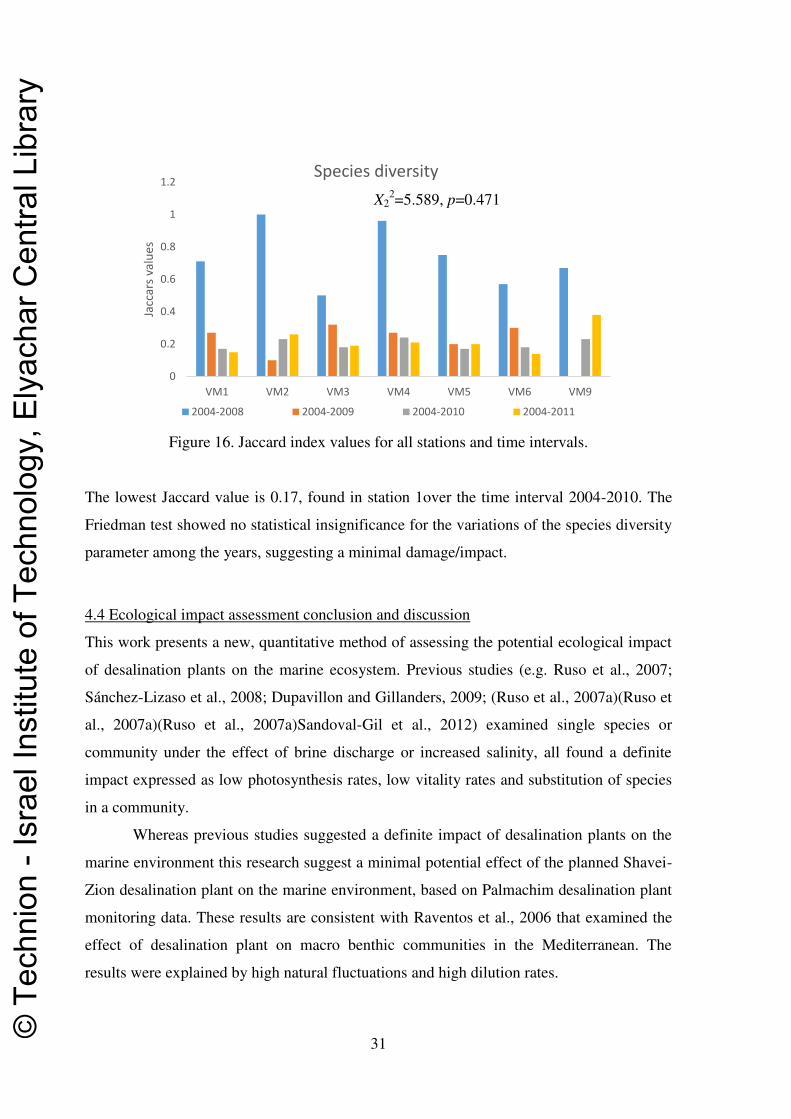
Jaccard indices were calculated for all stations and time intervals using presence-absence
data of fauna species in the Palmachim marine area. The taxa collected were Polychaeta )
( פ , Crustacea (ם ) and Mollusca ( כ כ ). The results are presented in Table 5.
High Jaccard values represent similarity of the fauna in the two years, thus stability of the
species diversity parameter in all the stations for all the time intervals was found.
The Jaccard values for 2008 are higher at all the stations than in the other years,
which may reflect decreasing influence on the fauna species as time passes. Station 1
(discharge point) and stations 3, 4 and 6 (see Table 1 and Figure 16) experienced consistent
decrease in the Jaccard values as the time pass from baseline. This can indicate a decrease
in the stability of species diversity as time passes, or a continual steady change in species
composition across time.
Table 5. Jaccard values of for all stations and years relative to 2004 baseline.
Station\year 2008 2009 2010 2011
1 0.71 0.27 0.17 0.15
2 1 0.1 0.23 0.26
3 0.5 0.32 0.18 0.19
4 1 0.27 0.24 0.21
5 0.75 0.2 0.17 0.2
6 0.57 0.3 0.18 0.14
9 0.67 0 0.23 0.38
0
2
4
6
8
10
12
14
16
18
20
VM1 VM2 VM3 VM4 VM6 VM9
Sp
eci
es
nu
mb
er
2004 2008 2009 2010 2011
Species richness
© T
echn
ion
- Isr
ael I
nstit
ute
of T
echn
olog
y, E
lyac
har C
entra
l Lib
rary
31
Figure 16. Jaccard index values for all stations and time intervals.
The lowest Jaccard value is 0.17, found in station 1over the time interval 2004-2010. The
Friedman test showed no statistical insignificance for the variations of the species diversity
parameter among the years, suggesting a minimal damage/impact.
4.4 Ecological impact assessment conclusion and discussion
This work presents a new, quantitative method of assessing the potential ecological impact
of desalination plants on the marine ecosystem. Previous studies (e.g. Ruso et al., 2007;
Sánchez-Lizaso et al., 2008; Dupavillon and Gillanders, 2009; (Ruso et al., 2007a)(Ruso et
al., 2007a)(Ruso et al., 2007a)Sandoval-Gil et al., 2012) examined single species or
community under the effect of brine discharge or increased salinity, all found a definite
impact expressed as low photosynthesis rates, low vitality rates and substitution of species
in a community.
Whereas previous studies suggested a definite impact of desalination plants on the
marine environment this research suggest a minimal potential effect of the planned Shavei-
Zion desalination plant on the marine environment, based on Palmachim desalination plant
monitoring data. These results are consistent with Raventos et al., 2006 that examined the
effect of desalination plant on macro benthic communities in the Mediterranean. The
results were explained by high natural fluctuations and high dilution rates.
0
0.2
0.4
0.6
0.8
1
1.2
VM1 VM2 VM3 VM4 VM5 VM6 VM9
Jacc
ars
va
lue
s
Species diversity
2004-2008 2004-2009 2004-2010 2004-2011
X22=5.589, p=0.471
© T
echn
ion
- Isr
ael I
nstit
ute
of T
echn
olog
y, E
lyac
har C
entra
l Lib
rary
32
The new approach of looking at the impact from an ecosystem point of view can be
one reason for the different result. Since the final assessment is composed of three
parameters, a change in one parameter has smaller impact on the whole assessment, unlike
a species or community impact assessment. Our surprising result can also result from the
data available for this research, which were collected in 7 marine monitoring stations
during the years 2004 (before) and. 2008, 2009, 2010 and 2011 (after the construction of
the Palmachim desalination plant). More accurate result can obtain by a statistical analysis
that is based on more data. Data should be collected for a number of years before the
construction of the desalination plant, as well as after. A possible database to provide this
data is the Shafdan program monitoring data. Another possible explanation for the minimal
impact of the plant we report can be the high variability of the data, which could mask true
effects due to low signal-to-noise ratio, and the lack of a sensitivity analysis for the impact
assessment scales. Since the sensitivity scales was set by us according to our point of view,
there is a need to check its accuracy level according to other ecologist's points of view. The
sensitivity analysis can be performed by at least three or four ecologists. Each one should
set three different impact assessment scales- one for every parameter. Than the ecological
data collected for each parameter should be examined according to all scales, the
differences results according to the different scales should be discussed by all ecologists
participates, and the most accurate scale for each one of three parameters should be
collected.
In this work we chose to represent all species together and not according to their taxa for
two reasons. First, according to the research methodology the species diversity parameter,
as well as the two other parameters, is describing the marine environment from an
ecosystem point of view. In intention to implement this approach I presented one exclusive
result for each parameter, including all data collected and examined for the parameter.
Second, given the fact that monitoring plans for desalination plants do not collect data
regarding all the species in an ecosystem, but only representative species, it is important to
implement the methodology to flexible data bases, instead of fixative, like previous studies.
The research methodology we present in this work relies on the similarity between
Palmachim and the Shavei-Zion marine ecosystems. The comparison of ecological
parameters between these two areas is possible assuming that changes in similar abiotic
characteristics of an ecosystem (e.g. depth, temperature, salinity) will lead to similar
changes of the ecosystem parameters examined (primary production, species diversity and © T
echn
ion
- Isr
ael I
nstit
ute
of T
echn
olog
y, E
lyac
har C
entra
l Lib
rary
33
decomposition). However, this approach may not necessarily fit other locations. For
example, an impact assessment of a similar desalination plant (50 MCM/year) in the San
Francisco area, California, will probably not be able to rely on this study, since the marine
ecosystem of the areas are very different. The San Francisco borders the Pacific Ocean,
which features different biotic and abiotic characteristics. However, since the shoreline of
Israel is generally similar in its abiotic characteristics (Figure 9), results of this work can
probably apply also for other future desalination plants with the same capacity that may
possibly be built along the Israeli Mediterranean shore. In contrast, studies that examine the
impact of desalination plants in other areas need to either examine the abiotic
characteristics of the study area in comparison to Palmachim area, or to rely on a close area
or similar ecological database. Impact assessment studies of existent desalination plants, for
which monitoring program exists, can follow the research methodology presented here and
apply it on the relevant monitoring data.
The research did not provide monetary value for the ecological impact assessment
of desalination plants. The reason was our inability to quantify the marine ecosystem as a
whole, and since not all of its components have a monetary value. For example, the benthic
organisms living in the sediment layer has no importance to humans although they are very
important in keeping the marine ecosystem balanced - mostly because they feed on the
whole water column "left overs".
However, there are impact assessment methods that do provide monetary values,
such as the "ecosystem services" method. The latter measures the contributions of nature to
human welfare, using units that describe the conventional goods and services found in GDP
and other national accounts (Boyd and Banzhaf, 2007). Since this method cannot quantify
the marine ecosystem as a whole I did not used it for the current research.
© T
echn
ion
- Isr
ael I
nstit
ute
of T
echn
olog
y, E
lyac
har C
entra
l Lib
rary

34
5. Air pollution and public health impact assessment
5.1 Air pollution and health database
Emissions and fuel type breakdown of the Israel Electricity Corporation for the years 2009-
2012 were obtained from the Israel Electricity Corporation. Meteorological data for
constructing the Shavei-Zion windrose were obtained from the Israel Meteorological
Service. All the data required for DALY values and monetary value calculations, including
standard life expectancy, number of deaths and gross domestic product, were obtained from
the Central Bureau of Statistics.
5.2 Air pollution and public health impact assessment methods
In this research we adopted the European Commission approach for assessing the External
Costs of Energy projects (ExternE), which quantified the external costs related to energy
production and consumption in European Union countries using the Impact Pathway
Approach (IPA). Following the ExternE project, we developed a method for estimating the
costs related to energy production and consumption in Israel, specifically focusing on
human health. In general, the estimation of the cost related to energy production and
consumption in Israel follows a fixed pathway (Figure 6) whose preferred methods should
be determined by the user's preference and needs, as well as by data availability. We
improved the IPA approach by referring to on-site power production vs. off-site power
production. There are currently two ways for desalination plant to supply its energy
requirements: (a) on-site power production by a small power plant (usually gas turbine) that
provides all the energy required for all desalination process. The impact of pollutants
originated from such a power plant was defined as local scale impact. (b) The alternative
option is off-site power production, where the desalination plant receives all its energy
demands from the national electricity grid, and the impact assessment assumes that
pollutants are emitted from all the power plants in Israel and thus affects all the country's
population. This option provides a national scale impact assessment, as described in Figure
17.
© T
echn
ion
- Isr
ael I
nstit
ute
of T
echn
olog
y, E
lyac
har C
entra
l Lib
rary
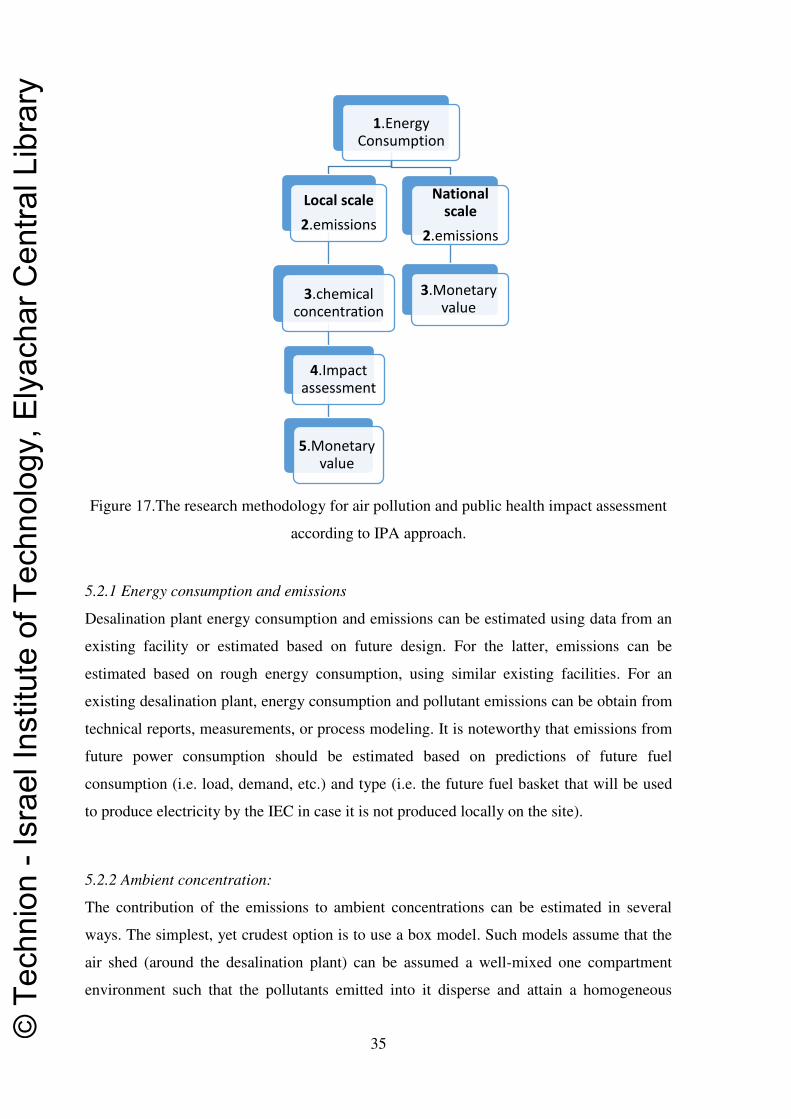
35
Figure 17.The research methodology for air pollution and public health impact assessment
according to IPA approach.
5.2.1 Energy consumption and emissions
Desalination plant energy consumption and emissions can be estimated using data from an
existing facility or estimated based on future design. For the latter, emissions can be
estimated based on rough energy consumption, using similar existing facilities. For an
existing desalination plant, energy consumption and pollutant emissions can be obtain from
technical reports, measurements, or process modeling. It is noteworthy that emissions from
future power consumption should be estimated based on predictions of future fuel
consumption (i.e. load, demand, etc.) and type (i.e. the future fuel basket that will be used
to produce electricity by the IEC in case it is not produced locally on the site).
5.2.2 Ambient concentration:
The contribution of the emissions to ambient concentrations can be estimated in several
ways. The simplest, yet crudest option is to use a box model. Such models assume that the
air shed (around the desalination plant) can be assumed a well-mixed one compartment
environment such that the pollutants emitted into it disperse and attain a homogeneous
1.Energy Consumption
Local scale 2.emissions
3.chemical concentration
4.Impact assessment
5.Monetary value
National
scale 2.emissions
3.Monetary value
© T
echn
ion
- Isr
ael I
nstit
ute
of T
echn
olog
y, E
lyac
har C
entra
l Lib
rary
36
concentration. In practice, however, this model is very limited and can be used only as a
preliminary screening tool.
Dispersion models are mathematical models that simulate the processes involved in
dispersion of pollutants in the atmosphere. All models require input data on the exact
(probabilistic) meteorological conditions (wind direction and speed both aloft and at the
ground, atmospheric stability, boundary layer height, ambient air temperature profile, etc.),
land use data (topography, site layout, etc.) and emission parameters (source location,
strength, height, flux rate, exit temperature, etc.). Some dispersion models require further
input data, such as cloud cover and solar radiation. The computation demands of such
models depend on the model complexity and spatiotemporal resolution and may require
considerable resources. Commonly used models are either Gaussian models or more
complexes models such as AEROMOD and CALPUFF.
Estimation of the share of different emission sources/sectors to the observed air
quality in an area can be done based on observations/measurements data (e.g. Yuval et al.,
2007; Haim, 2011). As such, it is only valid for estimating the shares of existing emission
sources. Only an existing emission sources with an existing data collected for them can be
examined. Normally, using few assumptions, a set of equations can be developed and
solved either as an optimization problem (residual minimization) or in an iterative manner.
For example, Yuval et al. (2007) had rich observational database enabling the estimation of
the shares of ambient NOx that could be attributed to emissions from industry.
Implementing this method to study the contribution of emissions from the desalination
power plant would require assuming that: (a) the desalination plant and traffic are the only
sources of NOx in the study area, (b) the ratio between the mean number of molecules of
NOx and SO2that are emitted from the desalination plant during weekdays is identical to
the ratio during weekends and holidays. The difference between weekdays and holidays are
mostly the amount of traffic and the industries working at lower rates. In general, the data
used in such studies are obtained from air pollution monitoring databases or from relatively
short campaign of intensive sampling, and must be representative over long time periods.
This method, too, is not useful for assessing the impact of future designed facilities, since it
require real data and cannot rely on assessments.
Another method for estimating the share of pollutants originating from the
desalination power plant may follow Haim (2011). Based on this study the share of air
pollution contributed by the desalination plant requires the following assumptions: (a)
dispersion of SO2 and of NOx is identical such that the molar ratio of SO2/NOx in the plume © T
echn
ion
- Isr
ael I
nstit
ute
of T
echn
olog
y, E
lyac
har C
entra
l Lib
rary
37
emitted from the desalination power plant and arriving at each nearby monitoring station
should remain the same as in the stack. (b) Only stations that are downwind of the
desalination plant on any time point (i.e. with the wind blowing from the desalination plant
to the monitoring station) should be considered. These assumptions are translated into a set
of equations from which it may be possible to calculate the share of the desalination plant
in the total nitrogen oxides measured at nearby monitoring stations:
ℎ� � = � �� � �� � (5)
Yet, this method is also applicable only for estimating the contribution of an existing
emission source to observed levels.
5.2.3 Impact assessment
There are several possible methods for assessing the air quality impact of desalination
plants, with each method estimating the impact using different parameters, such as health
endpoints or years of life lost (DALY) due to morbidity and/or mortality. The method of
choice is related to the impact assessment requirements and to data availability.
A common method for linking air pollution to health effects is by using
concentration-response (C-R) functions, derived from the epidemiological literature.
Generally, the method calculates the association between air quality and health indices
while accounting for census data on the population at risk, It, thus, generates estimates of
the expected incidence changes of specific outcomes in the population per a unit change of
the air pollutants (EPA, 1999). The health endpoint considered includes overall or
disease/condition specific morbidity, hospital admission, mortality, etc., in particular
cardiovascular disease and lung cancer. To estimate the risk of exposure to a certain air
pollutant we used a PM C-R function that accounts for long-term exposure to ambient PM
levels and mortality as a result of cardiopulmonary diseases (heart diseases and pneumonia)
(Ostro, 2004; Pope, 2000). After calculating the estimated effect on different endpoints and
accounting for standard life expectancy, the user can use the DALY (Disability Adjusted
Life Years) concept. for calculating the incidence and disease burden that is attributes to a
given risk factor (Miraglia et al., 2005; WHO, 2002; Liu et al., 2012; Mathers et al., 2001).
The DALY is the sum of years of life lost (YLL) due to premature mortality, and of
years of life lived with disability (YLD) (Murray andLopez, 1996). Specifically, the disease
burden (in terms of DALY) can be attributed to a local or national-wise exposure,
depending on the user's needs and data availability.
© T
echn
ion
- Isr
ael I
nstit
ute
of T
echn
olog
y, E
lyac
har C
entra
l Lib
rary
38
The calculation of DALY is as follows: DALY = YLL + YLD (6) YLL = Nr ∗ 1 − e−rL (7)
where: N is the number of deaths, L is the standard life expectancy at age of death, and r is
the discount rate (r=0.03). The discount rate reflects the social preference of a healthy year
now over one in the future. Namely, the value of a healthy future year is decreased by
(Prüss-Üstün et al., 2003). Similarly, YLD = I ∗ DW ∗ L (8) where I is the number of new cases, DW is the disability weight, and L is the average
duration of disability (in years). Disability weights reflect the health state valuation for
different diseases and their values can be found in Murray and Lopez (1996).
A second method of assessing the impact of desalination plants on air pollution is
by using the relative risk (RR) and impact fraction (IF) concept. RR functions, such as
equation 13, describe the relative risk for a certain health endpoint given an exposure to a
pollutant concentration. It is different from the C-R functions since it calculates the relative
risk of morbidity and mortality for a given pollutant concentration relative to a threshold
concentration, while C-R functions calculates an absolute incidence number of a health
endpoint. Once the RR is calculated, the IF associated with a given health endpoint in the
exposed population is calculated as IF = RR−RR (9)
where IF represents the proportion of health end point cases that can be related to the
change in the pollutant concentration. The health endpoint can be expressed as the absolute
incidence, or the proportion of the DALYs calculated for the health end point relative to the
DALY of all the health endpoints.
5.2.4 Monetary valuation
Given the predicted health impact, monetary valuation can be done in two different ways.
Pareto (2008) presented possible yet simple and not accurate approach to transform the
health impact assessments into monetary value. Pareto approach is based on the ExternE
project results, translating it to Israeli currency values by using economic and
anthropologic parameters. Another approach is based on Sachs (2002). This method
translates DALY values to currency values using equation 1. Given the desalination plant
© T
echn
ion
- Isr
ael I
nstit
ute
of T
echn
olog
y, E
lyac
har C
entra
l Lib
rary
39
air pollution and health impact assessment in DALY values, the area or country population
(in relation to the on-site or off-site approaches, respectively), and the national GDP, it is
possible to calculate the monetary value of the impact of the plant. While the Pareto
method is useful for preliminary assessment, the Sachs method provides more accurate
values. Thus, I used the latter for demonstrating the method.
5.3 Air pollution and public health impact assessment results
According to the research methodology, the impact assessment and monetary value of the
air pollution due to expected emissions from the planned Shavei-Zion desalination plant
was calculated using both the local scale approach and the national scale approach. The
specific at each stage were chosen based on data availability. The pollutant examined was
PM2.5, since it has been associated with numerous adverse health effects, in particular
cardiopulmonary disease. Moreover, since the planned Shavei-Zion desalination plant does
not have currently a detailed program regarding in-site power plant construction, its energy
demands were estimated following Semiat (2008) as 3.75 kwh/m3.
5.3.1 National scale impact assessment
5.3.1.1 Emissions
Emissions for the local scale impact assessment were estimated based on fuel type
segmentation and consumption in 2009-2011, assuming few alternatives of fuels that will
be used in the future. The fuel type segmentation data was obtained from the Israel
Electricity Corporation. Since the emission data were presented in terms of PM10 and the
concentration-response function was available for PM2.5, a conversion had been done.
Namely, the PM10 emissions were transformed into PM2.5 emissions according to: [ . ]� = ∑ � ∗ ∗ ∗ [ ]� ∗ (10) where [PM2.5]A is the estimated PM2.5annual emission from the Shavei-Zion desalination
plant (ton/year), Fi is the fuel type share at the national level (coal 0.38, gas 0.5, mazut 0.02
and diesel 0.1), E is the estimated energy consumption per 1 m3 of desalinated water (3.75
kwh/m3), P is the annual production of desalinated water (50,000,000 m3/year), [PM10]i is
the average fuel-type specific PM10 annual emission (gr/kwh): coal 0.7, gas 0.016, mazut
0.1 and diesel 0.12, and r is the PM10/PM2.5average ratio at the power plant facility stack
(0.47; Zereini and Wiseman, 2010). Hence, the estimated annual PM2.5 emission from the
Shavei-Zion desalination plant, based on non-local electricity production, is 25.38 ton/year.
© T
echn
ion
- Isr
ael I
nstit
ute
of T
echn
olog
y, E
lyac
har C
entra
l Lib
rary

40
5.3.1.2 Monetary value
Pareto (2008) set fixed prices per ton of emission for various pollutants based on the prices
presented at the ExternE project. The prices represent the impact of electricity consumption
on the public health. The Israeli Ministry of Environmental Protection updates these prices
every year and presents them to the public. As of 1.1.2014, the updated prices (per ton) are
presented in Table 6.
Table 6. External cost prices due to industry, electricity production and transportation
updated for 2014. (Source: The Israeli Ministry of Environmental Protection:
http://www.sviva.gov.il/subjectsEnv/SvivaAir/Documents/airexternalcost/AirExternalCoast
10.2.2014.pdf).
Transportation Industry Electricity
1.1.2013 1.1.2014 1.1.2013 1.1.2014 1.1.2013 1.1.2014
per ton
(₪)
per ton
(₪)
per ton
(₪)
per ton
(₪)
per ton
(₪)
per ton
(₪)
--- --- 44,633 47,895 34,783 37,326 SO2
75,461 80,978 31,724 34,043 20,144 21,617 NOx
145,772 156,428 119,254 127,972 69,645 74,736 PM2.5
94,707 101,631 77,142 82,781 49,648 53,277 PM10
21,454 23,023 16,615 17,830 --- --- VOC
1,042 1,119 --- --- --- --- CO
103 110 103 110 103 110 CO2
Based on Table 16, PM2.5 that will originate from the Shavei-Zion desalination plant is
expected to result in health outcomes which economic value is estimated at 1,896,800 ₪
(according to the national impact assessments).
© T
echn
ion
- Isr
ael I
nstit
ute
of T
echn
olog
y, E
lyac
har C
entra
l Lib
rary
41
5.3.2 Local scale impact assessment
5.3.2.1 Emissions
Emissions from the planned desalination plant, assuming local power production, were
estimated based on the assumption that a small on-site power production facility will be
constructed. Based on current trends following the finding of large gas reservoirs in the
Mediterranean, we assume that the facility will operate solely on gas. Examples of gas-
fired power plants built recently are Hagit (near Ramot Menashe) and Gezer (near the city
of Ramla).
The emissions from such a facility are estimated as follows: [ . ]� ��� = �ℎ3 ∗ 3 ∗ [ ] ��ℎ ∗ ∗ , , �� (11)
where [PM2.5]A is the estimated annual PM2.5 emission from the Shavei-Zion desalination
plant (gr/s), E is the estimated energy consumption (3.75 kwh/m3; (Semiat, 2008), P is the
annual planned production of the desalinated water (50,000,000 m3/year), [PM10] is the
average annual PM10 emission from gas turbines (gr/kwh) ( ;2010 ;2009 ;ד
2011), and R is the PM10/PM2.5 average ratio at the power plant stack (0.47; Zereiniand
Wiseman, 2010). Hence, the annual estimated PM2.5 emission from the Shavei-Zion
desalination plant according to the local power production scenario is 0.045 gr/s.
5.3.2.2 Ambient concentrations
Since the desalination plant is not fully planned at this stage, it was not possible to use any
of the methods described earlier to calculate ambient concentrations that result from the
related emissions. In fact, this situation is common when performing EIA for planned
facility. In such cases of the very early design stages, based on a simple Gaussian plume
dispersion model and a number of assumptions, it is possible to calculate the range of PM2.5
concentrations at the required receptor points (the cities of Akko and Nahariya, the closest
large population centers to the planned desalination plant in this work).
First, a windrose for the study region should be created. In the case of the Shavei
Zion desalination plant, this was done based on data from the last four years (1/1/2010-
1/12/2013) obtained from the Israel Meteorological Service (Figure 18). It is seen that the
main wind directions are north-north east towards the city of Nahariya, south-south west
and south west towards the city of Akko, and west towards the Mediterranean Sea. The
west direction could be neglected, since there is no population in that direction. Next,
© T
echn
ion
- Isr
ael I
nstit
ute
of T
echn
olog
y, E
lyac
har C
entra
l Lib
rary
42
ambient PM2.5 concentrations in Nahariya and Akko were calculated using the standard
Gaussian plume dispersion model:
(12)
where Q is the PM2.5 emission rate (0.045 gr/s), U is the average wind speed (5 m/sec in the
direction of Nahariya and 1m/sec in the direction of Akko, see Figure 18), x is the x-
coordinate of the receptor (3 km to Nahariya and 6 km to Akko), y and z are the y and z
coordinates of the receptor (0, 0), i.e. the plum’s center at ground level, � and � are the
plume width standard deviations in the y and z directions, respectively, and H is the
effective stack height. The atmospheric stability was taken to be either B, C or D
atmospheric stabilities based on the wind speed (1-5 m/s) or assuming the exposure to take
place during the day, when people are outside their houses. The effective stack height was
taken to be between 40 and 70 m, based on similar small scale gas-firedfacilities.PM2.5
concentrations were calculated according to two parameters scenarios- stack height and
atmospheric stability, performing a sensitivity analysis type calculation (Figure 19). The
minimum and maximum concentrations were assumed to represent the range of possible
concentrations (0.0185-0.395 µg/m3),
© T
echn
ion
- Isr
ael I
nstit
ute
of T
echn
olog
y, E
lyac
har C
entra
l Lib
rary

43
Figure 18. Windrose for the Shavei Zion study area based on the Israel Meteorological
Service data from1/1/2010-1/12/2013. Wind speed in meters per second.
Figure 19. Estimated ambient PM2. 5concentrations in Nahariya and Akko for the B, C and
D atmospheric stabilities and stack height of 40 m or 70 m.
0
0.05
0.1
0.15
0.2
0.25
0.3
0.35
0.4
0.45
PM
2.5
co
nce
ntr
ati
on
(µ
g/m
3)
PM2.5 concentrations
akko
nahariya
70 m stack height 40 m stack height B C D B C D
© T
echn
ion
- Isr
ael I
nstit
ute
of T
echn
olog
y, E
lyac
har C
entra
l Lib
rary

44
5.3.2.3 Impact assessment: Relative Risk (RR) and Impact Fraction (IF)
The calculation of the RR and IF that result from exposure to ambient PM2.5concentrations,
attributed to the desalination plant, followed the scheme presented by Ostro (2004) for
assessing long-term exposure. For demonstration purposes, the outcome studied was
cardiopulmonary mortality, including mortality from heart diseases and pneumonia. This
outcome was chosen since it is has been associated with exposure to PM2.5(Pope et al.,
2002). The relative risk was calculated via
RR = e[β ∗ X − X ] (13)
where β equals 0.00893 [0.00322, 0.01464] Ostro (2004), X is the PM2.5 concentration
calculated at the receptor point (µg/m3), X0 is the ambient PM2.5 concentration (µg/m3),
and ∆X (i.e. X − X is the PM2.5 concentration attributed to the desalination plant. The IF
follows the calculation described in equation (4).The IF for cardiopulmonary mortality due
to long-term exposure to ambient PM2.5 that originate from the desalination facility power
plant is estimated to be 0.017% and0.35% for the Nahariya and Akko populations,
respectively.
5.3.2.4 DALY
Since the calculated IF referred to cardiopulmonary mortality, I referred only to YYL
(Years of Life Lost) instead of the sum of YYL and YLD (Years Lived with Disability).
According to Prüss-Üstün et al. (2003), calculating the DALY value of mortality (YYL)
and morbidity (YLD) separately, using distinct C-R functions, is a way to value the two
health outcomes separately. Here, YYL was calculated using equation (6).All the data
required for the calculation of YLL were obtained from the Central Bureau of Statistics.
Standard life expectancy at age of death and number of deaths as a result of
cardiopulmonary diseases (heart diseases and pneumonia) were obtained for the Akko
district population above 45 years of age, obtained from the age group and gender adjusted
2008 census. The relative number of deaths in Akko and Nahariya was obtained by
normalizing the deaths by the population at the years 2005-2009. For the purpose of
demonstrating a full example of the method, I assumed that the total number of deaths in
Nahariya and Akko as a result of cardiopulmonary diseases in people older than 45 will not
change dramatically after the construction of the desalination power plant facility.
Finally, the estimated number of deaths in Akko and Nahariya must be multiplied by the
impact fraction to assess the direct impact of the facility on public health:
© T
echn
ion
- Isr
ael I
nstit
ute
of T
echn
olog
y, E
lyac
har C
entra
l Lib
rary
45
YYLA ri = IF ∗ YYLC l l (14)
The estimated number of years of life lost (YYL) in Akko and Nahariya due to
cardiopulmonary diseases in people older than 45, attributed to exposure to PM2.5 emitted
from the Shavei-Zion desalination plant, is expected to range between 0.26 and 5.61 years.
5.3.2.5 Monetary value
Monetary value of the impact of air pollution attributed to the desalination plant on the
public health was calculated according to equation (9), where the attributed YYL was 0.26-
5.61 years, the population was the average population of Akko and Nahariya in the years
2005-2009, and the local gross domestic product of Akko and Nahariya in the years 2005-
2009 was calculated using the GDP of Israel in 2005-2009 and the ratio between the local
population in Akko and Nahariya and the total population of Israel during these years. The
local GDP of Akko and Nahariya was simplified for the purpose of demonstrating the
method, assuming that the specific GDP for all cities in Israel is the same. The estimated
monetary value of the studied health outcomes that are attributed to air pollutants emitted
from the desalination plant (PM2.5 in this work) in Akko and Nahariya ranges between
74,453and 1,585,395 NIS.
5.4 Air pollution and public health impact assessment discussion and conclusion
Air pollution and public health impact assessment is a common tool for predicting and
examining the impact of planned industry projects on the lives of citizens living nearby. To
date, the final assessment is usually presented as quantitative values of health indices (e.g.
incidence rates, relative risk, etc.). Here we present an approach followed by the ExternE
project that provide the predicted impacts in terms of monetary value using various flexible
options. The monetary value describes the potential risk in terms of a simpler and more
comprehensible metric for the public and decision makers. In this way, the air pollution and
public health impact assessment may be more relevant and meaningful to the public and to
professionals, and perhaps gain popularity and broaden the use of this tool. A flexible
impact assessment method allows the user to choose the components and scale desired for
the studied conditions. Much resources can be saved by adjusting the EIA-HIA to the
objectives and scope of the assessment.
This work is based on common impact assessment methods, integrating them into
one multi-path impact assessment method. This approach allows the user to choose the
© T
echn
ion
- Isr
ael I
nstit
ute
of T
echn
olog
y, E
lyac
har C
entra
l Lib
rary
46
suitable method of assessment according to accuracy level required and data availability.
The approach allows the user to follow the path applicable to the specific conditions at
hand, and to choose the proper values that fit best the case studied. Naturally, the impact
assessment is more accurate for existing pollutant sources rather than for planned ones.
This has to be taken into account while calculating the local impact assessment pathway,
presenting the final results as a range of possible values.
Here, we present the impact of the planned desalination plant in Shavei-Zion both at
the national scale, describing all the health outcome resulted from the increased PM2.5
concentration (with health related monetary value of 1,896,800 NIS), and the local scale,
describing mortality from cardiopulmonary diseases in Akko and Nahariya in people older
than 45 as a result of increased PM2.5 concentration (with health related monetary values
in the range of 74,500-1,585,500 NIS). A significate public health cost is predicted to air
pollution resulted from the desalination plant operation. At the national scale, the cost of
exposure to the desalination plant related PM2.5 emissions is relatively high in comparison
to other pollutant, but it is relatively small in comparison to other PM2.5 sources, such as
industry and transportation (see Table 6).
Since there are no concrete construction plans for the Shavei-Zion desalination
plant at this point, the expected accuracy of the current impact assessment is not high.
However, it is noteworthy that the two tracks followed for the impact assessment (national
and local scales) provide similar monetary values. This similarity suggests that (at least for
the example studied) the crude impact assessment we performed following the two distinct
research methodologies converges to a common range of monetary values. Since the
calculation of impacts based on the national track is relatively simple, it is recommended to
always calculate it for comparison purposes.
The pollutant examined for demonstrating the research methodology was PM2.5,
since it has been associated with numerous adverse health effects, in particular
cardiopulmonary disease. A more complete impact assessment will have to take into
account other pollutants, such as SOX, NOX, CO, etc. The total impact assessment is the
sum of all pollutants and health outcomes examined. Clearly, in terms of monetary value
summation of all the pollutant specific impacts is possible, which is not always the case
when the results are provided in terms of incidence rates or additional (clinical) cases. The
latter is particularly important since the effects of different air pollutants are distinct. For
example, Small and Kazimi (1995) examined the cost of air pollution from motor vehicles
© T
echn
ion
- Isr
ael I
nstit
ute
of T
echn
olog
y, E
lyac
har C
entra
l Lib
rary
47
and found that the monetary value resulted from SOX and particulate matter is 10 times
higher than the monetary value that results from VOC or NOX.
6. Discussion and Conclusions
This research was set up to improve the methods currently used for assessing the impacts of
desalination plants on the environment and on human health. We focused on developing a
quantitative approach, including monetary value considerations that can be used by
decision makers. Distinct impact assessment methods are suggested for the marine
environment ecosystem and for air pollution and public health. The methods were
demonstrated on the planned Shavei-Zion desalination plant.
As mentioned above, the research had been divided into two different sections. The
marine ecology impact assessment section provides a quantitative assessment whereas the
air pollution and public health impact assessment section provides monetary valuation. The
research does not suggest an integration between these two assessments. A possible
integration path is by assessing the ecological impact of desalination plants in monetary
values using the ecosystem services method, and then summing all the potential effects of
the desalination plant and presenting them as one impact assessment value. However, we
did not use this method in the research since the ecosystem services method does not reflect
all aspects of the marine ecosystem as a whole, as mentioned in the ecological impact
assessment section.
Another possible path for integration can be creating degree of impact scale for the
air pollution and public health impact assessment, and then presenting the final assessment
in terms of degree of impact. The Impact Fraction value can be used for this path. For the
current research the pollutant examined, PM2.5, and cardiopulmonary mortality in people
older than 45 in Akko and Nahariya, a degree of impact scale can be created using
epidemiological data. This scale will describe the severity of the impact on the population
in terms of the fracture of the population that was affected. A sensitivity analysis must be
performed by the same steps described in the ecological impact assessment section. The
final impact assessment value is the weighted average of all parameters described in the
research (ecological and public health parameters). There is a need to decide the relative
impact of each parameter in advance and perhaps to perform a sensitivity analysis in order
to sharper the final result. The main disadvantage of this path is the amount of uncertainties
and the lack of attention to the severity of the health impact described.
© T
echn
ion
- Isr
ael I
nstit
ute
of T
echn
olog
y, E
lyac
har C
entra
l Lib
rary

48
For conclusion, I think that integration of different impact assessment methods
poses a certain which cannot be ignored. Each method refers to a different aspect of the
impact of desalination plants and relies on totally different fields of environmental science.
Naturally, the two fields discussed in this work are based on totally different concepts and
ideas. Integrating them together can result in inaccurate, irrelevant and even wrong
results/indices. For every impact assessment study, there is a need to consider if the
integration of different methods and fields will improve the final assessment or make
interpretation of the results too uncertain for practical use.
© T
echn
ion
- Isr
ael I
nstit
ute
of T
echn
olog
y, E
lyac
har C
entra
l Lib
rary
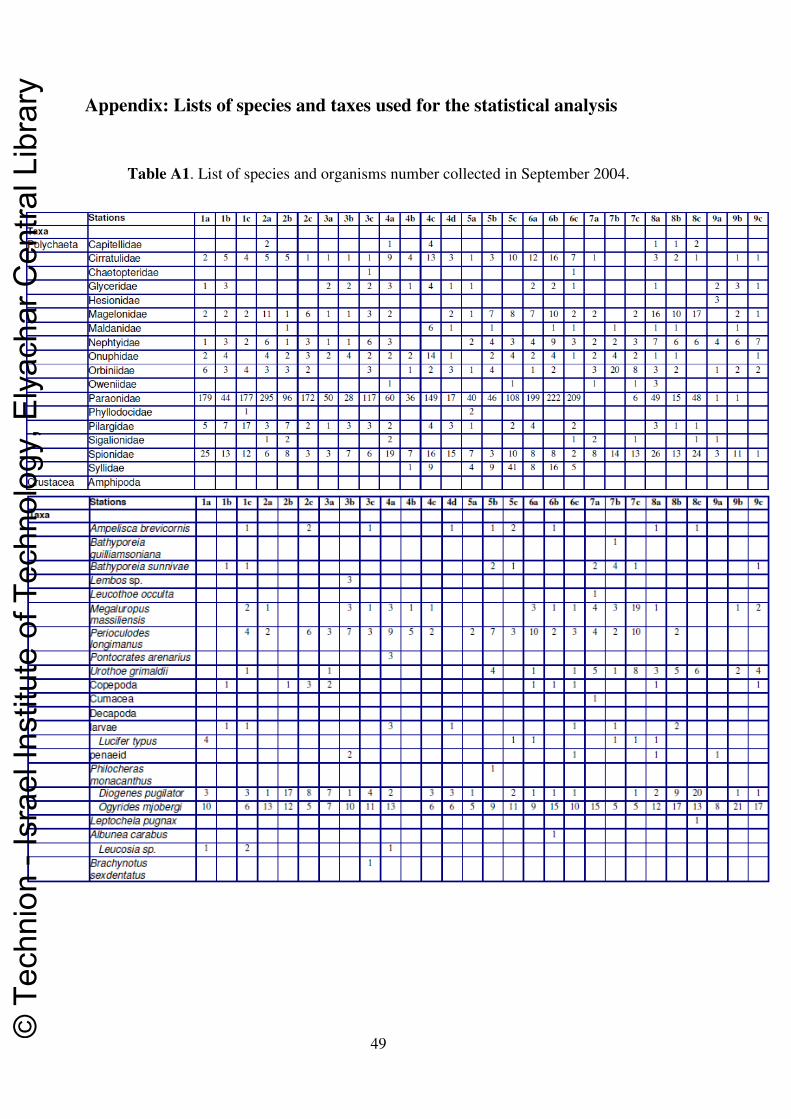
49
Appendix: Lists of species and taxes used for the statistical analysis
Table A1. List of species and organisms number collected in September 2004.
© T
echn
ion
- Isr
ael I
nstit
ute
of T
echn
olog
y, E
lyac
har C
entra
l Lib
rary
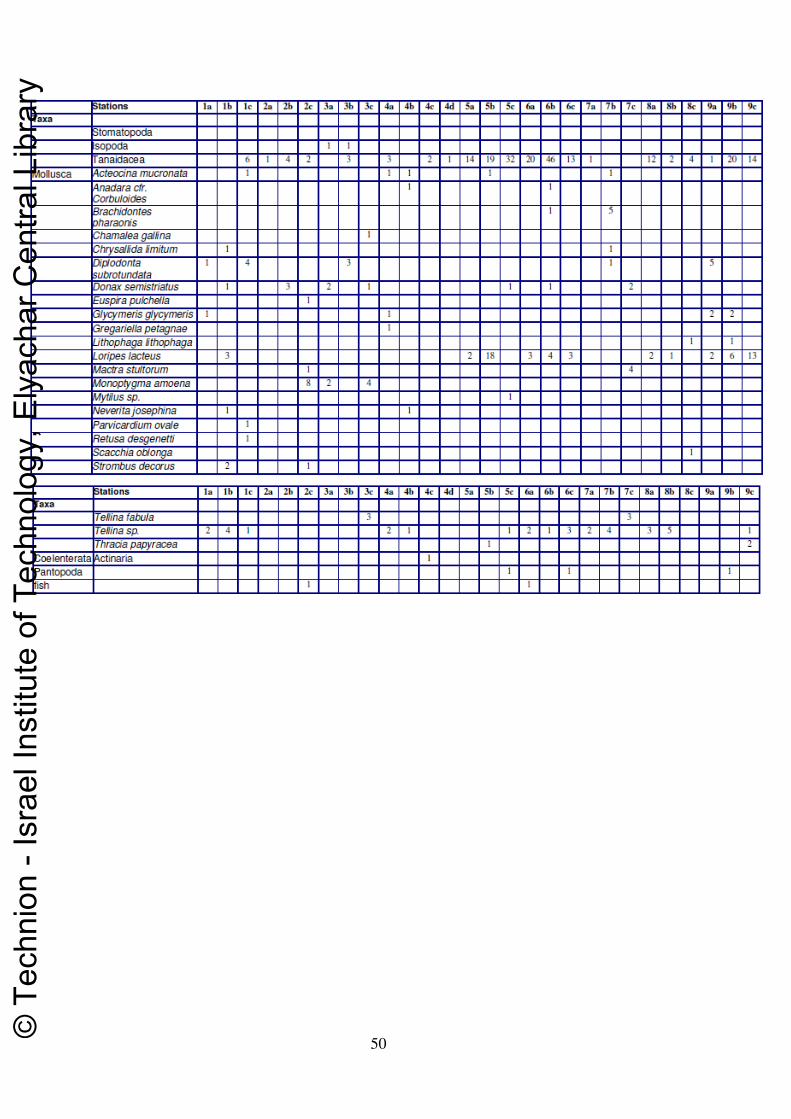
50
© T
echn
ion
- Isr
ael I
nstit
ute
of T
echn
olog
y, E
lyac
har C
entra
l Lib
rary

51
Table A2. List of species and organisms number collected in September 2008.
© T
echn
ion
- Isr
ael I
nstit
ute
of T
echn
olog
y, E
lyac
har C
entra
l Lib
rary
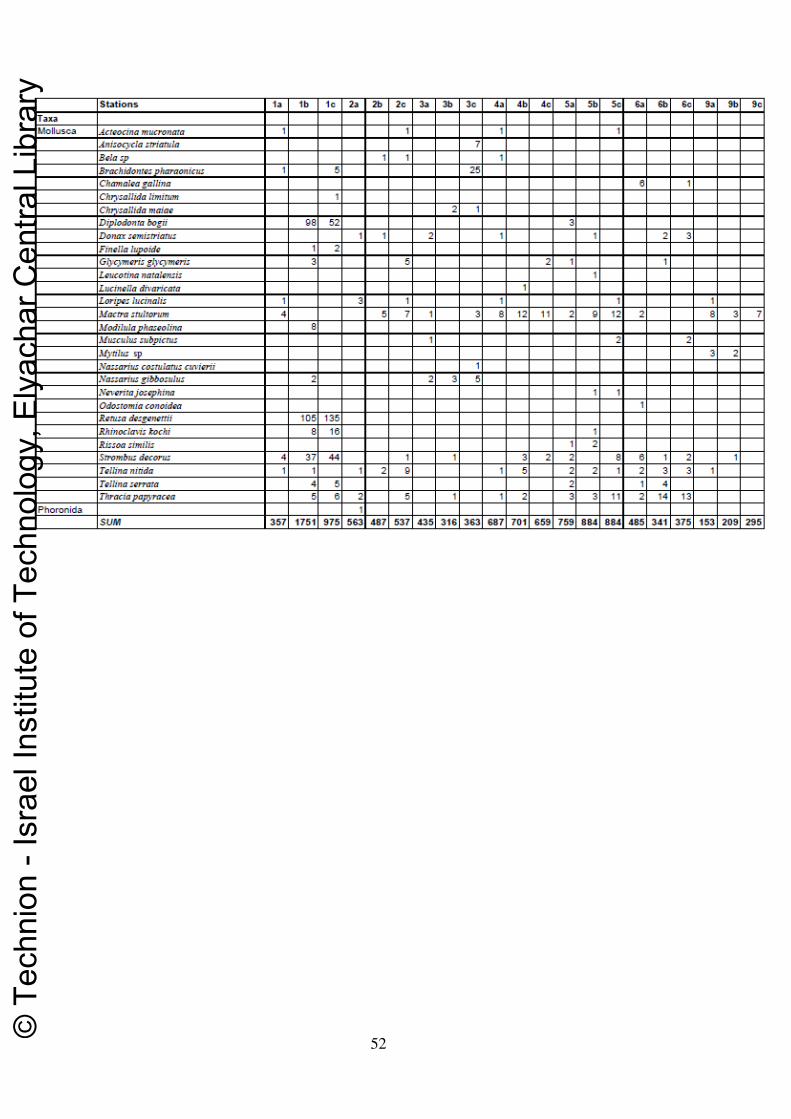
52
© T
echn
ion
- Isr
ael I
nstit
ute
of T
echn
olog
y, E
lyac
har C
entra
l Lib
rary
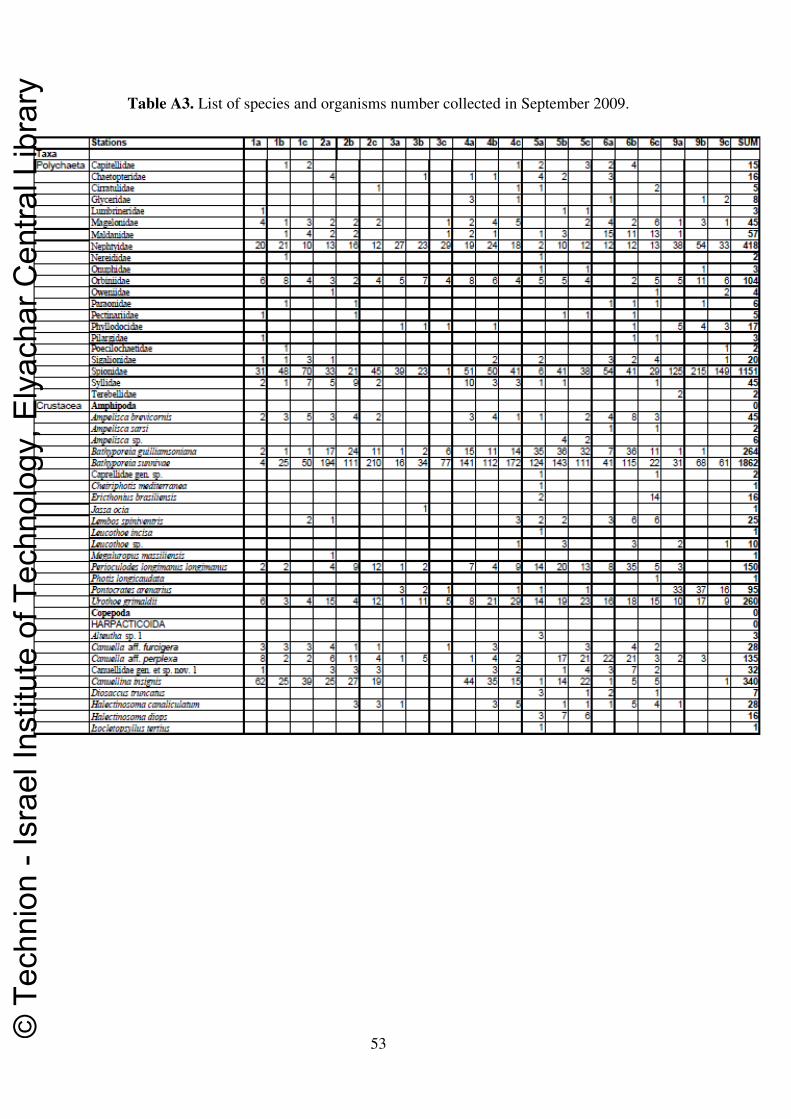
53
Table A3. List of species and organisms number collected in September 2009.
© T
echn
ion
- Isr
ael I
nstit
ute
of T
echn
olog
y, E
lyac
har C
entra
l Lib
rary
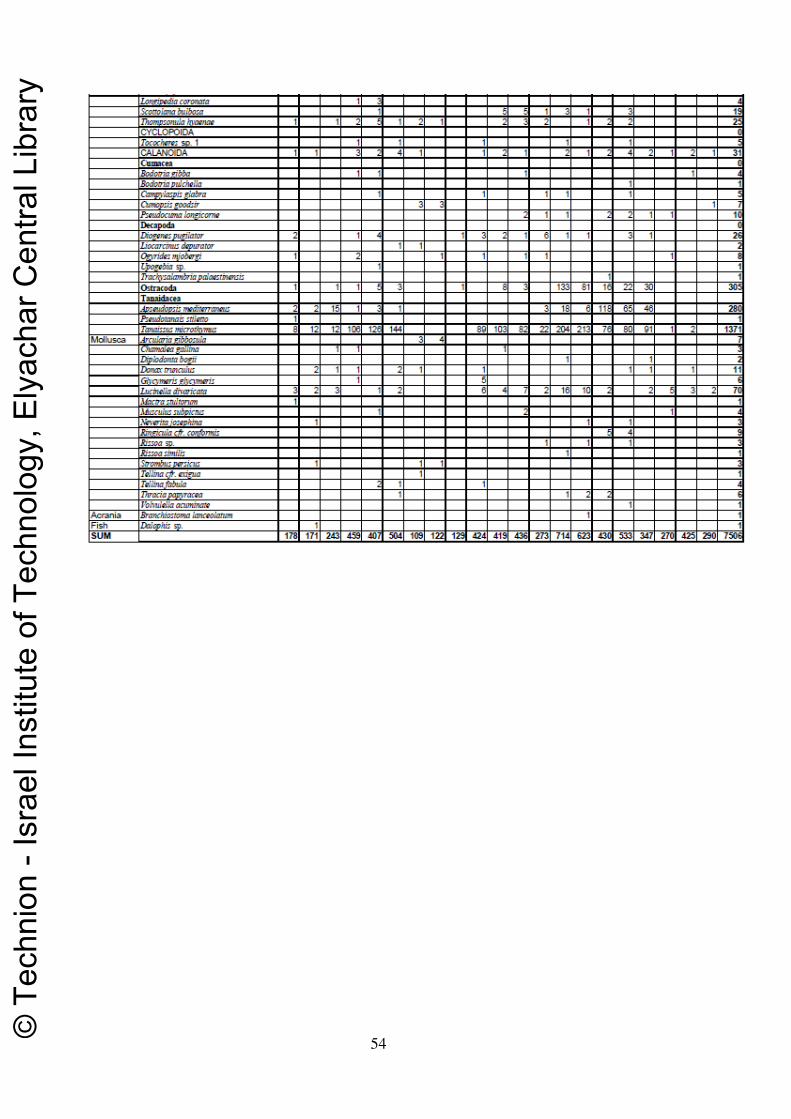
54
© T
echn
ion
- Isr
ael I
nstit
ute
of T
echn
olog
y, E
lyac
har C
entra
l Lib
rary

55
Table A4. List of species and organisms number collected in September 2010.
© T
echn
ion
- Isr
ael I
nstit
ute
of T
echn
olog
y, E
lyac
har C
entra
l Lib
rary

56
© T
echn
ion
- Isr
ael I
nstit
ute
of T
echn
olog
y, E
lyac
har C
entra
l Lib
rary

57
Table A5. List of species and organisms number collected in September 2011.
© T
echn
ion
- Isr
ael I
nstit
ute
of T
echn
olog
y, E
lyac
har C
entra
l Lib
rary
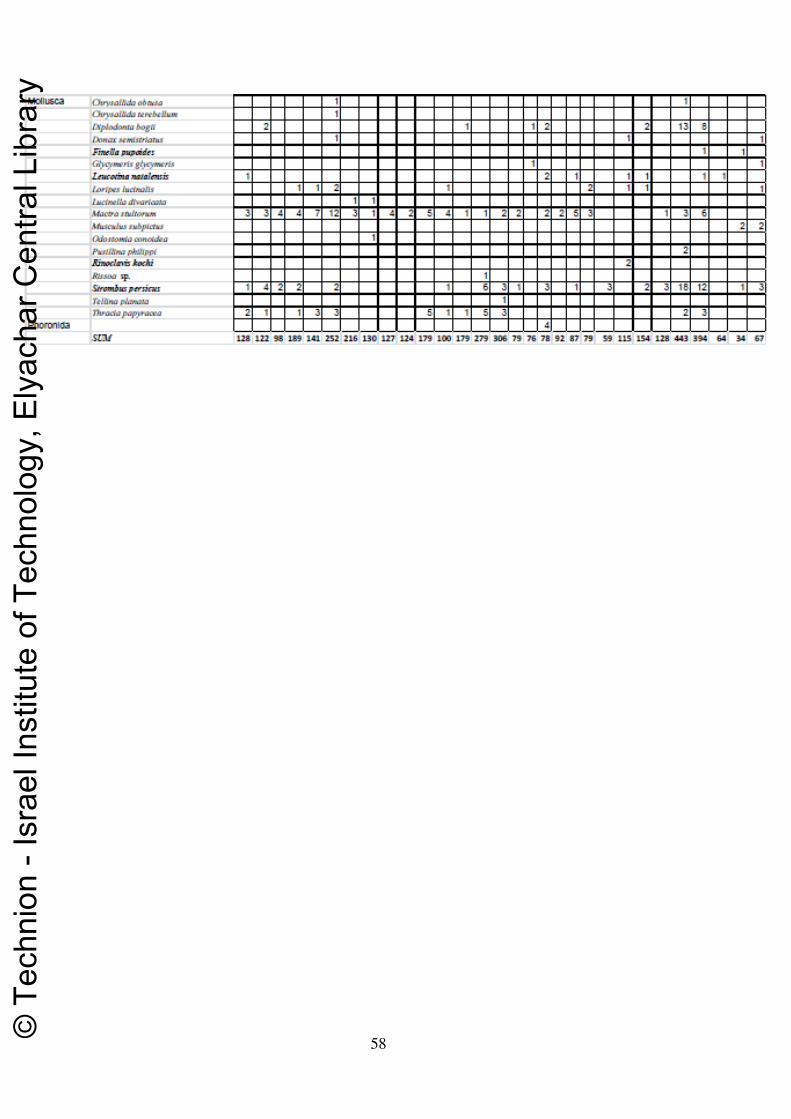
58
© T
echn
ion
- Isr
ael I
nstit
ute
of T
echn
olog
y, E
lyac
har C
entra
l Lib
rary

59
Reference List
Becker, B. J., Ruffner, J., & Patterson, J. (2011). Biodiversity Survey of Benthic
Communities of Commencement Bay ( Tacoma , WA ) 2011 Final Report to be
Submitted to Citizens for a Healthy Bay. TACOMA, WASHINGTON.
Becker, N., Lavee, D., & Tavor, T. (2012). Desalinate or divert? Coastal non-market values as a decision tool for an integrated water management policy: The case of the Jordan River basin. Ocean & Coastal Management, 64, 27–36. doi:10.1016/j.ocecoaman.2012.04.008
Boyd, J., & Banzhaf, S. (2007). What are ecosystem services? The need for standardized environmental accounting units. Ecological Economics, 63(2-3), 616–626. doi:10.1016/j.ecolecon.2007.01.002
Brink, B. I. . Ten, S.H.Hosper, & Colijn, F. (1991). A Quantitative Method for Description & Assessment of Ecosystems : the AMOEBA-approach, 23, 265–270.
Canter, L. (1977). Environmental impact assessment (Vol. 10, pp. 228–248). Retrieved from ftp://www.energia.bme.hu/pub/hullgazd/Environmental Engineers’ Handbook/Ch02.pdf
Christie, S., & Bonnélye, V. (2009). Perth, Australia: Two-year feed back on operation and environmental impact. IDA World Congress Dubai, UAE. Retrieved from ftp://ftp.sccwrp.org/pub/download/DOCUMENTS/BrinePanel/Resources/Perth_2YrReport.pdf
Crabtree, M., & Hann, I. (2010). Environmental Impact Statement a Comparative Study.
Danoun, R. (2007). Desalination Plants: Potential impacts of brine discharge on marine life. Retrieved from http://ses.library.usyd.edu.au/handle/2123/1897
Dupavillon, J. L., & Gillanders, B. M. (2009). Impacts of seawater desalination on the giant Australian cuttlefish Sepia apama in the upper Spencer Gulf, South Australia. Marine
Environmental Research, 67(4-5), 207–18. doi:10.1016/j.marenvres.2009.02.002
Einav, R., Harussi, K., & Perry, D. (2003). The footprint of the desalination processes on the environment. Desalination, 152, 141–154. Retrieved from http://www.sciencedirect.com/science/article/pii/S0011916402010573
Einav, R., & Lokiec, F. (2003). Environmental aspects of a desalination plant in Ashkelon. Desalination, 156(1-3), 79–85. doi:10.1016/S0011-9164(03)00328-X
EPA. (1999). CR Functions Linking Air Pollution and Adverse Health Effects. yosemite.epa.gov (pp. 58–102). Retrieved from http://yosemite.epa.gov/ee/epa/eerm.nsf/vwAN/EE-0295A-08.pdf/$file/EE-0295A-08.pdf
© T
echn
ion
- Isr
ael I
nstit
ute
of T
echn
olog
y, E
lyac
har C
entra
l Lib
rary
60
europian commission. (2003). External Costs Research result on socio-environmental
damages due to electricity and transport. doi:10.4337/9781843766988.00013
Golik, A., Rosen, D., & Brachia, V. (1999). Management of the Israeli coastal sand resources. Isr Oceanogr Limnol Res, IOLR Rep H. Retrieved from http://scholar.google.com/scholar?hl=en&btnG=Search&q=intitle:management+of+the+israeli+coastal+sand+resources#0
Groom, S., Herut, B., Brenner, S., Zodiatis, G., Psarra, S., Kress, N., … Drakopoulos, P. (2005). Satellite-derived spatial and temporal biological variability in the Cyprus Eddy. Deep Sea Research Part II: Topical Studies in Oceanography, 52(22-23), 2990–3010. doi:10.1016/j.dsr2.2005.08.019
Haim, M. (2011). Characterization of exposure to sulfur dioxide and nitrogen oxides in the
Hadera region. Technion - Israel Institute of Technology.
Halpern, B. S., Longo, C., Hardy, D., McLeod, K. L., Samhouri, J. F., Katona, S. K., … Zeller, D. (2012). An index to assess the health and benefits of the global ocean. Nature, 488(7413), 615–20. doi:10.1038/nature11397
Hoepner, T. (1999). A procedure for environmental impact assessments (EIA) for seawater desalination plants. Desalination, 124(1-3), 1–12. doi:10.1016/S0011-9164(99)00083-1
Höpner, T., & Windelberg, J. (1997). Elements of environmental impact studies on coastal desalination plants. Desalination, 108, 11–18. Retrieved from http://www.sciencedirect.com/science/article/pii/S0011916497000039
israel ministry of the environment. (2003). Air pollution public health risks in two israeli Metropolitan Areas.
Jaccard, P. (1912). The distribution of the flora in the alpine zone. 1. New Phytologist, XI(2). Retrieved from http://onlinelibrary.wiley.com/doi/10.1111/j.1469-8137.1912.tb05611.x/abstract
Jay, S., Jones, C., Slinn, P., & Wood, C. (2007). Environmental impact assessment: Retrospect and prospect. Environmental Impact Assessment Review, 27(4), 287–300. doi:10.1016/j.eiar.2006.12.001
Kress, N., & Galil, B. (2008). The marine environmental footprint of seawater desalination in Israel, 18–25.
Kress, N., Galil, B. S., & Shoham-Frider, E. (2005). Marine monitoring for future
Palmachim desalination plant. Haifa, Israel.
Kress, N., Galil, B. S., & Shoham-Frider, E. (2009). Marine monitoring of brine discharge
area at Palmachim desalination plant- Final report for 2008 (pp. 1–61). Haifa, Israel.
Kress, N., Galil, B. S., & Shoham-Frider, E. (2010). Marine monitoring of brine discharge
area at Palmachim desalination plant- Final report for 2009. Haifa, Israel.
© T
echn
ion
- Isr
ael I
nstit
ute
of T
echn
olog
y, E
lyac
har C
entra
l Lib
rary
61
Kress, N., Galil, B. S., & Shoham-Frider, E. (2011). Marine monitoring of brine discharge
area at Palmachim desalination plant- Final report for 2010. Haifa, Israel.
Kress, N., Galil, B. S., & Shoham-Frider, E. (2012). Marine monitoring of brine discharge
area at Palmachim desalination plant- Final report for 2011. Haifa, Israel.
Lattemann, S., H., K. M., Damitz, B. S., Khordagui, H. K., & Leslie, G. (2008). Resource
and Guidance Manual for Environmental Impact Assessments. … Programme, Nairobi, Kenya. Retrieved from http://scholar.google.com/scholar?hl=en&btnG=Search&q=intitle:Resource+and+Guidance+Manual+for+Environmental+Impact+Assessments#0
Lattemann, S., & Höpner, T. (2008). Environmental impact and impact assessment of seawater desalination. Desalination, 220(1-3), 1–15. doi:10.1016/j.desal.2007.03.009
Leopold, L. (1971). A procedure for evaluating environmental impact. Retrieved from http://books.google.com/books?hl=en&lr=&id=FYguAAAAMAAJ&oi=fnd&pg=PA8&dq=A+PROCEDURE+FOR+EVALUATING+ENVIRONMENTAL+IMPACT&ots=zq1dmzitbx&sig=IAnNN7_7YdB7L5S_Sk3AF-ODIX8
Liu, N., Yen, C., Fang, Z., Tate, J. E., Jiang, B., Parashar, U. D., … Duan, Z. (2012). Projected health impact and cost-effectiveness of rotavirus vaccination among children <5 years of age in China. Vaccine, 30(48), 6940–5. doi:10.1016/j.vaccine.2012.05.084
MAP. (2003). ASSESSMENT OF SEA WATER DESALINATION ACTIVITIES IN THE
MEDITERRANEAN REGION AND ENVIRONMENTAL IMPACTS. Atherns.
Mathers, C., Vos, T., Lopez, A., Salomon, J., & Ezzati, M. (2001). National Burden of
Disease Studies: A Practical Guide. Edition 2.0. Geneva.
Mauguin, G., & Corsin, P. (2005). Concentrate and other waste disposals from SWRO plants: characterization and reduction of their environmental impact. Desalination, 182(1-3), 355–364. doi:10.1016/j.desal.2005.02.033
Miraglia, S. G. E. K., Saldiva, P. H. N., & Böhm, G. M. (2005). An evaluation of air pollution health impacts and costs in São Paulo, Brazil. Environmental Management, 35(5), 667–76. doi:10.1007/s00267-004-0042-9
Murray, C. J. L., & Lopez, A. D. (1996). Evidence-Based Health Policy-Lessons from the Global Burden of Disease Study Christopher. Science (New York, N.Y.), 274.
Neuparth, T., Costa, F. O., & Costa, M. H. (2002a). Effects of temperature and salinity on life history of the marine amphipod Gammarus locusta. Implications for ecotoxicological testing. Ecotoxicology (London, England), 11(1), 61–73. Retrieved from http://www.ncbi.nlm.nih.gov/pubmed/11895015
Neuparth, T., Costa, F. O., & Costa, M. H. (2002b). Effects of temperature and salinity on life history of the marine amphipod Gammarus locusta. Implications for ecotoxicological testing. Ecotoxicology (London, England), 11(1), 61–73.
© T
echn
ion
- Isr
ael I
nstit
ute
of T
echn
olog
y, E
lyac
har C
entra
l Lib
rary
62
Ostro, B. (2004). Outdoor air pollution Assessing the environmental burden of disease at
national and local levels. Geneva.
Pareto. (2008). External Costs of air pollution as a result of energy production in Israel. Retrieved from http://www.sviva.gov.il/InfoServices/ReservoirInfo/ResearchAndPublications/Pages/Publications/P0401-P0500/P0491.aspx
Pope, C. A. (2000). Review: Epidemiological Basis for Particulate Air Pollution Health Standards. Aerosol Science and Technology, 32(1), 4–14. doi:10.1080/027868200303885
Pope, C. A., Burnett, R. T., Thun, M. J., Calle, E. E., Krewski, D., Ito, K., & Thurston, G. D. (2002). Lung cancer, cardiopulmonary mortality, and long-term exposure to fine particulate air pollution. JAMA: The Journal of …, 287(9). Retrieved from http://jama.ama-assn.org/content/287/9/1132.short
Prüss-Üstün, A., Corvalán, C., Mathers, C., & Woodward, A. (2003). Introduction and methods: assessing the environmental burden of disease at national and local levels. Retrieved from http://www.popline.org/node/251104
Raventos, N., Macpherson, E., & García-Rubiés, A. (2006). Effect of brine discharge from a desalination plant on macrobenthic communities in the NW Mediterranean. Marine
Environmental Research, 62(1), 1–14. doi:10.1016/j.marenvres.2006.02.002
Ruso, Y. D. P., Carretero, J. a D. L. O., Casalduero, F. G., & Lizaso, J. L. S. (2007a). Spatial and temporal changes in infaunal communities inhabiting soft-bottoms affected by brine discharge. Marine Environmental Research, 64(4), 492–503. doi:10.1016/j.marenvres.2007.04.003
Ruso, Y. D. P., Carretero, J. a D. L. O., Casalduero, F. G., & Lizaso, J. L. S. (2007b). Spatial and temporal changes in infaunal communities inhabiting soft-bottoms affected by brine discharge. Marine Environmental Research, 64(4), 492–503. doi:10.1016/j.marenvres.2007.04.003
Sachs, J. D. (2002). Macroeconomics and Health: Investing in Health for Economic
Development. Nature Medicine (Vol. 8, pp. 551–552). Geneva. doi:10.1038/nm0602-551b
Sadhwani, J. J., Veza, J. M., & Santana, C. (2005). Case studies on environmental impact of seawater desalination. Desalination, 185(1-3), 1–8. doi:10.1016/j.desal.2005.02.072
Sánchez-Lizaso, J. L., Romero, J., Ruiz, J., Gacia, E., Buceta, J. L., Invers, O., … Manzanera, M. (2008). Salinity tolerance of the Mediterranean seagrass Posidonia oceanica: recommendations to minimize the impact of brine discharges from desalination plants. Desalination, 221(1-3), 602–607. doi:10.1016/j.desal.2007.01.119
Sandoval-Gil, J. M., Marín-Guirao, L., & Ruiz, J. M. (2012). The effect of salinity increase on the photosynthesis, growth and survival of the Mediterranean seagrass Cymodocea
© T
echn
ion
- Isr
ael I
nstit
ute
of T
echn
olog
y, E
lyac
har C
entra
l Lib
rary
63
nodosa. Estuarine, Coastal and Shelf Science, 115, 260–271. doi:10.1016/j.ecss.2012.09.008
Semiat, R. (2008). Critical Review Energy Issues in Desalination Processes. ENVIRONMENTAL SCIENCE & TECHNOLOGY, 42(22), 8193–8201.
Small, K., & Kazimi, C. (1995). On the costs of air pollution from motor vehicles. Journal
of Transport Economics and Policy. Retrieved from http://www.jstor.org/stable/20053058
Tenne, A. (2012). Sea water desalination in Israel: Planning, coping with difficulties, and economic aspects of long-term risks. Shared Borders, Shared Waters: Israeli-
Palestinian …, (October), 1–13. Retrieved from http://books.google.com/books?hl=en&lr=&id=ggnP_cgaDkEC&oi=fnd&pg=PA263&dq=Sea+Water+Desalination+in+Israel+:+Planning+,+coping+with+difficulties+,+and+economic+aspects+of+long-term+risks&ots=F0ubT0DfOY&sig=QTOUtoq8BI_h6M5KhvM3kRxU4WE
United Nations Environmental programe. (2002). seawater desalination in mediterranean countries: assessment of environmental impacts and proposed guidelines for the management of brine. Image. Venice, Italy. Retrieved from http://195.97.36.231/dbases/MAP publications (Word)/Informal doc English/Informal Doc 02/BUR 59 Inf 4. Informal doc.doc
WHO. (2002). The World Health Report.
Yuval, Dubowski, Y., & Broday, D. M. (2007). Allocation of routinely monitored mixing ratios of nitrogen oxides to their sources. Environmental Science & Technology, 41(21), 7215–21. Retrieved from http://www.ncbi.nlm.nih.gov/pubmed/18044491
י ל ביב בו 2009די וח . (n.d.).
© T
echn
ion
- Isr
ael I
nstit
ute
of T
echn
olog
y, E
lyac
har C
entra
l Lib
rary

מתקן של הסביבה על השפעה לבחינת כמותית גישה פיתוח
התפלה:
ציון שבי בוחן מקרה
חיבור על מחקר לשם מילוי חלקי של הדרישות לקבלת התואר
מגיסטר למדעים בהנדסה סביבתית
הרפז גילי נוי
מכון טכנולוגי לישראל -לסנט הטכניוןהוגש
2014ר אוקטובתשרי תשע"ה חיפה
© T
echn
ion
- Isr
ael I
nstit
ute
of T
echn
olog
y, E
lyac
har C
entra
l Lib
rary
המחקר נעשה בהנחייתם של פרופ' ח' דוד ברודאי ופרופ' ח' יוחאי כרמל.
.התמיכה הכספית הנדיבה בהשתלמותי אני מודה לטכניון על
© T
echn
ion
- Isr
ael I
nstit
ute
of T
echn
olog
y, E
lyac
har C
entra
l Lib
rary
I
תקציר
ניתן להפריד מלחים ומינרלים ממים התפלה היא טכנולוגיה המשלבת מספר תהליכים שבעזרתם
ולהפיק מי שתייה. התפלה של מי ים ומים מליחים מאוד נפוצה בכל העולם. התפוקה של מים
. כחלק מתוכנית מתאר 2040מיליארד מ"ק עד שנת 1.75-מותפלים בישראל מתוכננת להגיע ל
מתקן התפלה נוסף באזור הגליל המערבי, ליד שבי 2018,מתוכנן לקום עד שנת 2/3/ב/34ארצית
מיליון מ"ק מים מותפלים לאוכלוסייה ההולכת וגדלה של אזור 50 -ציון. המתקן מתוכנן לספק כ
מיליון מ"ק 100 -, המתקן צפוי להגדיל את התפוקה שלו לכ2020חיפה והגליל המערבי. עד שנת
ם בשנה. בתפוקה כזו המתקן ידרוש הקמה של תחנת כוח בקנה מידה קטן על מנת מים מותפלי
לספק את דרישות האנרגיה שלו.
הערכת השפעה על הסביבה הוא תהליך שנעשה במטרה להעריך את הנזק הפוטנציאלי שיכול
להיגרם מפרויקט מתוכנן או קיים. את ההשפעה על הסביבה של מתקני התפלה ניתן לייחס, ברוב
המקרים, לצריכת אנרגיה גבוהה, לנזק פוטנציאלי לסביבה הימית כתוצאה משחרור רכז לים
ולשימוש בקרקע לאורך החוף, אזור בעל ערך אקולוגי ותיירותי גבוה.
מחקרים שנעשו עד היום בתחום הערכת השפעה על הסביבה של מתקני התפלה ניתן לסווג
אויר ובריאות הציבור. בתחום הערכת ההשפעה להערכת ההשפעה על הסביבה הימית ועל זיהום
על הסביבה הימית נבדקה בעיקר ההשפעה של התמלחת, תוצר לוואי של תהליך ההתפלה על
מינים וחברות באיזור הקרוב לנקודת שחרור הרכז. בנוסף פותחו מספר שיטות להערכה כמותית
ג ההשפעה למספר פרמטרים, של ההשפעה על הסביבה. שיטות אילו נותנות הערכה גרפית או סיוו
אך לא השפעה כמותית כוללת ואובייקטיבית.
בתחום הערכת ההשפעה על זיהום האויר ובריאות הציבור נעשו מספר מחקרים לחישוב כמותי
של ההשפעה. מחקרים מסוימים חישבו את מספר מקרי המחלה שניתן לייחס לפליטה של חומר
גו את ההשפעה כמספר שנים שאבד כתוצאה ממקרי מסוים בכמות מסוימת. מחקרים אחרים הצי
מחלה ומוות שניתן לייחס לכמות מזהמים שנפלטה ממקור מסוים. כל מחקר התאים את עצמו
לתחום ספציפי מבחינת רמת הדיוק הדרושה ודרך ההצגה של הנתונים.
ות. קיימות שיטות שונות להערכת השפעה על הסביבה של פרויקטים שונים מנקודות מבט שונ
לשיטות המיושמות היום יש מספר חסרונות. ראשית, השיטות הנפוצות היום, בעיקר בתחום
ההערכה על הסביבה הימית, הן בעיקרן שיטות איכותיות, היוצרות הערכה שהיא בעיקרה
איכותית, על פני כמותית. הערכה כזו קשה נורא ליישם כשמדובר בהסקת מסקנות והחלטה על
מקבלי ההחלטות הם בד"כ אנשים שאינם אנשי מקצוע בתחום איכות צעדים בפועל. שנית,
הסביבה ועל כן הערכה איכותית המורכבת ממושגים מתחום איכות הסביבה לא תספק את הידע
הדרוש להם על מנת לקבל החלטה מושכלת ונכונה. הצגת תוצאות מחקרי הערכת השפעה על
לתרום רבות למקבלי ההחלטות ולציבור הסביבה בפרמטרים כמותיים ולא איכותיים יכולה
הרחב לקבל, להבין וליישם החלטות בדבר פרויקטים בתחום איכות הסביבה.
© T
echn
ion
- Isr
ael I
nstit
ute
of T
echn
olog
y, E
lyac
har C
entra
l Lib
rary
II
מטרת העל של המחקר הייתה לפתח שיטה חדשה להערכת השפעה על הסביבה של מתקני
התפלה. המחקר עסק בשתי השפעות עיקריות של מתקן התפלה, השפעה על הסביבה הימית
זיהום האויר ועל בריאות הציבור. עבור שתי ההשפעות הללו פותחו שיטות חדשות והשפעה על
שמציגות את התוצאות כערך כמותי, ואף כספי.
שיטת ההערכה בתחום השפעה על הסביבה הימית מורכבת מנקודת מבט כוללת על המערכת
צור ראשוני, האקולוגית. על מנת לתאר את ההשפעה על כלל המערכת נבחרו שלושה פרמטרים: יי
מגוון מינים ופירוק ביולוגי. עבור כל פרמטר פותח סולם שמתאר את ההשפעה, מהשפעה
מינימלית ועד נזק חמור לאותו פרמטר. שיטה זו הודגמה בעזרת נתוני ניטור של מתקן ההתפלה
בפלמחים. מתקן הפעל בשנים שנבדקו באותה תפוקה המתוכננת במתקן בשבי ציון. ההערכה היא
ביוטיים )עומק, טמפרטורה, מליחות( בסביבה הימית דומים בשני האזורים -פרמטרים האכי ה
ועל כן מידת ההשפעה על המערכת האקולוגית תהיה דומה גם כן.
שיטת ההערכה בתחום השפעה על זיהום אויר ובריאות הציבור בנויה בצעדים קבועים מראש,
שיטה זו שופרה והותאמה למחקרים .ExternEומבוססת על פרויקט של האיחוד האירופי,
המבוצעים בישראל ע"י הוספת מספר נתיבים אפשריים של עבודה, כתלות ברמת הדיוק הנדרשת
ובנתונים הקיימים. השיטה התייחסה למספר אלטרנטיבות אפשריות באשר לפליטות מתקן
וכן פליטה ההתפלה, ייצור חשמל בתחנת כוח ייעודית למתקן או אספקה מרשת החשמל הארצית,
בקנה מידה ארצי או בקנה מידה מקומי. השיטה הודגמה באשר למתקן ההתפלה המתוכנן בשבי
, מאחר והוא מזהם PM2.5ציון עבור כל האלטרנטיבות האפשריות. המזהם שנבחר לחישוב הוא
נפוץ המשויך לייצור אנרגיה ובעל השפעה גדולה בעיקר על מחלות לב וריאה, על כן נבדקה
ה על תמותה ממחלות אילו.ההשפע
, בהתבסס על נתוני מתקן נמצא כי ההשפעה הפוטנציאלית על הסביבה הימית באזור שבי ציון
עבור ההשפעה על זיהום היא מינימלית עבור כל הפרמטרים שנבדקו. ההתפלה הקים בפלמחים,
השפעות על כל ה PM2.5האויר ובריאות הציבור, בקנה מידה ארצי ההשפעה של עליית ריכוז
על PM2.5ש"ח. בקנה מידה מקומי ההשפעה של עליית ריכוז 1,896,800-הבריאותיות הוערכה בכ
-74,500, בעכו ונהריה, הוערכה בין 45מקרי מוות כתוצאה ממחלות לב ריאה באנשים מעל גיל
ש"ח. 1,585,500
יימים כיום ההשפעה המינימלית על הסביבה הימית שנקבעה במחקר נוגדת את רוב המחקרים הק
הטוענים כי למתקני התפלה השפעה מכרעת על הסביבה הימית. קיימות מספר סיבות בעזרתן
ניתן להסביר זאת. הסיבה הראשונה הינה סיבה טכנית. רוב המחקרים כיום בודקים השפעה על
מין אחד או חברת מינים. המחקר הזה הסתכל על שלושה פרמטרים יחד כאשר מספר המינים
חד הפרמטרים, לכן לשינוי במספר המינים השפעה יחסית נמוכה יותר על ההערכה הינו רק א
הכוללת משאר המחקרים, סביר להניח שעובדה זו השפיע על התוצאה הסופית של המחקר. שנית,
מאחר ומספר הנתונים בעזרתם נעשה הניתוח הסטטיסטי היה קטן, נאלצתי להשתמש במבחן
ו קיימים יותר נתונים אפשר היה להשתמש במבחן סטטיסטי סטטיסטי לא פרמטרי. במידה והי
מדויק יותר והתוצאה הייתה שונה.
© T
echn
ion
- Isr
ael I
nstit
ute
of T
echn
olog
y, E
lyac
har C
entra
l Lib
rary
III
בתחום הערכת ההשפעה על זיהום האוויר ועל בריאות הציבור ההשפעות המחושבות הן בקנה
מידה ארצי והן בקנה מידה מקומי הראו השפעה לא מבוטלת בחיי אדם כתוצאה מייצור אנרגיה
אלטרנטיבות )יצור חשמל מקומי או שתי העבור התפלה המתוכנן בשבי ציון. בנוסף, עבור מתקן ה
בעוד שצריכת חשמל השפעות המחושבות הראו ערכים דומים. כלומר, שימוש בחשמל מהרשת( ה
נמוכים אוויר ריכוזי מזהמימהרשת מלווה בתרומה קטנה יותר לפליטות מזהמי אוויר ולכן ל
אנשים יכולים להיות מושפעים, יותר לכןגדול יותר והמושפע מהעלייה בריכוזים שטח היותר,
מאידך, ייצור חשמל .נמוכההצפויה של ההשפעה זו על בריאות הציבור חומרה הרמת אם כי
םפחות מקרי באזור הסמוך. לכן, למרות שצפוייםריכוזים גבוהים יותר צפוי לגרום ל מקומי
של ההשפעה הרפואית צפןייה להיות חומרה הארצי דרגת ל הוא מקרה בו ייצור החשמביחס ל
גבוהה יותר.
ן שלא קיימות תכניות בנייה עבור מתקן ההתפלה המתוכנן בשבי ציון, לא ניתן היה להעריך ומכיו
את ההשפעה של המתקן ברמת דיוק גבוהה. למרות זאת, המחקר עשה צעד משמעותי קדימה
השפעה על הסביבה לא ה כמותית שלוש רחב יותר בכלי של הערכלכיוון העלאת הפופולריות ושימ
רק לבעלי מקצוע, אלא גם למקבלי ההחלטות ולציבור הרחב.
שתי לאחד בין תוצאות הערכת ההשפעה על הסביבה בשני התחומים שנבדקו.מציע המחקר לא רונות של דרכים שונות לאחוד התוצאות מוצגות, וכן הרעיון שיש לבחון את היתרונות והחס
.איחוד התוצאות בכל מחקר של השפעה על הסביבה.
© T
echn
ion
- Isr
ael I
nstit
ute
of T
echn
olog
y, E
lyac
har C
entra
l Lib
rary