the teaching and learning toolkit · pdf filethe teaching and learning toolkit ... cost...
TRANSCRIPT
THE TEACHING AND LEARNING TOOLKIT
TECHNICAL APPENDICES
Professor Steve Higgins
Durham University
Dimitra Kokotsaki
and
Professor Robert Coe
CEM Centre, Durham University
July 2012

2
TEACHING AND LEARNING TOOLKIT
TECHNICAL APPENDICES
Overview ........................................................................................................................................................... 3
Appendix 2: Cost effectiveness estimates.................................................................................................... 6
Appendix 3: Effect size: what it is, what it means and how it is calculated .............................................. 7
Appendix 4: Meta-analysis and ‘super-synthesis’ of intervention research in education ..................... 13
Appendix 5: Effect size: what it is, what it means and how it is calculated ............................................ 17
Appendix 6: Data table of meta-analyses and other studies used to estimate effect sizes .................. 32
Appendix 7: Bibliography of meta-analyses and other studies used to estimate effect sizes ............. 35

3
OVERVIEW
The aim of these appendices is to set out some of the assumptions and methods used in the synthesis of
effect sizes in the Sutton Trust-EEF Teaching and Learning Toolkit. The primary aim is to provide schools
with evidence from education research which will help them to make informed decisions about spending to
support the learning of disadvantaged pupils. Our emphasis is on identifying comparative messages from
existing research. In summarising each particular field a number of judgements have had to be made about
the applicability of the research evidence to the challenge of supporting learners from disadvantaged
backgrounds. This set of appendices sets out the rationale and sources of evidence for these decisions.
There are of course some limitations and caveats. The quality of the evidence is variable and one of the
issues in meta-analysis is that some of the subtleties of these issues are lost in aggregation. There is also
considerable variation in each of the fields that have been summarised for the Toolkit. There are examples
within each area where interventions have been successful in improving attainment and have been
unsuccessful. The most successful approaches have had their failures and the least successful their
triumphs. This summarisation, which aims only to provide an overall ‘best bet’, therefore masks these
differences. What we are saying is that the existing evidence so far suggests that some areas are likely to be
more productive of success than others and that meta-analysis provides the best evidence for this. What we
are not saying is that unsuccessful approaches can never work nor that approaches like feedback and
metacognitive approaches will always work in a new context, with different pupils, a different curriculum and
undertaken by different teachers.
Overall we think that the messages are encouraging for teachers. It shows that they can make a difference
and that they are the most important people in the education system who are able make that difference to
children and young people’s learning. However, we think that the evidence indicates that that the challenge
is to get the pupils to work harder, not the teachers. Learners need to engage in activities which make them
think harder, more deeply and more frequently. They also need to learn what is expected in different subjects
and to develop strategies to help them when they get stuck. Above all they should believe they should
succeed through effort and that they should be able to seek and respond to feedback to improve their
learning.
We should also make it clear that we do not believe that there are any guarantees from the evidence.
Teachers and schools will need to try out these ideas and evaluate their usefulness in improving learning.
Sometimes this needs perseverance or effort to create the conditions in which learners can respond to
feedback or take more responsibility for their learning. Another way of looking at these approaches is seeing
them as means to set up a context in which learning is more or less likely to improve. The actual
improvement will depend on the extent to which learners actually think harder more deeply or more
frequently about what is being learned and their teachers can support, challenge, extend and develop this
thinking.

4
APPENDIX 1: RESOURCES AND PUPIL LEARNING
It is difficult to establish a clear link between educational expenditure and pupils’ learning. Analysis of
spending per pupil and scores on the Third International Maths and Science Study (TIMSS) found ‘no
association between spending levels and average academic achievement’ even after controlling for variables
such as family background and school characteristics (Hanushek & Woessman, 2010). However, most of the
studies have been undertaken at the system level (e.g. whole countries, states or local authorities) where the
relationship between allocation of resources and differences in schools and teachers and pupils is highly
complex. It may seem obvious that more money offers the possibilities for a better or higher quality
educational experience, but the evidence suggests that it is not simply a question of spending more to get
better results. This may be because in the UK and other developed countries we broadly spend reasonably
efficiently and increased effectiveness comes at much greater cost (Steele et al., 2007). Much of the early
research in this area failed to find a convincing connection for a range of reasons (Burtless, 1996), though
meta-analyses of such studies indicated there was a sufficient connection to warrant increased spending
(e.g. Greenwald et al. 1998). More recent research suggests that there is a link between spending and
outcomes, but that it is a complex picture (e.g. Vignoles et al., 2000) and that higher quality data sets are
required to understand the mechanisms by which spending and learning are associated (Levačić & Vignoles,
2002). Some analyses suggest that the effects of greater spending tend to influence mathematics and
science more than English in UK secondary schools (Steele et al., 2007).
Investing for better learning, or spending so as to improve learning, is therefore not easy, particularly when
the specific aim is to support disadvantaged learners whose educational trajectories are harder to influence.
Much depends on the context, the school, the teachers (their levels of knowledge and experience), the
learners (their level of attainment and their social background) and the educational outcomes that you want
to improve (knowledge, skills or dispositions). Improving test scores in arithmetic in the short term, for
example, may not raise students’ aspirations for what further learning in mathematics may accomplish for
them. There is some evidence where interventions have been costed that spending can be used effectively
to bring about measurable improvement. However these estimates vary considerably. Wiliam (2002), for
example, estimated the cost of a formative assessment project with an effect size of 0.32 on pupil attainment
was about £2000 per teacher per year. A recent evaluation of Every Child a Reader (Tanner et al., 2011)
estimates costs of £3100 in the first year and £2600 per year subsequently per child with an average reading
gain of 13% (non-significant, p142) (estimated at an effect size of about 0.14: Glass, McGaw & Smith, 1981:
136).
We interpret the lack of a clear causal link between general additional spending and learning to mean that it
is difficult to spend additional resource effectively to improve learning and to increase attainment, but that
there must be some areas which offer better prospects than others. This is what this Toolkit seeks to
provide. We also think that the evidence shows that if schools want to use any additional resource, such as
the pupil premium, to benefit disadvantaged learners they should not assume that any increased allocation
alone will improve learning, but they will need to decide specifically and deliberately how it should be spent,
and then evaluate the impact of this for themselves. The existing research indicates that this is challenging
but achievable task.
REFERENCES
Burtless, G. (ed.) (1996). Does Money Matter? The Effect of School Resources on Student Achievement and Adult Success. Washington, D.C.: Brookings Institute Press.
Glass, G.V., McGaw, B. & Smith, M.L. (1981). Meta-analysis in social research Beverly Hills, Ca: Sage. Greenwald, R, Hedges, LV, and Laine, RD (1996). 'The Effect of School Resources on Student
Achievement'. Review of Educational Research, 66(3), 361-396. Hanushek, E., and Woessman, L. (2010). The economics of international differences in educational
achievement. NBER Working Paper 15949, April 2010, p18 Levačić, R., & Vignoles, A. (2002). Researching the links between school resources and student outcomes in
the UK: a review of issues and evidence. Education Economics 10 (3), 312-331. Tanner, E., Brown, A., Day, N., Kotecha, M., Low, N., Morrell, G., Brown, V., Collingwood, A., Chowdry, H.,
Greaves, E., Harrison, C., Johnson, G., & Purdon, S. (2011). Evaluation of Every Child a Reader (ECar): Research Report DFE-RR114 London: Department for Education.

5
Steele, F., Vignoles, A., & Jenkins, A. (2007). The effect of school resources on pupil attainment: a multilevel simultaneous equation modeling approach. Journal of Royal Statistical Society Series A,.170(3), 801-824.
Vignoles, A., Levacic, R., Walker, J., Machin, S. & Reynolds, D. (2000). The Relationship Between Resource Allocation and Pupil Attainment: A Review London: Department for Education and Employment.
Wiliam, D. (2002). ‘Linking Research and Practice: knowledge transfer or knowledge creation?’ Plenary presentation at the annual conference of the North American Chapter of the International Group for the Psychology of Mathematics Education, Athens, Georgia, USA, October 2002.
6
APPENDIX 2: COST EFFECTIVENESS ESTIMATES
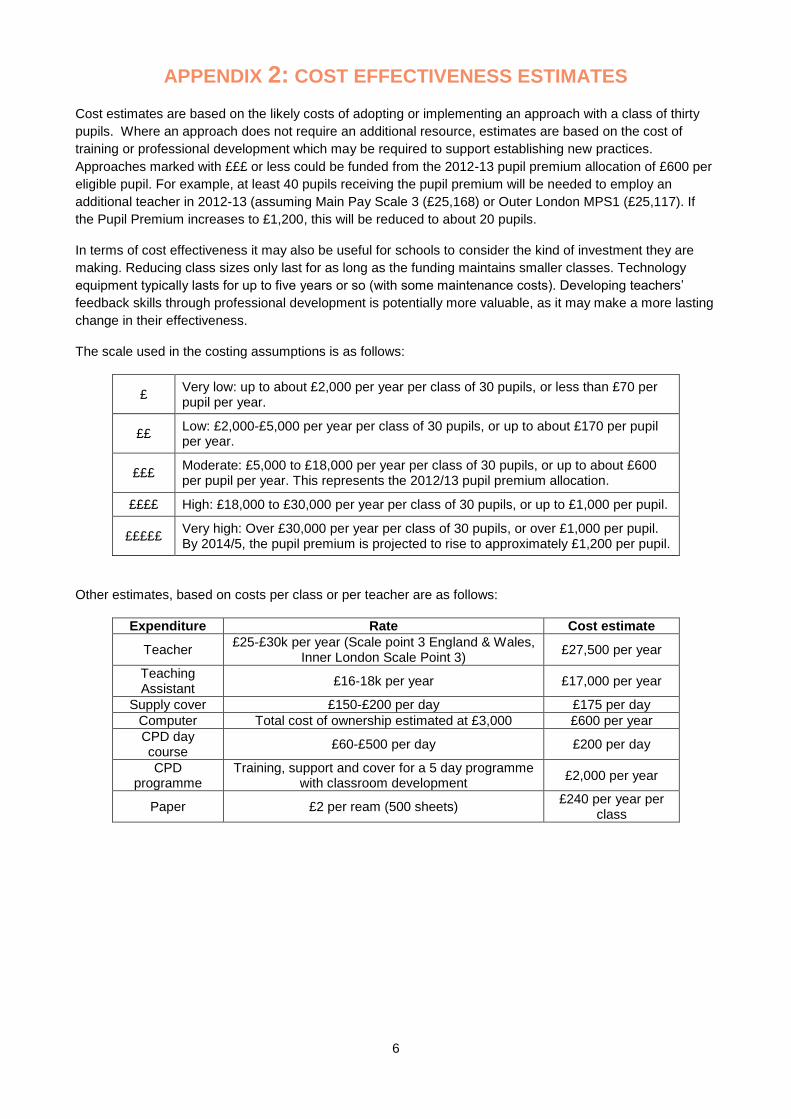
Cost estimates are based on the likely costs of adopting or implementing an approach with a class of thirty
pupils. Where an approach does not require an additional resource, estimates are based on the cost of
training or professional development which may be required to support establishing new practices.
Approaches marked with £££ or less could be funded from the 2012-13 pupil premium allocation of £600 per
eligible pupil. For example, at least 40 pupils receiving the pupil premium will be needed to employ an
additional teacher in 2012-13 (assuming Main Pay Scale 3 (£25,168) or Outer London MPS1 (£25,117). If
the Pupil Premium increases to £1,200, this will be reduced to about 20 pupils.
In terms of cost effectiveness it may also be useful for schools to consider the kind of investment they are
making. Reducing class sizes only last for as long as the funding maintains smaller classes. Technology
equipment typically lasts for up to five years or so (with some maintenance costs). Developing teachers’
feedback skills through professional development is potentially more valuable, as it may make a more lasting
change in their effectiveness.
The scale used in the costing assumptions is as follows:
£ Very low: up to about £2,000 per year per class of 30 pupils, or less than £70 per pupil per year.
££ Low: £2,000-£5,000 per year per class of 30 pupils, or up to about £170 per pupil per year.
£££ Moderate: £5,000 to £18,000 per year per class of 30 pupils, or up to about £600 per pupil per year. This represents the 2012/13 pupil premium allocation.
££££ High: £18,000 to £30,000 per year per class of 30 pupils, or up to £1,000 per pupil.
£££££ Very high: Over £30,000 per year per class of 30 pupils, or over £1,000 per pupil. By 2014/5, the pupil premium is projected to rise to approximately £1,200 per pupil.
Other estimates, based on costs per class or per teacher are as follows:
Expenditure Rate Cost estimate
Teacher £25-£30k per year (Scale point 3 England & Wales,
Inner London Scale Point 3) £27,500 per year
Teaching Assistant
£16-18k per year £17,000 per year
Supply cover £150-£200 per day £175 per day
Computer Total cost of ownership estimated at £3,000 £600 per year
CPD day course
£60-£500 per day £200 per day
CPD programme
Training, support and cover for a 5 day programme with classroom development
£2,000 per year
Paper £2 per ream (500 sheets) £240 per year per
class

7
APPENDIX 3: EFFECT SIZE: WHAT IT IS, WHAT IT MEANS
AND HOW IT IS CALCULATED
WHAT IS AN EFFECT SIZE?
Effect size is a key measure in intervention research and an important concept in the methodology of the
Toolkit. It is basically a way of measuring the extent of the difference between two groups. It is easy to
calculate, readily understood and can be applied to any measured outcome for groups in education or in
research more broadly.
The value of using an effect size is that it quantifies the effectiveness of a particular intervention, relative to a
comparison group. It allows us to move beyond the simplistic, ‘Did it work (or not)?' to the far more important,
'How well did it work across a range of contexts?' It therefore supports a more scientific and rigorous
approach to the accumulation of knowledge, by placing the emphasis on the most important aspect of the
intervention – the size of the effect – rather than its statistical significance, which conflates the effect size and
sample size. For these reasons, effect size is the most important tool in reporting and interpreting
effectiveness, particularly when drawing comparisons about relative effectiveness of different approaches.
The basic idea is to compare groups, relative to the distribution of scores. This is the standardised mean
difference between two groups. There has been some debate over the years about exactly how to calculate
the effect size (see below), however in practice most of the differences in approaches are small in the
majority of contexts where effect sizes are calculated using data on pupils’ learning.
For those concerned with statistical significance, it is still readily apparent in the confidence intervals
surrounding an effect size. If the confidence interval includes zero, then the effect size would be considered
not to have reached conventional statistical significance. The advantage of reporting effect size with a
confidence interval is that it lets you judge the size of the effect first and then decide the meaning of
conventional statistical significance. So a small study with an effect size of 0.8, but with a confidence interval
which includes zero, might be more interesting educationally that a larger study with a negligible effect of
0.01, but which is statistically significant.
WHAT DOES IT MEAN?
So, as an example, suppose we have two classes of 25 students, one class is taught using a feedback
intervention, the other is taught as normal. The classes are equivalent before the intervention. The
intervention is effective with an effect size of 0.8. This means that the average person in the class receiving
the feedback intervention (i.e. the one who would have been ranked 12th or 13
th in their class) would now
score about the same as the person ranked 6th in a control class which had not received the intervention.
Visualising these two individuals provides a valuable interpretation of the difference between the two effects
(see Figure 1).
Another way to interpret effect sizes is to compare them with effect sizes of differences that are familiar. For
example, Cohen (1969, p23) describes an effect size of 0.2 as 'small', and gives to illustrate the point an
example that the difference between the heights of 15 year old and 16 year old girls in the US corresponds
to an effect of this size.
An effect size of 0.5 is described as 'medium' and is 'large enough to be visible to the naked eye'. A 0.5
effect size corresponds to the difference between the heights of 14 year old and 18 year old girls. Cohen
describes an effect size of 0.8 as 'grossly perceptible and therefore large' and equates it to the difference
between the heights of 13 year old and 18 year old girls.
As a further example he states that the difference in IQ between holders of the PhD and 'typical college
freshmen' is comparable to an effect size of 0.8.

8
FIGURE 1: AN EFFECT SIZE OF 0.8
Although this labelling also corresponds with the overall distribution of effects found in education research
with an average around 0.4 (Sipe and Curlette, 1997; Hattie and Timperley, 2007), a ‘small’ effect may be
educationally important if, for example, it is easy or cheap to attain or is achievable with groups who are
otherwise hard to influence. Similarly a large effect size may not be as important if is unrealistic to bring
about in normal circumstances. Cohen does acknowledge the danger of using terms like 'small', 'medium'
and 'large' out of context. Glass and colleagues (1981, p104) are particularly critical of this approach, arguing
that the effectiveness of a particular intervention can only be interpreted in relation to other interventions that
seek to produce the same effect. They also point out that the practical importance of an effect depends
entirely on its relative costs and benefits. In education, if it could be shown that making a small and
inexpensive change would raise academic achievement by an effect size of even as little as 0.1, then this
could be a very significant improvement, particularly if the improvement applied uniformly to all students, and
even more so if the effect were cumulative over time.
As a standardised metric an effect size can also be converted to other measures for comparison: e.g.
“students at Phoenix Park outperformed those at Amber Hill in the national school-leaving examination (the
General Certificate of Secondary Education, or GCSE) by, on average, one third of a grade, equivalent to a
standardized effect size of 0.21” (Wiliam et al. 2004: 50). So using this conversion, an effect size of 0.8
would be equivalent to an improvement of just over one GCSE grade.
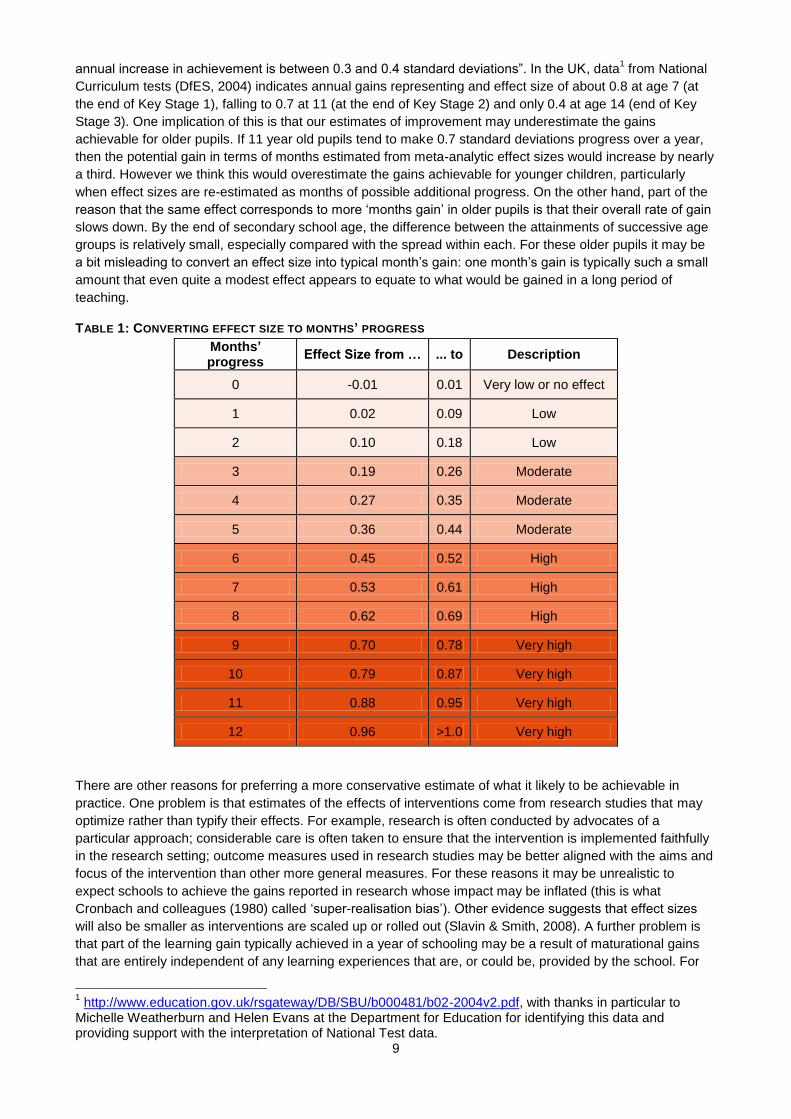
In the toolkit we have equated school progress in months to effect size as a crude but meaningful equivalent
(see Table 1, below). We have assumed that a year of progress is about equivalent to one standard
deviation per year and corresponds with Glass’ observation that “the standard deviation of most achievement
tests in elementary school is 1.0 grade equivalent units; hence the effect size of one year’s instruction at the
elementary school level is about +1” (Glass, 1981: 103). However, we should note that the correspondence
of one standard deviation to one year’s progress can vary considerably for different ages and types of test.
It is also the case that effect size difference reduces with age. Bloom and colleagues (2008) estimate annual
progress on tests drops from 1.52 to 0.06 for reading and from 1.14 to 0.01 for mathematics in the US from
Kindergarten to Grade 12. Wiliam (2010) estimates “apart from the earliest and latest grades, the typical
9
annual increase in achievement is between 0.3 and 0.4 standard deviations”. In the UK, data1 from National
Curriculum tests (DfES, 2004) indicates annual gains representing and effect size of about 0.8 at age 7 (at
the end of Key Stage 1), falling to 0.7 at 11 (at the end of Key Stage 2) and only 0.4 at age 14 (end of Key
Stage 3). One implication of this is that our estimates of improvement may underestimate the gains
achievable for older pupils. If 11 year old pupils tend to make 0.7 standard deviations progress over a year,
then the potential gain in terms of months estimated from meta-analytic effect sizes would increase by nearly
a third. However we think this would overestimate the gains achievable for younger children, particularly
when effect sizes are re-estimated as months of possible additional progress. On the other hand, part of the
reason that the same effect corresponds to more ‘months gain’ in older pupils is that their overall rate of gain
slows down. By the end of secondary school age, the difference between the attainments of successive age
groups is relatively small, especially compared with the spread within each. For these older pupils it may be
a bit misleading to convert an effect size into typical month’s gain: one month’s gain is typically such a small
amount that even quite a modest effect appears to equate to what would be gained in a long period of
teaching.
TABLE 1: CONVERTING EFFECT SIZE TO MONTHS’ PROGRESS
Months’ progress
Effect Size from … ... to Description
0 -0.01 0.01 Very low or no effect
1 0.02 0.09 Low
2 0.10 0.18 Low
3 0.19 0.26 Moderate
4 0.27 0.35 Moderate
5 0.36 0.44 Moderate
6 0.45 0.52 High
7 0.53 0.61 High
8 0.62 0.69 High
9 0.70 0.78 Very high
10 0.79 0.87 Very high
11 0.88 0.95 Very high
12 0.96 >1.0 Very high
There are other reasons for preferring a more conservative estimate of what it likely to be achievable in
practice. One problem is that estimates of the effects of interventions come from research studies that may
optimize rather than typify their effects. For example, research is often conducted by advocates of a
particular approach; considerable care is often taken to ensure that the intervention is implemented faithfully
in the research setting; outcome measures used in research studies may be better aligned with the aims and
focus of the intervention than other more general measures. For these reasons it may be unrealistic to
expect schools to achieve the gains reported in research whose impact may be inflated (this is what
Cronbach and colleagues (1980) called ‘super-realisation bias’). Other evidence suggests that effect sizes
will also be smaller as interventions are scaled up or rolled out (Slavin & Smith, 2008). A further problem is
that part of the learning gain typically achieved in a year of schooling may be a result of maturational gains
that are entirely independent of any learning experiences that are, or could be, provided by the school. For
1 http://www.education.gov.uk/rsgateway/DB/SBU/b000481/b02-2004v2.pdf, with thanks in particular to
Michelle Weatherburn and Helen Evans at the Department for Education for identifying this data and providing support with the interpretation of National Test data.

10
example, Luyten (e.g. 2006; Luyten et al., 2006) has shown that a substantial part (sometimes more than
half) of the difference between the attainments of pupils in successive school grades is accounted for by
differences in the ages of pupils who have experienced exactly the same schooling. The implication seems
to be (though this is somewhat speculative) that any potential accelerating effect of using the kinds of
strategies we have discussed in this report may be limited to changing the part of the year’s gain that is due
to schooling, while the growth that is due to pure maturation may be harder to affect. For these reasons we
have selected what we see as a more conservative estimate, based on effect size estimates for younger
learners, which can be improved or refined as more data becomes available about effect size transfer from
research studies to practice.
METHODS OF CALCULATION
Over the years there have been a number of methods proposed to calculate the appropriate standard
deviation for an effect size. The main approaches are listed below.
Glass's Δ
Gene V. Glass (1977) proposed an estimator of the effect size that uses only the standard deviation of the
control group, this is commonly referred to as Glass’ Δ (delta). He argued that if several interventions or
treatments were compared with the control group it would be better to use just the standard deviation from
the control group, so that effect sizes would not differ under equal means and different variances.
Cohen's d
Cohen's d is defined as the difference between two means divided by an unspecified standard deviation for
the data. This definition of Cohen's d is termed the ‘maximum likelihood estimator’ by Hedges and Olkin
(1985).
Hedges' g
Hedges' g, suggested by Larry Hedges (1981) is based on a standardized mean difference, like the other
measures, but the pooled standard deviation is computed slightly differently from Cohen's d.
d or g (corrected)?
Hedges’ g is biased for small sample sizes. However, this bias can be adjusted (g (corrected)). Hedges and
Olkin (1985) refer to this unbiased estimate as d, but it is not the same as Cohen's d. In most recent meta-
analyses when an effect size is referred to as Hedges’ g it is the bias-corrected formula which has been
used, though some studies also refer to this as d.
FINAL ISSUES
There are some notes of caution in comparing effect sizes across different kinds of interventions. Effect size
as a measure assumes a normal distribution of scores. If this is not the case then an effect size might
provide a misleading comparison. If the standard deviation of a sample is decreased (for example, if the
sample does not contain the full range of a population) or inflated (for example, if an unreliable test is used),
the effect size is affected. A smaller standard deviation will increase the effect size, a larger standard
deviation will reduce it. Another key issue is which standard deviation is chosen (Bloom et al., 2008) as this
primarily determines the comparability of the effect size. This explains the variation in methods advocated
above.
There is also evidence that there is some systematic variation in effect sizes in education. One factor, for
example, is the age of the pupils, where studies with younger learners tend to have higher effect sizes. One
reason for this is likely to be the narrower distribution of scores producing a smaller standard deviation and
therefore a larger effect size, though there is also a relationship with the subject (e.g. mathematics or
English) being researched (Hill, Bloom & Lipsey, 2009). In England the standard deviations of National Test
scores1 increase from 3.9 at age 7, to 4.3 at age 11, and 6.8 at 14 as the distribution of scores widens and
flattens (DfES, 2004).
There is also some variation associated with the type of outcome measure with larger effect sizes typically
reported in mathematics and science compared with English (e.g. Higgins et al., 2005) and for researcher

11
designed tests and teacher assessments compared with standardised tests and examinations (e.g. Hill et al.,
2007: 7).
Slavin and Smith (2009) also report that there is a relationship between sample size and effect size in
education research, with smaller studies tending to have larger effect sizes. The correlation found was -0.28
(p503), suggesting that is explains about 8% of the variation between large and small studies. The issue is
important in terms of comparing effects between different kinds of interventions which tend to be small scale
(such as areas of research looking at interventions to address special needs for example) and others which
tend to have larger samples (class size interventions for example).
Other systematic factors may also affect such comparisons. Studies reporting effect sizes with groups from
either end of the distribution (high attaining or low attaining learners) are likely to be affected by regression to
the mean if they don’t compare like with like (Shagen & Hogden, 2009). This would inflate effect sizes for low
attaining pupils (who are more likely to get higher marks on re-test) and depress effect sizes for high
performing students when they are compared with ‘average’ pupils. If the correlation between pre-test and
post-test is 0.8, regression to the mean may account for as much as 20% of the variation in the difference
between test and retest scores when comparing low and average students.
The aim of the Toolkit is not to provide definitive claims as to what will work to bring about improvement in a
new context. Rather it is an attempt to provide the best possible estimate of what is likely to be beneficial
based on existing evidence. In effect it summarises what has worked as a ‘best bet’ for what might work in
the future. The applicability of this information to a new context is always likely to need active enquiry and
evaluation to ensure it helps to achieve the desired effects.
REFERENCES
Bloom, H.S., Hill, C.J., Black, A.R. and Lipsey, M.W. (2008). Performance Trajectories and Performance Gaps as Achievement Effect-Size Benchmarks for Educational Interventions. Journal of Research on Educational Effectiveness, 1.4 pp 289-328.
Coe R, (2002). It's the Effect Size, Stupid: What effect size is and why it is important Paper presented at the Annual Conference of the British Educational Research Association, University of Exeter, England, 12-14 September 2002. Available at: http://www.leeds.ac.uk/educol/documents/00002182.htm (accessed 2/3/11).
Cohen, J. (1988). Statistical Power Analysis for the Behavioral Sciences (2nd
ed.). Hillsdale, New Jersey: Lawrence Erlbaum Associates.
Cronbach, L.J., Ambron, S.R., Dornbusch, S.M., Hess, R.O., Hornik, R.C., Phillips, D.C., Walker, D.F. & Weiner, S.S. (1980). Toward reform of program evaluation: Aims, methods, and institutional arrangements. San Francisco, Ca.: Jossey-Bass.
Department for Education and Skills (DfES) (2004). Statistics of Education: Variation in Pupil Progress 2003 London: Department for Education and Skills. Available at: http://www.education.gov.uk/rsgateway/DB/SBU/b000481/b02-2004v2.pdf (accessed 15/06/11).
Glass, G.V. (1977). Integrating Findings: The Meta-Analysis of Research. Review of Research in Education, 5: 351-379.
Glass G.V., McGaw, B. & Smith, M.L. (1981). Meta-analysis in social research Beverly Hills, Ca: Sage. Hedges, L.V. & Olkin, I. (1985). Statistical Methods for Meta-Analysis. Orland, Florida: Academic Press. Higgins, S., Hall, E., Baumfield, V., Moseley, D. (2005). A meta-analysis of the impact of the implementation
of thinking skills approaches on pupils. In: Research Evidence in Education Library. London: EPPI-Centre, Social Science Research Unit, Institute of Education, University of London.
Hill, C.J., Bloom, H.S., Black, A.R. & Lipsey, M.W. (2007). Empirical Benchmarks for Interpreting Effect Sizes in Research MDRC Working Papers on Research Methodology New York: MDRC Avaliable at: www.mdrc.org/publications/459/full.pdf (accessed 17/5/11).
Luyten, H. (2006). 'An empirical assessment of the absolute effect of schooling: regression/ discontinuity applied to TIMSS-95'. Oxford Review of Education, 32: 3, 397-429.
Luyten, H., Peschar, H., Coe, R. (2008). Effects of Schooling on Reading Performance, Reading Engagement, and Reading Activities of 15-Year-Olds in England. American Educational Research Journal 45 (2) pp 319-342.
Slavin, R. & Smith, D. (2009). The Relationship Between Sample Sizes and Effect Sizes in Systematic Reviews in Education. Educational Evaluation and Policy Analysis 31.4: 500-506.

12
Schagen, I. & Hodgen, E. (2009). How Much Difference Does It Make? Notes on Understanding, Using, and Calculating Effect Sizes for Schools Wellington NZ: Research Division, Ministry of Education Available at: http://www.educationcounts.govt.nz/publications/schooling/36097/2 (accessed 5/6/11).
Wiliam, D. (2010). 'Standardized Testing and School Accountability'. Educational Psychologist, 45: 2, 107-122.
Wiliam, D., Lee, C., Harrison, C. & Black P. (2004). Teachers developing assessment for learning: impact on student achievement. Assessment in Education, 11, 1 49-65.

13
APPENDIX 4: META-ANALYSIS AND ‘SUPER-SYNTHESIS’ OF
INTERVENTION RESEARCH IN EDUCATION
Meta-analysis is a method of combining the findings of similar studies to provide a combined quantitative
synthesis or overall ‘pooled estimate of effect’. The results of, say, interventions seeking to improve low
attaining students’ learning in mathematics can be combined so as to identify clearer conclusions about
which interventions work and what factors are associated with more effective approaches. The advantages
of meta-analysis over other approaches to reviewing are that it combines or ‘pools’ estimates from a range of
studies and should therefore produce more widely applicable or more generalisable results.
In addition, it can show whether the findings from similar studies vary more that would be predicted from their
samples so that the causes of this variation can be investigated (moderator analysis). In education research
this is particularly valuable as the results from small studies can be combined to provide answers to
questions without being so dependent on the statistical significance of each of the individual studies which
relates closely to sample size. Many small studies with moderate or low effects may not reach statistical
significance and if you review the field by simply counting how may were statistically significant, you may be
misled into thinking that the evidence is less conclusive than if you combine these studies into one combined
study or meta-analysis. The statistical techniques to undertake meta-analysis form a set of transparent and
replicable rules which are open to scrutiny.
Another key advantage of meta-analysis is that it helps to deal with the quantity of information in education
research which can overwhelm other approaches. This is particularly important when trying to draw relative
inferences across different areas of education research. The number of studies available to review in any
area of education is extensive, so techniques to aggregate and build up knowledge to propose further
research and test theories and ideas are invaluable. In fields like psychology and medicine meta-analysis is
relatively uncontroversial as a synthesis technique with nearly 40 years development of the principles and
methods involved.
‘SUPER-SYNTHESIS’
It is also tempting to look at results across different kinds of studies with a common population, so to provide
more general or comparative inferences. This approach is, of course, vulnerable to the classic “apples and
oranges” criticism which argues that you can’t really make a sensible comparison between different kinds of
things. However as Gene Glass (2000) said, “Of course it mixes apples and oranges; in the study of fruit
nothing else is sensible; comparing apples and oranges is the only endeavor worthy of true scientists;
comparing apples to apples is trivial.”
A number of publications have attempted to take meta-analysis this stage further, by synthesising the results
from a number of existing meta-analyses – producing what has been called a ‘meta-meta-analysis’ (Kazrin,
Durac & Agteros, 1979), a ‘mega-analysis’ (Smith 1982), ‘super-analysis’ (Dillon, 1982) or ‘super-synthesis’
(e.g. Sipe & Curlette, 1997). However, one can make a clear separation of types within these studies. Some
use the meta-analyses as the unit of analysis in order to say something about the process of conducting a
meta-analysis and identifying statistical commonalities which may be of importance (e.g. Ioannidis &
Trikalinos, 2007; Lipsey and Wilson, 1993). Others, however, attempt to combine different meta-analyses
into a single message about a more general topic than each individual meta-analysis can achieve. Even
here, there appears to be a qualitative difference – some retain a clear focus, either by using meta-analyses
as the source for identifying original studies with an overarching theoretical focus (e.g. Marzano, 1998) in
effect producing something might best be considered as a series of larger meta-analyses rather than a meta-
meta-analysis. Others, though, make claims about broad and quite distinct educational areas by directly
combining results from identified meta-analyses (e.g. Hattie, 1992; Sipe & Curlette, 1997). In terms of the
apples and oranges analogy, this is a little like asking which fruit is best for you, as a lot depends on what
you mean by ‘best’ and how this is measured.
Hattie (2009) synthesized more than 800 meta-analyses and came up with some interesting findings. First of
all, he concluded that most things in education ‘work’ as the average effect size is about 0.4. He then uses
this to provide a benchmark for what works above this ‘hinge’ point. There are, of course, some reservations

14
about this ‘hinge’ as small effects may be valuable if they are either cheap or easy to obtain, or tackle an
otherwise intractable problem. Similarly, large effect sizes may be less important if they are unrealistic and if
they cannot be replicated easily in classrooms by teachers. Further reservations about combining effect
sizes of different kinds suggest that intervention effects should be distinguished from maturational
differences or correlational effects sizes. The underlying distributions may be of different kinds, so that unlike
comparing fruit, it is more like comparing an apple with a chair (Higgins & Simpson, 2011).
Although there are clearly limitations to the application of quantitative synthesis in this way, the data from
meta-analysis offers the best source of information to try to answer comparative questions between different
areas of educational research. It is hard to compare areas without some kind of benchmark. If you have two
narrative reviews, one arguing that, say, parental involvement works and another arguing that ICT is
effective, and both cite studies with statistically significant findings showing they each improve reading
comprehension, it is hard to choose between them in terms of which is likely to offer the most benefit. Meta-
analysis certainly helps to identify which researched approaches have made, on average, the most
difference, in terms of effect size, on tested attainment of pupils in reading comprehension or other areas of
attainment. We suggest that this comparative information should be treated cautiously, but taken seriously. If
effect sizes from a series of meta-analysis in one area, such as meta-cognitive interventions for example, all
tend to be between 0.6 and 0.8, and all of those in another area, such as individualised instruction, are all
between -0.1 and 0.2, then this is persuasive evidence that schools should investigate meta-cognitive
approaches to improve learning, rather than focus on individualised instruction. Some underlying
assumptions are that the research approaches are sufficiently similar (in terms of design for example), that
they compared sufficiently similar samples or populations (of school pupils) with sufficiently similar kinds of
interventions (undertaken in schools) and similar outcome measures (standardised tests and curriculum
assessments). So, if you think that a meta-analysis of intervention research into improving reading
comprehension has a set of broadly similar set of studies, on average, to a meta-analysis investigating the
development of understanding in science, then you might be tempted to see if any approaches work well in
both fields (such as reciprocal teaching) or, indeed, don’t work well in both fields (such as individualised
instruction). Our argument is that so long as you are aware of the limits of the inferences drawn, then the
approach has value. We suggest that this provides the best evidence we have so far, particularly where we
have no studies providing direct comparisons. It must be acknowledged, however, that this kind of super-
synthesis or meta-meta-analysis remains distinctly controversial as a research approach.
SEARCH AND INCLUSION CRITERIA
The main source of studies for the Toolkit was a database of meta-analyses of educational interventions
developed for an ESRC Researcher Development Initiative.2 Additionally a search was undertaken for
systematic reviews with quantitative data (where effect sizes were reported but not pooled) and meta-
analyses (where effect sizes are combined to provide a pooled estimated of effect) of intervention research
in education using a number of information gateways including Web of Knowledge, FirstSearch, JSTOR,
ERIC, Google Scholar and ProQuest Dissertations. In addition a number of journals were hand searched
(e.g. Review of Educational Research and Education Research Review). References and sources in existing
super-syntheses (e.g. Sipe & Curlette, 1997; Marzano, 1998; Hattie, 2009) were reviewed and obtained
where possible. Other studies were consulted in each area to provide additional contextual information.
A number of areas were specifically included at the request of teachers who were consulted at different
stages in the development of the Toolkit. Thanks in particular go to ARK and teachers from the TeachFirst
Future Leaders programme and a group of Hammersmith and Ealing deputy headteachers as well as a
number of teachers in the North-East of England who were generous with their time in attending conference
or workshop presentations about earlier drafts of the Toolkit. Some of these areas (e.g. School Uniforms,
Performance Pay) did not have any quantitative systematic reviews or meta-analyses to support a pooled
estimate of effect. Inferences drawn from single studies or projects are limited, so these topics have a lower
overall quality assessment in terms of the overall warrant from the research evidence.
2 ESRC Grant RES-035-25-0037: ‘Training in the Quantitative synthesis of Intervention Research Findings in
Education and Social Sciences’.

15
WEIGHT OF EVIDENCE AND QUALITY ASSESSMENT
The weight of evidence in each field was assessed according to the criteria in Table 2 below and a
judgement made about how well the descriptors matched each area included in the Toolkit. These criteria
are weighted to identify consistency in terms of the findings (both the overall pooled effect the pattern of
effects relating to moderator variables) and to give weight to ecological validity (where studies took place in
schools with interventions managed by teachers rather than researchers). The focus of the Toolkit is on
providing advice to schools about how to spend additional resource to benefit disadvantaged learners, so
these were judged to to be important criteria.
TABLE 2: QUALITY ASSESSMENT CRITERIA
Quantitative evidence of impact from single studies, but with effect size data
reported or calculable. 3
No systematic reviews with quantitative data or meta-analyses located.
At least one meta-analysis or systematic review with quantitative evidence of impact on attainment or cognitive or curriculum outcome measures.
Two or more rigorous meta-analyses of experimental studies of school age students with cognitive or curriculum outcome measures.
Three or more meta-analyses from well controlled experiments mainly undertaken in schools using pupil attainment data with some exploration of causes of any identified heterogeneity.
Consistent4 high quality evidence from at least five robust
5 and recent meta-
analyses where the majority of the included studies have good ecological validity
6 and where the outcome measures include curriculum measures or
standardised tests in school subject areas.
REFERENCES
Bloom, H.S., Hill, C.J., Black, A.R. & Lipsey, M.W. (2008). 'Performance Trajectories and Performance Gaps as Achievement Effect-Size Benchmarks for Educational Interventions'. Journal of Research on Educational Effectiveness, 1: 4, 289-328.
Dillon, J.T., (1982). Superanalysis. American Journal of Evaluation 3(4) pp 35-43. Higgins, S. & Simpson, A. (2011). Book Review: Visible Learning. British Journal of Educational Studies 59.2
pp 90-92. Hattie, J.A. (1992). Measuring the effects of schooling. Australian Journal of Education, 36, 5-13. Hattie, J.A. (2008). Visible Learning. London: Routledge. Hill, C.J., Bloom, H.S., Black, A.R. & Lipsey, M.W. (2007). Empirical Benchmarks for Interpreting Effect Sizes
in Research MDRC Working Papers on Research Methodology. New York: MDRC Avaliable at: www.mdrc.org/publications/459/full.pdf (accessed 17/5/11).
Ioannidis, J.P.A. & Trikalinos, T.A. (2007). The appropriateness of asymmetry tests for publication bias in meta-analyses: a large survey. Canadian Medical Association Journal 176 p 8.
Marzano, R.J. (1998). A Theory-Based Meta-Analysis of Research on Instruction. Aurora, Colorado, Mid-continent Regional Educational Laboratory. Available at: http://www.mcrel.org:80/topics/products/83/ (viewed 31/05/11) .
Sipe, T. & Curlette, W.L. (1997). A Meta-Synthesis Of Factors Related To Educational Achievement: A Methodological Approach To Summarizing And Synthesizing Meta-Analyses. International Journal of Educational Research 25.7. pp 583-698.
Smith, N.L. (1982). Evaluative Applications of Meta- and Mega-Analysis. American Journal of Evaluation 3(4) pp 43.
3 Based on randomized controlled trials or well-controlled experiments
4 Pooled effect sizes are reasonably similar or, where different, similar patterns of effects are found for comparable
moderator variables associated with the approach, producing a consistent and coherent picture. 5 Meta-analysis reported with confidence intervals and heterogeneity. Some checks for bias investigated (e.g. study
quality and/or and some moderator exploration). 6 Studies conducted in schools with more than one teacher or class.

16
APPENDIX 5: NOTES ON SUMMARIES AND ADDITIONAL REFERENCES
This section contains information additional to that presented in the Toolkit, and in particular details the
sources used for the overview of each area, with any additional information used to supplement the
quantitative analysis. Bibliographic details for the meta-analyses and other sources used for the quantitative
estimates can be found in Appendix 7.
ABILITY GROUPING
As Kulik (1992) observed, the key distinction in ability grouping is between (1) approaches where all ability
groups follow the same curriculum, (2) between approaches where groups follow different curricula adjusted
to their ability and (3) between approaches which make curricular and other adjustments for particular
groups such as the particular needs of highly talented or disadvantaged learners. Overall there is substantial
and robust evidence in this area, with a reasonably consistent picture of effects, particularly on low attaining
pupils, that grouping by ability can be detrimental to these learners’ progress (Ireson et al., 1999) and their
perceptions of themselves as learners (Ireson et al., 2001). One of the first meta-analyses in this field (Kulik
& Kulik, 1982) focussed on secondary schools and found that studies where high-attaining students received
enriched instruction produced especially clear positive effects while studies of average and below average
students produced near-zero effects; the pattern has changed little since then. Nomi’s (2009) recent
correlational analysis from the US suggests the overall differences are low and that ability grouping appears
to lead to lower reading achievement in schools with more disadvantaged characteristics (p78). By contrast a
recent randomised trial in Kenya (Duflo et al., 2011) indicates that in some circumstances the lowest
attaining pupils may benefit from ability grouping (tracking) though the overall effect size remains low (0.14)
and is dependent on teacher incentives and evaluation. Boaler’s work (2008) shows that it is possible to
achieve high attainment even in subjects like mathematics in mixed ability groups in secondary schools.
ABILITY GROUPING
AVERAGE IMPACT:
± 1 MONTH
EVIDENCE STRENGTH:
Kulik & Kukik, 1982 (secondary) 0.1
Kulik & Kulik, 1984 (elementary) 0.1
Lou et al., 1996 (on low attainers) -0.12
Slavin, 1990 (on low attainers) -0.06
ADDITIONAL REFERENCES
Boaler, J. (2008). Promoting 'relational equity' and high mathematics achievement through an innovative mixed-ability approach. British Educational Research Journal 34.2 pp 167-194.
Duflo, E., Dupas, P., Kremer, M. (2011). “Peer Effects, Teacher Incentives, and the Impact of Tracking: Evidence from a Randomized Evaluation in Kenya”. American Economic Review 101 (5): pp 1739-1774.
Ireson, J., Hallam, S. & Plewis, I. (2001). Ability grouping in secondary schools: Effects on pupils’ self-concepts British Journal of Educational Psychology 71. 2, pp 315-326.
Ireson, J., Hallam, S., Mortimore, P., Hack, S., Clark, H. & Plewis, I. (1999). Ability grouping in the secondary school: the effects on academic achievement and pupils’ self-esteem Paper presented at the British Educational Research Association Annual Conference, University of Sussex at Brighton, September 2-5 1999.
Kulik, J.A. (1992) An Analysis of the Research on Ability Grouping: Historical and Contemporary Perspectives The National Research Center On The Gifted And Talented.
Nomi, T. (2009) The Effects of Within-Class Ability Grouping on Academic Achievement in Early Elementary Years, Journal of Research on Educational Effectiveness, 3:1, pp 56-92.
AFTER SCHOOL PROGRAMMES The evidence in this area is not substantial or particularly robust (Fashola, 1998), what evidence there is
suggests that the impact of after school programmes is variable, but tends to be positive. Participants in after
school programmes usually score higher on measures of academic achievement. The average effect size for
the benefit for students in after-school programmes over comparison students was 0.21 in reading and 0.16

17
in mathematics in Scott-Little and colleagues’ (2002) study. Lauer and colleagues (2006) found small but
statistically significant positive effects of such programmes on reading and mathematics achievement for at-
risk students (overall effect size on reading: 0.13 and mathematics: 0.17) and larger positive effect sizes for
programmes with specific characteristics such as tutoring in reading. Attending a formal after school
programme where low-income children spend more time in academic and enrichment activities with peers
and adults was also correlated in Posner and Vandell’s (1994) study with their academic and conduct
grades, peer relations and emotional adjustment. Similarly, other studies have shown that participation in
school-based, after school programmes is associated with behaviour that could help youth stay out of trouble
and with positive effects on school attitudes and behaviours (Grossman et al., 2002; Woodland, 2008).
Crawford’s (2011) meta-analysis found a much higher overall effect size (0.4) but with significant variation
associated with time, with more recent studies (2006-09) and effect size of .13 which is more consistent with
other meta-analyses.
A recent meta-analysis of after school programmes (Durlak & Weissberg, 2007) that seek to enhance the
personal and social development of children and adolescents indicated that there was improvement in three
general areas: feelings and attitudes, indicators of behavioural adjustment, and school performance. More
specifically, significant increases occurred in the young people’s self-perceptions and views of school, their
positive social behaviours, and in their school grades and level of academic achievement.
Among programmes intended to increase academic achievement, those that provide greater structure, a
stronger link to the school curriculum, with well-qualified and well-trained staff, and opportunities for one-to-
one tutoring seem particularly promising (Fashola, 1998). Programmes may not be equally effective with all
students however. The overall pattern seems to suggest that older primary pupils do not show the same
gains as the younger children enrolled in after-school programmes with some evidence that programmes
targeting both primary and secondary pupils at transition may be more beneficial (Crawford, 2011). In
addition, at-risk children may benefit more from participating in such programmes (Scott-Little et al., 2002),
but may be harder to retain or keep engaged (Grossman et al., 2002).
In the UK, official estimates suggest after school clubs cost on average £7.00 per session,7 suggesting that
about 15 weeks of after school provision could be supported by the pupil premium in 2012-13. The costs of
well-qualified and well-trained staff may increase these estimates, particularly if they involve tutoring, so the
Toolkit estimates about £10 per session per pupil to enable academic impact.
AFTER SCHOOL
PROGRAMMES
AVERAGE IMPACT:
+ 2 MONTHS
EVIDENCE STRENGTH:
Crawford, 2011 0.4
Durlak & Weissberg, 2007 0.16
Fashola, 1998 NPE8
Lauer, Akiba & Wilkerson, 2006 0.16
Scott-Little et al., 2002 NPE8
ADDITIONAL REFERENCES
Durlak, J.A., (2007). The Impact of After-School Programs that Promote Personal and Social Skills. Chicago: CASEL.
Grossman, J.B., Price, M.L., Fellerath, V., Jucovy, L.Z., Kotloff, L.J., Raley, R. & Walker, K.E. (2002). Multiple Choices After School: Findings from the Extended-Service Schools Initiative. Philadelphia: Public/Private Ventures.
Posner, J.K. & Vandell, D.L. (1994). Low-Income Children’s After-School Care: Are There Beneficial Effects of After-School Programs? Child Development, 65.2 pp 440-456.
Scott-Little, C., Hamann, M.S. & Jurs, S.G. (2002). Evaluations of After-School Programs: A Meta-Evaluation of Methodologies and Narrative Synthesis of Findings. American Journal of Evaluation, 23.4 pp 387-419.
Woodland, M.H. (2008). Whatcha Doin’ After School? A Review of the Literature on the Influence of After-School Programs on Young Black Males. Urban Education 43.5 pp 537-560.
7 http://www.direct.gov.uk/en/parents/childcare/dg_181084
8 Effect sizes reported but no overall (pooled) effect size (NPE).

18
ARTS PARTICIPATION
The challenge in this area in understanding the research evidence is the breadth of approaches, activities
and interventions, from music (Standley, 2008) to creative and performing arts (Lewis, 2004). Overall the
evidence is not conclusive (Winner & Cooper, 2000) with many interventions lacking robust evaluation
(Newman et al., 2010) and a wide range of varying effects identified. There is some evidence of positive
benefits; however it is hard to identify factors clearly associated with this. It is therefore difficult to make
specific recommendations based on the current research evidence.
ARTS PARTICIPATION
AVERAGE IMPACT:
+ 1 MONTH
EVIDENCE STRENGTH:
Lewis, 2004 (performing arts on academic outcomes) 0.20
Newman et al., 2010 (secondary science) 0.06 Newman et al., 2010 (secondary English) 0.05
Newman et al., 2010 (secondary mathematics) 0.03 Newman et al., 2010 (prim/EY cognitive) 0.45 Standley, 2008 0.32
Winner & Cooper, 2000 (maths) 0.04
ADDITIONAL REFERENCES
Winner, E. & Cooper, M. (2000). Mute Those Claims: No Evidence (Yet) for a Causal Link between Arts
Study and Academic Achievement. Journal of Aesthetic Education 34. 3-4, pp 11-75.
BLOCK SCHEDULING AND TIMETABLING The influence of altering timetables in schools to create longer blocks of time or a more intensive series of
lessons at secondary level has been investigated, though the evidence is not particularly robust (Dickson et
al., 2010) and in particular the impact on teachers’ practices has not been studied systematically (Zepeda &
Mayers, 2006). The effect sizes identified tend to be low or even negative, which suggests schools should be
cautious about making changes without a clear idea of how they will use the changed pattern of lessons
effectively (Gruber & Onwuegbuzie, 2001). There is some evidence that such changes are more successful
in science, perhaps as longer lessons enable more focused or more complete investigative work to be
undertaken. Veal and Flinders (2001) found that block scheduling was perceived by teachers to provide
increased variety of instruction and an overall improvement in classroom climate through improved student-
teacher relationships. Our interpretation is that timetabling and lesson length changes will not make a
difference unless teachers (or pupils) change aspects of teaching and learning interactions to take
advantage of the differences in lesson length and frequency.
BLOCK SCHEDULING
AVERAGE IMPACT:
+ 1 MONTH
EVIDENCE STRENGTH:
Dickson et al., 2010 (achievement) 0.11 Dickson et al., 2010 (mathematics) -0.02
Dickson et al., 2010 (science) 0.20 Lewis et al., 2005 (mathematics) -0.10
Lewis et al., 2005 (English) -0.17 Lewis et al., 2005 (science) -0.12
ADDITIONAL REFERENCES
Gruber, C.D. & Onwuegbuzie, A.J. (2001). Effects of Block Scheduling on Academic Achievement among High School Students. The High School Journal, 84.4, 32-42.
Lewis, C.W., Winokur, M.A., Cobb, R.B., Gliner, G.S. & Schmidt, J. (2005). Block Scheduling in the High School Setting: A Synthesis of Evidence-Based Research. A report prepared for MPR Associates, Inc., Berkeley, CA.
Veal, W.R. & Flinders, D.J. (2001). How Block Scheduling Reform Effects Classroom Practice. The High School Journal, 84.4 pp 21-31.
Zepeda, S.J. & Mayers, R.S. (2006). An Analysis of Research on Block Scheduling. Review of Educational Research, 76.1 pp 137-170.

19
EARLY YEARS INTERVENTION
There is consistent evidence that early intervention is beneficial for children’s learning with typical effect
sizes around 0.23 to 0.52 in meta-analyses. There is some evidence that these programmes need to be
whole day (rather than half-day) and of longer duration (up to a year) rather than for shorter periods of time,
though the EPPE study in the UK found similar benefits associated with part-time and full-day provision in
their analysis (Sylva & Pugh, 2005). The impact tends to wear off over time (Lewis & Vosburgh, 1988; Giliam
and Zigler, 2000; Karoly, Kilburn & Cannon, 2005; Camilli et al., 2010), though such intervention tends to
have a more durable effect on attitudes to school than measures of attainment (Nelson et al., 2003; Camilli
et al., 2010). Some studies have also investigated interventions designed to improve the home environment
(reviewed by Bakerman-Kranenburg et al., 2005) which suggest impact is harder to achieve with younger
parents and with poorer families. Their findings also suggest that the immediate impact of effective
interventions is associated with shorter programmes which were home-based (see also see also Karoly et al.
2005). By contrast Campbell and Ramey (1994) found greater impact associated with children’s learning in
school in the longer term was associated with more lasting programmes (from early infancy to age 8) which
influenced both home and school environments; this is consistent with Nelson et al. (2003). Lewis and
Vosburgh (1988) found that more durable effects were associated with greater parental involvement. Some
caution is needed, however, in generalising these findings about early years and early childhood
intervention. In the UK the EPPE study suggested an effect of about 0.18 for pre-school attendance with
performance in Reception classes, but a recent evaluation of Sure Start Local Programmes (NESS Team,
2010) did not find any differences in Foundation Profile scores for Sure Start children at the start of school,
though quality of provision was linked with better language and communication outcomes (Melhuish, et al.
2011). Overall the evidence suggests that intervention in the early years (pre-school and the first few years
of schooling) can have an effect on disadvantaged young children’s learning, but that we have not yet
identified how to scale up the impact from effective programmes and approaches, particularly at policy level
in terms of recommending effective practices, to ensure these benefits accrue to disadvantaged children as
they progress through school (Barnet, 2011).
EARLY YEARS
INTERVENTION
AVERAGE IMPACT:
+ 6 MONTHS
EVIDENCE STRENGTH:
Anderson, et al., 2003 0.35
Camilli, Vargas, Ryan & Barnett, 2010 0.23 Gilliam & Zigler, 2000 NPE
9
Karoly, Kilburn & Cannon, 2005 0.28 LaParo & Pianta, 2000 0.51
Lewis & Vosburgh, 1988 0.41 Nelson et al., 2003 0.52
ADDITIONAL REFERENCES
Bakermans-Kranenburg, M.J., van IJzendoorn, M.H., Bradley, R.H. (2005). Those Who Have, Receive: The Matthew Effect in Early Childhood Intervention in the Home Environment. Review of Educational Research, 75. 1 pp 1-26.
Barnett, W.S. (2011). Effectiveness of Early Educational Intervention Science 333, pp 975-978 Campbell, F.A. & Ramey, C.T. (1994). Effects of Early Intervention on Intellectual and Academic
Achievement: A Follow-up Study of Children from Low-Income Families. Child Development 65.2 pp 684-698.
Melhuish, E., Belsky, J., Leyland, A.H., Barnes, J (2008). The Impact of Sure Start Local Programmes on Three Year Olds and Their Families: The National Evaluation of Sure Start NESS Research Report: 2008/FR/027 London: University of London, Institute for the Study of Children, Families and Social Issues.
Melhuish, E. Belsky, J. MacPherson, K., Cullis, A. (2011). The quality of group childcare settings used by 3-4 year old children in Sure Start Local Programme areas and the relationship with child outcomes Research Report DFE-RR068 London Department for Education.
The National Evaluation of Sure Start (NESS) Team (2010). The impact of Sure Start Local Programmes on five year olds and their families Research Report DFE-RR067 London: Department for Education.
9 Effect sizes reported but no overall (pooled) effect size (NPE).

20
Sylva, K. and MacPherson, K. (2002). Parents and Parenting in the Early Years: Research evidence. Oxford: Department of Educational Studies, University of Oxford.
Sylva, K. and Pugh, G. (2005). Transforming the early years in England Oxford Review of Education 31.1 pp 11-27.
Sammons, P., Sylva, K., Melhuish, E., Siraj-Blatchford, I., Taggart, B. & Elliot, K. (2004). The Effective Provision of Pre-School Education [EPPE] Project: Technical Paper 8a Measuring the Impact of Pre-School on Children’s Cognitive Progress over the Pre-School Period London: Institute of Education, London University.
FEEDBACK
The challenge with feedback is to relate the research literature to classroom practice in terms of effective
pedagogical approaches and techniques. Many of the studies in Kluger and de Nisi (1996), for example, are
theoretically driven studies where the implications for classroom practice are unclear. Both Black and Wiliam
(1998) and Hattie and Timplerley (2007) have summarised the implications for schools, but with slightly
different emphases. Black and Wiliam (1998), in developing Assessment for Learning (AfL), emphasised the
use of feedback to close the gap on current performance relative to a desired goal or outcome, and
highlighted the importance of the student in identifying the gap and acting on the information (see also
Metacognition and self-regulation strategies). As AfL has developed and been adopted at both policy and
practice levels, one of the challenges is clearly defining ‘Assessment for Learning’ (Black & Wiliam, 2009;
Bennett, 2011) and identifying the different research-based strategies. In Black and Wiliam’s (1998) early
work it is equated with effective formative feedback, drawing on a tradition going back to Bloom et al. (1971),
so one might expect effect sizes to be more similar to feedback studies or approaches like mastery learning
(e.g. Kulik, Kulik & Bangert Drowns, 1990: 0.52). When closely linked with test performance effect sizes tend
to be lower (0.26: Bangert-Drowns, Kulik, Kulik & Morgan, 1991). Preliminary AfL research in schools
(summarised in Wiliam, 2002) indicated benefits were achievable, though not as large as found in
experimental studies (0.32: Wiliam, 2002). Smith and Gorard (2005) also indicate what can go wrong when
schools misunderstand or misinterpret the intentions behind the practices associated with a policy version of
a research-based intervention (see also Black and Wiliam, 2009). Hattie and Timperley (2007) suggest that
feedback should focus on challenging tasks or goals (rather than easy ones); that is even more important for
teachers to give feedback about what is right rather than what is wrong. In addition feedback should be as
specific as possible and, ideally, compare what students are doing right now with what they have done
wrong before; and finally that it should encourage students, and not threaten their self-esteem.
FEEDBACK AVERAGE IMPACT:
+ 9 MONTHS
EVIDENCE STRENGTH:
Bangert-Drowns, Kulik, Kulik & Morgan, 1991 0.26
Fuchs and Fuchs, 1985 0.72 Kluger & De Nisi, 1996 0.41
Lysakowski & Walberg, 1982 0.97 Tenebaum & Goldring, 1989 0.72
Walberg, 1982 0.81
ADDITIONAL REFERENCES
Bennett, R.E. (2011). Formative assessment: a critical review, Assessment in Education: Principles, Policy & Practice, 18: 1, 5-25
Black, P. & Wiliam, D. (2005). Lessons from around the world: how policies, politics and cultures constrain and afford assessment practices. Curriculum Journal, 16, 249-261.
Black, P. & Wiliam, D. (2009). Developing the theory of formative assessment. Educational Assessment, Evaluation and Accountability 21 1, pp 5-31.
Black P. & Wiliam, D. (1998). Assessment and classroom learning, Assessment in Education, 5, pp. 7-73. Bloom, B.S., Hastings, J.T. & Madaus, G.F. (eds.) (1971). Handbook on the Formative and Summative
Evaluation of Student Learning New York: McGraw-Hill. Hattie, J. and Timperley, H. (2007). The Power of Feedback. Review of Educational Research 77.1 pp 81–
112. Kulik, C. Kulik, J. & Bangert-Drowns, R. (1990). Effectiveness of mastery learning programs: A meta-
analysis. Review of Educational Research, 60.2 pp 265-306. Smith, E. & Gorard, S. (2005) They don’t give us our marks’: the role of formative feedback in student
progress. Assessment in Education 12. 1, pp. 21–38.
21
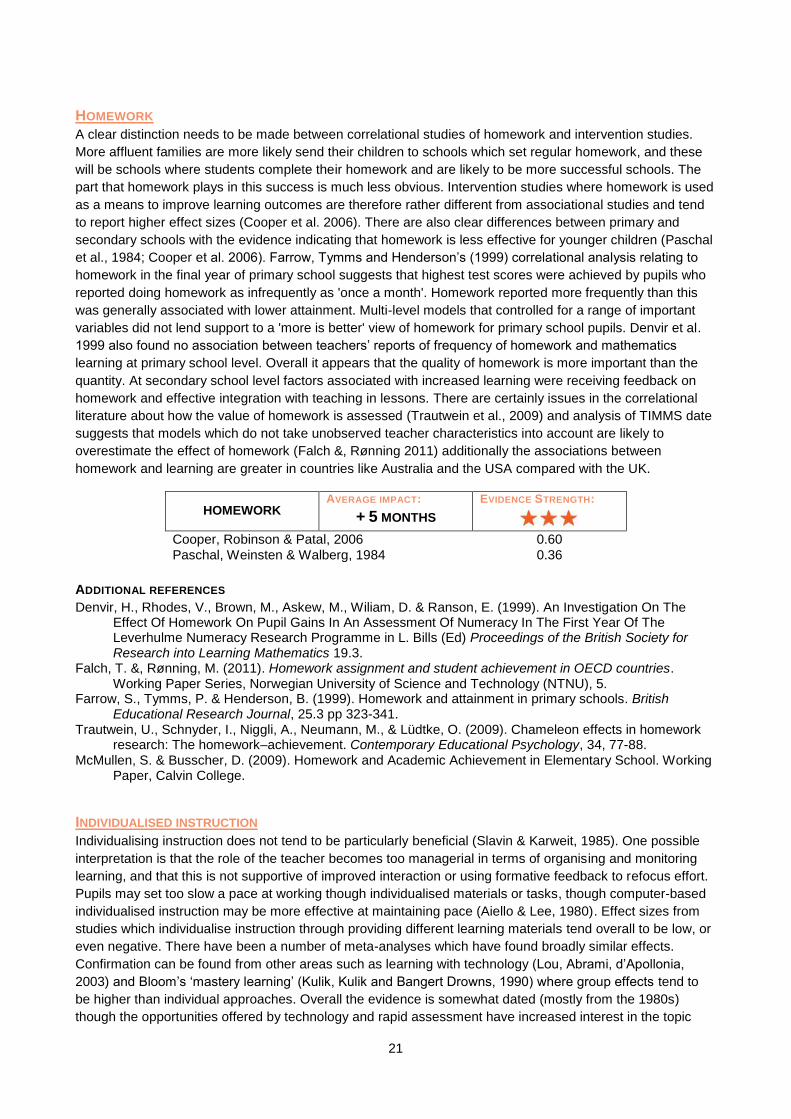
HOMEWORK
A clear distinction needs to be made between correlational studies of homework and intervention studies.
More affluent families are more likely send their children to schools which set regular homework, and these
will be schools where students complete their homework and are likely to be more successful schools. The
part that homework plays in this success is much less obvious. Intervention studies where homework is used
as a means to improve learning outcomes are therefore rather different from associational studies and tend
to report higher effect sizes (Cooper et al. 2006). There are also clear differences between primary and
secondary schools with the evidence indicating that homework is less effective for younger children (Paschal
et al., 1984; Cooper et al. 2006). Farrow, Tymms and Henderson’s (1999) correlational analysis relating to
homework in the final year of primary school suggests that highest test scores were achieved by pupils who
reported doing homework as infrequently as 'once a month'. Homework reported more frequently than this
was generally associated with lower attainment. Multi-level models that controlled for a range of important
variables did not lend support to a 'more is better' view of homework for primary school pupils. Denvir et al.
1999 also found no association between teachers’ reports of frequency of homework and mathematics
learning at primary school level. Overall it appears that the quality of homework is more important than the
quantity. At secondary school level factors associated with increased learning were receiving feedback on
homework and effective integration with teaching in lessons. There are certainly issues in the correlational
literature about how the value of homework is assessed (Trautwein et al., 2009) and analysis of TIMMS date
suggests that models which do not take unobserved teacher characteristics into account are likely to
overestimate the effect of homework (Falch &, Rønning 2011) additionally the associations between
homework and learning are greater in countries like Australia and the USA compared with the UK.
HOMEWORK AVERAGE IMPACT:
+ 5 MONTHS
EVIDENCE STRENGTH:
Cooper, Robinson & Patal, 2006 0.60
Paschal, Weinsten & Walberg, 1984 0.36
ADDITIONAL REFERENCES
Denvir, H., Rhodes, V., Brown, M., Askew, M., Wiliam, D. & Ranson, E. (1999). An Investigation On The Effect Of Homework On Pupil Gains In An Assessment Of Numeracy In The First Year Of The Leverhulme Numeracy Research Programme in L. Bills (Ed) Proceedings of the British Society for Research into Learning Mathematics 19.3.
Falch, T. &, Rønning, M. (2011). Homework assignment and student achievement in OECD countries. Working Paper Series, Norwegian University of Science and Technology (NTNU), 5.
Farrow, S., Tymms, P. & Henderson, B. (1999). Homework and attainment in primary schools. British Educational Research Journal, 25.3 pp 323-341.
Trautwein, U., Schnyder, I., Niggli, A., Neumann, M., & Lüdtke, O. (2009). Chameleon effects in homework research: The homework–achievement. Contemporary Educational Psychology, 34, 77-88.
McMullen, S. & Busscher, D. (2009). Homework and Academic Achievement in Elementary School. Working Paper, Calvin College.
INDIVIDUALISED INSTRUCTION
Individualising instruction does not tend to be particularly beneficial (Slavin & Karweit, 1985). One possible
interpretation is that the role of the teacher becomes too managerial in terms of organising and monitoring
learning, and that this is not supportive of improved interaction or using formative feedback to refocus effort.
Pupils may set too slow a pace at working though individualised materials or tasks, though computer-based
individualised instruction may be more effective at maintaining pace (Aiello & Lee, 1980). Effect sizes from
studies which individualise instruction through providing different learning materials tend overall to be low, or
even negative. There have been a number of meta-analyses which have found broadly similar effects.
Confirmation can be found from other areas such as learning with technology (Lou, Abrami, d’Apollonia,
2003) and Bloom’s ‘mastery learning’ (Kulik, Kulik and Bangert Drowns, 1990) where group effects tend to
be higher than individual approaches. Overall the evidence is somewhat dated (mostly from the 1980s)
though the opportunities offered by technology and rapid assessment have increased interest in the topic

22
(e.g. Yeh, 2010). The only area where individualisation may be more beneficial is in the early years (Camilli
et al., 2010).
INDIVIDUALISED
INSTRUCTION
AVERAGE IMPACT:
+ 2 MONTHS
EVIDENCE STRENGTH:
Aiello & Lee, 1980 (in science) 0.35 Bangert, Kulik & Kulik, 1983 0.10
Horak, 1981 -0.07 Willett, Yamashita & Anderson, 1983 0.17
ADDITIONAL REFERENCES
Lou, Y., Abrami, P.C., & d'Apollonia, S. (2001). Small Group and Individual Learning with Technology: A Meta-Analysis. Review of Educational Research 71(3), 449-521. doi: 10.3102/00346543071003449
Slavin R.E. & Karweit, N.L. (1985). Effects of Whole Class, Ability Grouped, and Individualized Instruction on Mathematics American Educational Research Journal 22.3 pp. 351-367.
Yeh, S.(2010). 'Understanding and addressing the achievement gap through individualized instruction and formative assessment'. Assessment in Education: Principles, Policy & Practice, 17: 2, 169-182.
INFORMATION AND COMMUNICATION TECHNOLOGIES (ICT)
There is extensive research evidence of the impact of different technologies. It is relatively consistent and
tends to show moderate benefits for technology use (e.g. Tamim et al., 2011). However, due to the
increasing pace of technological change, it is usually about yesterday’s technology rather than today’s and
certainly makes it difficult for schools to know what to buy for tomorrow.
The challenge with digital technologies is to tease apart the relationship between different technologies and
different teaching approaches and contexts (Crook et al., 2010). Whilst it is unlikely that particular
technologies bring about changes in learning directly, different technologies may be more likely to support or
enable changes to take place in teaching and learning interactions, such as by providing more effective
feedback for example, or enabling more helpful representations to be used or simply by motivating students
to practice more. The question should perhaps rather be where is there evidence that technology can be
used effectively and how has it been used to support learning (Higgins, 2003). The other challenge is to
evaluate the range of technologies in relation to the range of ways that they can be used in schools to
support or improve learning to see if there are some technologies which are more promising than others.
Some areas, such as writing, for example (Waxman et al., 2002; Torgerson & Zhu, 2003; Morphy & Graham,
2012), appear to show particular promise. The use of tutorial programmes in science and more structured
feedback programs in mathematics (such as Integrated Learning Systems) also overall have evidence of
effectiveness (Kulik, 2003), though the variation in effects suggests that schools need to plan carefully the
adoption of these approaches and will need to evaluate their impact to ensure they are beneficial.
ICT AVERAGE IMPACT:
+ 4 MONTHS
EVIDENCE STRENGTH:
Bayraktatr, 2000 (science) 0.27
Liao, 2007 (in Taiwan) 0.55 Morphy & Graham, 2012 (writing) 0.52
Pearson, 2005 (reading) 0.49 Sandy-Hanson, 2006 0.28
Tamim et al., 2011 0.35 Torgerson & Elbourne, 2002 0.37
Torgerson & Zhu, 2003 (on reading) -0.05 Torgerson & Zhu, 2003 (on spelling) 0.02
Torgerson & Zhu, 2003 (on writing) 0.89 Waxman, Lin, Michko, 2003 0.45
ADDITIONAL REFERENCES
Crook, C., Harrison, C., Farrington-Flint, L., Tomás, C., Underwood, J. (2010). The Impact of Technology: Value-added classroom practice Final report Coventry: Becta

23
Higgins, S. (2003). Does ICT Improve Learning and Teaching in Schools? Nottingham: British Educational Research Association.
Kulik, J. (2003). Effects of Using Instructional Technology in Elementary and Secondary Schools: What Controlled Evaluation Studies Say Arlington, VA: SRI International.
LEARNING STYLES
Studies targeting learning with activities that match an individual’s identified learning style have not shown
convincingly that there is any benefit, particularly for low attaining pupils (Kavale & Forness, 1987). The
evidence of lack of effectiveness of approaches such as VAK (visual, auditory, kinaesthetic) has been
available for decades (e.g. Roberts & Coleman, 1958; Arnold, 1968), yet the idea perennially reappears in
both research and practice (for a recent account of why teachers adopt learning styles see Martin, 2010). In
some studies controls outperform the learning styles groups, relatively unusual in educational research,
where most interventions tend to show positive effects. There may be some benefit in learners believing that
they can succeed in a task if they can choose the particular approach they use. The effect sizes in
independent meta-analyses are low (e.g. Kavale & Forness, 1987: 0.14) or negative (Garlinger and Frank,
1986: -0.03), suggesting that at best only one or two pupils in a class of 30 might benefit from being taught in
this way. 35% of the studies in Kavale & Forness (1987) review were negative, suggesting that in over a third
of cases the control group did better than the learning styles group. The evidence for the lack of impact (and
in some cases detrimental effect) of using learning styles approaches has been demonstrated in a number of
studies and meta-analyses. Positive effects are more likely to be reported by enthusiasts (e.g. Lovelace,
2005) and in areas other than impact on learning outcomes, or where impact may be due to other factors,
such as the use of technology (Slemmer, 2002) or the beliefs and commitments of the teachers involved
(Lovelace 2002: see also the critique by Kavale Hirshoren & Forness, 1998). The unreliability of learning
styles tests and assessments has also been the subject of a number of reviews (e.g. Coffield et al., 2004;
Pashler et al., 2008). Overall the picture is consistent and robust (Mayer, 2011) that the evidence to support
teaching to students’ learning styles does not justify the practice.
LEARNING STYLES AVERAGE IMPACT:
+ 2 MONTHS
EVIDENCE STRENGTH:
Kavale & Forness, 1987 0.14 Garlinger & Frank, 1986 -0.03
Lovelace, 2005 0.67 Slemmer 2002 0.13
ADDITIONAL REFERENCES
Arnold, R.D. (1968). Four Methods of Teaching Word Recognition to Disabled Readers. The Elementary School Journal, 68. 5 pp. 269-274.
Coffield, F., Moseley, D., Hall, E., & Ecclestone, K. (2004). Learning styles and pedagogy in post-16 learning. A systematic and critical review. London: Learning and Skills Research Centre.
Kavale, K., Hirshoren, A., & Forness, S. (1998). Meta-analytic validation of the Dunn-and-Dunn model of learning-style preferences: A critique of what was Dunn. Learning Disabilities Research and Practice, 13, pp 75-80.
Mayer, R.E. (2011). Does styles research have useful implications for educational practice? Learning and Individual Differences 21 pp 319-320.
Martin, S. (2010). Teachers using learning styles: Torn between research and accountability? Teaching and Teacher Education 26 pp 1583-1591.
Pashler, H., McDaniel, M., Rohrer, D. & Bjork, R. (2008). Learning Styles: Concepts and Evidence. Psychological Science in the Public Interest 9.3 pp 106-119.
Roberts R.W. & Coleman J.C. (1958). An Investigation of the Role of Visual and Kinesthetic Factors in Reading Failure. The Journal of Educational Research, 51. 6 pp. 445-451.
META-COGNITION AND SELF-REGULATION STRATEGIES
Meta-cognitive strategies are teaching approaches which make learners’ thinking about learning more
explicit in the classroom (Higgins et al., 2005). This is usually through teaching pupils various strategies to
plan, monitor and evaluate their own learning (Haller et al., 1988). It is usually more effective in small groups

24
so learners can support each other and make their thinking explicit through discussion (Higgins et al., 2005).
Self-regulation (Dignath et al., 2008) refers to managing one’s own motivation towards learning as well as
the more cognitive aspects of thinking and reasoning. These approaches tend to have a consistent beneficial
impact on learning outcomes both in terms of cognitive measures as well as curriculum outcomes (Higgins et
al., 2005; Klauer & Phye, 2008). Unusually, such approaches also appear to benefit low attaining pupils
more than high achievers (Chiu, 1998), though this may be because the focus of the programme or
approach did not extend high achievers’ existing learning strategies.
META-COGNITION
AND SELF
REGULATION
AVERAGE IMPACT:
+ 8 MONTHS
EVIDENCE STRENGTH:
Abrami et al., 2008 0.34
Chiu, 1998 0.67 Dignath et al., 2008 0.62
Haller et al., 1988 0.71 Higgins et al., 2005 0.62
Klauer & Phye, 2008 0.69
ADDITIONAL REFERENCES
Schunk, D.H. (2008). Metacognition, self-regulation, and self-regulated learning: Research
recommendations. Educational Psychology Review, 20.4 pp 463-467.
ONE-TO-ONE TUITION
The evidence from research studies is reasonably consistent, particularly for younger learners who are
behind their peers in primary schools and for subjects like reading and mathematics (Wasik & Slavin, 1995).
Overall there is good evidence for the benefits of intensive tutoring. Some caution is required in interpreting
recent studies such as Chappell et al. (2010) and Tanner et al. (2011) where attempts have been made to
generalise these findings, through out of school provision or larger scale policy interventions. The findings
from these evaluations suggest that the impact will not necessarily be achieved on a larger scale and that
the intensity or quality of interaction in research studies may need to be understood more effectively. This
interpretation is supported by evidence that programmes which used experienced teachers and who are
given training are more effective than those using volunteers or classroom assistants (Elbaum et al. 2000;
Ritter et al., 2009). Evidence also suggest tutoring should be additional or supplemental to normal
instruction, rather than replace it. The evidence does not support one-to-one tutoring over pairs or intensive
small group work in terms of greater impact on learning (e.g. Torgerson et al., 2011), suggesting that paired
or small group tutoring may be a better investment.
ONE-TO-ONE AVERAGE IMPACT:
+ 5 MONTHS
EVIDENCE STRENGTH:
Cohen, Kulik & Kulik, 1982 (on tutees) 0.40 Elbaum et al., 2000 0.41
Ritter et al., 2009 0.30 Jun, Ramirez, Cumming, 2010 (by adults) 0.70 Wasik & Slavin, 1993 NPE
10
ADDITIONAL REFERENCES
Chappell, S., Nunnery, J., Pribesh, S., & Hager, J. (2010). Supplemental educational services (SES) provision of no child left behind: A synthesis of provider effects (Research Brief). Norfolk, VA: The Center for Educational Partnerships at Old Dominion University.
Torgerson, C.J., Wiggins, A., Torgerson, D.J., Ainsworth, H., Barmby, P., Hewitt, C., Jones, K., Hendry, V., Askew, M., Bland, M. Coe, R., Higgins, S., Hodgen, J., Hulme, C. & Tymms, P. (2011). Every Child Counts: The Independent evaluation. Executive Summary. London: DfE.
10
Effect sizes reported but no overall (pooled) effect size (NPE).

25
PARENTAL INVOLVEMENT
Although the involvement of parents is consistently associated with pupils’ success at school, the evidence
about increasing involvement to improve attainment is much less conclusive (Gorard et al. 2012). This is
particularly the case for poorer families. There is some evidence that supporting parents with their first child
will have benefits for siblings (Seitz & Apfel, 1994). However there is also conflicting evidence which
suggests that, at least in terms of early intervention, the involvement of parents does not increase the
benefits for learning in schools over early years intervention on its own. This suggests that developing
effective parental involvement to improve their children’s attainment is challenging and will need effective
monitoring and evaluation. The impact of parents’ aspirations is clearly also important, though again there is
insufficient evidence to show that changing parents’ aspirations for their children will raise their children’s
aspirations and achievement over the longer term. The link between aspirations and attainment is complex
(Cummings et al. 2012). Two recent meta-analyses of parental involvement studies in the USA suggest that
the effects in primary and secondary schools are about 0.27 and 0.25 respectively. Although there is a long
history of research into parent involvement programmes, there is surprisingly little robust evidence of the
impact of programmes which have tried to increase involvement to improve children’s learning (Mattingly et
al. 2002; Cummings et al. 2012:29). The association between parent involvement and their children’s
success at school is well established, but rigorous evaluation of approaches to improve children’s learning
and achievement through parental involvement is more sparse.
PARENTAL
INVOLVEMENT
AVERAGE IMPACT:
+ 3 MONTHS
EVIDENCE STRENGTH:
Jeynes, 2005 0.27 Jeynes, 2007 0.25
van Steensel et al., 2011 (family literacy) 0.18
ADDITIONAL REFERENCES Cummings, C., Laing, K., Law, J., McLaughlin, J., Papps, I., Todd, L. & Woolner, P. (2012) Can Changing
Aspirations And Attitudes Impact On Educational Attainment? A Review Of Interventions York: Joseph Rowntree Foundation.
Gorard, S., See B.H. & Davies, P. (2012) The impact of attitudes and aspirations on educational attainment and participation York: Joseph Rowntree Foundation.
Mattingly, D.J., Prislin, R., McKenzie, T.L., Rodriguez, J.L., Kayzar, B. (2002). Evaluating Evaluations: The Case of Parent Involvement Programs. Review of Educational Research, 72.4 pp 549-576.
Pomerantz, E.M. & Moorman, E.A., Litwack, S.D. (2007). The How, Whom, and Why of Parents’ Involvement in Children’s Academic Lives: More Is Not Always Better. Review of Educational Research 77. 3 pp. 373–410.
Seitz V. & Apfel, N.H. (1994). Parent-Focused Intervention: Diffusion Effects on Siblings, Child Development 65.2 pp 677-683.
PEER TUTORING
These are a range of approaches in which learners work in pairs or small groups to provide each other with
explicit teaching support (Topping, 2005). In Cross-Age Tutoring an older learner usually takes the tutoring
role and is paired with a younger tutee or tutees. Peer-Assisted Learning Strategies (PALS) is a structured
approach for mathematics and reading requiring set periods of time for implementation of about 25-35
minutes 2 or 3 times a week. In the collaborative learning strategy ‘Reciprocal Peer Tutoring’ learners
alternate between the role of tutor and tutee. The common characteristic is that the learners take on
responsibility for aspects of teaching and for evaluating the success of the learner. The evidence is
reasonably consistent and positive especially for mathematics and reading and at both primary and
secondary school levels, though there is some evidence that cross-age tutoring is more beneficial. For
example Topping et al. (2011) showing a long term follow up effect size 0.22 and Jun, Ramirez & Cumming
(2010) find an effect size of 1.05 (though this is based on only three studies).

26
PEER TUTORING AVERAGE IMPACT:
+ 6 MONTHS
EVIDENCE STRENGTH:
Cohen, Kulik & Kulik, 1982 (on tutees) 0.40
Cohen, Kulik & Kulik, 1982 (on tutors) 0.33 Ginsburg-Block et al., 2006 0.48
Jun, Ramirez & Cumming, 2010 (cross age) 1.05 Ritter et al., 2009 0.30
Rohrbeck et al., 2003 0.59
ADDITIONAL REFERENCES
Topping, K.J. (2005). Trends in Peer Learning Educational Psychology 25.6.pp 631-645. Topping, K., Miller, D., Thurston, A., McGavock, K. & Conlin, N. (2011). Peer tutoring in reading in Scotland:
thinking big. Literacy 45.1 pp 3-9.
PERFORMANCE PAY
Pay incentives for teachers attempt to tie a teacher’s remuneration to performance in the classroom. Most
teacher pay scales systems use salary schedules that pay teachers based on their qualifications and years
of service. Critics of this system point to research showing that there is little correlation between either
teachers’ years of experience or their holding an advanced degree and a student’s achievement level
arguing that teachers should be compensated, at least in part, according to the results they produce in their
classroom (Education Commission of the States, Teacher Merit Pay, 2010). There is evidence from
correlational studies (e.g. Woessman, 2010) that there is a link between teacher pay and pupil performance
at national level, though it is not clear that this is a causal connection. The idea behind the Teacher
Advancement Program (TAP) in Chicago is that performance incentives, combined with tools for teachers to
track performance and improve instruction, should help schools attract and retain talented teachers and help
all teachers produce greater student achievement (Glazerman & Seifullah, 2010). However a school-based
randomized trial in over 200 New York City public schools found no evidence that teacher incentives
increase student achievement or that they change student or teacher behaviour. Instead, teacher incentives
may decrease student achievement, especially in larger schools (Fryer, 2011). This is also in line with
Martins’ (2009) study. Similarly, no evidence was found that the TAP program raised student test scores in
maths and reading. Springer, Balou et al. (2010) reported in their three-year Project on Incentives in
Teaching (POINT) that, even though the general trend in middle school mathematics performance was
upward over the period of the project, students of teachers randomly assigned to the treatment group
(eligible for bonuses) did not generally outperform students whose teachers were assigned to the control
group (not eligible for bonuses).
By contrast, Lavy (2002) found that monetary performance incentives to teachers and schools caused
significant gains in many dimensions of students’ outcomes and these were more cost effective than
providing them with additional conventional resources. The UK scheme operated in its first year as a
general pay increase for almost all teachers at the eligible point of the scale rather than as an individual
performance related pay (PRP) scheme. Such a general pay increase may have little impact on pupil
attainment, though it may help retention rates (Burgess et al., 2001). There is some evidence of a link
between performance pay in the UK with pupil performance at GCSE suggesting the association may be as
much as 40% of a GCSE grade, though again the causal link is hard to establish (Atkinson et al. 2009). In
addition, it is hard to control for other variables which may influence the impact of pay increases, such as
teaching to the test or other forms of “gaming”. Dolton and Marcenaro-Gutierrez (2011) argue that the issue
is more related to recruitment and that if you increase teacher pay by about 5% you will increase student
performance by between 5-10%.
In terms of costs, under the UK national scheme for individual based performance related pay (Burgess et
al., 2001), successful teachers receive an annual bonus of £2000, which they will continue to receive until
the end of their career, without needing to reapply. They also move on to a new, upper pay scale where they
will be eligible for further performance-related increments. In POINT (Springer, Balou et al., 2010), the
maximum bonus an eligible teacher might earn was $15,000 – a considerable increase over base pay in this
system.

27
PERFORMANCE PAY
AVERAGE IMPACT:
0 MONTHS
EVIDENCE STRENGTH:
Martins 2009 -0.09 Woessman 2010 (correlational study) 0.25
ADDITIONAL REFERENCES
Atkinson, A., Burgess, S., Croxson, B., Gregg, P., Propper, C., Slater, H. & Wilson, D. (2009). Evaluating the Impact of Performance-related Pay for Teachers in England. Labour Economics 16:3, pp 251-261.
Burgess, S., Croxson, B., Gregg, P. & Propper, C. (2001). The Intricacies of the Relationship Between Pay and Performance for Teachers: Do teachers respond to Performance Related Pay schemes? CMPO Working Paper Series No. 01/35.
Dolton, P. & Marcenaro-Gutierrez, O. (2011). If You Pay Peanuts, Do You Get Monkeys? A Cross-country Analysis of Teacher Pay and Pupil Performance’. Economic Policy 26(65): 5-55,
Education Commission of the States (2010). Teacher Merit Pay: What do we Know?. The Progress of Education Reform, 11(3).
Fryer, R.G. (2011). Teacher Incentives and Student Achievement: Evidence from New York City Public Schools. National Bureau of Economic Research, Working Paper 16850.
Glazerman, S. & Seifullah, A. (2010). An Evaluation of the Teacher Advancement Program (TAP) in Chicago: Year Two Impact Report. Mathematica Policy Research, Inc.
Lavy, V. (2002). Evaluating the Effects of Teachers’ Group Performance Incentives on Pupil Achievement. Journal of Political Economy, 110(6), 1286-1317.
Martins, P.S. (2009). Individual Teacher Incentives, Student Achievement and Grade Inflation. Centre for Globalization Research: Working Paper 29. Queen Mary, University of London.
Podgursky, M.J. & Springer, M.G. (2006). Teacher Performance Pay: A Review. National Center on Performance Incentives.
Springer, M.G., Ballou, D., Hamilton, L., Le, V.N., Lockwood, J.R., McCaffrey, D.F., Pepper, M. & Stecher, B.M. (2010a). Teacher Pay for Performance: Experimental Evidence from the Project on Incentives in Teaching. Project on Incentives in Teaching, National Center on Performance Incentives.
Springer, M.G., Lewis, J.L., Ehlert, M.W., Podgursky, M.J., Crader, G.D., Taylor, L.L., Gronberg, T.J., Jansen, D.W., Lopez, O.S. & Stuit, D.A. (2010b). District Awards for Teacher Excellence (D.A.T.E.) Program: Final Evaluation Report. National Center on Performance Incentives.
PHONICS
The evidence for the effectiveness of phonics-based approaches to supporting young children’s reading is
clear, particularly when phonics is compared with other approaches to improving early reading (Ehri et al.,
2001; Stuebing et al., 2008). Importantly the evidence suggests that a systematic approach to phonics
should be embedded and taught explicitly as part of a wider approach to developing literacy and reading
(Torgerson et al., 2006). Indeed there is some indication that when systematic phonics is combined with
other structured language activities and with individual tutoring this may increase the effect threefold (Camilli
et al., 2003). It is also important to match a child’s current strengths and weaknesses in terms of alphabetic
and vocabulary knowledge (Connor et al., 2007).
Systematic use of phonics appears to provide modest but consistent benefits. All learners seem to benefit,
and low attaining learners appear to gain from the explicit nature of the instruction (Swanson, 1999). There is
some indication that phonics can help narrow the gap for disadvantaged learners (Jeynes et al., 2008). The
effect is mainly identifiable on reading accuracy. The impact on reading comprehension is lower and less
consistent (Ehri et al., 2001; Torgerson et al., 2006).
Overall the impact appears to be greater (Ehri et al., 2001) for beginning readers (0.55) than for older
children (0.27). Overall phonics appears effective across the primary age range, at least for minority and
disadvantaged groups in the USA (Jeynes, 2008) when compared with general teaching. However, some
researchers argue that there is no clear evidence that systematic phonics instruction outperforms alternative
approaches for pupils past the age of about 10 (Camilli, Vargas, Yureko, 2003: p 29); There are overall
indications that upper primary and lower secondary readers may benefit more from strategy instruction or
meta-cognitive approaches to improve reading skills than phonics-based approaches (Swanson, 1999;
Berkeley et al., 2009).

28
Systematic phonics instruction for reading is not likely to improve children’s spelling which will therefore need
to be taught separately and explicitly (Torgerson et al., 2006).
Finally it is important to bear in mind why teachers looked for alternatives to phonics in the 1970s (Jeynes,
2008). There is clear benefit from providing structure and a systematic approach, but it is also important to
maintain motivation and engagement in reading more widely.
PHONICS AVERAGE IMPACT:
+ 4 MONTHS
EVIDENCE STRENGTH:
Camillli, Vargas & Yurecko, 200311
0.24 Ehri, Nunes, Stahl & Willows, 2001 0.41
Jeynes, 2008 0.30 Torgerson, Brooks & Hall, 2006 0.27
ADDITIONAL REFERENCES
Connor, C.M., Morrison, F.J., Fishman, B.J., Schatschneider, C. & Underwood, P. (2007). Algorithm-guided individualized reading instruction. Science, 315, 464–465.
Stuebing, K.K., Barth, A.E., Cirino, P.T., Francis, D.J. & Fletcher, J.M. (2008). A response to recent reanalyses of the National Reading Panel report: Effects of systematic phonics instruction are practically significant. Journal of Educational Psychology, 100.1, 123-134.
Swanson, H.L. (1999). Reading Research for Students with LD: A Meta-Analysis of Intervention Outcomes Journal of Learning Disabilities 32, 504-532.
Berkeley, S., Scruggs, S.T. & Mastropieri, M.A. (2010). Reading Comprehension Instruction for Students With Learning Disabilities, 1995--2006: A Meta-Analysis. Remedial and Special Education 31, 423-436.
REDUCING CLASS SIZES
Overall the benefits are not particularly large or clear, until class size is reduced to under 20 or even below
15 (Hattie, 2005). There is little advantage in reducing classes from, say, 30 to 25. The issue is whether the
teacher changes their teaching approach when working with a smaller class and whether, as a result, the
pupils change their learning behaviours (Glass & Smith 1978). Having 15 pupils in a class and teaching them
in exactly the same way as a class of 30 will not make much difference. However there is evidence that,
when it is successful, the benefits can be identified in behaviour and attitudes as well as on attainment
(McGiverin et al., 1989), and that they persist for a number of years (from early primary school through to
Key Stage 3). Evidence from both the USA (Finn & Achilles, 1999) and from the UK does not support the use
of teaching assistants as an alternative to reducing class sizes (see ‘Teaching Assistants’ below). It appears
to be important that a class teacher has responsibility for the learning of a class. Other research in the UK
indicates that slightly larger effects have been found for the lower achievers and those from the lower
socioeconomic backgrounds for very young pupils. Optimistically a school might expect a few months
additional gain a year for pupils in smaller classes (an effect size of about 0.21) and that this gain will be
sustained. There is some evidence to support the additional benefit of professional development when class
sizes are reduced to enable teachers to capitalise on the potential benefits by developing their teaching skills
and approaches (McGiverin et al., 1989). In addition disadvantaged students may benefit more (Nye et al.,
2004).
REDUCING CLASS
SIZES
AVERAGE IMPACT:
+ 3 MONTHS
EVIDENCE STRENGTH:
Goldstein, Yang, Omar, Turner & Thompson, 2000 (correlational study) 0.20
Glass & Smith, 1978 0.01
McGiverin, Gilman & Tillitski, 1989 0.34 Slavin, 1989 0.17
11
‘Systematic phonics’ compared with ‘less systematic phonics’ instruction.
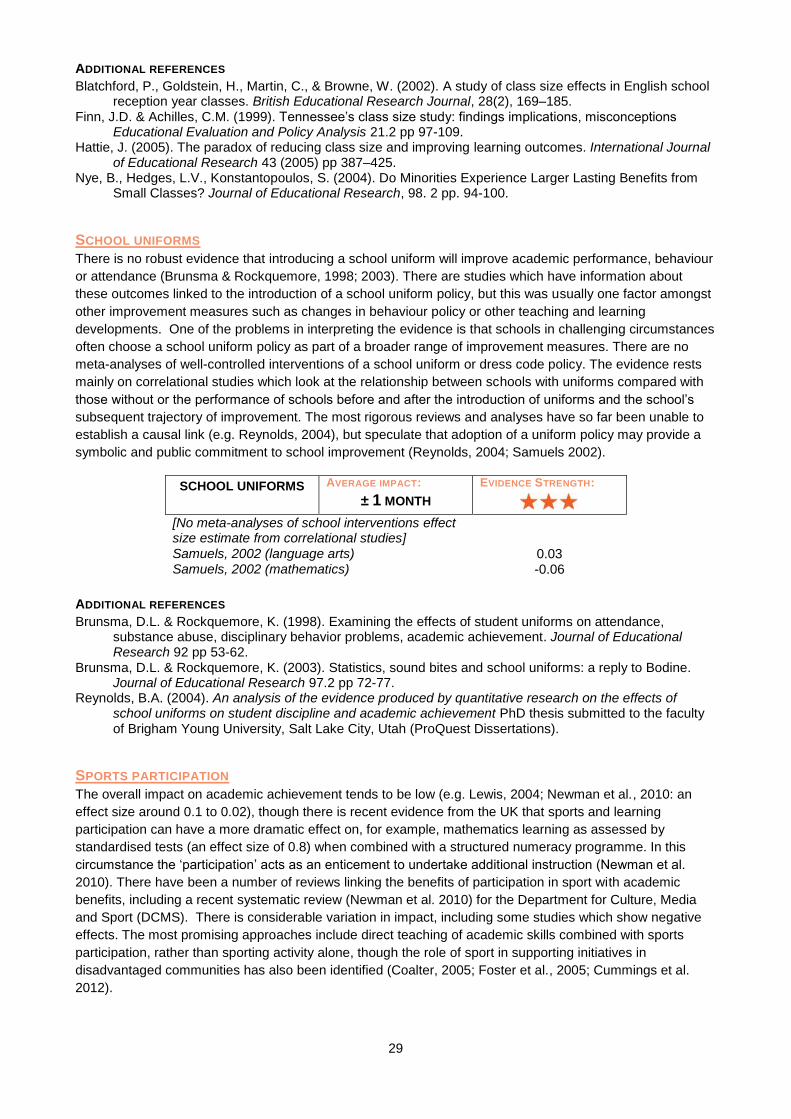
29
ADDITIONAL REFERENCES
Blatchford, P., Goldstein, H., Martin, C., & Browne, W. (2002). A study of class size effects in English school reception year classes. British Educational Research Journal, 28(2), 169–185.
Finn, J.D. & Achilles, C.M. (1999). Tennessee’s class size study: findings implications, misconceptions Educational Evaluation and Policy Analysis 21.2 pp 97-109.
Hattie, J. (2005). The paradox of reducing class size and improving learning outcomes. International Journal of Educational Research 43 (2005) pp 387–425.
Nye, B., Hedges, L.V., Konstantopoulos, S. (2004). Do Minorities Experience Larger Lasting Benefits from Small Classes? Journal of Educational Research, 98. 2 pp. 94-100.
SCHOOL UNIFORMS
There is no robust evidence that introducing a school uniform will improve academic performance, behaviour
or attendance (Brunsma & Rockquemore, 1998; 2003). There are studies which have information about
these outcomes linked to the introduction of a school uniform policy, but this was usually one factor amongst
other improvement measures such as changes in behaviour policy or other teaching and learning
developments. One of the problems in interpreting the evidence is that schools in challenging circumstances
often choose a school uniform policy as part of a broader range of improvement measures. There are no
meta-analyses of well-controlled interventions of a school uniform or dress code policy. The evidence rests
mainly on correlational studies which look at the relationship between schools with uniforms compared with
those without or the performance of schools before and after the introduction of uniforms and the school’s
subsequent trajectory of improvement. The most rigorous reviews and analyses have so far been unable to
establish a causal link (e.g. Reynolds, 2004), but speculate that adoption of a uniform policy may provide a
symbolic and public commitment to school improvement (Reynolds, 2004; Samuels 2002).
SCHOOL UNIFORMS AVERAGE IMPACT:
± 1 MONTH
EVIDENCE STRENGTH:
[No meta-analyses of school interventions effect size estimate from correlational studies]
Samuels, 2002 (language arts) 0.03 Samuels, 2002 (mathematics) -0.06
ADDITIONAL REFERENCES
Brunsma, D.L. & Rockquemore, K. (1998). Examining the effects of student uniforms on attendance, substance abuse, disciplinary behavior problems, academic achievement. Journal of Educational Research 92 pp 53-62.
Brunsma, D.L. & Rockquemore, K. (2003). Statistics, sound bites and school uniforms: a reply to Bodine. Journal of Educational Research 97.2 pp 72-77.
Reynolds, B.A. (2004). An analysis of the evidence produced by quantitative research on the effects of school uniforms on student discipline and academic achievement PhD thesis submitted to the faculty of Brigham Young University, Salt Lake City, Utah (ProQuest Dissertations).
SPORTS PARTICIPATION
The overall impact on academic achievement tends to be low (e.g. Lewis, 2004; Newman et al., 2010: an
effect size around 0.1 to 0.02), though there is recent evidence from the UK that sports and learning
participation can have a more dramatic effect on, for example, mathematics learning as assessed by
standardised tests (an effect size of 0.8) when combined with a structured numeracy programme. In this
circumstance the ‘participation’ acts as an enticement to undertake additional instruction (Newman et al.
2010). There have been a number of reviews linking the benefits of participation in sport with academic
benefits, including a recent systematic review (Newman et al. 2010) for the Department for Culture, Media
and Sport (DCMS). There is considerable variation in impact, including some studies which show negative
effects. The most promising approaches include direct teaching of academic skills combined with sports
participation, rather than sporting activity alone, though the role of sport in supporting initiatives in
disadvantaged communities has also been identified (Coalter, 2005; Foster et al., 2005; Cummings et al.
2012).

30
SPORTS
PARTICIPATION
AVERAGE IMPACT:
+ 3 MONTHS
EVIDENCE STRENGTH:
Newman et al., 2010 (academic outcomes) 0.19
Newman et al., 2010 (mathematics) 0.80 Lewis, 2004 0.10
ADDITIONAL REFERENCES
Cummings, C., Laing, K., Law, J., McLaughlin, J., Papps, I., Todd, L. & Woolner, P. (2012) Can Changing Aspirations And Attitudes Impact On Educational Attainment? A Review Of Interventions York: Joseph Rowntree Foundation.
Coalter, F. (2005). The social benefits of sport: an overview to inform the community planning process. Research Report no. 98. Edinburgh: SportScotland.
Foster, C., Hillsdon, M., Cavill, N., Allender, S., Cowburn, G. (2005). Understanding participation in sport: a systematic review. London: Sport England.
SUMMER SCHOOLS
The effects are reasonably consistent (with an average effect size of about 0.16 to 0.26: Cooper et al., 2000;
Lauer et al., 2006), though usually more beneficial for higher attaining pupils and less effective for low-SES
pupils. Programmes are usually more effective in mathematics, when they are specifically tailored to
students needs, and when parents are involved (Cooper et al., 2000), and when the summer school uses
tutoring and small group work (Lauer et al., 2006). Other variables seem to make less difference, such as
whether the teacher is one of the student’s usual teachers. Other approaches include summer work
placements and youth employment programmes (McClanahan et al., 2004) which appear to have a
beneficial impact on students’ aspirations.
SUMMER SCHOOLS
AVERAGE IMPACT:
+ 3 MONTHS
EVIDENCE STRENGTH:
Lauer, Akiba & Wilkerson 2006 0.16
Cooper et al 2000 0.26 Lewis 2004 0.10
ADDITIONAL REFERENCES
McClanahan, W.S., Sipe, C.L., & Smith, T.J. (2004). Enriching Summer Work: An Evaluation of the Summer Career Exploration Program Philadelphia, Pa: Public Private Ventures.
TEACHING ASSISTANTS
Most studies have consistently found very small or no effects on attainment associate with the support of
additional staff in classrooms (e.g. Muijs & Reynolds, 2003), though pupils’ perceptions and attitudes may be
more positively affected (Gerber et al., 2001; Blatchford et al., 2009). There are also positive effects in terms
of teacher morale and reduced stress of working with a teaching assistant. One clear implication from this is
that if teaching assistants are used with the intention of improving the learning of pupils, they should not
undertake the tasks they are routinely assigned. There is some evidence that there is greater impact when
teaching assistants are given a particular pedagogical role or responsibility in specific curriculum
interventions where the effect appears to be greater, particularly with training and support (Alborz et al.
2009). Even here, however, comparisons with qualified teachers suggest they are consistently less effective
(achieving about half the gains compared with qualified teachers). There are a number of systematic reviews
of the impact of support staff in schools (Farrell et al., 2010), though there are no meta-analyses specifically
looking at the impact of teaching assistants on pupils’ learning. However, there have been a number of
studies internationally which have consistently found broadly similar effects. The most recent research in the
UK (Blatchford et al., 2009) suggests low attaining pupils do less well with a teaching assistant.
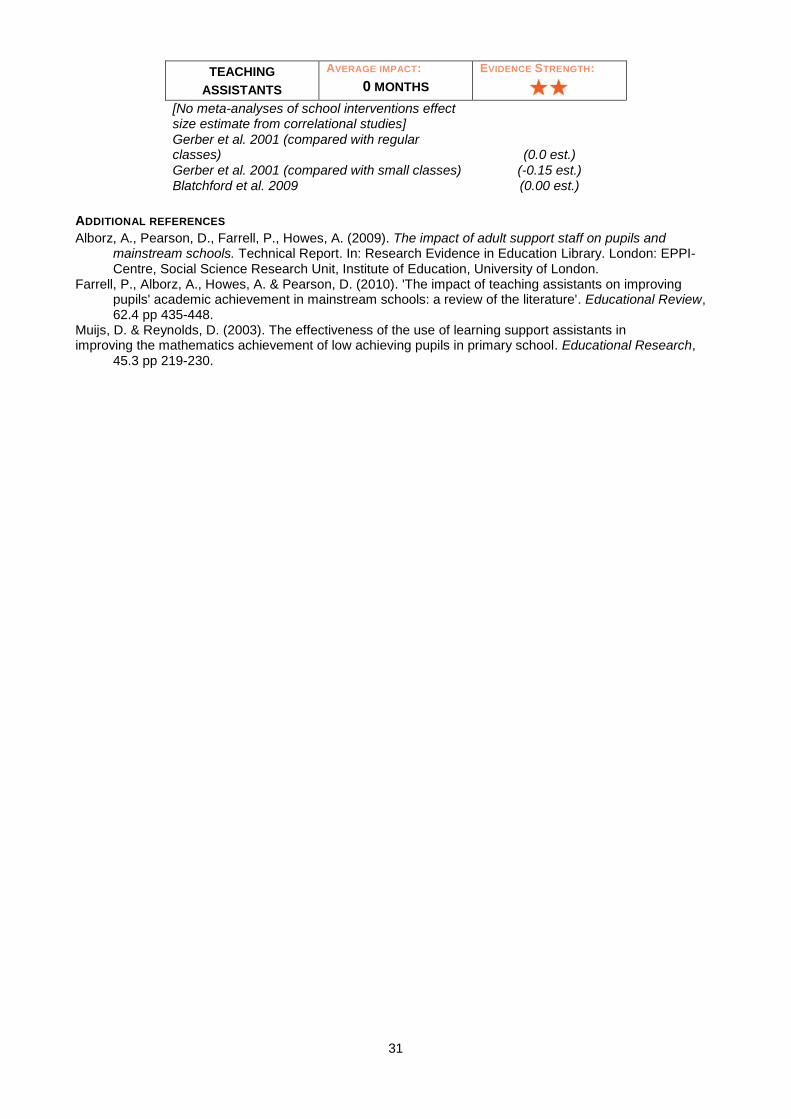
31
TEACHING
ASSISTANTS
AVERAGE IMPACT:
0 MONTHS
EVIDENCE STRENGTH:
[No meta-analyses of school interventions effect size estimate from correlational studies] Gerber et al. 2001 (compared with regular classes) (0.0 est.)
Gerber et al. 2001 (compared with small classes) (-0.15 est.) Blatchford et al. 2009 (0.00 est.)
ADDITIONAL REFERENCES
Alborz, A., Pearson, D., Farrell, P., Howes, A. (2009). The impact of adult support staff on pupils and mainstream schools. Technical Report. In: Research Evidence in Education Library. London: EPPI-Centre, Social Science Research Unit, Institute of Education, University of London.
Farrell, P., Alborz, A., Howes, A. & Pearson, D. (2010). 'The impact of teaching assistants on improving pupils' academic achievement in mainstream schools: a review of the literature'. Educational Review, 62.4 pp 435-448.
Muijs, D. & Reynolds, D. (2003). The effectiveness of the use of learning support assistants in improving the mathematics achievement of low achieving pupils in primary school. Educational Research,
45.3 pp 219-230.

32
APPENDIX 6: DATA TABLE OF META-ANALYSES AND OTHER
STUDIES USED TO ESTIMATE EFFECT SIZES
Meta-analysis
Pooled
effect ES SE SD
CI
lower
CI
upper
Min
ES
Max
ES
No.
stds
No.
Effts
Mod.
anls
Pub
bias
Ability grouping
Slavin 1990 (on low attainers) -0.06 Δ 29 15
Lou et al 1996 (on low attainers) -0.12 g -0.06 -0.01 -0.24 -1.96 1.52 Yes
Kulik & Kulik 1982 (secondary - all) 0.10 Δ 0.05 0.32 0.01 0.19 -1.25 1.50 52 36 Yes
Kulik & Kulik 1984 (elementary - all) 0.07 Δ 0.04 Yes
After school programmes
Durlak & Weissberg 2007 0.16 g 0.08 0.01 0.14 -0.16 0.67 55 66
Scott-Little et al 2002 NPE d 0.38 0.50
Fashola 1998 NPE d 0.11 0.90
Lauer, Akiba & Wilkerson 2006 0.16 g 0.03 0.05 0.27 15 Yes Yes
Crawford, 2011 0.40 d 0.05 0.30 0.50 23 Yes Yes
Arts participation
Standley 2008 0.32 d 0.05 0.23 0.41 -0.23 1.70 30 Yes Yes
Winner & Cooper 2000 (Maths) 0.04 d 0.14 15 15 Yes Yes
Newman et al. 2010
Newman et al. 2010 (sec maths) 0.03 gc 0.02 0.00 0.06 -0.01 0.05 1 3 Yes
Newman et al. 2010 (sec Eng) 0.05 gc 0.02 0.01 0.09 -0.01 0.08 1 3 Yes
Newman et al. 2010 (sec sci) 0.06 gc 0.01 0.05 0.07 0.05 0.06 1 3 Yes
Newman et al. 2010 (pri/EY cognitive) 0.45 gc 0.09 0.28 0.62 -0.06 1.13 5 10 Yes
Lewis 2004 0.20 d 0.15 5
Block scheduling and timetabling
Dickson et al. 2010 (achievement) 0.11 gc 0.06 -0.01 0.22 -0.14 0.48 7 Yes No
Dickson et al. 2010 (maths) -0.02 gc 0.07 -0.16 0.11 -0.14 0.10 6 Yes No
Dickson et al. 2010 (sci) 0.20 gc 0.07 0.06 0.33 0.13 0.42 4 Yes No
Lewis et al. 2005 (maths) -0.10 g 0.01 -0.11 -0.08 -0.15 -0.09 5
Lewis et al. 2005 (Eng) -0.17 g 0.01 -0.18 -0.15 -0.25 -0.05 3
Lewis et al. 2005 (sci) -0.12 g 0.01 -0.13 -0.10 -0.16 0.11 2
Early years intervention
Anderson et al. 2003 0.35 Δ -0.61 0.89 12 29 No
Lewis & Vosburgh 1988 0.41 0.04 0.47 0.33 0.73 0.21 0.96 65 No
LaParo & Pianta 2000 0.51 70 No
Nelson et al. 2003 0.52 g 0.01 1.25 34 Yes No
Gilliam & Zigler 2001 NPE Δ 0.07 0.50 13 No No
Camilli, Vargas, Ryan Barnett, 2010 0.23 39 250 Yes
Karoly, Kilburn & Cannon 2005 0.28 20 Yes
Feedback
Kluger & De Nisi, 1996 0.41 d 0.09 0.23 0.59 131 607 Yes Yes
Lysakowski & Walberg 1982 0.97 d 1.53 -1.09 4.99 54 94 Yes Yes
Walberg 1982 0.81 d 19 19
Tenebaum & Goldring 1989 0.72 15 16
Fuchs & Fuchs 1985 0.71 d 0.09 0.88 0.53 0.89 21 95 Yes Yes
Bangert-Drowns, Kulik, Kulik &
Morgan1991 0.26 0.06 0.38 -0.83 1.42 40 58
Tenebaum & Goldring 1989 0.72 0.37 1.42 15 16
Wiliam 2002 (KMOFAP) 0.32 g 0.08 0.16 0.48 1 19
Homework
Cooper, Robinson & Patal 2006 0.60 d 0.26 0.64 0.38 0.82 0.39 0.97 6 9
Paschal, Weinsten & Walberg 1984 0.36 Δ 0.24 -0.60 1.96 15 81

33
ICT
Niemiec & Walberg, 1985 0.32 d 0.4 102 Yes Yes
Waxman, Lin, Michko 2003 0.45 Δ 0.14 0.72 0.17 0.72 42 29
Torgerson & Elbourne 2002 0.37 gc 0.20 -0.02 0.77 -0.11 1.15 7 6
Torgerson & Zhu 2003 (on spelling) 0.02 gc 0.10 -0.17 0.58 4 Yes Yes
Torgerson & Zhu 2003 (on reading) -0.05 gc 0.14 -0.33 0.24 4 Yes Yes
Torgerson & Zhu 2003 (on writing) 0.89 gc 0.33 0.25 1.54 2 Yes Yes
Waxman et al. 2002 0.30 Δ 0.18 0.71 -0.05 0.83 13 13
Tamim et al. 2011 0.35 d 0.04 0.27 0.41 25m Yes
Liao, 2007 0.55 Δ 0.72 -1.36 2.54 52 Yes Yes
Pearson et al. 2005 0.49 gc 0.11 0.74 0.27 0.71 -.20 2.68 20 89 Yes Yes
Sitzman et al. 2006 (web-based
instruction) 0.15 gc 0.02 0.11 0.19 71
Individualised instruction
Horak, 1981 -0.07 Δ -1.49 0.53 60 129
Aiello & Lee 1980 (in science) 0.35 d 115
Bangert, Kulik & Kulik, 1983 0.10 Δ 0.05 0.00 0.20 -0.84 1.24 49 49
Willett, Yamashita & Anderson, 1983 0.17 Δ 0.41 -0.87 1.74 130 341
Learning styles
Kavale & Forness, 1987 0.14 d 0.06 0.28 0.02 0.27 39
Tamir 1985 0.02 d 54 13
Garlinger & Frank 1986 -0.03 d 7 7
Lovelace 2005 (Dunn & Dunn model) 0.67 d Yes Yes
Slemmer 2002 (in ICT contexts) 0.13 d 0.03 0.08 0.19 48 51 Yes
Meta-cognition and self-regulation strategies
Abrami et al. 2008 0.34 gc 0.01 0.61 0.31 0.37 -1.00 2.75 117 161 Yes Yes
Haller et al. 1988 0.71 d 0.81 0.25 3.80 20 8 No
Klauer & Phye 2008 0.69 gc 0.05 0.59 0.79 0.59 0.94 17 Yes
Higgins et al. 2005 0.62 gc 0.09 0.45 0.80 -0.17 1.61 19 19 No Yes
Chiu 1998 0.67 gc 0.68 -1.25 2.75 43 123
Dignath et al. 2008 0.62 d* 0.05 0.52 0.72 0.44 1.00 48 Yes
One-to-one tuition
Elbaum et al. 2000 0.41 Δ 0.05 0.32 0.49 -1.32 3.34 29 Yes Yes
Wasik & Slavin 1993 NPE Δ 0.20 1.16 16
Tanner et al. 2011 0.14 d
Jun, Ramirez, Cumming 2010 (by adults) 0.70 d 0.48 0.93 5 5 Yes Yes
Parental involvement
Jeynes 2005 0.27 gc 0.00 1.78 41 17
Jeynes 2007 0.25 gc 0.07 0.11 0.35 0.01 0.83 52 20
van Steensel at al. 2011 0.18 gc 0.06 0.11 0.24 30 47
Peer tutoring
Ritter et al. 2009 0.30 gc 0.06 0.18 0.42 0.26 0.45 28 Yes
Ginsburg-Block et al. 2006 0.48 g 0.39 0.38 0.78 36 36 Yes
Rohrbeck et al. 2003 0.59 gc 0.10 0.90 0.40 0.78 0.21 0.62 90 Yes Yes
Cohen, Kulik & Kulik 1982 (on tutees) 0.40 Δ 0.07 0.26 0.54 52 Yes Yes
Cohen, Kulik & Kulik 1982 (on tutors) 0.33 Δ 0.09 0.15 0.51 Yes Yes
Performance pay
Woessman 2010 (correl) 0.25
Martins 2009 (in Portugal) -0.09
Phonics
Ehri Nunes Stahl Willows 2001 0.41 d 0.03 0.36 0.47 -0.47 3.71 66 65 Yes Yes
Jeynes 2008 0.30 gc 0.10 0.10 0.50 -1.21 2.02 22 Yes Yes
Torgerson, Brooks & Hall 2006 0.27 d 0.09 0.10 0.45 -0.19 2.69 14 Yes Yes

34
Reducing class sizes
Goldstein, Yang, Omar, Turner &
Thompson, 2000 0.20 d -0.07 0.60 9 36
Glass & Smith 1978 0.01 Δ 77 725
McGiverin, Gilman & Tillitski 1989 0.34 d 0.13 0.09 0.59 -0.74 2.24 10 24
Slavin 1989 0.17 Δ
School uniforms
[No meta-analyses of school interventions]
Samuels 2002 - language arts 0.03 gc 0.11 -0.18 0.23 -0.06 0.03 1 2 No No
Samuels 2002 - mathematics -0.06 gc 0.11 -0.26 0.15 -0.06 0.03 1 2 No No
Sports participation
Newman et al. 2010 (academic outcomes) 0.19 gc 0.08 0.03 0.35 0.15 0.34 2 2 No Yes
Newman et al. 2010 (mathematics) 0.80 gc 0.11 0.58 1.02 0.66 0.98 1 2 No Yes
Lewis 2004 0.10 0.13 5 Yes No
Summer schools
Lauer, Akiba & Wilkerson 2006 0.16 g 0.01 -0.20 0.52 14 Yes Yes
Cooper et al 2000 0.26 d 0.01 0.24 0.28 -0.20 2.70 30
Lewis 2004 0.10 0.13 5 Yes Yes
Teaching assistants
[No meta-analyses of school interventions]
Gerber et al. 2001 (with regular classes)
NPE (0.0
est) d ns ns
Gerber et al. 2001 (with small classes)
NPE (-.15
est) d -0.13 -0.26
Blatchford et al. 2009 0.00
KEY
Single studies with ES or correlational values reported in italics
Types of effect size
Control group SD Glass Δ
SD unspecified Cohen's d d
Pooled SD Hedges g g
Pooled SD corrected for small sample bias
Hedges g
corrected gc
gc is also sometimes confusingly referred to as an
'unbiased estimator' or d d*
Values in red calculated
No pooled effect NPE
(mean – 1.96*se, mean + 1.96*se) CI to SE

35
APPENDIX 7: BIBLIOGRAPHY OF META-ANALYSES AND OTHER
STUDIES USED TO ESTIMATE EFFECT SIZES
Abrami, P.C., Bernard, R.M., Borokhovski, E., Wade, A., Surkes, M.A., Tamim, R., & Zhang, D. (2008).
Instructional Interventions Affecting Critical Thinking Skills and Dispositions: A Stage 1 Meta-Analysis.
Review of Educational Research 78.4 pp 1102-1134.
Aiello, N.C. (1981). A meta-analysis comparing alternative methods of individualized and traditional
instruction in science. Virginia Polytechnic Institute and State University). ProQuest Dissertations and
Theses, p 142. Retrieved from http://search.proquest.com/docview/303140546 (30/6/12).
Aiello, N.C. & Wolfle, L.M. (1980). A Meta-Analysis of Individualized Instruction in Science Paper presented
at the Annual Meeting of the American Educational Research Association (Boston, MA, April 7-11,
1980). ERIC ED190404.
Anderson, L.M., Shinn, C., Fullilove, M.T., Scrimshaw, S.C., Fielding, J.E., Normand, J., Carande-Kulis, V.G.
(2003). The Effectiveness of Early Childhood Development Programs: A Systematic Review. American
Journal of Preventative Medicine 24: 32-46.
Bangert, R.L., Kulik, J.A., Kulik, C.C. (1983). Individualized Systems of Instruction in Secondary Schools.
Review of Educational Research, 53.2. pp. 143-158.
Blatchford, P., Bassett, P., Brown, P., Koutsoubou, M., Martin, C., Russell, A. and Webster, R., with Rubie-
Davies, C. (2009). The impact of support staff in schools. Results from the Deployment and Impact of
Support Staff project. (Strand 2 Wave 2) (DCSF-RR148). London: Department for Children, Schools
and Families.
Camilli, G., Vargas, S., Ryan, S., & Barnett, W. S. (2008). Meta-Analysis of the effects of early education
interventions on cognitive and social development. Teachers College Record, 112.3: pp. 579–620
Chiu, C.W.T. (1998). Synthesizing Metacognitive Interventions: What Training Characteristics Can Improve
Reading Performance? Paper presented at the Annual Meeting of the American Educational Research
Association San Diego, CA, April 13-17, 1998.
Cohen, P.A., Kulik, J.A., Kulik, C.C. (1982). Educational Outcomes of Tutoring: A Meta-Analysis of Findings.
American Educational Research Journal, 19.2: pp. 237-248.
Cooper, H, Charlton, V., Muhlenbruck, M., Borman, G.D. (2000). Making the Most of Summer School: A
Meta-Analytic and Narrative Review. Monographs of the Society for Research in Child Development,
65.1, pp. 1-127
Cooper, H., Robinson, J.C., Patall, E.A. (2006). Does Homework Improve Academic Achievement? A
Synthesis of Research, 1987-2003. Review of Educational Research, 76. 1 pp. 1-62.
Crawford, S.T. (2011). Meta-analysis of the impact of after-school programs on students reading and
mathematics performance. University of North Texas). ProQuest Dissertations and Theses, Retrieved
from http://search.proquest.com/docview/919077210 (20/6/12).
Dignath, C, Buettner,G and Langfeldt. H (2008). How can primary school students learn self-regulated
learning strategies most effectively? A meta-analysis on self-regulation training programmes.
Educational Research Review 3.2 pp. 101-129.
Durlak, J.A. & Weissberg, R.P. (2007). The impact of after-school programs that promote personal and social
skills. Chicago, IL: Collaborative for Academic, Social, and Emotional Learning.
Elbaum, B., Vaughn, S.M., Hughes, M.T. & Moody, S.M. (2000). How Effective Are One-to-One Tutoring
Programs in Reading for Elementary Students at Risk for Reading Failure? A Meta-Analysis of the
Intervention Research. Journal of Educational Psychology 92.4 (2000): 605-619.

36
Fashola. O.S. (1998). Review Of Extended-Day And After-School Programs And Their Effectiveness Report
No. 24 Baltimore, Center for Research on the Education of Students Placed At Risk (CRESPAR),
Johns Hopkins University.
Fuchs, L.S. & Fuchs, D. (1986). Effects of systematic formative evaluation A meta-analysis. Exceptional
Children, 53.3 pp 199-208.
Garlinger, D.K. & Frank, B.M. (1986). Teacher-student cognitive style and academic achievement: a review
and a mini-meta analysis. Journal of Classroom Interaction 21.2, 2-8.
Gerber, S.B., Finn, J.D., Achilles, C.M. and Boyd-Zacharias, J. (2001). Teacher aides and students’
academic achievement. Educational Evaluation and Policy Analysis 23.2 pp 123-143.
Gilliam, W. & Zigler, E.F. (2000). A critical meta-analysis of all evaluations of state-funded preschool from
1977 to 1998: implications for policy, service delivery and program evaluation. Early Childhood
Research Quarterly, 15(4), 441-473.
Glass, G.V. & Smith, M.L. (1978). Meta-analysis of research on the relationship of class size and
achievement. San Francisco: Far West Laboratory for Educational Research and Development.
Goldstein, H., Yang, M., Omar, R., Turner, R., & Thompson, S. (2000). Meta-analysis using multilevel
models with an application to the study of class size effects. Journal of the Royal Statistical Society:
Series C (Applied Statistics), 49(3), 399-412.
Haller, E.P., Child, D.A. & Walberg, H.J. (1988). Can Comprehension be taught? A Quantitative Synthesis of
“Metacognitive Studies.” Educational Researcher, 17.9 pp 5-8.
Higgins, S., Hall, E., Baumfield, V., & Moseley, D. (2005). A meta-analysis of the impact of the
implementation of thinking skills approaches on pupils. In: Research Evidence in Education Library.
London: EPPI-Centre, Social Science Research Unit, Institute of Education, University of London.
Horak, V.M. (1981). A Meta-Analysis of Research Findings on Individualized Instruction in Mathematics.
Journal of Educational Research, 74:4 p 249.
Jeynes, W.H. (2005). A Meta-Analysis of the Relation of Parental Involvement to Urban Elementary School
Student Academic Achievement. Urban Education, 40.3 pp 237-269.
Jeynes, W.H. (2007). The Relationship Between Parental Involvement and Urban Secondary School Student
Academic Achievement: A Meta-Analysis. Urban Education, 42.1 pp 82-110.
Kavale, K.A. & Forness, S.R. (1987). Substance Over Style: Assessing the Efficacy of Modality Testing and
Teaching. Exceptional Children, 54.3 pp. 228-39.
Karoly, L., Kilburn, R., Cannon, J.S. (2005). Early Childhood Interventions: Proven Results, Future Promise.
Rand Corporation. Available at: http://www.rand.org/pubs/monographs/2005/RAND_MG341.pdf
(30/6/12).
Klauer, K.J. & Phye, G.D. (2008). Inductive Reasoning: A Training Approach. Review of Educational
Research, 78.1 pp 85-123.
Kluger, A.N. & De Nisi, A. (1996). Effects of feedback intervention on performance: A historical review, a
meta-analysis, and a preliminary feedback intervention theory. Psychological Bulletin, 119.2 pp 254-
284.
Kulik, C.C. & Kulik, J.A. (1982). Effects of Ability Grouping on Secondary School Students: A Meta-Analysis
of Evaluation Findings. American Educational Research Journal, Vol. 19, 3 pp. 415-428.
La Paro, K.M. & Pianta, R.C. (2000). Predicting Childrenʼs Competence in the Early School Years: A Meta-
Analytic Review. Review of Educational Research, 70.4 pp 443-484.

37
Lauer P., Akiba, M., Wilkerson, S.B., Apthorp, H.S., Snow, D., & Martin-Glenn, M.L. (2006). Out-of-School-
Time Programs: A Meta-Analysis of Effects for At-Risk Students. Review of Educational Research,
76(2), 275-313.
Lewis, C.P. (2004). The Relation Between Extracurricular Activities With Academic And Social
Competencies In School Age Children: A Meta-Analysis PhD thesis submitted to the Office of
Graduate Studies of Texas A&M University, College Station, Tx (ProQuest Dissertations)
Lewis, R.J. & Vosburgh, W.T. (1988). Effectiveness of Kindergarten Intervention Programs: A Meta-Analysis.
School Psychology International, 9(4), 265-275.
Lewis, C.W., Winokur, M.A., Cobb, R.B., Gliner, G.S., Schmidt, J. (2005). Block Scheduling in the High
School Setting A Synthesis of Evidence-Based Research MPR Associates, Inc., Berkeley, CA/ Office
of Vocational and Adult Education, U.S. Department of Education.
Liao, Y.C. (2007). Effects of Computer-Assisted Instruction on Students' Achievement in Taiwan: A Meta-
Analysis. Computers and Education, 48.2 pp 216-233.
Lou, Y., Abrami, P.C., & dʼApollonia, S. (2001). Small Group and Individual Learning with Technology: A
Meta-Analysis. Review of Educational Research, 71(3), 449-521.
Lovelace, M.K. (2002). A meta-analysis of experimental research studies based on the Dunn and Dunn
learning-style model. St. John's University (New York), School of Education and Human Services).
ProQuest Dissertations and Theses, p 177. Retrieved from
http://search.proquest.com/docview/275698679 (20/6/12).
Lovelace, M.K. (2005) Meta-Analysis of Experimental Research Based on the Dunn and Dunn Model. The
Journal of Educational Research, 98:3, pp 176-183.
Lysakowski, R.S., & Walberg, H.J. (1982). Instructional Effects of Cues, Participation, and Corrective
Feedback: A Quantitative Synthesis. American Educational Research Journal, 19(4), 559-578.
Martins, P.S. (2009). "Individual Teacher Incentives, Student Achievement and Grade Inflation," IZA
Discussion Papers 4051, Institute for the Study of Labor (IZA).
McGiverin, J., Gilman, D., & Tillitski, C. (1989). A Meta-Analysis of the Relation between Class Size and
Achievement. The Elementary School Journal, 90(1), 47.
Nelson, G., Westhues, A. & MacLeod, J. (2003). A Meta-analysis of Longitudinal Research on Preschool
Prevention Programs for Children. Prevention and Treatment, 6(2), 46-50.
Newman, M., Bird, K., Tripney, J., Kalra, N., Kwan, I., Bangpan, M., Vigurs, C. (2010). Understanding the
impact of engagement in culture and sport: A systematic review of the learning impacts for young
people In: Research Evidence in Education Library. London: EPPI-Centre, Social Science Research
Unit, Institute of Education, University of London.
Niemiec, R.P. & Walberg, H.J. (1985). Computers and Achievement in the Elementary Schools. Journal of
Educational Computing Research, 1(4), 435-40.
Paschal, R.A., Weinstein, T. & Walberg, H.J. (1984). The effects of homework on learning: A quantitative
synthesis. The Journal of Educational Research, 78(2), 97-104.
Pearson, D.P., Ferdig, R.E., Blomeyer, R.L. & Moran, J. (2005). The Effects of Technology on Reading
Performance in the Middle-School Grades: A Meta-Analysis With Recommendations for Policy
Naperville, Il: University of Illinois/North Central Regional Educational Laboratory.
Rohrbeck, C., Ginsburg-Block, M.D., Fantuzzo, J. W. & Miller, T.R. (2003). Peer-assisted learning
interventions with elementary school students: A meta-analytic review. Journal of Educational
Psychology, 95(2), 240-257.

38
Samuels, K.S. (2003). The relationship of school uniforms to students' achievement, attendance, discipline
referrals and perceptions: an analysis of one school district. PhD dissertation University of Alabama at
Birmingham (ProQuest Dissertations and Theses)
Scott-Little, C. (2002). Evaluations of After-School Programs: A Meta-Evaluation of Methodologies and
Narrative Synthesis of Findings. American Journal of Evaluation, 23(4), 387-419.
Sitzmann, T., Kraiger, K., Stewart, D. & Wisher, R. (2006). The Comparative Effectiveness Of Web-Based
And Classroom Instruction: A Meta-Analysis. Personnel Psychology 59, 623–664.
Slavin, R.E. (1989). Class Size and Student Achievement: Small Effects of Small Classes. Educational
Psychologist, 24. Pp 25-77
Slavin, R.E. (1990). Achievement Effects of Ability Grouping in Secondary Schools: A Best-Evidence
Synthesis. Review of Educational Research, 60.3, 471.
Slemmer, D.L. (2002). The effect of learning styles on student achievement in various hypertext, hypermedia
and technology enhanced learning environments: a meta-analysis Unpublished PhD dissertation,
Boise State University, Boise, Idaho (ProQuest Dissertations and Theses).
Standley, J.M. (2008). Does Music Instruction Help Children Learn to Read? Evidence of a Meta-Analysis.
Update. Applications of Research in Music Education, 27.1, pp. 17-32.
Tamim, R.M. (2009). Effects of Technology on Studentsʼ Achievement: A Second-Order Meta-Analysis.
Unpublished PhD dissertation Concordia University, Montreal Canada (ProQuest Dissertations and
Theses).
Tamir, P. (1985). Meta-analysis of cognitive preferences and learning. Journal of Research in Science
Teaching 22.1 pp 1-17.
Tanner, E., Brown, A., Day, N. Kotecha, M., Low, N., Morrell, G., Brown, V., Collingwood, A., Chowdry, H.,
Greaves, E., Harrison, C., Johnson, G., & Purdon, S. (2011). Evaluation of Every Child a Reader
(ECar): Research Report DFE-RR114 London: Department for Education.
Tenenbaum, G., & Goldring, E. (1989). A Meta-Analysis of the Effect of Enhanced Instruction: Cues,
Participation, Reinforcement and Feedback, and Correctives on Motor Skill Learning. Journal of
Research and Development in Education, 22(3), 53-64.
Torgerson, C.J. & Elbourne, D. (2002). A systematic review and meta-analysis of the effectiveness of
information and communication technology (ICT) on the teaching of spelling. Journal of Research in
Reading, 25, 129-143.
Torgerson, C, & Zhu, D. (2003). A systematic review and meta-analysis of the effectiveness of ICT on
literacy learning in English, 5-16. In: Research Evidence in Education Library. London: EPPI-Centre,
Social Science Research Unit, Institute of Education.
van Steensel, R., McElvany, N. Kurvers J. & Herppich S. (2011). How Effective Are Family Literacy
Programs? : Results of a Meta-Analysis. Review Of Educational Research 81.1 pp 69-96.
Walberg, H.J. (1982). What makes schooling effective? Contemporary Education Review, 1, 1–34.
Wasik, B. A., & Slavin, R. E. (1993). Preventing Early Reading Failure with One-to-One Tutoring: A Review
of Five Programs. Reading Research Quarterly, 28(2), 179–200.
Waxman, H.C., Connell, M.L., & Gray, J. (2002). A Quantitative Synthesis of Recent Research on the Effects
of Teaching and Learning With Technology on Student Outcomes. Naperville, Illinios.

39
Waxman, H.C., Lin, M. & Michko, G.M. (2003). A Meta-Analysis of the Effectiveness of Teaching and
Learning With Technology on Student Outcomes A Meta-Analysis of the Effectiveness of Teaching
and Learning With Technology on Student Outcomes December 2003. Technology. Naperville, Illinois.
Wiliam, D. (2002). ‘Linking Research and Practice: knowledge transfer or knowledge creation?’ Plenary
presentation at the annual conference of the North American Chapter of the International Group for
the Psychology of Mathematics Education, Athens, Georgia, USA, October 2002.
Willett, J.B., Yamashita, J.J. & R.D. Anderson (1983). "A Meta-Analysis of Instructional Systems Applied in
Science Teaching." Journal of Research in Science Teaching 20(5):405-17.
Winner, E., & Cooper, M. (2000). Mute Those Claims: No Evidence (Yet) for a Causal Link between Arts
Study and Academic Achievement. Journal of Aesthetic Education, 34(3/4), 11. .
Woessmann, L. (2010). Cross-Country Evidence on Teacher Performance Pay. CESifo Working Paper No.
3151 Category 5: Economics Of Education Munich: CESifo.