the taxicab as public transportation in boston
TRANSCRIPT

THE TAXICAB AS PUBLIC TRANSPORTATION IN BOSTON
Drew Austin (corresponding author) Port Authority of New York & New Jersey
(317) 372-1320 91 Nevins St. #2
Brooklyn, NY 11217 [email protected]
P. Christopher Zegras Massachusetts Institute of Technology
Department of Urban Studies and Planning (617) 452-2433
(617) 258-8081 (fax) 77 Massachusetts Avenue, Room 10-403
Cambridge, MA 02139 [email protected]

ABSTRACT
This paper investigates the taxicab and its role as a form of public transportation, using Bostonʼs taxicab system as an opportunity to study the modeʼs function in the city as well as its relationship to other forms of transportation. In many American cities, the taxicab is an important but frequently overlooked public transportation mode, and it represents a significant opportunity to provide mobility in many places where conventional mass transit cannot do so in a cost-effective manner.
The central inquiry of this paper is when and where the taxicab operates as a complement or a substitute to Bostonʼs mass transit system, and which factors appear to affect its fulfillment of each role. Taxicab activity in Boston is analyzed using trip-level data recorded for Boston taxicabs during the past two years, mapping taxicab activity and specifying regression models that illuminate significant relationships between the taxicab, transit access, and other characteristics of the urban environment. Evidence suggests that the taxicab acts as both a mass transit substitute and complement in Boston, and that this tendency varies by transit line and time of day. These models are also used to infer the existence of unmet demand for taxicab service.
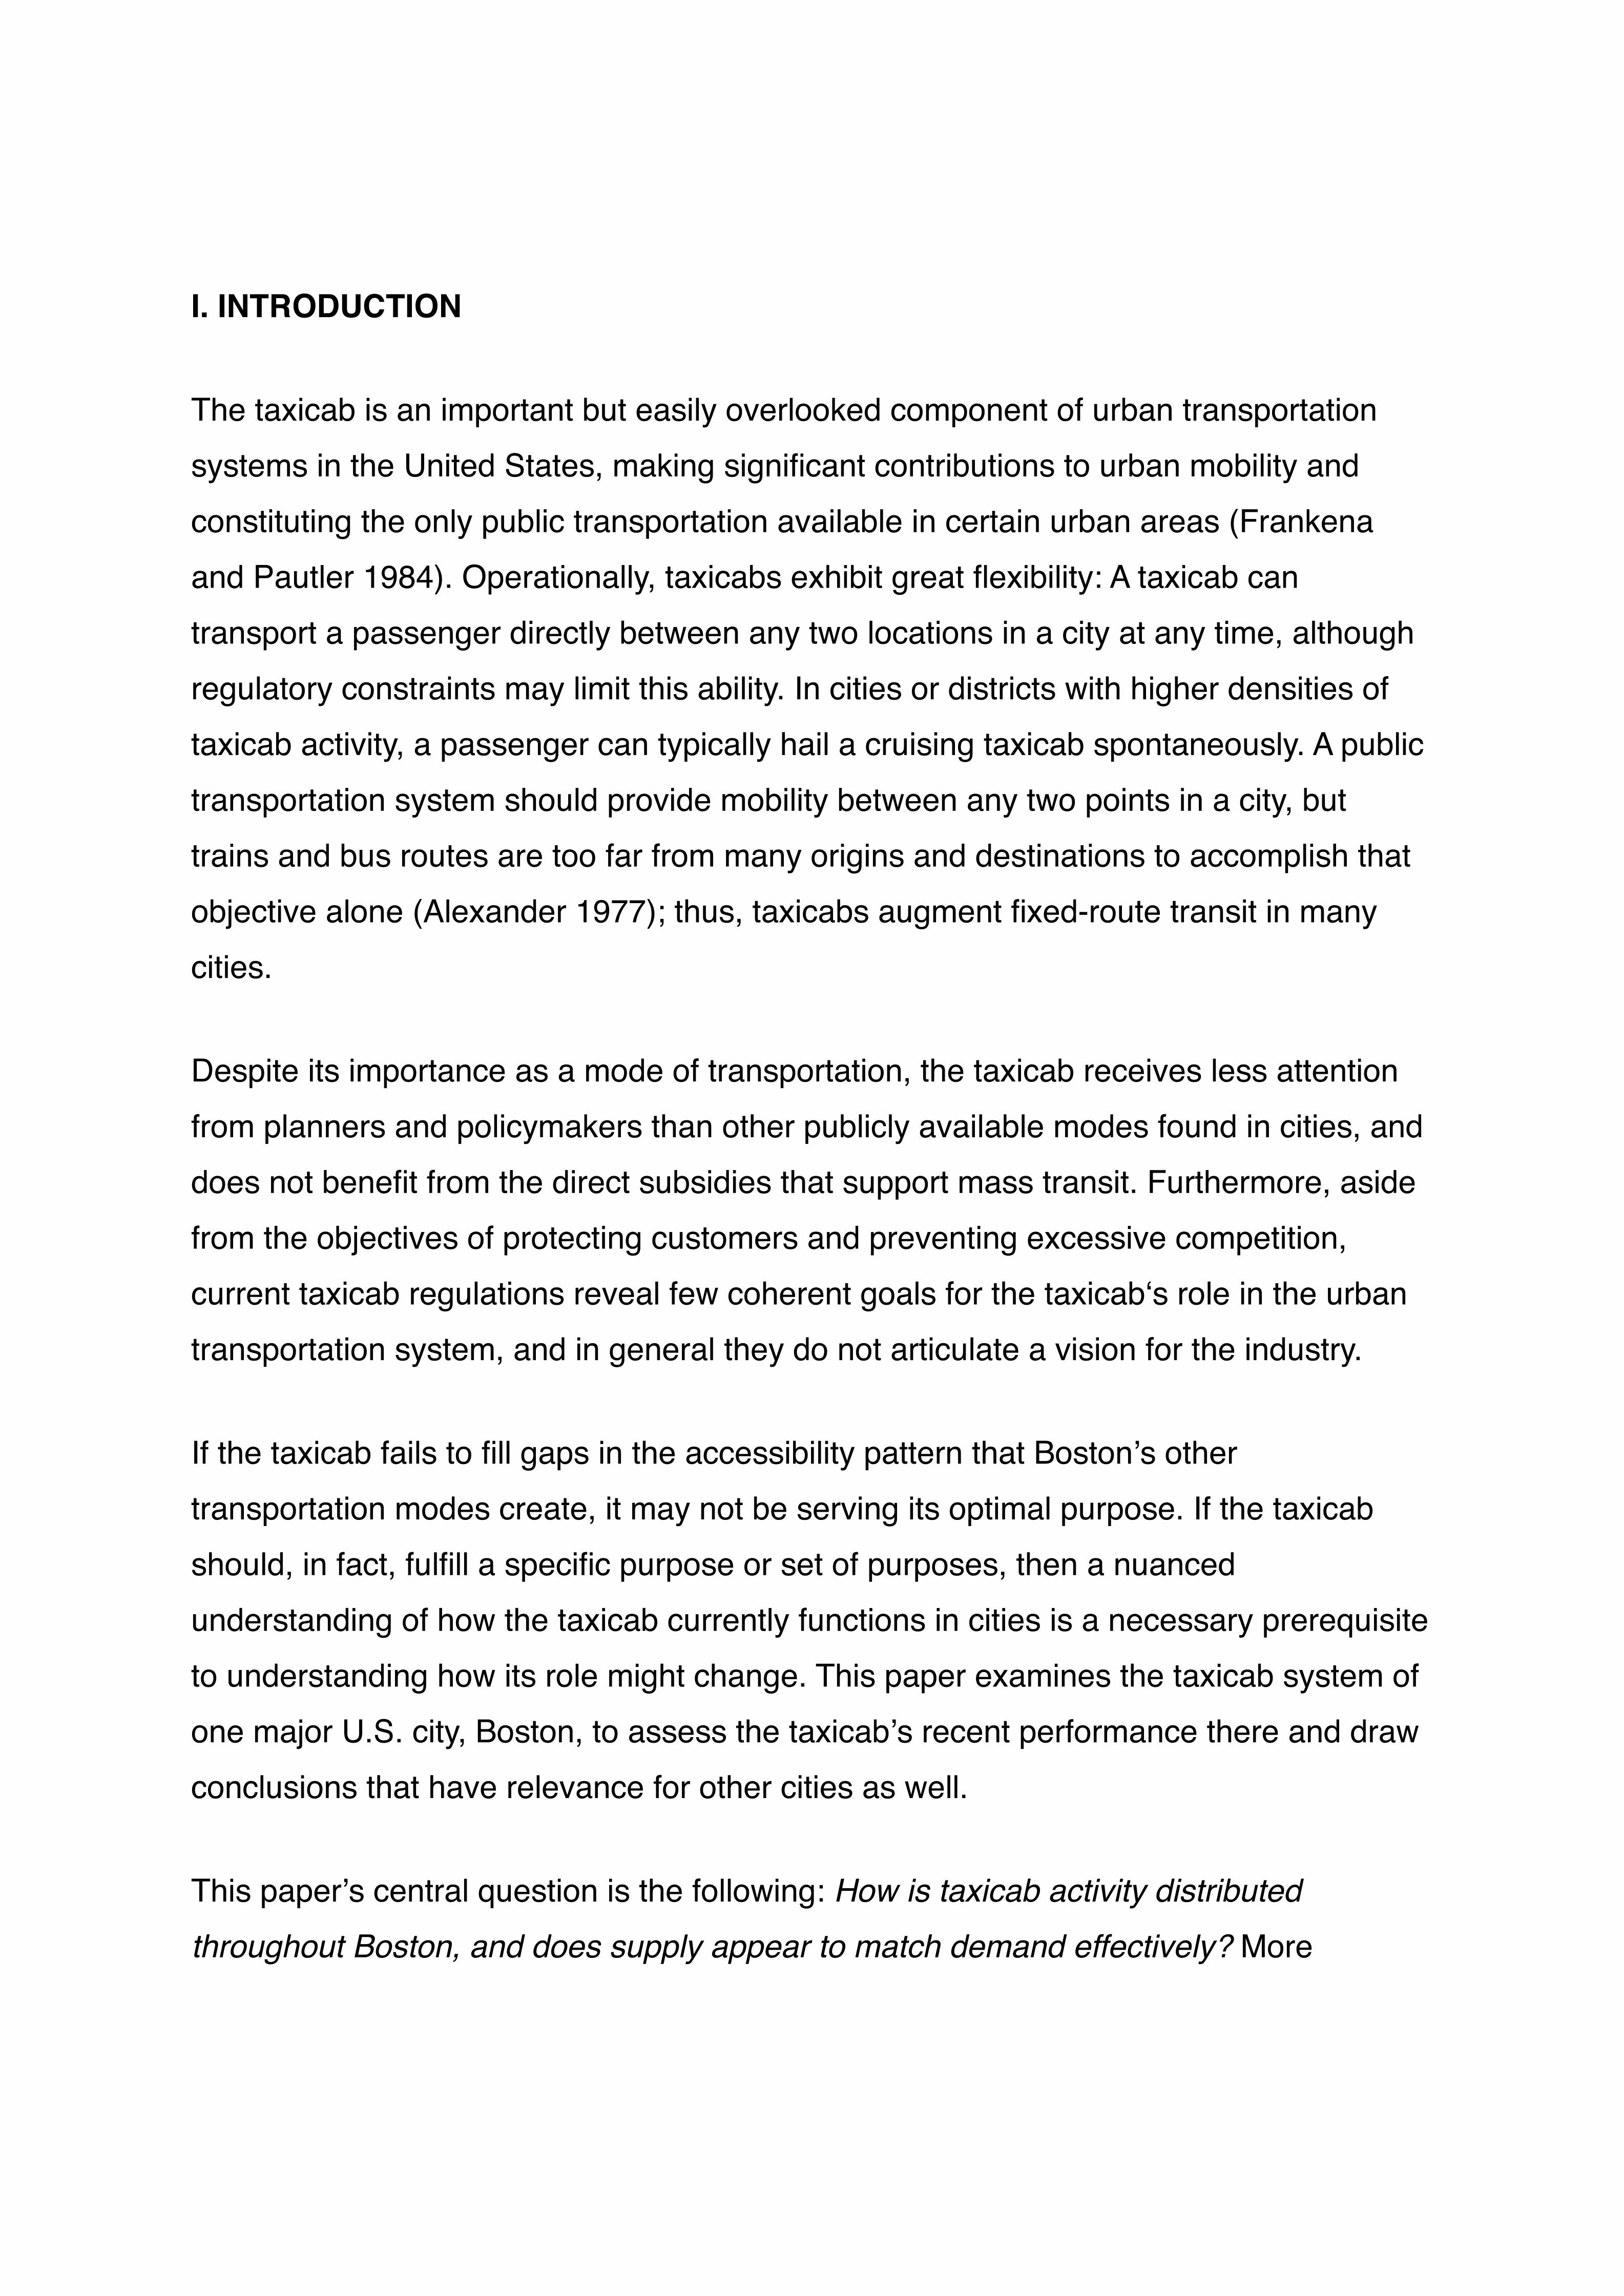
I. INTRODUCTION
The taxicab is an important but easily overlooked component of urban transportation
systems in the United States, making significant contributions to urban mobility and
constituting the only public transportation available in certain urban areas (Frankena
and Pautler 1984). Operationally, taxicabs exhibit great flexibility: A taxicab can
transport a passenger directly between any two locations in a city at any time, although
regulatory constraints may limit this ability. In cities or districts with higher densities of
taxicab activity, a passenger can typically hail a cruising taxicab spontaneously. A public
transportation system should provide mobility between any two points in a city, but
trains and bus routes are too far from many origins and destinations to accomplish that
objective alone (Alexander 1977); thus, taxicabs augment fixed-route transit in many
cities.
Despite its importance as a mode of transportation, the taxicab receives less attention
from planners and policymakers than other publicly available modes found in cities, and
does not benefit from the direct subsidies that support mass transit. Furthermore, aside
from the objectives of protecting customers and preventing excessive competition,
current taxicab regulations reveal few coherent goals for the taxicabʻs role in the urban
transportation system, and in general they do not articulate a vision for the industry.
If the taxicab fails to fill gaps in the accessibility pattern that Bostonʼs other
transportation modes create, it may not be serving its optimal purpose. If the taxicab
should, in fact, fulfill a specific purpose or set of purposes, then a nuanced
understanding of how the taxicab currently functions in cities is a necessary prerequisite
to understanding how its role might change. This paper examines the taxicab system of
one major U.S. city, Boston, to assess the taxicabʼs recent performance there and draw
conclusions that have relevance for other cities as well.
This paperʼs central question is the following: How is taxicab activity distributed
throughout Boston, and does supply appear to match demand effectively? More
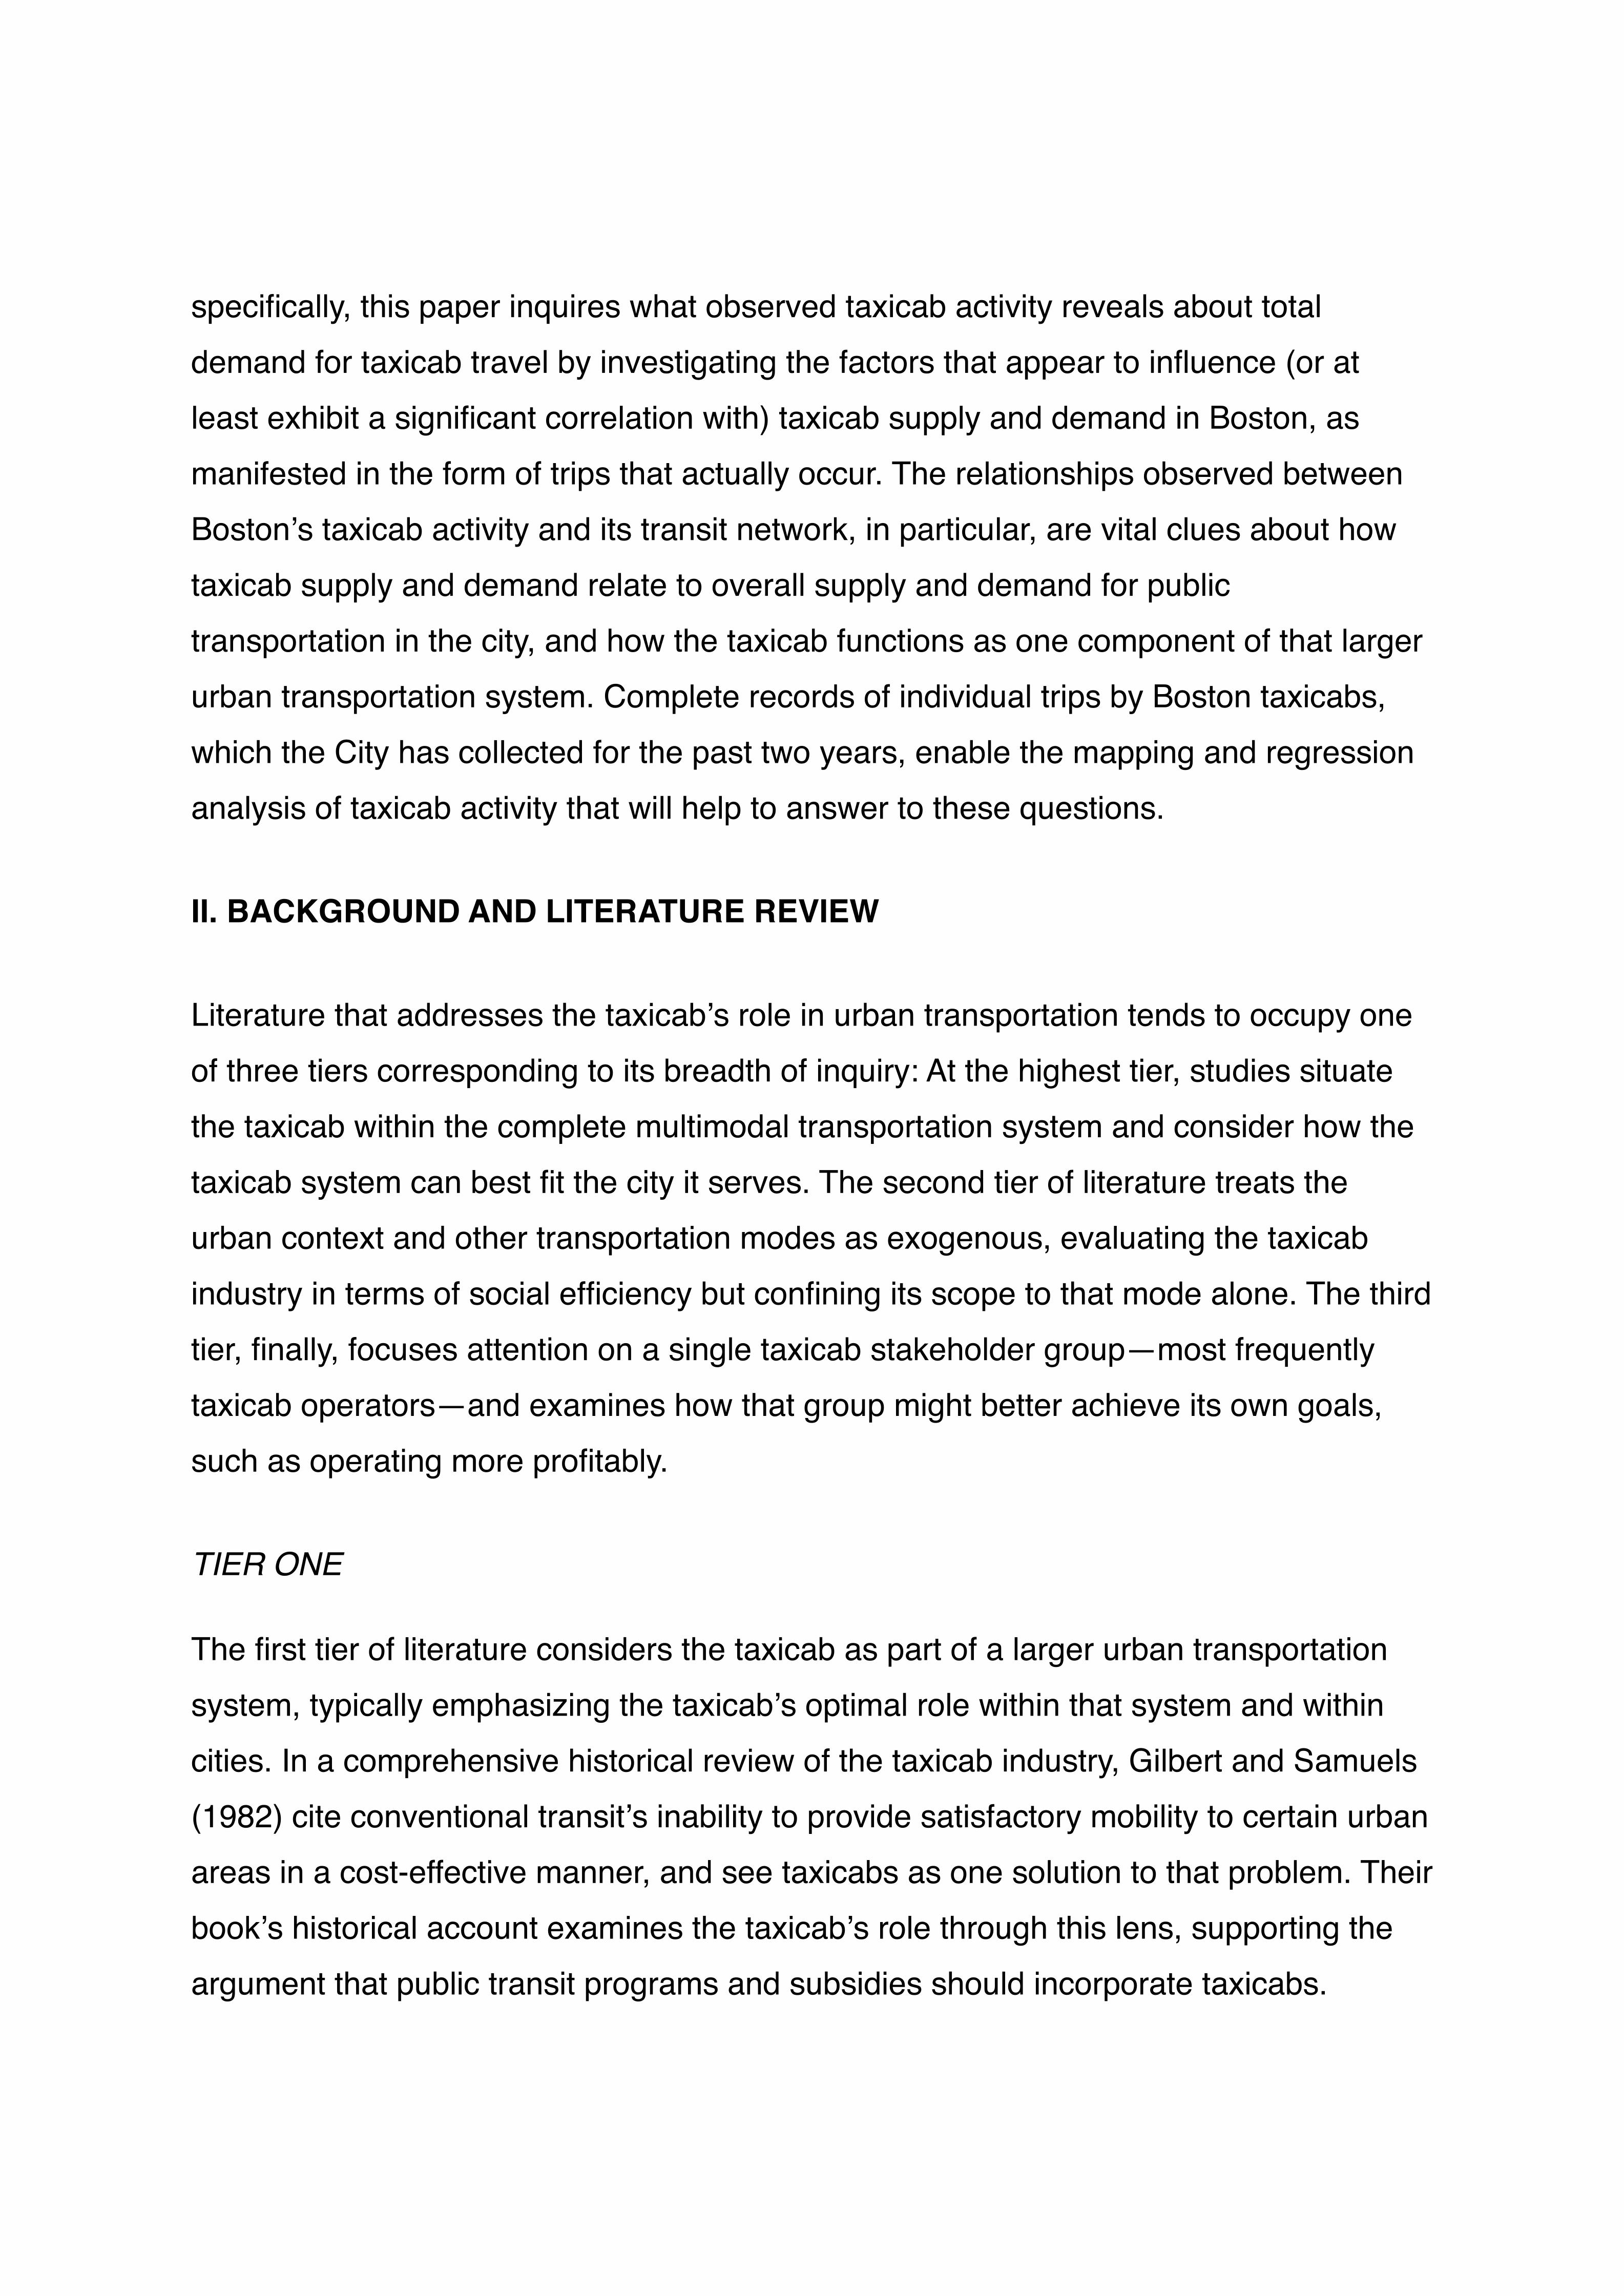
specifically, this paper inquires what observed taxicab activity reveals about total
demand for taxicab travel by investigating the factors that appear to influence (or at
least exhibit a significant correlation with) taxicab supply and demand in Boston, as
manifested in the form of trips that actually occur. The relationships observed between
Bostonʼs taxicab activity and its transit network, in particular, are vital clues about how
taxicab supply and demand relate to overall supply and demand for public
transportation in the city, and how the taxicab functions as one component of that larger
urban transportation system. Complete records of individual trips by Boston taxicabs,
which the City has collected for the past two years, enable the mapping and regression
analysis of taxicab activity that will help to answer to these questions.
II. BACKGROUND AND LITERATURE REVIEW
Literature that addresses the taxicabʼs role in urban transportation tends to occupy one
of three tiers corresponding to its breadth of inquiry: At the highest tier, studies situate
the taxicab within the complete multimodal transportation system and consider how the
taxicab system can best fit the city it serves. The second tier of literature treats the
urban context and other transportation modes as exogenous, evaluating the taxicab
industry in terms of social efficiency but confining its scope to that mode alone. The third
tier, finally, focuses attention on a single taxicab stakeholder group—most frequently
taxicab operators—and examines how that group might better achieve its own goals,
such as operating more profitably.
TIER ONE
The first tier of literature considers the taxicab as part of a larger urban transportation
system, typically emphasizing the taxicabʼs optimal role within that system and within
cities. In a comprehensive historical review of the taxicab industry, Gilbert and Samuels
(1982) cite conventional transitʼs inability to provide satisfactory mobility to certain urban
areas in a cost-effective manner, and see taxicabs as one solution to that problem. Their
bookʼs historical account examines the taxicabʼs role through this lens, supporting the
argument that public transit programs and subsidies should incorporate taxicabs.

Webster et al. (1974) advance a similar argument, emphasizing “improvement in intra-
city public transportation within urbanized areas through better integration of taxi
services with mass transit” (6-3). They cite key operational advantages of the taxicab as
a mode, including its low capital requirements and its ability to serve a wide range of
origin-destination pairs.
Cervero (1997) advances a similar case for paratransit in general. Paratransit, he
states, can encourage modal shifts away from cars, increase travel choices, enhance
mobility in poor neighborhoods, and shoulder a portion of transit systemsʼ peak
demand. Cervero offers a Berkeley case study in which unsubsidized shared-ride
taxicabs effectively extended existing bus service between a transit station and a
racetrack four miles away. More than 60 percent of rail passengers transferred to
taxicabs to reach the racetrack and the taxicab operators matched the competing bus
routeʼs $2 fares. Evidence therefore suggests that a symbiotic relationship between
taxicabs and mass transit is feasible and desirable, although rare.
TIER TWO
The second tier of taxicab literature focuses more narrowly on the taxicab industry,
studying demand for the mode and inquiring how taxicabs might increase their benefits
to passengers or society (including drivers and owners). Net social benefit, as
conceived by much of this literature, is the sum of aggregate consumer surplus and
profit, the latter of which is often assumed to be zero under perfect competition. By
invoking the idea of a social optimum, this tier differs from the first in a critical way: This
literature assesses the taxicab industryʼs contribution to social welfare independently of
its relationship to other transportation modes.
Many have studied the taxicab industryʼs fare controls and entry restrictions in order to
understand how each affects the equilibrium of taxicab supply and demand in various
cities (Douglas 1972; Schroeter 1983; Koehler 2004; Schaller 2007). Others contend
that properly informed regulations can contribute to socially optimal or second-best
outcomes but acknowledge the difficulty of obtaining “suitable information” (Beesley and

Glaister 1983, 594; Cairns and Liston-Heyes 1996). In general, this literature asks how
the taxicab industry can maximize its efficiency for a given fare price—a critical
question, but one that addresses taxicab supply and demand in place of overall mobility.
TIER THREE
The third tier of taxicab literature focuses its analysis on separate stakeholder groups
within the taxicab industry—typically operators or passengers—and those groupsʼ
specific aims. Several studies have introduced models that predict the spatial
distributions and route choices of taxicabs using data on driversʼ past behavior, noting
these modelsʼ capacities to streamline radio dispatching and provide “context-sensitive
route recommendations” to drivers (Ziebart et al. 2008, 1; Chang et al. 2010;
Phithakkitnukoon et al. 2010). The same models could also offer potential customers
the ability to quickly locate vacant taxis. Liu et al. (2009) use data on Shenzhen taxicab
driversʼ routes and revenue to evaluate their “mobility intelligence,” or income-
maximizing skill. This body of research seeks specific tools, often technologically-
focused, that allow taxicab drivers to operate more efficiently and enable customers to
travel more conveniently.
THE ROLE OF THE TAXICAB
Taxicabs function as both public transportation and private enterprise in different
situations. American taxicab regulations emerged during the Depression with the
primary goal of protecting the industryʼs profitability rather than ensuring provision of a
valuable public service, and in Boston and in many other cities, those regulations
remain in effect today. Mass transit systems often operate according to service
standards that ensure minimum levels of mobility throughout a city, but no such
standards (or subsidies) dictate the spatial distribution of privately-operated taxicab
service. Thus, profitability exerts a more powerful influence on taxicab distribution than
on the service of other public transportation modes. In general, the constraint that
taxicab operators must operate profitable service limits their ability to function as a pure
form of public transportation.

When taxicabs do not have a formal relationship to a cityʼs public transit system—the
more common scenario—they still function as public transportation, and demand for
cruising taxicabs overlaps with demand for mass transit and other modes. In cities with
high levels of transit service, such as Boston, the market for taxicabs becomes more
complex. How passengers use taxicabs when other modes are available, and when
they are not, is a key question that this paper addresses.
One cannot understand the taxicabʼs role in any city without understanding whom the
taxicab serves, and recommendations for improving a cityʼs taxicab system should
reflect an assessment of who will benefit from those improvements. The spatial
availability of taxicabs influences who benefits from them, but so does the nature of
urban travel demand. Two particular taxicab customer groups, as described in
transportation demand literature, are of interest here: choice riders and captive riders. In
light of the taxicabʼs role as public transportation, the choice between taxicabs and
mass transit in cities like Boston, which have both, assumes particular relevance:
Taxicab trips that complement mass transit or substitute for it should, logically,
correspond somewhat (though not perfectly) to the respective presence of captive and
choice taxicab riders.
If the taxicab is operationally suited to provide service where fixed-route transit does
not, and if “taxis and transit should be seen as natural complements” (Design Trust for
Public Space 2007, 132), then captive taxicab riders, who find themselves temporarily
or permanently without access to fixed-route transit, stand to gain the most mobility from
that complementary relationship. The taxicabʼs primary function as a complement to
mass transit is the mobility it offers its captive riders, as defined above, and that
complementary role has both spatial and temporal components: Mass transit service is
not only uneven in its spatial distribution throughout a city, but also in its distribution by
time of day. In Bostonʼs case, no transit is available whatsoever during a certain period
of the night and the taxicabʼs captive market share increases accordingly during that
time (although overall travel demand decreases). Furthermore, oneʼs location at an
origin near a transit station or bus stop does not constitute transit access if transit does
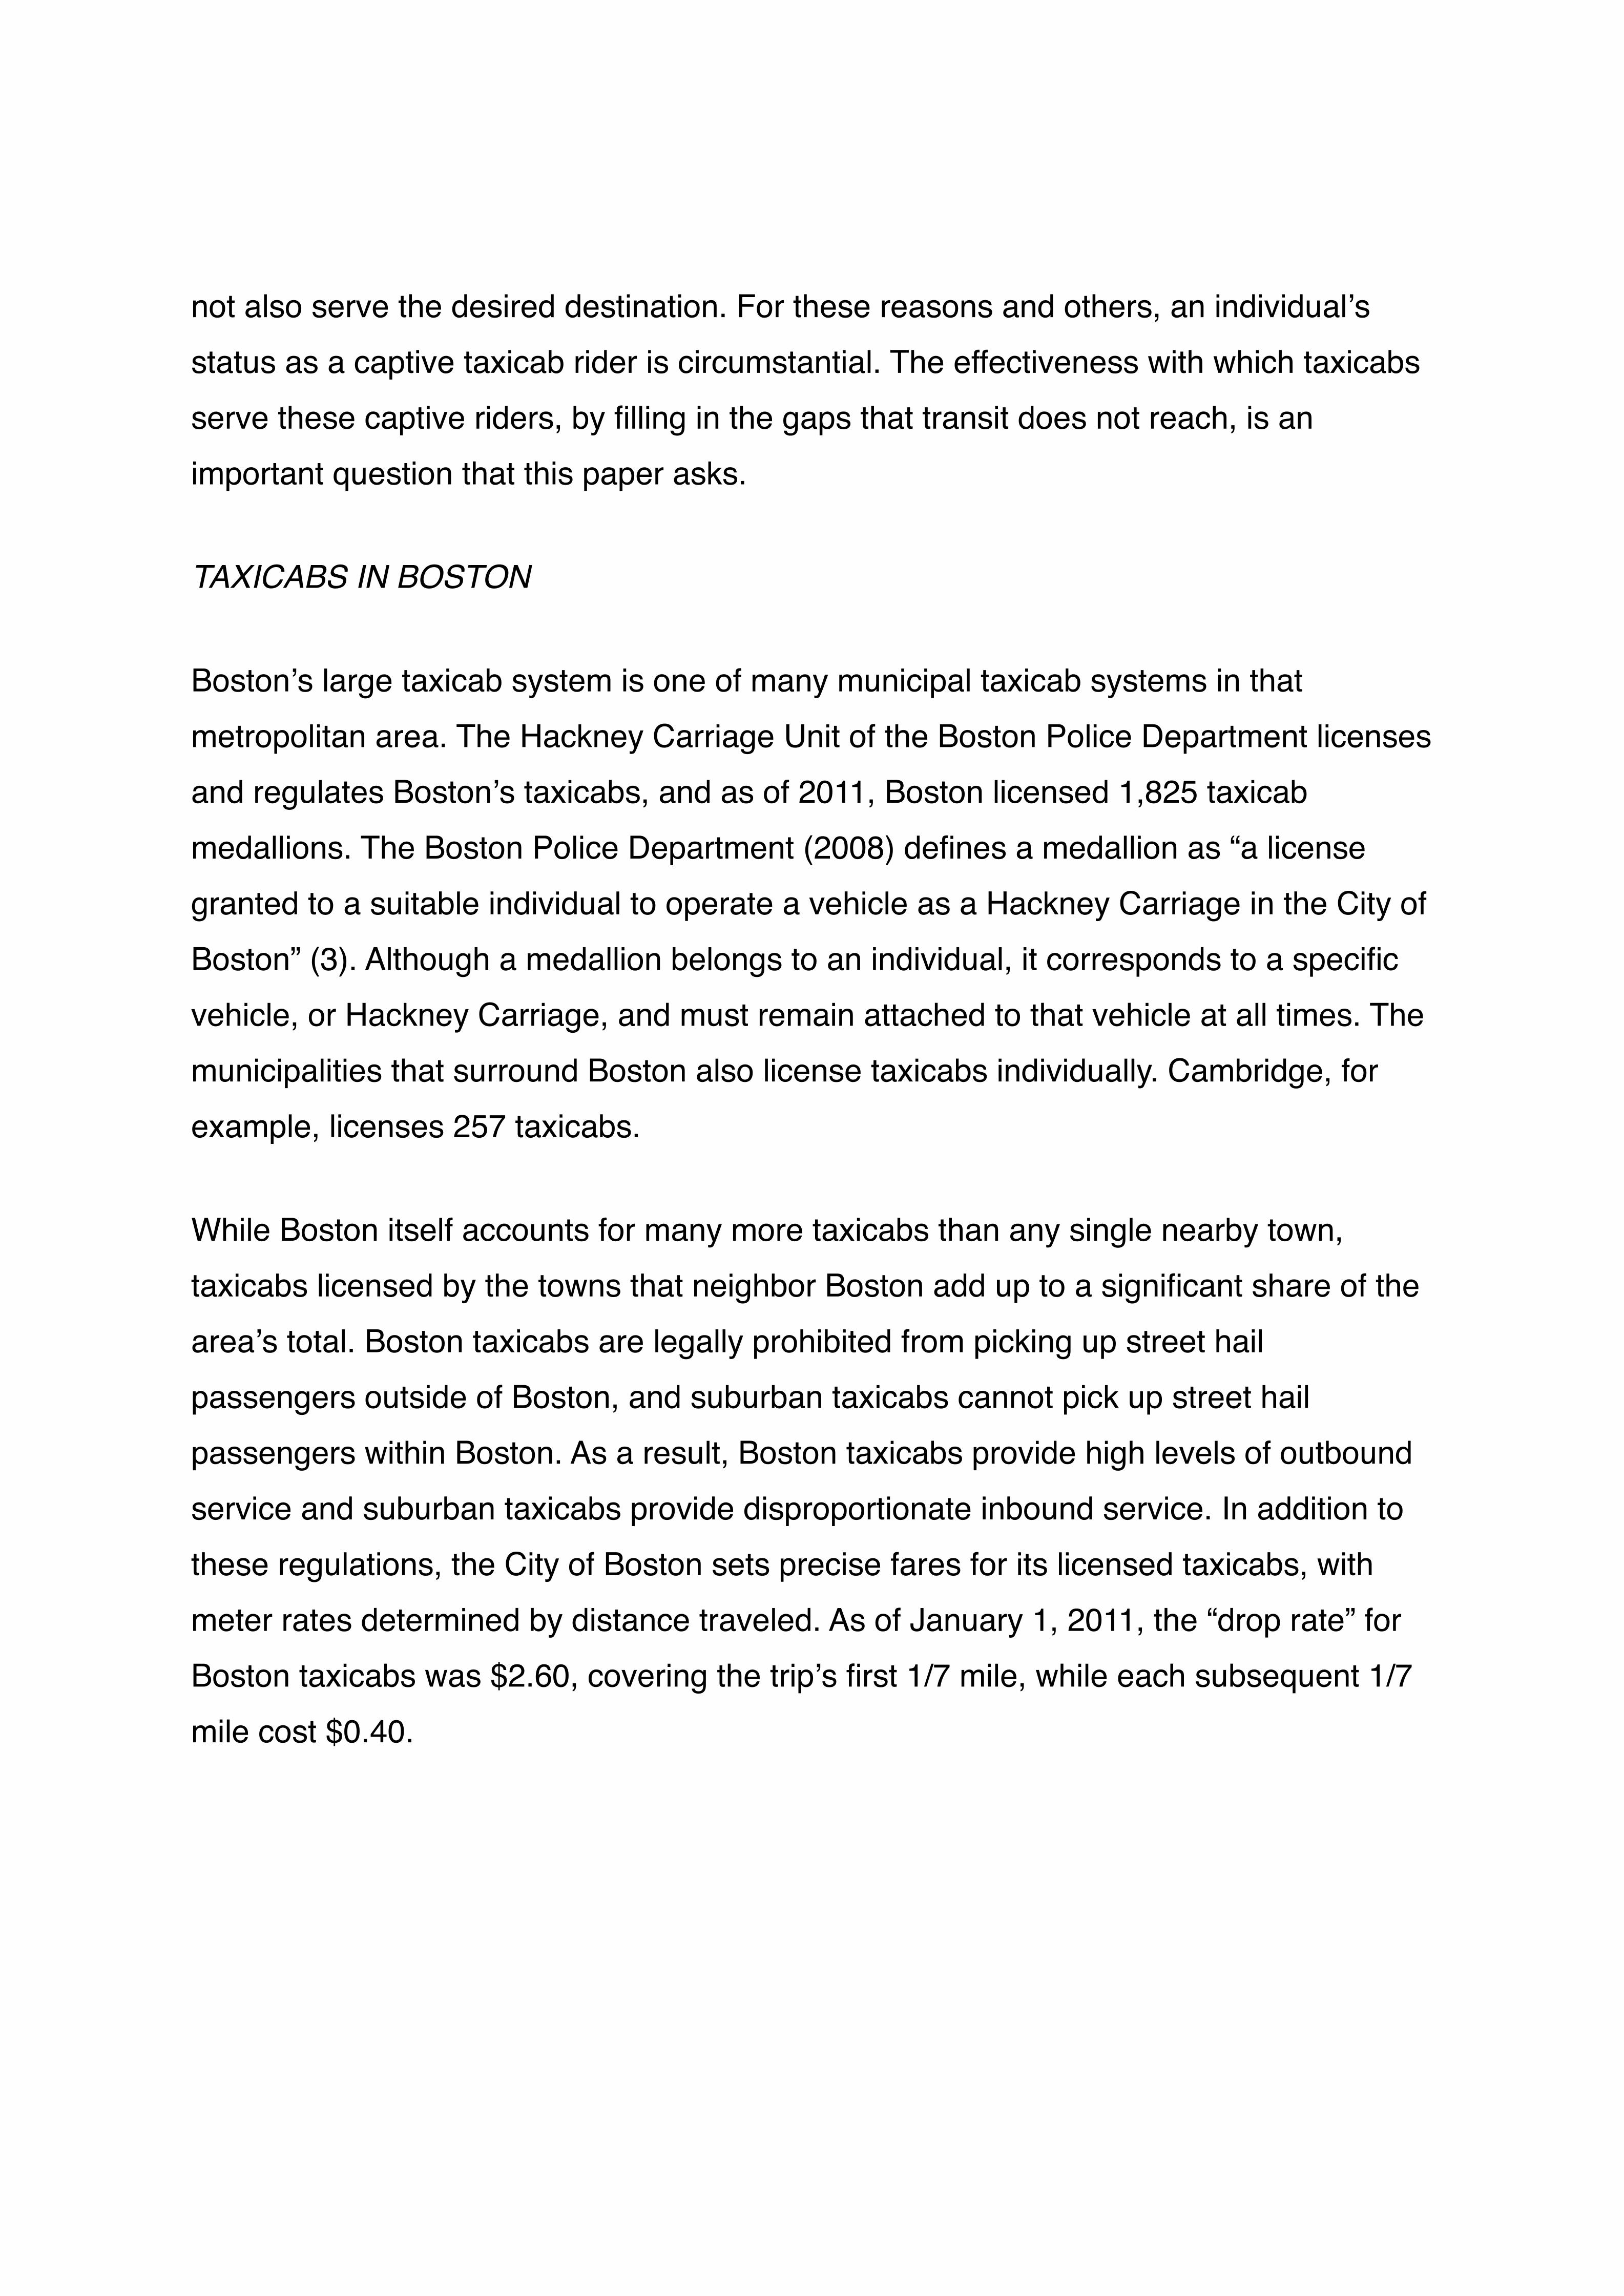
not also serve the desired destination. For these reasons and others, an individualʼs
status as a captive taxicab rider is circumstantial. The effectiveness with which taxicabs
serve these captive riders, by filling in the gaps that transit does not reach, is an
important question that this paper asks.
TAXICABS IN BOSTON
Bostonʼs large taxicab system is one of many municipal taxicab systems in that
metropolitan area. The Hackney Carriage Unit of the Boston Police Department licenses
and regulates Bostonʼs taxicabs, and as of 2011, Boston licensed 1,825 taxicab
medallions. The Boston Police Department (2008) defines a medallion as “a license
granted to a suitable individual to operate a vehicle as a Hackney Carriage in the City of
Boston” (3). Although a medallion belongs to an individual, it corresponds to a specific
vehicle, or Hackney Carriage, and must remain attached to that vehicle at all times. The
municipalities that surround Boston also license taxicabs individually. Cambridge, for
example, licenses 257 taxicabs.
While Boston itself accounts for many more taxicabs than any single nearby town,
taxicabs licensed by the towns that neighbor Boston add up to a significant share of the
areaʼs total. Boston taxicabs are legally prohibited from picking up street hail
passengers outside of Boston, and suburban taxicabs cannot pick up street hail
passengers within Boston. As a result, Boston taxicabs provide high levels of outbound
service and suburban taxicabs provide disproportionate inbound service. In addition to
these regulations, the City of Boston sets precise fares for its licensed taxicabs, with
meter rates determined by distance traveled. As of January 1, 2011, the “drop rate” for
Boston taxicabs was $2.60, covering the tripʼs first 1/7 mile, while each subsequent 1/7
mile cost $0.40.
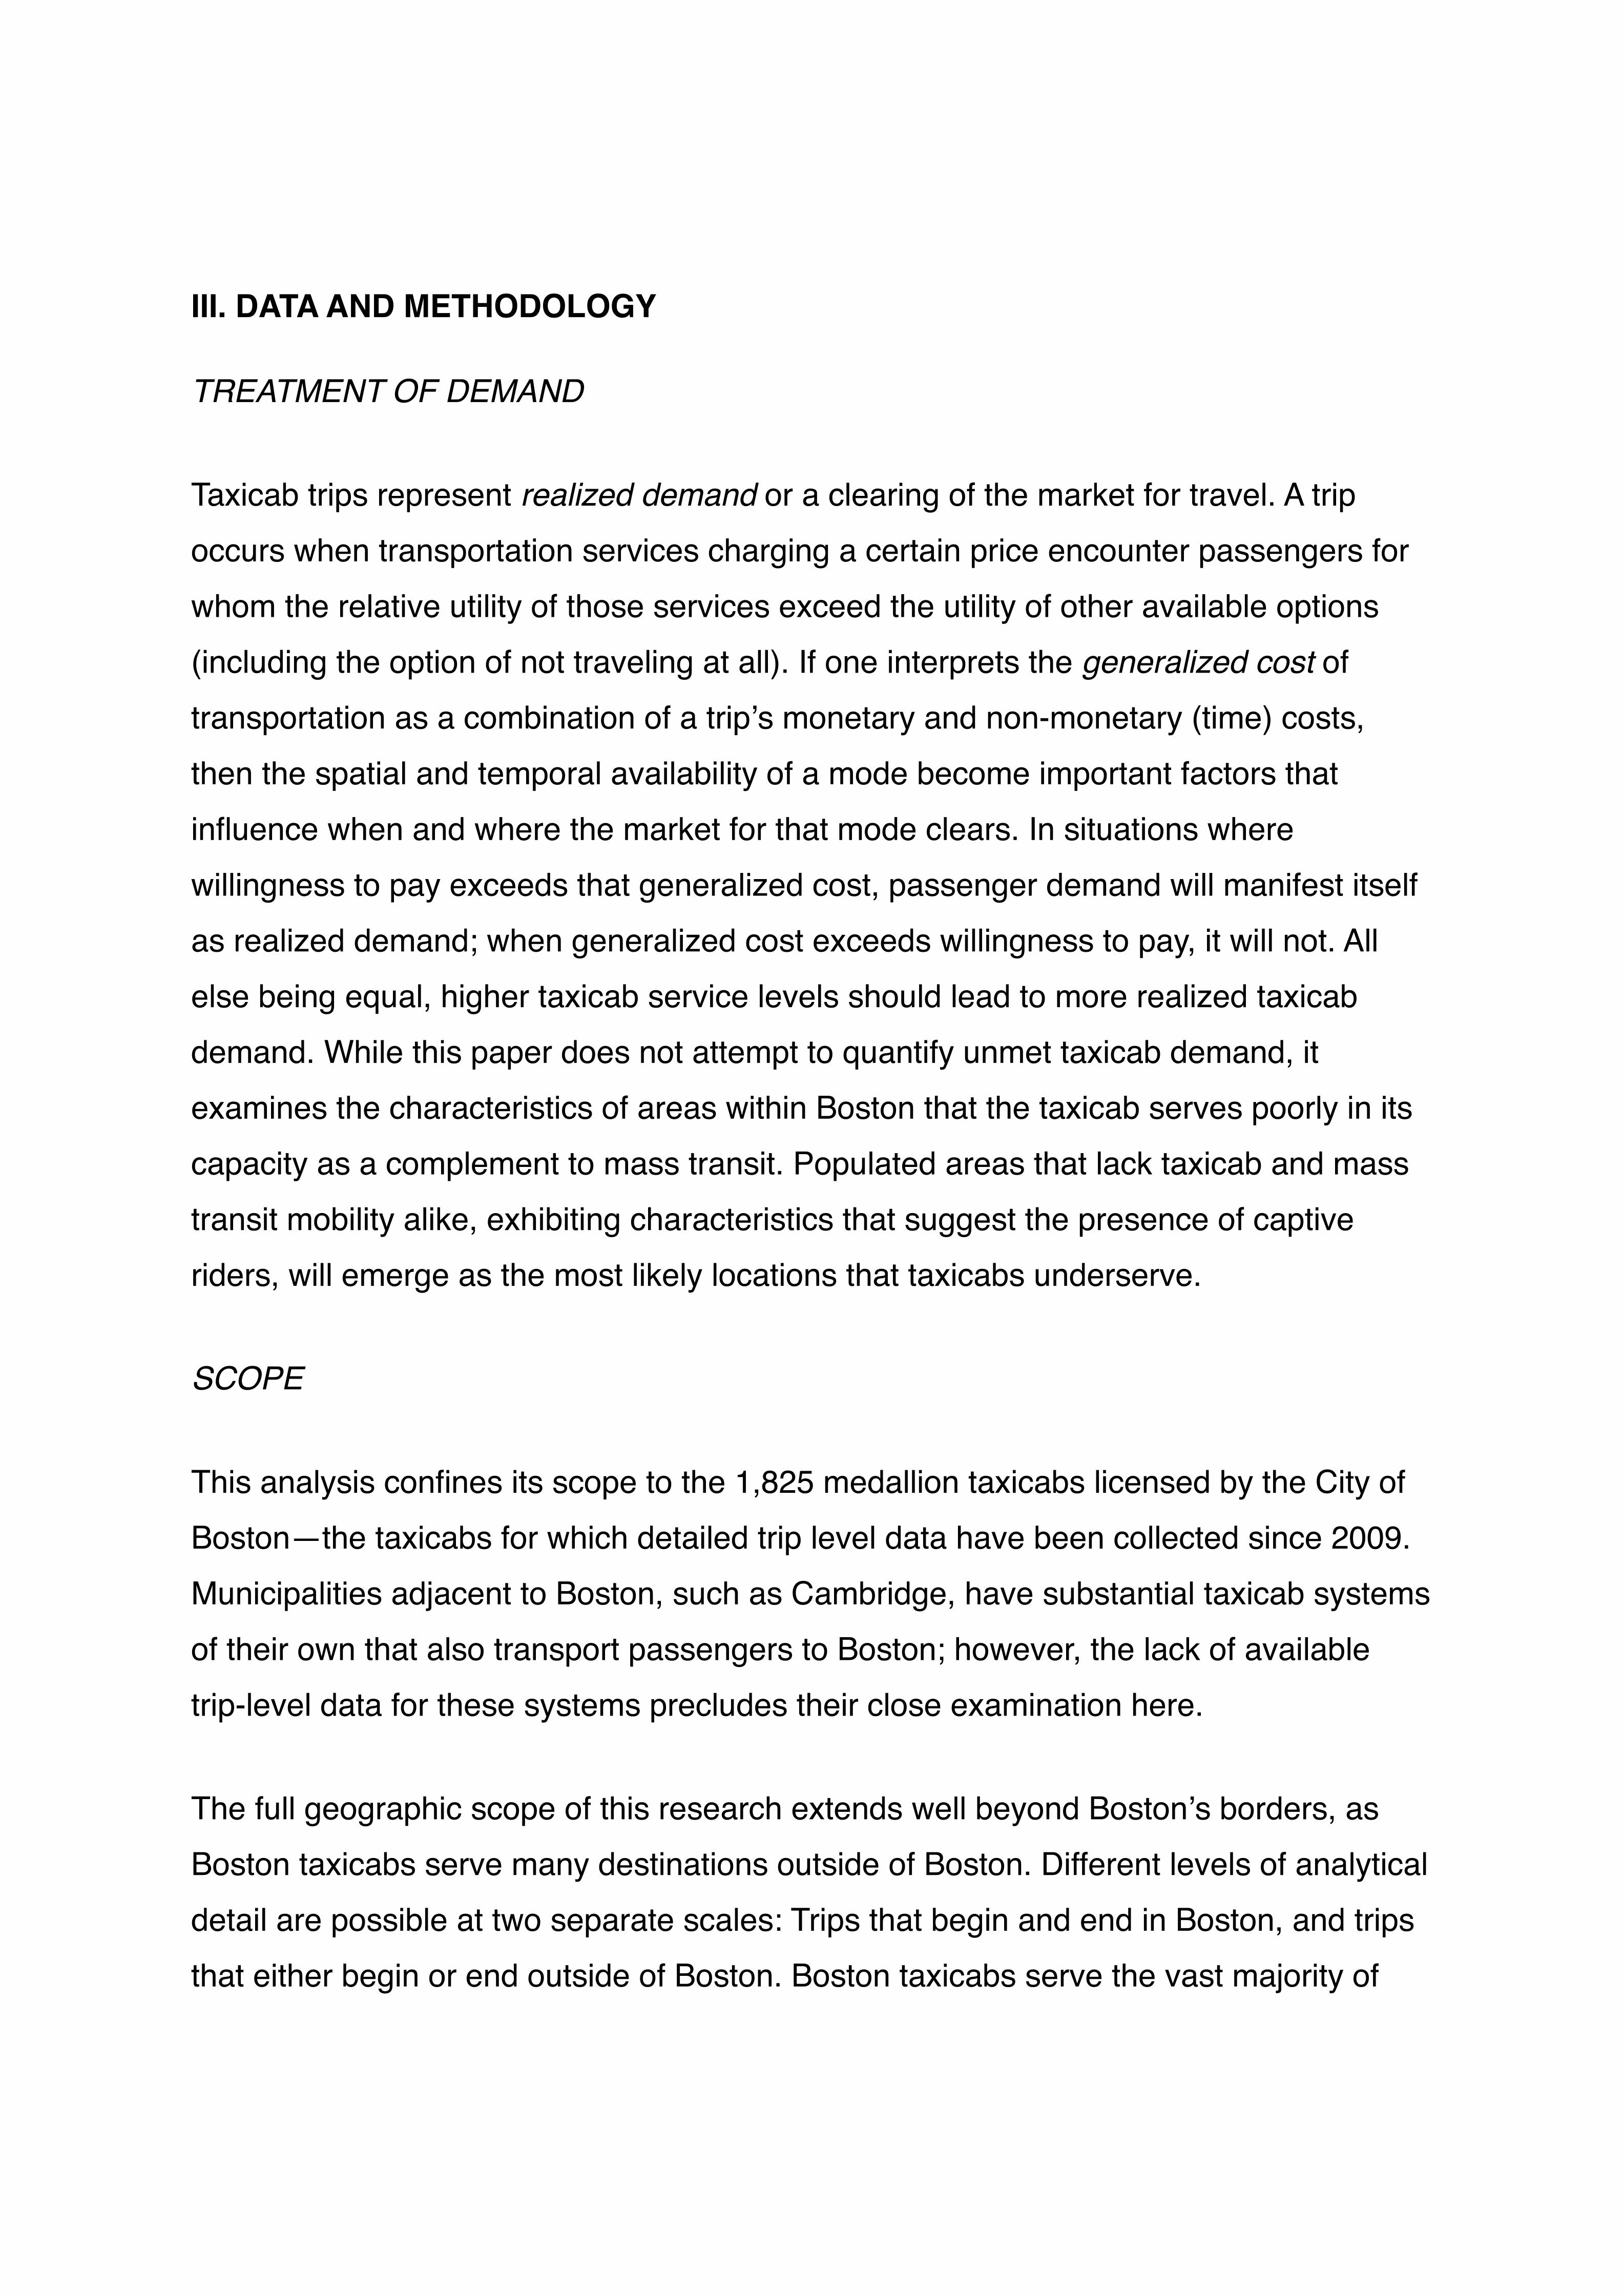
III. DATA AND METHODOLOGY
TREATMENT OF DEMAND
Taxicab trips represent realized demand or a clearing of the market for travel. A trip
occurs when transportation services charging a certain price encounter passengers for
whom the relative utility of those services exceed the utility of other available options
(including the option of not traveling at all). If one interprets the generalized cost of
transportation as a combination of a tripʼs monetary and non-monetary (time) costs,
then the spatial and temporal availability of a mode become important factors that
influence when and where the market for that mode clears. In situations where
willingness to pay exceeds that generalized cost, passenger demand will manifest itself
as realized demand; when generalized cost exceeds willingness to pay, it will not. All
else being equal, higher taxicab service levels should lead to more realized taxicab
demand. While this paper does not attempt to quantify unmet taxicab demand, it
examines the characteristics of areas within Boston that the taxicab serves poorly in its
capacity as a complement to mass transit. Populated areas that lack taxicab and mass
transit mobility alike, exhibiting characteristics that suggest the presence of captive
riders, will emerge as the most likely locations that taxicabs underserve.
SCOPE
This analysis confines its scope to the 1,825 medallion taxicabs licensed by the City of
Boston—the taxicabs for which detailed trip level data have been collected since 2009.
Municipalities adjacent to Boston, such as Cambridge, have substantial taxicab systems
of their own that also transport passengers to Boston; however, the lack of available
trip-level data for these systems precludes their close examination here.
The full geographic scope of this research extends well beyond Bostonʼs borders, as
Boston taxicabs serve many destinations outside of Boston. Different levels of analytical
detail are possible at two separate scales: Trips that begin and end in Boston, and trips
that either begin or end outside of Boston. Boston taxicabs serve the vast majority of

trips that both begin and end in Boston, so available taxicab trip data will almost
completely capture this category. Approximately 82 percent of trips by Boston taxicabs
in the four-weekday sample examined here remain within city limits. The second
category of trips, those with suburban origins or destinations, is reflected less
completely by Boston taxicab data because suburban taxicab systems also serve these
trips. Boston taxicabs serve a significantly higher share of outbound trips, which begin in
Boston and end elsewhere, than inbound trips, which originate in suburbs.
Due to the research objectives presented here, which emphasize passengersʼ ability to
obtain taxicab service in Boston itself, taxicab trips that originate outside of Boston (2.6
percent of all trips in the four-day sample) are excluded from analysis. Thus, this paper
examines two trip categories—Boston-to-Boston trips and Boston-to-suburb trips—and
Boston taxicab data should provide nearly complete samples for both categories.
This analysis uses a sample comprising four 24-hour weekday periods of taxicab
activity: May 12, 2010; August 4, 2010; October 20, 2010; and January 26, 2011. All four
sample days are Wednesdays, spread evenly throughout the year. The large volumes of
daily taxicab activity in Boston, the difficulty of processing larger quantities of data, and
the general consistency observed across these four separate days justify this sample
size. Every taxicab trip that begins between midnight and 11:59 p.m. on each date is
included in that dateʼs selection (meaning that some included trips end on the following
day). Weather, which influences taxicab demand, is fairly consistent throughout the four-
day sample. Finally, no known disruptions caused significant data anomalies on any of
the four sample days, with the exception of a few professional sporting events that had
little visible impact on taxicab activity patterns.
DATA
The data that form the foundation of this analysis are records of trips made by Boston
taxicabs. The mandatory installation of rear-seat, self-swipe credit card payment
devices in every Boston taxicab in 2009 gave the City the capacity to digitally record

detailed information about every trip, regardless of a customerʼs actual payment
method. Two separate providers, Creative Mobile Technologies (CMT) and Verifone,
implemented this technology in Bostonʼs taxicabs and manage the data collection
process. Each taxicab trip record comprises a number of trip characteristics, including
pickup and drop-off locations (latitude and longitude coordinates), pickup and drop-off
times and dates, fares paid, and taxicab medallion numbers. This information, which
resides in CMT and Verifone databases, facilitates the mapping of taxicab trip origins
and destinations using GIS software.
The taxicab trip data just described are relatively complete and precise, although some
data have been excluded from analysis. The majority of trip data remain usable, but
exclusion of certain trip records occurs when origin or destination coordinates are
missing. In the four-day sample used here, 89 percent of trip records have complete
coordinates and are usable in the following analysis. The distribution of trips with
missing coordinates appears to be random and unbiased.
METHODOLOGY
Modeling taxicab trip generation requires regressing taxicab pickup counts by census
block group, a dependent variable, on characteristics of those tripsʼ origins, including
population, land use patterns, and transit access. Separate models are specified for four
different times of day, highlighting the factors that are correlated with taxicab service
levels and illuminating the taxicabʼs role as a transit substitute or complement in Boston.
This methodology raises the paperʼs central question: Do places in Boston with poor
transit access also tend to have inferior taxicab service, and does this indicate the
presence of unmet demand for mobility? Which parts of Boston are underserved by the
taxicab? The taxicab may be more important in areas that lack other mobility options
and passengersʼ willingness to pay, which partially depends upon their income, may be
lower in less affluent parts of Boston and not fully reflect the taxicabʼs importance there.
Understanding whether transit access improves the likelihood that an area will generate

taxicab trips, all else being equal, is a first step toward knowing which role for the
taxicab—transit complement or substitute—existing conditions favor. If evidence shows
that areas with transit access generate more taxicab trips than comparable areas
without transit, this will suggest that, in general, taxicabs are less likely to serve those
who lack other public transportation options and might depend upon the taxicab more.
The question of whether such an outcome occurs due to a lack of taxicab supply, a lack
of travel demand, or both follows from that inquiry.
To answer the questions just posed, regression analysis is used to model realized
taxicab demand as a product of transit access as well as other temporal and spatial
characteristics that influence taxicab activity. By controlling for factors like population,
the models specified here isolate the specific relationships between transit and overall
taxicab trip generation across census block groups and times of day. Many of these
modelsʼ independent variables influence taxicab pickup volumes through their impacts
on either supply or demand, and this distinction provides evidence of whether taxicab
supply or demand is the best explanation when a block groupʼs taxicab activity is lower
than expected.
Statistically significant relationships are hypothesized to exist between transit access
and taxicab trip generation, but the nature of those relationships is expected to vary by
Massachusetts Bay Transportation Authority (MBTA) line and mode (rail or bus). That is,
certain types of transit access will be correlated with higher concentrations of taxicab
activity, while other types will exhibit negative correlations with taxicab trip generation.
Modeling trip generation indicates whether demand for other “public transportation”
modes is also higher where transit is available.
The dependent variable in these models is the quantity of taxicab pickups per block
group, averaged across the four weekdays in the sample. Each block group therefore
constitutes one observation, and the models use 544 observations in all. This unit of
analysis allows the models to capture spatial variations in taxicab activity. Four separate
models are specified using roughly the same independent variables, and these models

correspond to four separate three-hour periods during the weekday in order to capture
different demand patterns (2:00 to 5:00 a.m.; 6:00 to 9:00 a.m.; 4:00 to 7:00 p.m.; 8:00
to 11:00 p.m.). Thus, each modelʼs dependent variable will be the number of taxicab
pickups in a block group during a three-hour period. Importantly, the MBTA operates
negligible transit service during the overnight observation period, so modeling that
period offers insight into taxicab activity when alternative modes are unavailable (and
enables useful comparisons with the other three time periods).
The following indicators of transit access serve as independent variables in these
models:
•MBTA rail access: Four separate variables represent block groupsʼ proximity to
the four principal MBTA rail lines (Red, Blue, Orange, and Green) using a
function that approximates distance decay. Access to a given line is calculated
using the shortest-path distance from a block groupʼs centroid to the nearest
station on that line. Each rail access variable assumes a value of zero for block
groups within a 0.5-mile distance of that line, and beyond that distance the
variableʼs value increases by the natural logarithm of distance from the rail
station. In other words, x = 0 when distance from transit d is less than 0.5 miles,
and x = ln(d – 0.5) when d is greater than or equal to 0.5 miles. This achieves the
purpose of treating block groups within the half-mile walking radius of a transit
line uniformly while representing the rapid decline in oneʼs willingness to walk to
a transit station beyond that half-mile distance.
•MBTA Silver Line access: The Silver Line is a bus rapid transit line and cannot
be represented in the same way as rail, because its service levels are generally
lower. A dummy variable represents the Silver Line in these models. If a census
block groupʼs centroid falls within a 0.5-mile straight-line distance of the Silver
Line, that block group assumes a value of 1, and takes a value of 0 otherwise.
•MBTA bus access: The number of bus routes accessible from a given census
block group at a given time serves as a proxy variable for bus access. A bus

route must intersect a block group to be considered accessible from that block
group, and routes with multiple variants are considered as single routes. A
second variable represents access to the 11 highest-ridership MBTA bus routes
(as listed above) in the same manner. While this approach is crude, the number
of bus routes and the complexity of modeling access to each route necessitated
simplification. Also, buses are a less competitive taxicab alternative than rail,
especially at greater walking distance.
The following list provides brief summary of all other independent variables. Table 1
summarizes all independent variables and dependent variables included in the models
specified.
• Land area: Total block group land area (km²)
•Open space: Total block group open space (km²)
•Open space %: (Total open space) / (Total block group land area)
•Commercial land use %: (Total commercial land area) / (Total block group land
area)
•Non-residential building volume: All buildings within a block group whose
footprints intersect a non-residential land use, as defined by MassGIS land use
codes. Total building volumes are calculated by multiplying each buildingʼs
footprint area by its height.
• Zero-car household %: The percentage of households within a block group that
own zero cars, as given by the 2000 Census.
• Population: Total population residing in each block group, as given by the 2000
Census.
• Population density: (Total population) / (Total block group land area)
• Intersection density: Using the GIS Network Analyst tool, Bostonʼs street system
is converted into a network with a node representing each intersection. The total
number of nodes within each block group is normalized by the block groupʼs land
area to calculate intersection density.
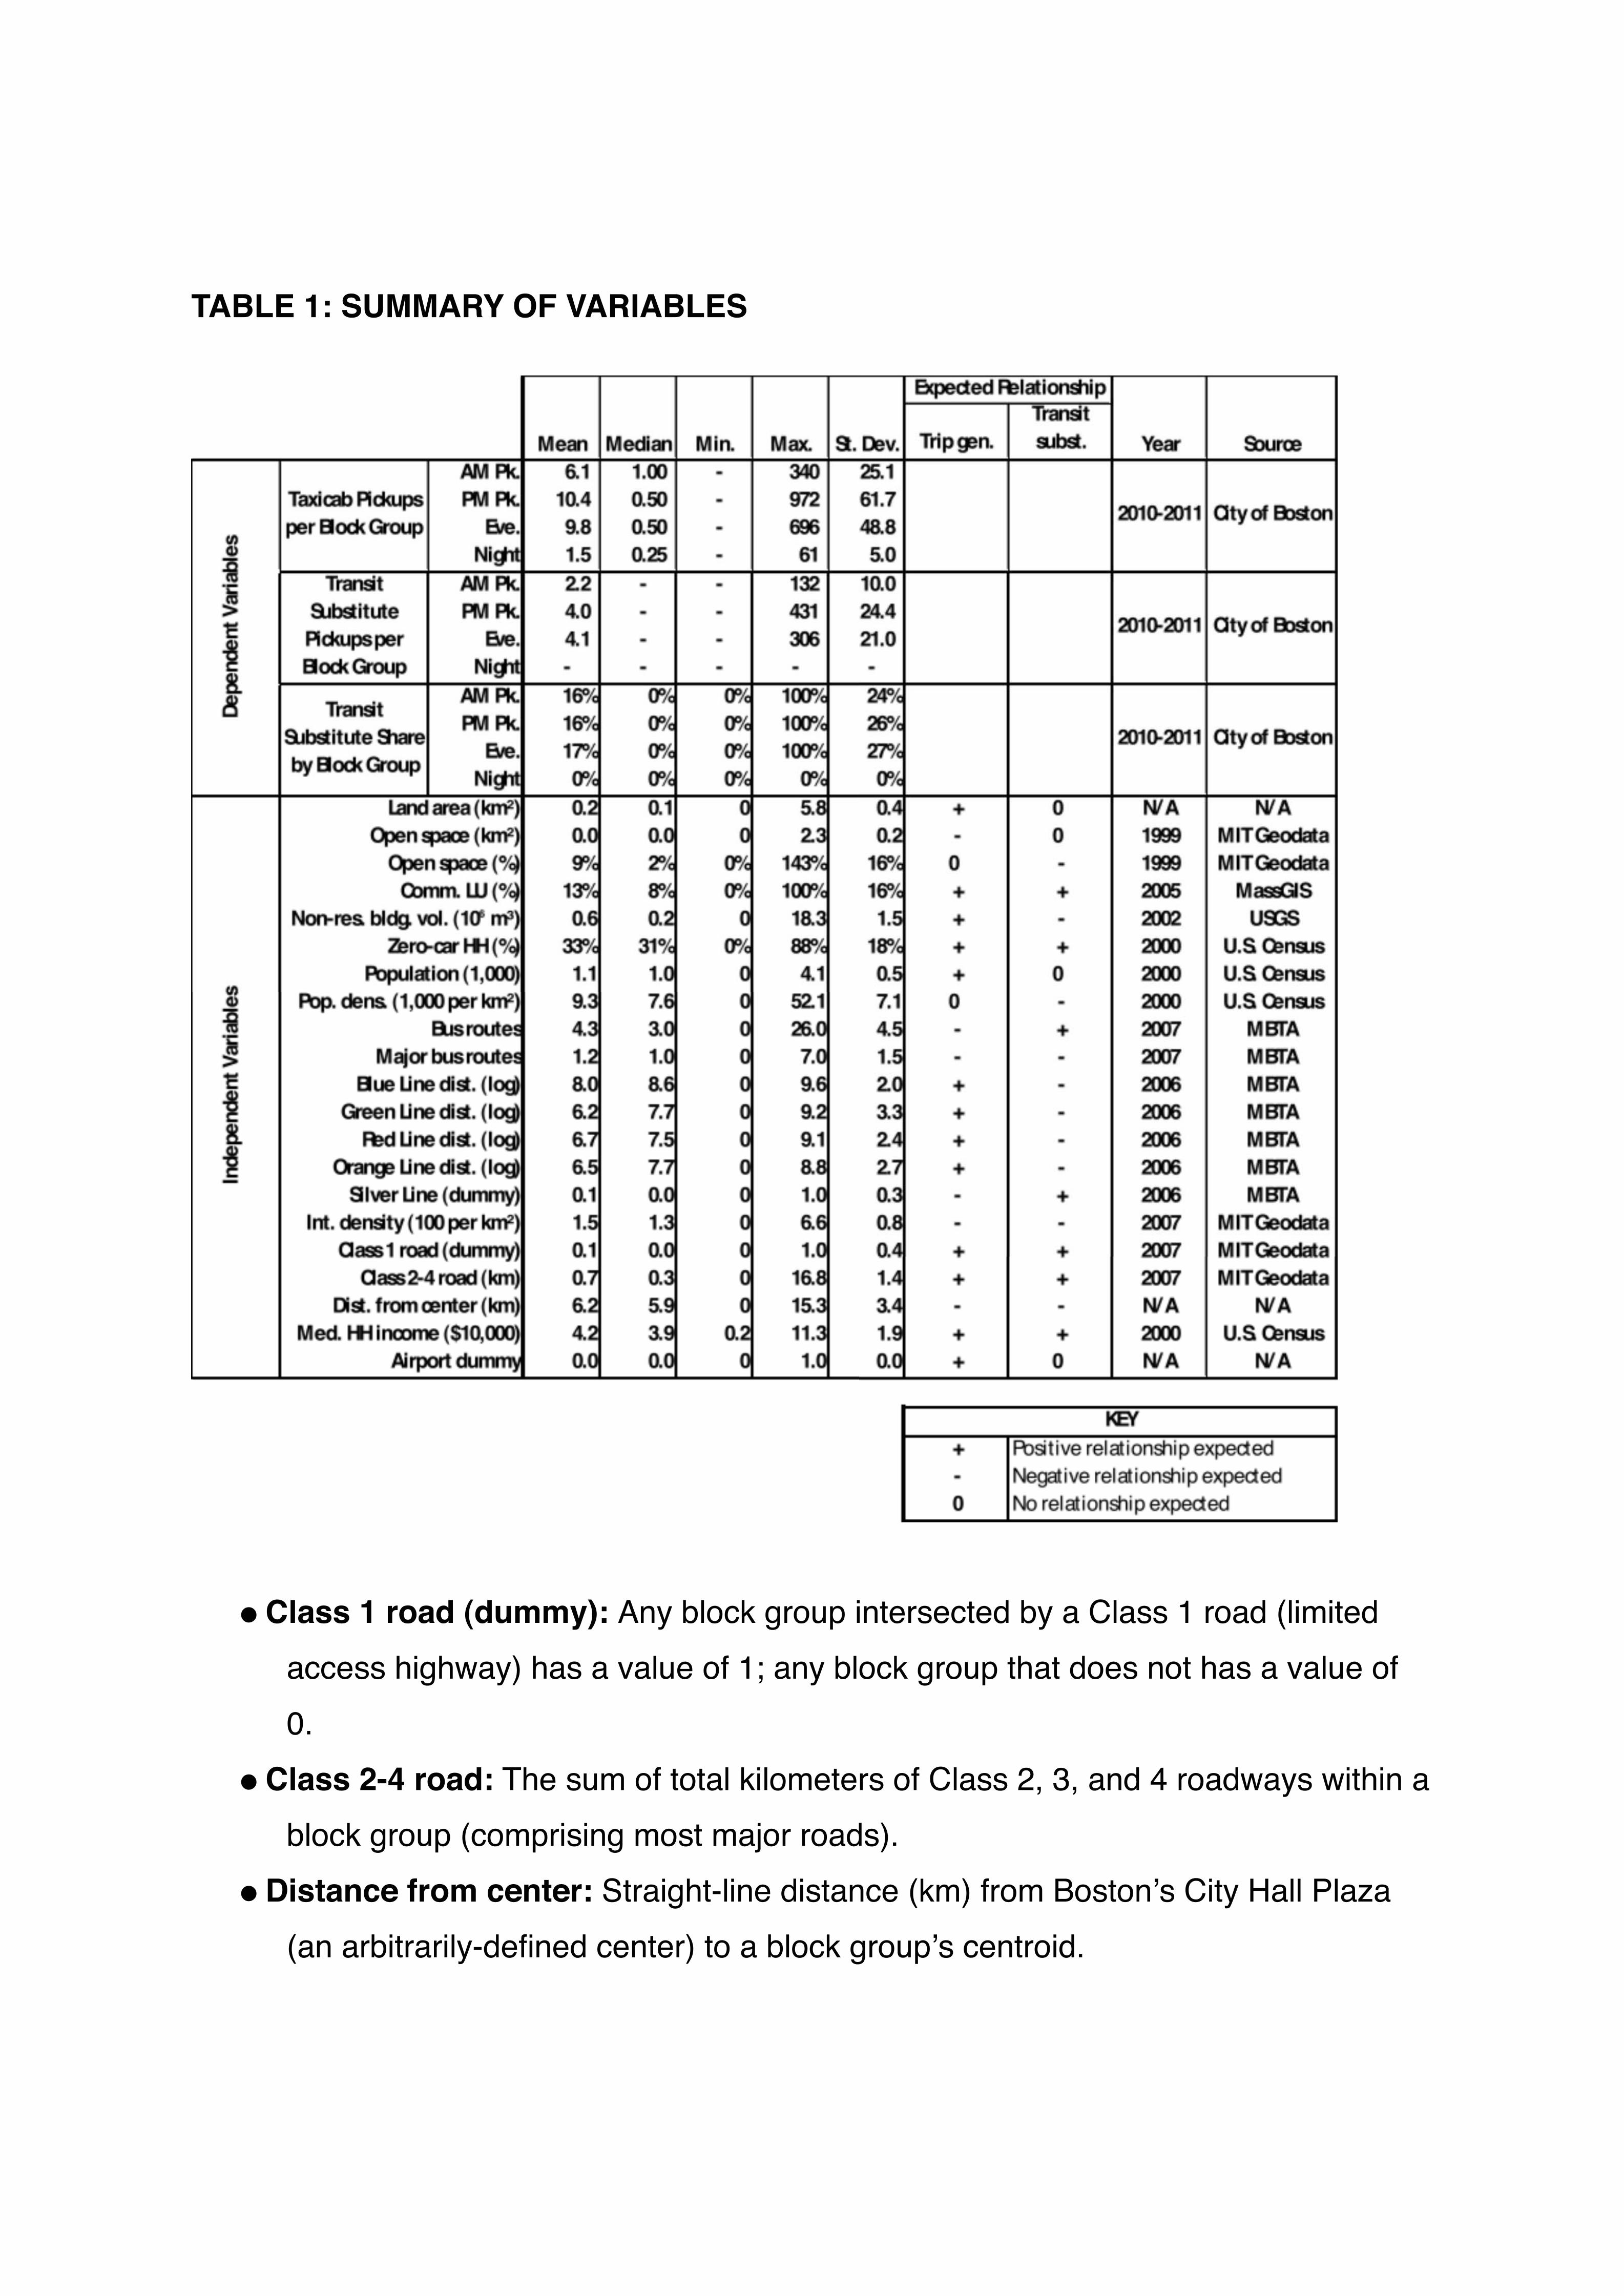
TABLE 1: SUMMARY OF VARIABLES
•Class 1 road (dummy): Any block group intersected by a Class 1 road (limited
access highway) has a value of 1; any block group that does not has a value of
0.
•Class 2-4 road: The sum of total kilometers of Class 2, 3, and 4 roadways within a
block group (comprising most major roads).
•Distance from center: Straight-line distance (km) from Bostonʼs City Hall Plaza
(an arbitrarily-defined center) to a block groupʼs centroid.
•Median household income: A block groupʼs median household income, as given
by the 2000 Census.
•Airport dummy: A dummy variable that has a value of 1 for block group 106955,
which is coterminous with Logan Airport (see above) and a value of 0 for all other
block groups.
Taxicab trip counts are modeled using Poisson regression, which treats an independent
variable y as a function of eθx (the Poisson regression method is commonly used to
specify count models). This approach is appropriate for taxicab trip generation, in which
individual taxicab pickups are not coordinated with one another and occur at average
rates that appear fairly consistent over time.
If the trip count models indicate that taxicab pickups occur more frequently in areas that
enjoy better transit access, this does not necessarily mean that those taxicabs are
acting as substitutes for transit. A block group near an MBTA station, for example, may
generate many taxicab trips to destinations that the Orange Line does not serve directly,
thus complementing the mobility it provides. To the extent that this occurs in transit-
accessible locations, the taxicab is still filling gaps in Bostonʼs transit network. If a large
share of these trips are transit substitutes, however, then taxicabs and transit are simply
transporting shares of the same travel demand. Of course, transit access both reflects
and reinforces many of the greatest concentrations of travel demand within a city, so the
taxicab should serve some portion of travel demand that mass transit could also
potentially carry.
IV. RESULTS AND INTERPRETATION
The primary question this paper asks about taxicab distribution is whether transit access
typically corresponds to better or worse taxicab activity. Because realized demand is an
insufficient indication of total demand, isolating the most important determinants of
realized demand facilitates inferences about which areas have more or less taxicab
service than expected, based on their characteristics. Regression analysis enables
controlling for certain factors to isolate the specific relationships between taxicab activity
and each factor. Some of these relationships may be causal, although regression
modeling cannot prove the existence of causality. The relationships between transit
access variables and taxicab trip counts, with other spatial variables controlled for, will
partially indicate whether transit-accessible places have concentrations of the kinds of
travel demand that taxicabs also tend to serve.
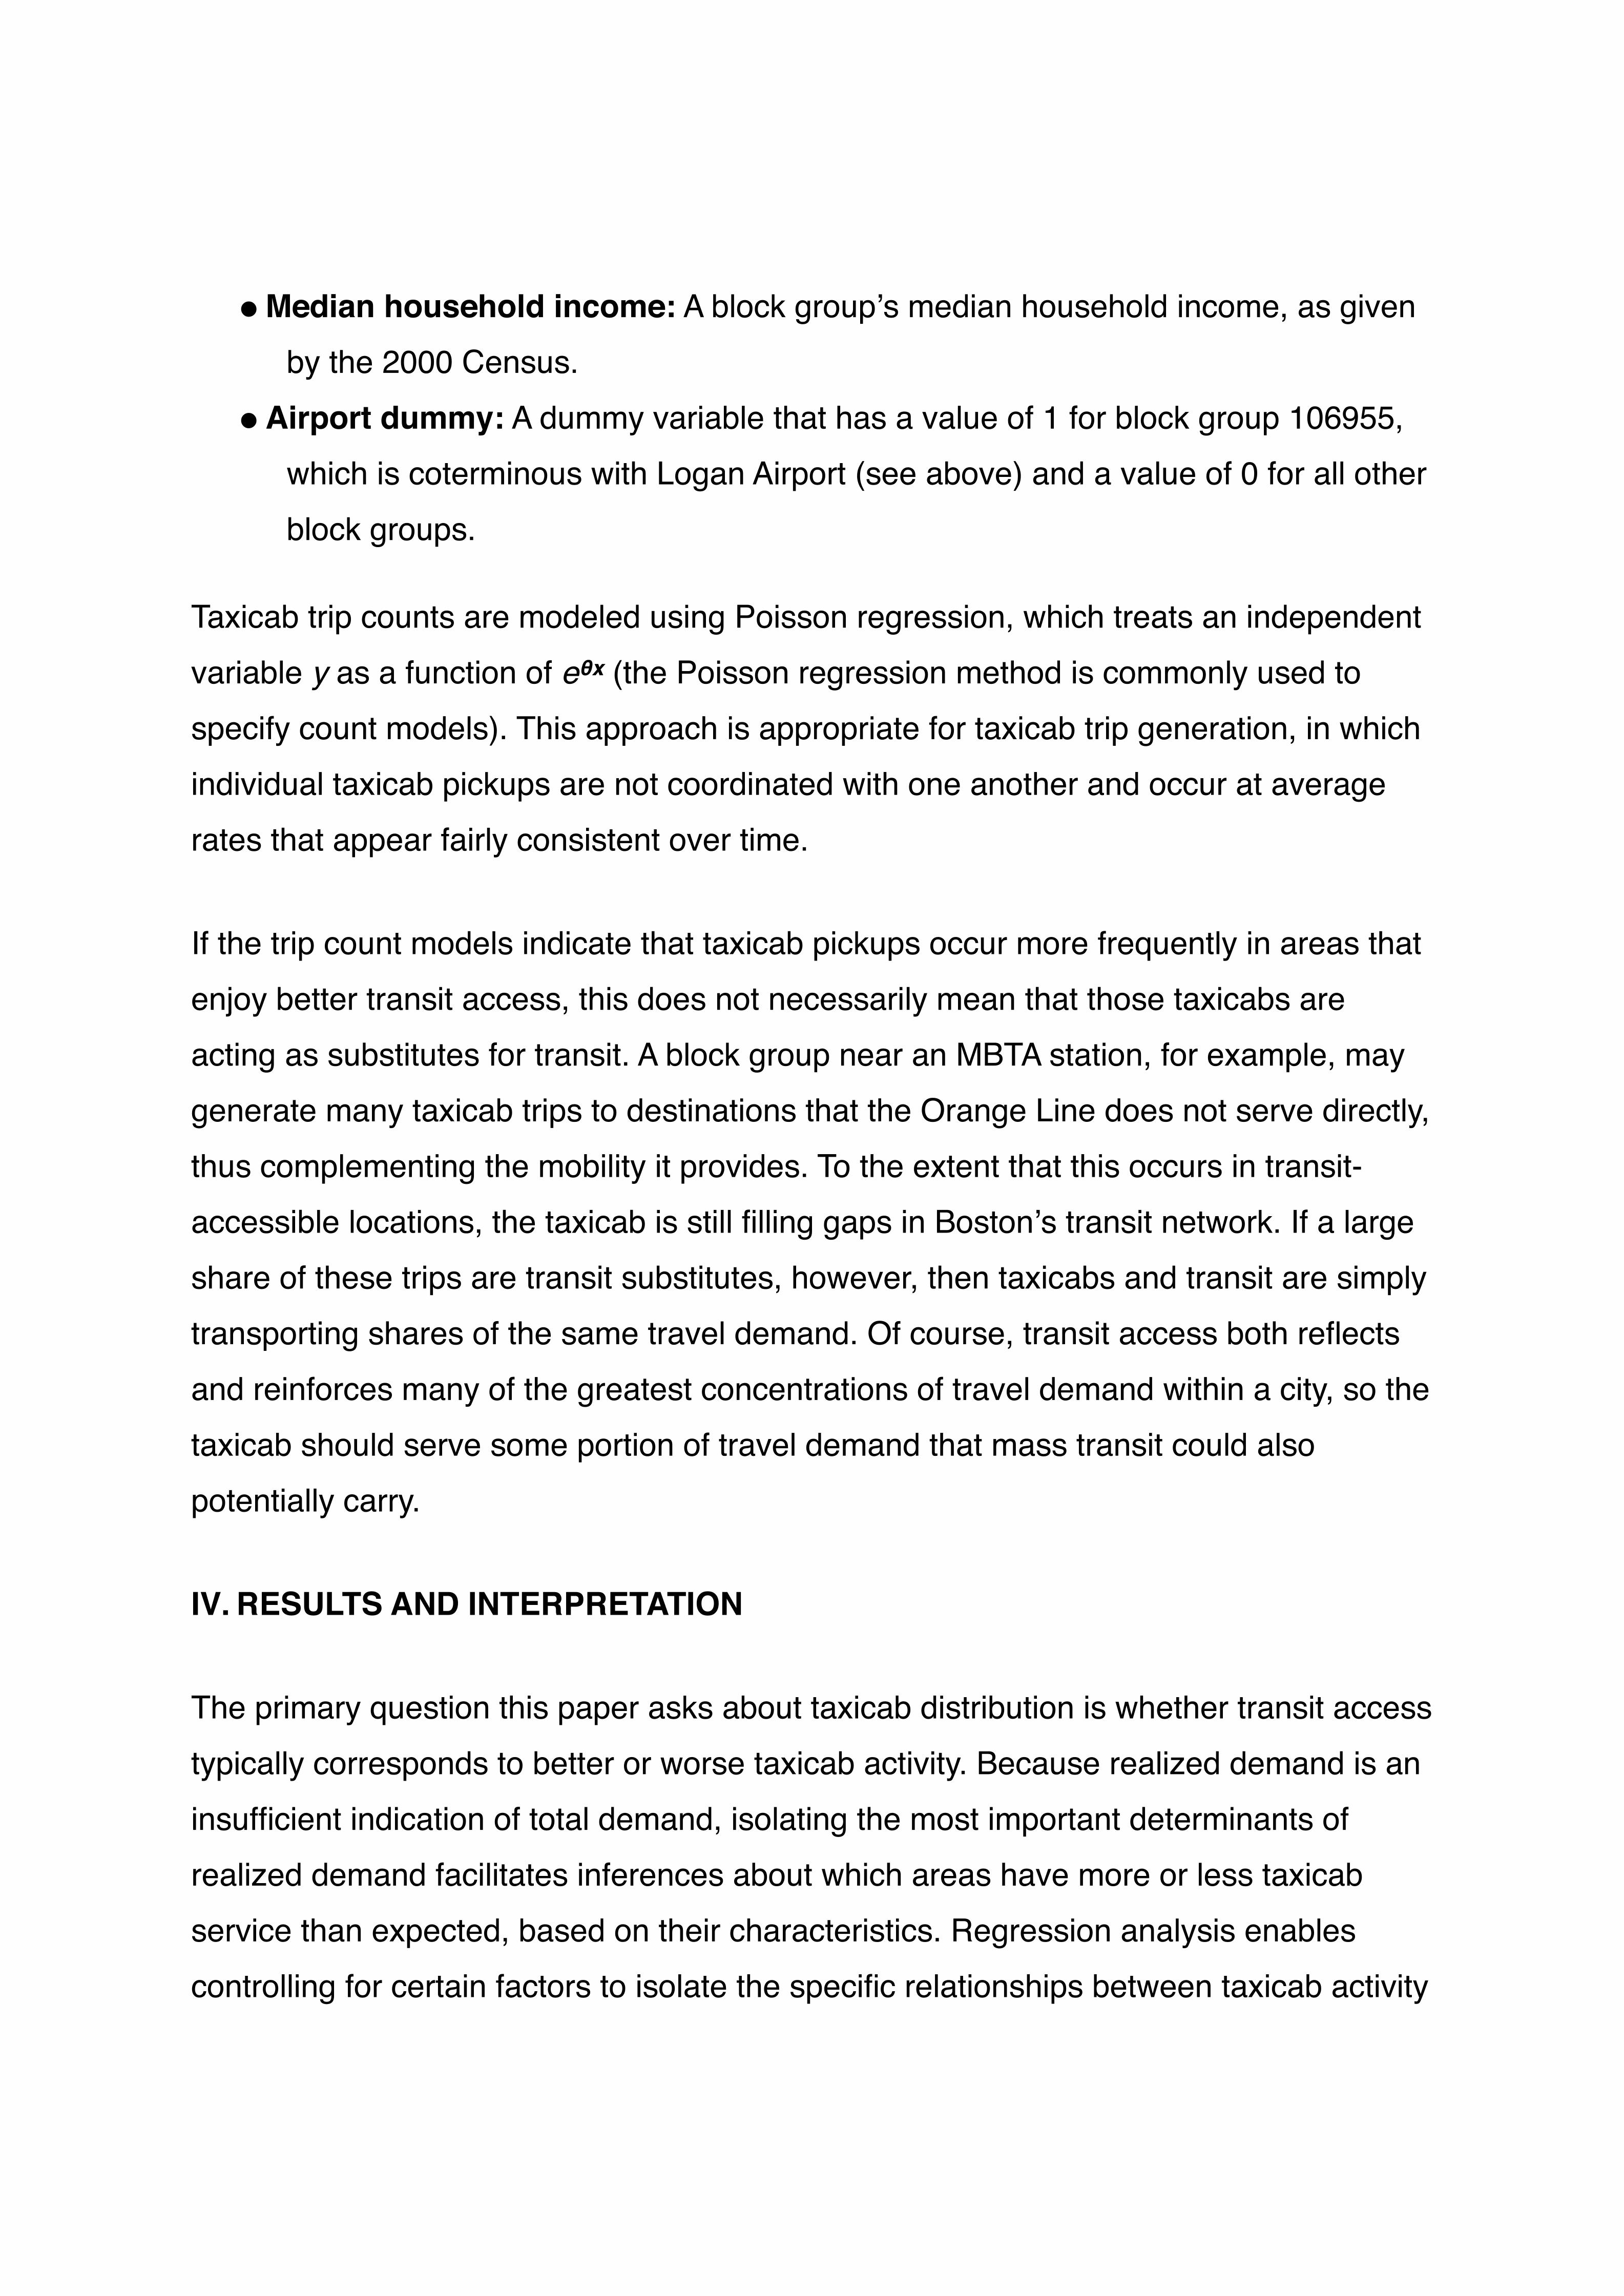
Table 2 summarizes the results of the best Poisson trip count model specifications for
each of the four time periods chosen (with significant variables in bold and insignificant
variables shaded).
TABLE 2: MODEL RESULTS
The models specified reveal significant relationships between taxicab trip counts and
several explanatory variables. The individual components of these trip count models are
discussed in greater detail here:
•Constant coefficients: Predictably, the constant coefficients for all four time-of-
day models vary along with overall levels of average daily taxicab activity
(although the overnight constant coefficient is not significant): The evening

coefficient is highest (2.64) while the morning peak coefficient is the lowest
significant constant (1.78).
•Block group land area and open space: Both of these variables also exhibit the
expected relationships with taxicab trip generation. A block groupʼs total land
area directly affects its trip generation because larger block groups will
encompass more taxicab activity on their streets. Similarly, open space is unlikely
to generate taxicab trips to the degree that other urban land uses do. In all four
models, land area has a significant positive relationship with taxicab pickups and
open space has a significant negative relationship with pickups. Both
relationships are strongest during the afternoon peak.
• Logan Airport dummy variable: The airport is an outlier in Bostonʼs taxicab
market and a dummy variable is included in the models to correct for any
distortion that it may cause as a trip generator. This variable has a significant
negative relationship to taxicab trip generation at all times, with the strongest
inverse relationship to taxicab pickups occurring in the afternoon peak. Despite
the airportʼs high taxicab trip generation, other characteristics of the airportʼs
block group (such as land area) would potentially cause these models to predict
even higher trip counts for it, hence the negative coefficient values.
• Population and socioeconomic characteristics: The positive relationship
between population and trip generation is intuitive: People are the source of
demand for trips, and more residents in a block group should result in more trips,
all else being equal. Non-residential areas generate some of the highest trip
counts in Boston, however. If people are traveling from their homes to other
activities by taxicab, population captures a portion of that effect. Median
household income has a positive relationship with taxicab trip generation during
the morning and afternoon peaks, an insignificant relationship to evening activity,
and a negative relationship with overnight taxicab pickups. In other words,
higher-income areas exhibit more taxicab activity during the day and evening, all
else being equal. Most likely, many who can afford to commute to work by
taxicab earn high incomes and place greater values on their time. During the

overnight period, lower-income people may represent a higher share of all
taxicab passengers, and this relationship supports the taxicabʼs role as a
complement to transit during the hours when transit does not operate. Of course,
lower-income travelers may also account for a larger share of all travel demand
during the overnight period. Finally, the percentage of households that own no
cars exhibit a significant inverse relationship with taxicab trip generation during
only the morning and afternoon peak periods. This negative relationship is not
necessarily surprising because urban car owners may have an aversion to transit
use and take taxicabs when not driving themselves, especially when parking will
be scarce at their destinations.
• Land use and built environment: Two independent variables, the share of a
block groupʼs land area dedicated to commercial use and the total non-residential
building volume within each block group, both have significant positive
relationships with taxicab activity throughout the day. These two variables
together approximate non-residential trip generation. Non-residential building
volumes in downtown Boston dramatically exceed those found in peripheral parts
of the city, reflecting the great intensity of non-residential uses (and trip
generation) that one finds there. Commercial land use share captures additional
trip generation that does not correspond to building volume.
•Urban form and relative location variables: A block groupʼs straight-line
distance from Bostonʼs center is negatively related to trip generation, all else
being equal. In other words, peripheral block groups generate fewer trips than
central block groups, even after controlling for transit access and the above
indicators. This outcome makes sense, as Bostonʼs taxicab supply is expected to
be more centrally concentrated. Additional urban form indicators that are
significant include intersections per square kilometer, whether a Class 1 roadway
(limited access highway) intersects the block group, and the total length of Class
2, 3, and 4 roadways within a block group. More intersections (and presumably
smaller blocks) result in fewer taxicab pickups, suggesting that such urban
environments are more accommodating to walking and transit use and will thus

generate fewer taxicab trips. Class 1 roadways have the opposite effect during
the morning and evening. The presence of other major roads (Classes 2, 3, and
4) has a positive correlation with trip generation throughout the day, but this is
most likely a result of better taxicab supply along these types of roads.
• Transit access variables (rail): Specific relationships between different types of
transit access and taxicab trip generation are observed in these model results. A
block groupʼs proximity to the Red Line, Orange Line, and Blue Line results in
fewer taxicab pickups, all else being equal, although this effect reverses itself on
the Blue Line in the evening period (and is insignificant for the Red Line overnight
and for the Orange Line in the morning). Distance from the Green Line, on the
other hand, exhibits a negative correlation with taxicab trip generation at all times
of day. That is, a block groupʼs proximity to a Green Line station actually
increases its taxicab trip generation. This is also true of the Silver Line
throughout the day, although a dummy variable indicates Silver Line proximity.
These results seem to indicate that the taxicab is, in fact, something of a
complement to rail transit. For a few MBTA lines—especially the Red Line, but
also the Orange Line and Blue Line at certain times—taxicab trip generation
decreases nearer their stations. This appears consistent with a complementary
relationship between taxicabs and transit, in which passengers find taxicab travel
more necessary (and its relative utility higher) when transit is less accessible due
to distance. The Red Line offers high service levels along a dense corridor of
travel demand, so individuals beginning trips near a Red Line station will find it to
be a more reasonable alternative to the taxicab for many trips. In the Green
Lineʼs case, the opposite relationship between the modes is observed: The
nearer a Green Line station, all else being equal, the more taxicab activity
occurs. Like the Red Line, the Green Line follows a dense corridor of travel
demand, connecting Bostonʼs CBD, the Back Bay, and Boston University. The
sharp distinction between the Green Lineʼs relationship to taxicab pickups and
the Red Lineʼs may be explained by differences between the two corridors: The
Green Line is a light rail line that travels quite slowly in places and must stop for
traffic due to its at-grade operation. Like the Green Line, the Silver Line and the
evening-period Blue Line have more taxicab activity nearer their stations. The
Silver Lineʼs coefficients can potentially be explained by its lower service levels
and slower speeds in comparison with heavy rail transit, as suggested for the
Green Line. As a final note, some taxicab trips that begin near rail stations do not
serve destinations that rail also serves. Nevertheless, these transit access
coefficients provide evidence that taxicab service levels, to the extent that they
are manifested as realized demand, sometimes increase along with distance
from transit stations and sometimes decrease.
• Transit access variables (bus): Two indicators of bus access measure total
MBTA bus routes and major bus routes intersecting a block group, respectively.
Interestingly, total bus routes are positively related to taxicab trip generation
throughout the day while major bus routes are inversely related to trip generation.
One possible explanation for this divergence is that the MBTAʼs highest-
frequency bus routes provide sufficient service levels to attract passengers that
might otherwise use taxicabs, while its overall bus service is not frequent enough
to accomplish this and actually loses passengers to the taxicab. The coefficients
for the variable representing major bus routes have their most extreme value
during the morning peak, when this bus service is more frequent. When transit
service is poor, under this hypothesis, the taxicabʼs role as a substitute to transit
is encouraged.
The variation in taxicab pickups that is not explained by these models manifests itself as
their residuals, which are mapped in Figure 1 and Figure 2. Residuals for both sets of
models are calculated by subtracting the modelsʼ predicted values from the actual
observed values for each census block group, and these values are “studentized” by
dividing each residual value by its standard deviation.

FIGURE 1: MODEL RESIDUALS

FIGURE 2: AVERAGE RESIDUAL VALUES

The residual values are important in their ability to hint at which parts of Boston the
taxicab underserves. Negative residuals represent instances when the model
overestimates a block groupʼs actual trip generation, and if these block groups have
characteristics that generally reflect high taxicab demand then unmet demand (as
opposed to realized demand) may exist there. Roxbury and Jamaica Plain exhibit
“overestimated” trip generation, as do Charlestown, East Boston, South Boston, and
Allston. Parts of these areas also have poor access to rail transit, meaning the taxicab is
failing to fill specific gaps in Bostonʼs public transportation network. Income levels are
correlated with better rail transit access in Boston, so many of these apparent taxicab
service gaps affect lower-income neighborhoods (although the models control for
income). Of course, even areas with few taxicab pickups that appear underserved can
access dispatched taxicabs by calling for them; however, areas that rely on dispatched
taxicabs experience longer wait times and lower levels of service than areas with high
concentrations of cruising taxicabs. The quality of taxicab service at a given location is a
product of that serviceʼs time and monetary costs, rather than the mere ability to obtain
service.
V. CONCLUSIONS
Observations of Bostonʼs taxicab pickup patterns reveal that certain areas generate
higher taxicab activity levels than others, while additional clues suggest that Bostonʼs
realized demand patterns do not perfectly match its total demand. Having learned that
taxicab activity is clustered in certain areas and is sparse throughout other parts of
Boston, and knowing that such clustering is a product of taxicab supply and not just
demand, the taxicab almost certainly underserves certain parts of Boston. Transit
access also varies throughout the city, and gaps in the system—places with below-
average transit access—lack a “public” form of mobility that the taxicab could potentially
provide. Identifying the existence of unmet travel demand within these gaps would
confirm this condition, and the preceding regression analysis was an initial step toward
doing so. Future analyses of taxicab service in Boston should investigate the areas that
these modelsʼ residuals identify as potentially underserved by both taxicabs and transit.

The analysis presented here models trip generation, which is a proxy if not a precise
indicator of taxicab service levels. Trip generation is a product of supply (the relative
availability, cost, and behavior of taxicabs) as well as demand (the locations and
preferences of passengers). Grouping the modelsʼ explanatory variables according to
whether they impact taxicab supply or demand facilitates inferences of where unmet
demand exists. High building volumes, a high share of commercial land use, and high
incomes lead to higher trip generation, most likely, by creating demand for taxicab
travel. Centrality, on the other hand, primarily influences the supply side of realized
demand, as the literature has pointed out tendencies for cruising taxicabs to cluster in
downtown areas (Frankena and Pautler 1984; Yamamoto et al. 2008). If a census block
group in Boston has few taxicab pickups despite characteristics that predict high
demand for the mode, as well as supply characteristics that predict low realized
demand, the evidence presented thus far gives reason to believe that unmet demand
exists in that location. These modelsʼ residuals show which parts of Boston diverge from
their predictions, and locations with negative residuals as well as qualities expected to
negatively impact taxicab supply are the most likely to be underserved. These
conclusions should nonetheless be viewed as tentative, however: A number of
potentially relevant variables are omitted from these models, and future research will
ideally pick up where this paper leaves off by improving the modelsʼ specifications.

REFERENCES
Alexander, C., S. Ishikawa, and M. Silverstein (1977). A Pattern Language: Towns, � Buildings, Construction. New York: Oxford University Press.
Arnott, R. (1996). ”Taxi Travel Should Be Subsidized.” Journal of Urban Economics 40: � 316-333.
Beesley, M. E. and S. Glaister (1983). ”Information for Regulating: The Case of Taxis.” � Economic Journal 93: 594-615.
Beimborn, E. A., M. J. Greenwald, and X. Jin (2003). “Impacts of Transit Accessibilityand Connectivity on Transit Choice and Captivity.” Transportation Research Record 1835: 1-9.
Berdik, Chris (2004). “Fare Game.” Boston Magazine, September 2004.
Bossard, E. G. (2002). Envisioning Neighborhoods with Transit-Oriented DevelopmentPotential. US Department of Transportation Research and Special Programs Administration, California Department of Transportation, and Mineta Transportation Institute, MTI Report 01-15. Springfield, VA: Mineta Transportation Institute.
Boston Police Department (2008). Rule 403: Hackney Carriage Rules and Flat Rate � Handbook. Boston, MA.
Cairns, R. D. and C. Liston-Heyes (1996). “Competition and regulation in the taxi � industry.” Journal of Public Economics 59: 1-15.
Cervero, R. (1997). Paratransit in America: Redefining Mass Transportation. Westport, � CT: Praeger Publishers.
Chang, H., Y. Tai, and J. Y. Hsu (2010). “Context-aware taxi demand hotspotsprediction.” International Journal of Business Intelligence and Data Mining 5(1): 3-18.
City of Boston (200). Boston Transportation Fact Book and Neighborhood Profiles. � Boston, MA.
CMT FleetNet. <https://portal.cmtnyc.com>. Accessed May 12, 2011.
Design Trust for Public Space (2007). TAXI 07: ROADS FORWARD. New York: New � York City Taxi and Limousine Commission.
Douglas, G. W. (1972). ”Price Regulation and Optimal Service Standards: The Taxicab � Industry.” Journal of Transport Economics and Policy 20: 116-127.

FareInvestor. <www.fareinvestor.com >. Accessed May 18, 2011.
Frankena, M. W. and P. A. Pautler (1984). “An Economic Analysis of Taxicab � Regulation.” Washington, DC: Bureau of Economics, Federal Trade Commission.
Gilbert, G. and R. E. Samuels (1982). The Taxicab: An Urban Transportation Survivor. � Chapel Hill, NC: University of North Carolina Press.
Jackson, K. T. (1985). Crabgrass Frontier. New York: Oxford University Press.
Koehler, B. (2004). Regulating Supply in Taxi Markets. Masterʼs Dissertation, � Department of Economics, City University London.
Liu, L., C. Andris, A. Biderman, and C. Ratti (2009). “Uncovering Taxi Driverʼs MobilityIntelligence through His Trace.” In Movement-Aware Applications for Sustainable Mobility: Technologies and Approaches, 105-120.
Massachusetts Bay Transportation Authority (2009). MBTA Ridership and Service � Statistics (“The Blue Book”): Twelfth Edition. Boston, MA.
MassGIS. <www.mass.gov/mgis>. Accessed May 18, 2011.
Matsushima, K. and K. Kobayashi (2010). “Spatial equilibrium of taxi spot markets and � social welfare.” Lisbon: Proc. of the 12th WCTR.
Mayorʼs Office of Transportation (1978). Boston Taxi Study: Final Report. Boston, MA.
Meyer, J. R., J. F. Kain, and M. Wohl (1965). The Urban Transportation Problem. � Cambridge, MA: Harvard University Press.
MIT Geodata Repository. Accessed May 18, 2011.
New York City Taxi and Limousine Commission (2011). Taxi of Tomorrow Survey � Results. New York.
Phithakkitnukoon, S.. M. Veloso, C. Bento, A. Biderman, and C. Ratti (2010). “Taxi-� Aware Map: Identifying and Predicting Vacant Taxis in the City.”
Schaller, B. (1999). ”Elasticities for taxicab fares and service availability.” Transportation � 26: 283-297.
Schaller, B. (2007). “Entry Controls in Taxi Regulation.”
Schaller Consulting (2006). The New York City Taxicab Fact Book. New York.

Schroeter, J. R. (1983). “A model of taxi service under fare structure and fleet size � regulation.” Bell Journal of Economics 14(1): 81-96.
Sigelman, L. and L. Zeng (1999). “Analyzing Censored and Sample-Selected Data with � Tobit and Heckit Models.” Political Analysis 8(2): 167-182.
Small, K. A. and C. Winston (1999). “The Demand for Transportation: Models andApplications.” In Essays in Transportation Economics and Policy: A Handbook in Honor of John R. Meyer, ed. J. Gomez-Ibanez, W. Tye, and C. Winston, 11-56. Washington, DC: Brookings Institution Press.
Teal, R. F. and M. Berglund (1987). “The Impacts of Taxicab Deregulation in the USA.” � Journal of Transport Economics and Policy 21(1): 37-56.
Teal, R. F., J. V. Marks, and R. E. Goodhue (1979). “Subsidized Shared-Ride Taxi � Services.”
Thomson, J. M. (1977). Great Cities and Their Traffic. London: Victor Gollancz Ltd.
Tsamboulas, D. A. and A. Nikoleris (2008). “Passengersʼ willingness to pay for airport � ground access time savings.” Transportation Research Part A 42: 1274-1282.
U.S. Census. (2000).
Verifone eFleet. <www.verifone.com>. Accessed May 12, 2011.
Weather Underground. <www.wunderground.com> Accessed May 18, 2011.
Webster, A. L., E. Weiner, and J. D. Wells (1974). “The Role of Taxicabs in UrbanTransportation.” Washington, DC: Office of Transportation Planning Analysis, US Department of Transportation.
Yamamoto, K., K. Uesugi, and T. Watanabe (2008). “Adaptive Routing of Cruising Taxisby Mutual Exchange of Pathways.” In KES 2008, Part II, LNAI 5178, eds. I. Lovrek, R. J. Howlett, and L. C. Jain, 559-566. Berlin: Springer-Verlag.
Yang, H., C. S. Fung, K. I. Wong, and S. C. Wong (2010). “Nonlinear pricing of taxi � services.” Transportation Research Part A 44: 337-348.
Yang, H., S. C. Wong, and K. I. Wong (2002). “Demand–supply equilibrium of taxiservices in a network under competition and regulation.” Transportation Research Part B 36: 799-819.
Ziebart, B. D., A. L. Maas, A. K. Dey, and J. A. Bagnell (2008). “Navigate Like a Cabbie:

Probabilistic Reasoning from Observed Context-Aware Behavior.” In UbiComp 2008: Proceedings of the 10th International Conference on Ubiquitous Computing, 322–331. New York: ACM.