the surface circulation in the eastern basin of the ... · keywords: mediterranean sea, eastern...
TRANSCRIPT

INTRODUCTION
The circulation of Atlantic Water (AW,http://www.ciesm.org/catalog/WaterMassAcronyms.pdf, 100-200 m thick) in the eastern basin of the
Mediterranean Sea is still debated. Four majorschemata have been proposed up to now: Nielsen(1912; Fig. 1a), Ovchinnikov (1966; Fig. 1b),Lacombe and Tchernia (1972; Fig. 1c), andRobinson et al. (1991; Fig. 1d), completed by
SCIENTIA MARINA 70 (3)September 2006, 457-503, Barcelona (Spain)
ISSN: 0214-8358
The surface circulation in the eastern basin of theMediterranean Sea
NAJWA HAMAD, CLAUDE MILLOT and ISABELLE TAUPIER-LETAGE
Laboratoire d’Océanographie et de Biogéochimie Centre National de la Recherche Scientifique (UMR 6535) andUniversité de la Méditerranée (Centre d’Océanologie de Marseille) Antenne de Toulon, BP 330,
F-83507 La Seyne-sur-Mer. E-mail: [email protected]
SUMMARY: The schema of the Atlantic Water (AW, 100-200 m thick) circulation in the eastern basin of the MediterraneanSea elaborated in the 1990s (and widely referred to nowadays) mainly shows jets meandering offshore across the wholebasin. However, all previous schemata (since the 1910s) and an analysis of infrared (IR) satellite images in the 1990s showcounterclockwise circulation at basin scale. A former controversy about the circulation was elucidated in the western basinwhere IR images helped describe the mesoscale features and demonstrate their role in the circulation. This motivated thedetailed analysis of IR daily and weekly composites (~1000) from 1996 to 2000, and of monthly composites since 1985. Weshow that AW circulates along the upper part of the continental slope in a counterclockwise direction around the whole basin.In the south and all year long, this circulation is unstable and generates mesoscale anticyclonic eddies that spread AW off-shore; in the north dense water formation induces larger seasonal variability. These mesoscale eddies, as well as the Etesian-induced eddies Ierapetra and Pelops, can be followed for years, sometimes several hundreds of km away from where theyare formed, and they can merge and/or interact with the alongslope circulation.
Keywords: Mediterranean Sea, eastern basin, surface circulation, mesoscale eddies, infrared satellite imagery, 30-46°N and10-36°E.
RESUMEN: LA CIRCULACIÓN SUPERFICIAL EN LA CUENCA ORIENTAL DEL MAR MEDITERRÁNEO. – Los esquemas de circulacióndel Agua Atlántica (AW, 100-200 m de grosor) en el Mediterráneo oriental elaborados en los años 1990 (y abundantemen-te citados en la actualidad) presentan principalmente una corriente en chorro ondulante atravesando el centro de la cuenca.Por el contrario, todos los esquemas anteriores (desde los años 1910) y un análisis de imágenes infrarojas (IR) de satélite enlos noventa presentan una circulación antihoraria a escala de la cuenca. Una controversia anterior sobre la circulación en lacuenca occidental fue resuelta gracias a que las imágenes IR ayudaron a describir los fenómenos de mesoescala y demostrarsu papel en la circulación. Esto motivó un análisis detallado de imágenes IR compuestas diarias y semanales (~1000) duran-te 1996-2000 y mensuales desde 1985. Aquí demostramos que el AW en general circula sobre la parte superior del talud con-tinental, de forma antihoraria por toda la cuenca. En el sur, y a lo largo de todo el año, esta circulación es inestable y gene-ra remolinos anticiclónicos de mesoescala que esparcen el AW hacia alta mar; en el norte la formación de agua densa indu-ce una gran variabilidad estacional. Estos remolinos de mesoescala, así como los inducidos por los vientos Etesios (Ierapetray Pelops), pueden ser seguidos durante años, a veces por varios centenares de quilómetros a partir de su lugar de formación,y pueden unirse y/o interaccionar con la circulación a lo largo del talud.
Palabras clave: Mar Mediterráneo, cuenca oriental, circulación superficial, remolinos de mesoescala, imágenes infrarojasde satélite, 30-46°N y 10-36°E.

Robinson and Golnaraghi (1993; Fig. 1e) and byMalanotte-Rizzoli et al. (1997). The three olderschemata could not be very accurate or detailedbecause of the limited amount of in situ data andbecause the mesoscale dynamics were unknown.Nevertheless, the Coriolis effect is considered domi-nant in these schemata that describe an overall circu-lation that is essentially counterclockwise around thebasin. Hereafter they will be referred to as the “his-torical schemata”. Our geographical terminology andthe bathymetry are superimposed on Nielsen’sschema (Fig. 1) because it is relatively simple, and itis fully consistent with our own analysis.
The fourth schema is based on data and modelresults from the programme Physical Oceanographyof the Eastern Mediterranean (POEM group, 1992).
It has benefited from a wealth of in situ and satellitedata, and differs markedly from the historical ones.It describes central meandering jets crossing: i) thecentral part of the Ionian subbasin or spreadingclockwise in its northern part (the “Atlantic IonianStream, AIS” and the “Mid-Ionian Jet, MIJ”), ii) thesouthern Cretan subbasin (i.e. the Cretan passage;the “North African Current, NAC”) and iii) theLevantine subbasin (the “Mid-Mediterranean Jet,MMJ”) before iv) flowing off the Middle East andTurkey (the “Cilician Current, CC” and the “AsiaMinor Current, AMC”). In the rest of the paper,schemata based on central meandering jets will bereferred to as “POEM-type” schemata.
The POEM-type schemata also disagree with acontemporaneous analysis of infrared (IR) satellite
SCI. MAR., 70(3), September 2006, 457-503. ISSN: 0214-8358
458 • N. HAMAD et al.
FIG. 1. – The different schemata of the surface circulation in the eastern basin of the Mediterranean Sea. a) Nielsen (1912); bathymetry in m.Index of subbasins: 1: Channel of Sicily, 2a: southern Ionian, 2b: central Ionian, 2c: northern Ionian; 3: Adriatic; 4: southern Cretan; 5: west-ern Levantine (deeper than 3000m: the Herodotus trough); 6: southeastern Levantine; 7: northern Levantine; 8: northern Cretan; 9: Aegean.
b) Ovchinnikov (1966). c) Lacombe and Tchernia (1972). d) Robinson et al. (1991); e) Robinson and Golnaraghi (1993).
a b
c
d
e

images spanning the eighties (Le Vourch et al.,1992). The thorough analysis presented hereafterwas undertaken considering firstly a preliminarycomparison between the western and eastern basinsthat evidenced marked similarities (Millot, 1992),and secondly that the numerous studies we haveconducted during ~20 years in the western basin(e.g. Millot et al., 1997; Taupier-Letage et al., 2003)have established the good correlation between satel-lite and in situ observations. Hence, using satellitedata (not only IR but also visible and altimetric) forcirculation studies has been validated, and hasplayed a pivotal role in solving the controversyabout the circulation of the Levantine IntermediateWater off the Algerian slope (Millot and Taupier-Letage, 2005a) as well as several aspects of the cir-culation in the whole Mediterranean Sea (Millot,2005). Given the scarcity of in situ observations inthe eastern basin and the discrepancies between theirvarious interpretations, we decided to perform anintensive analysis of IR images prior to any newobservational effort. The first results of this analysiswere presented in 2002 by Hamad et al. (2004) andthe definitive results at basin scale were publishedby Hamad et al. (2005). Here we present the detailedresults down to subbasin scale.
In the rest of the paper, when reporting previousfindings, we identify the original terms with invert-ed commas, and use (and suggest using) terms thatwe think are more adequate in our own analysis. Asan example, we use the term subbasin (or omit it) forall parts of the eastern basin of the MediterraneanSea that have been defined up to now indifferentlyas seas, basins or passages (see Fig.1a). For the sakeof clarity in our papers, we have adopted the termi-nology defined hereafter. We consider that the termsgyres and eddies imply different generation process-es and dynamical features, and therefore we differ-entiate them. We define gyres as circuits induced bywind and/or thermohaline forcings, which are clear-ly constrained by the bathymetry along most of theirperiphery, i.e. at basin or subbasin scale; gyres arethus stationary for the most part. We characterisethem as clockwise / counterclockwise. We defineeddies as mesoscale phenomena generated either byprocesses that destabilise the circulation or by thewind stress curl locally induced by orographiceffects. We characterise them as cyclonic / anticy-clonic. Eddies are not constrained by the bathymetry(but can be guided by it), and thus can grow andmove. We consider that they propagate when
embedded in their parent current (a propagationspeed can be theoretically defined) and that theydrift when separated / isolated. Eddies are mesoscalephenomena that can reach diameters up to 250 km,even in the Mediterranean Sea, last for years andextend down to the bottom.
In the next section we present our use of the IRimages. First we briefly describe the AW circulationin the western basin to show the relevance of theinformation provided by these images and to allowfurther comparisons with the eastern basin (seeMillot and Taupier-Letage, 2005b for more details);then we present our data set, describe the visualanalysis technique and stress its validity by compar-ing it with other observations In the following sec-tion we present the surface circulation schemataavailable at basin scale, as well as those at subbasinand meso-scales. Another section contains our inter-pretation of the images in terms of surface circula-tion. We discuss the previous analyses and schema-ta, and finally propose our own schema for the AWcirculation.
VISUAL ANALYSIS OF SATELLITE IR IMAGES
The findings inferred in the western basin
From the experience gained in analysing IRimages to deduce dynamical patterns (Le Vourch etal., 1992), Millot (1992) suggested that the overallcirculation in the western basin was similar to that inthe eastern basin, and that mesoscale dynamicsplayed a major role in both basins. In the westernbasin, a few images prompted new hypotheses aboutthe processes (Millot, 1985) and led to original cir-culation schemata being elaborated (Millot, 1987).Complementary sets of images (e.g. Taupier-Letageand Millot, 1988) and in situ experiments guided bysatellite information (e.g. Millot et al., 1990, 1997)have allowed the schemata to be refined (Millot,1999). The sampling strategy of operations such asELISA (Eddies and Leddies Interdisciplinary Studyoff Algeria, 1997-1998, www.ifremer.fr/lobtln/ELISA) is now adjusted according to the imageryreceived aboard in near real time, and mesoscalefeatures are sampled in the most efficient way(Taupier-Letage et al., 2003; Millot and Taupier-Letage, 2005a). The circulation in the western basinis first described to emphasise similarities / differ-ences with its eastern counterpart.
SCI. MAR., 70(3), September, 2006, 453-503. ISSN: 0214-8358
SURFACE CIRCULATION IN THE EASTERN MEDITERRANEAN • 459

Upon entering the Alboran, the AW generallydescribes one or two clockwise gyres before flowingalong the Algerian slope. Then, specific instabilityprocesses generate mesoscale meanders and eddiesoff Algeria, so that this flow of AW (100-200 mthick) was named the Algerian Current (Millot,1985). Most of the time the current meanders andgenerates a series of coastal (paired) eddies ~50 kmin diameter but once or twice a year a meanderincreases in size (~100 km). Such a meander gener-ates an embedded anticyclonic eddy, and both gen-erate an anticyclonic eddy in the lower layer that canextend down to the bottom (~3000 m; Obaton et al.,2000; Millot and Taupier-Letage, 2005a). Theensemble (named event) can remain stationary orpropagate downstream (up to 3-5 km/day), followthe deep isobaths and finally detach from its parentcurrent at the entrance of the channel of Sardinia.After pinching off, an event looks like an open-seaanticyclonic eddy, intense in the surface layer andstill able to extend down to the bottom (Ruiz et al.,2002). Then, probably because of the trough formedby the deepest isobaths in the eastern Algerian, mosteddies drift along a counterclockwise circuit in thisarea. Since the Algerian eddies (AEs) have lifetimesof up to ~3 years (Puillat et al., 2002), the subbasincan be almost filled with these eddies, which fre-quently interact with each other and with their par-ent current.
The AW that has been entrained seawards by theAEs accumulates northwards (thus forming theNorth-Balearic front) before concentrating and flow-ing along western Corsica. Then it merges with thepart of the AW that has not been entrained seawardsoff Algeria but has progressed along the southern andeastern slopes of the Tyrrhenian (without entering theeastern basin): the western Corsican and Tyrrhenianflows join and form the Northern Current. TheNorthern Current displays a marked seasonal vari-ability, since it is linked to the formation of theWestern Mediterranean Dense Water (WMDW) thatoccurs in the Liguro-Provençal subbasin. However,this is not a rim current stricto sensu, since it does notsurround the zone of dense water formation in thesouth. This current is mainly affected by meandersup to ~100 km in wavelength that never evolve intoeddies, and that propagate downstream at 10 to 20km/day in winter (Crépon et al., 1982) and 5 to 10km/day in spring to autumn (Sammari et al., 1995).Note that the former “Liguro-Provenço-CatalanCurrent” was named Northern Current (Millot, 1991)
to emphasise the fact that it was expected to be acommon characteristic of both the western and east-ern basins of the Mediterranean Sea, as well as of theAsian Mediterranean Sea, that is, the East/Japan Sea(Millot, 1992).
Other eddies are induced by the wind. Majorones develop as a pair, east of the Strait ofBonifacio, due to the effect of the orography ofCorsica and Sardinia on westerly winds. Artale et al.(1994) have shown that the cyclonic eddy in thenorth was surrounded by a rim current and Fuda etal. (2002) have hypothesised it might be a zone ofdense water formation. Note that this eddy resultsfrom AW diverging (uplifting of the interface),hence forming a motionless cool central area, whilethe anticyclonic eddy in the south is composed ofAW converging (depression of the interface) androtating as a warm isolated lens. As emphasised byMillot and Taupier-Letage (2005b), these basic dif-ferences also occur between such mesoscale eddiesin the eastern basin.
The IR data set
The NOAA (National Oceanic and AtmosphericAdministration) operates a series of quasi-polarorbiting satellites carrying an Advanced Very HighResolution Radiometer (AVHRR) that has channelsin both the visible and the IR. Since the atmospherecontaminates the marine emitted signals, a multi-IR-channel algorithm is used to compute a Sea SurfaceTemperature (SST). A major problem to face is thatthe IR signal is emitted by the very surface (skintemperature), which is not always representative ofthe bulk temperature, which is the one of interest.For instance, solar heating on calm days leads towarm superficial spots, and intense evaporationleads to colder skin temperature. However, as it willbe seen hereafter, these situations can be easilydetected and thus disregarded in the analysis. In thispaper we consider only the SSTs that are representa-tive of the bulk temperature, and from which weintend to infer information about the surface (atleast) layer dynamics.
The AVHRR thermal resolution is 0.125°C andthe SST is generally retrieved with a precision high-er than 1°C. The spatial resolution is ~1 km at nadirin the Local Area Coverage mode (otherwise ~4 kmin Global Area Coverage mode), the swath width is~3000 km and several orbits are available per dayover the Mediterranean. Generally, AVHRR data are
SCI. MAR., 70(3), September 2006, 457-503. ISSN: 0214-8358
460 • N. HAMAD et al.

put through a series of procedures to remove datathat is out of range, detect the presence of clouds,reduce the atmospheric contamination, computeSST and correct the geographical distortions. Daily,weekly, monthly, etc. composites are computed (indifferent ways), mainly to obtain cloud-free images.There is a general agreement that, given their spatio-temporal characteristics, time series of these imagesare an adequate tool for studying the Mediterranean.However, there are two major approaches that arebased on different analysis strategies and can thusdiverge: climatological studies vs. dynamical ones.To perform climatological studies at basin scale (e.g.Marullo et al., 1999a,b), a pixel of ~4 km is oftenused and accurate SST values are needed every-where, even where no data are available. The imagesare essentially composites to which spatial interpo-lation techniques are generally applied, which filterout tenuous gradients that we personally consider assignificant. Even though averaging increases theinformation significance, the longer the time aver-age the higher the damping of the real situation: forinstance, in the case of warmer eddies propagatingin line along the coast, a monthly/yearly averagewill only display a continuous warmer strip parallelto the coast. Therefore, even though this statisticalapproach is fully objective and does not require anypersonal input, it cannot be used for describing thecirculation and performing dynamical studies.
To perform dynamical studies, one needs todescribe phenomena that, considering their spaceand time scales, have permanent although variableSST signatures. Indeed, comparing the signature ofan eddy during a calm and sunny day with its signa-ture a few hours later after a wind speed increase, orthis signature in summer vs. winter can hardly bedone automatically with a computer. In addition,there is theoretically no direct relation between astreamline and an isotherm since both can be eitherparallel or perpendicular. Indeed, in the case of a jet,streamlines and isotherms are parallel at the base ofthe jet (giving the direction/sense of the jet), whilethey are perpendicular at its nose (the progression ofthe nose is computed from its successive positions).This is why all techniques proposed for inferringstreamlines from SST gradients cannot be routinelyapplied and why only those following a given small-scale SST feature on a series of images allow thelarge-scale currents that have transported this fea-ture to be inferred. Whatever the case, IR images areused worldwide to study the circulation, as it is easy
to intuitively infer features such as eddies and jets,and to recognise their signature from one image tothe following one (up to several days apart), even ifimages were collected with different meteorologicalor stratification conditions. With some practice, thisis as easy as inferring, just from the visual analysisof cloud images, the sense of rotation, and the sizeand location of either a tornado or a cyclone.
We have analysed ~1000 daily and weekly SSTcomposites for the period 1996 to 2001, and allmonthly composites from 1993 to 2001, from theGerman remote sensing centre DFD/DLR(http://eoweb.dlr.de, Figs. 4 to 21). To our knowl-edge, this is the only web site where images areavailable i) of the whole Mediterranean ii) geo-graphically registered iii) at full resolution (~1 km)and iv) for free. Image processing and composing isdescribed in http://eoweb.dlr.de:8080/short_guide/D-SST.html. The main DFD/DLR’s compositioncharacteristic is that there is no interpolation: thedaily images are composed retaining the SST maxi-mum value of every pixel to minimise cloud cover-age and atmospheric contamination. The drawbacksare first that warm spots due to episodic solar heat-ing are thus systematically selected (see Fig. 6d, offthe Cyrenaïca), and second that artificial thermalfronts due to the thermal contrast between night andday may appear (see Fig. 8b, between H and P97).In the former case information on the SST (signingthe surface circulation) is obliterated, while in thelatter case it is preserved. However, these composi-tion artefacts are easily detected, and disregarded inthe qualitative dynamical analysis. Weekly andmonthly products are derived from the daily com-posites using the average. We have also analysedimages from the PODAAC Pathfinder Archive(~9 km, SST, night and day composites, 8-day andmonthly composites, January 1985 to present,http://podaac.jpl.nasa.gov/sst/, Fig. 2 and 22), andfrom the SATMOS (agreement INSU/METEO-FRANCE, ~1 km, brightness temperature/ channel 4(= relative temperature), individual paths, October2001 to present).
The visual analysis
Contrary to the statistical/climatologicalapproach, which focuses on absolute SST valueswhich usually have a coarse spatial resolution, thevisual analysis considers the shape, location andconsistency of isotherms, even if they are only par-
SCI. MAR., 70(3), September, 2006, 453-503. ISSN: 0214-8358
SURFACE CIRCULATION IN THE EASTERN MEDITERRANEAN • 461

tially visible due to cloud coverage, at high spatialresolution (1-2 km). The SST absolute value is notrelevant for characterising a structure, since tenuousgradients can be as significant as stronger ones, dueto meteorological conditions and/or stratification. Inthe same way, SST variations on day-night and sea-sonal scales must be disregarded, since the sameeddy can be colder than its surroundings in summer,and warmer in winter. As a consequence, no thresh-old criteria can be determined to detect and trackstructures objectively (for more details see Taupier-Letage et al., 1998). To identify oceanic phenomenain any season, stratification or meteorological con-ditions, it is thus necessary to stretch the colourscale according to the thermal dynamics, so that weonly consider relative SST values. The colour scale(from blue (resp. light grey) for low temperatures tored (resp. dark grey) for higher temperatures) cannotbe kept constant throughout time series, and there isno univocal correspondence colour-SST (examplesare given by the ~3 year-time series of ~30 imagesused to track two Algerian eddies (Puillat et al.,2002) and four generations of the Ierapetra eddy(see Fig. 13) during ~3 years).
The visual analysis of a given image consists inreporting the isotherms (even segments only, ifcloudy) delineating a circulation feature and super-imposing all corresponding isotherms detected insuccessive images (as illustrated by Figure 3 ofMarullo et al., 2003). The recurrence of some spe-cific contouring ends up in delineating the wholefeature, its centre in the case of an eddy, and if it ismoving, its direction and speed. As no automatedmethod can achieve such a visual/”subjective”analysis, which is also highly time-consuming, it isnot used extensively. To validate our approach, wedetail some arguments and compare our results withthose inferred from other data sets.
The basic argument supporting the validity ofvisual analysis is that oceanic and atmospheric phe-nomena have dramatically different space and timescales. Essentially, clouds are changing and movingmore rapidly than any oceanic phenomenon so thatcomparing two images, even if only a few hoursapart, prevents the limits of a cloud being mistakenfor those of an eddy. Even when looking at a singleimage, most oceanic phenomena are differentiatedfrom atmospheric ones because their size is general-ly intermediate between that of mid-latitude low-pressure systems and the size of single clouds.Moreover, patterns are also characteristic: isotherms
associated with oceanic phenomena are smootherand less patchy than those associated with atmos-pheric ones.
Aside from the problems due to atmosphericcontamination and warm spots, one can also ques-tion the relation between the skin and the bulk tem-peratures, i.e. the SST significance. The most com-mon argument is to say that waves occur almost per-manently, so that the skin temperature is generallyrepresentative of the mixed layer. However, depend-ing on the wave height and wavelength (i.e. the windcharacteristics), the season (i.e. the thermocline) andthe overall situation (i.e. a zone of dense water for-mation vs. a permanently stratified coastal current),the mixed layer thickness can range from a fewmetres to 100s of metres. Therefore, whether a 100-km eddy is signed by SST differences of 1°C or10°C is not important for the visual analysis, whichis only concerned with the size and location of theeddy. The problem of skin vs. bulk temperatureappears to be crucial for climatological studies only,not for process studies.
Another aspect worth noting is that mesoscaleeddies with diameters of a few 100 km are knownfrom theoretical and worldwide field experiments tohave lifetimes of a few months / years and propaga-tion speeds of a few km/day. Thus, even if an eddycannot be seen from space for a while, it will mostlikely be recognised with a roughly similar shapeand location a couple of days/weeks apart. This notonly helps when the cloud coverage is intense butalso when the seasonal thermocline is relativelysharp (a few degrees) and thin (a few metres), afterseveral sunny days with light winds, so that the eddysignature can be more or less masked although nowarm spots occur (as frequently observed in theeastern Levantine).
Finally, the benefits of visual analysis can beillustrated by three examples. One concerns identi-fying AW. After entering one or the other basin (intheir southern parts), AW is first warmed up while itprogresses eastwards and then cooled when it pro-gresses northwards and reaches the dense water for-mation zones. Since AW also encounters seasonalvariability everywhere, just considering a certaindefinite SST range does not allow it to be automati-cally identified all along its course. Since a visualanalysis pays more attention to the continuity andshape of a set of isotherms than to the value of onegiven isotherm, AW can be visually identified (seeFigures 22 and 23a, where the warmer AW can be
SCI. MAR., 70(3), September 2006, 457-503. ISSN: 0214-8358
462 • N. HAMAD et al.

identified all around the basin, including in thenorth, thus proving that there is no bias due to lati-tude). The second example concerns the characteri-sation of mesoscale eddies. In case 3 anticycloniceddies (identified by higher SST) are close to eachother (positioned on the summits of a triangle), anyautomatic pattern recognition will define a cycloniceddy in-between (possibly even the unique structuredetected), centred on the lower SST values.However, visual analysis, which considers only theshape of the isotherms, will clearly identify the 3anticyclonic eddies, and will interpret the continuityof the isotherms in-between only as a transient eddy-induced (cyclonic) circulation (that will disappear assoon as one eddy moves away; see Figure 3 ofTaupier-Letage and Millot, 1988). The last exampleconcerns the characterisation of the so-called“Mersa-Matruh eddy or gyre” southwesternLevantine: while several (anticyclonic) mesoscaleeddies clearly appear permanently in this area onimages processed by visual analysis (see Figs. 9 to13), the climatological method used by Marullo etal. (1999a) does not allow any such eddies to be evi-denced in this area most of the time. Therefore,using IR imagery to study circulation features is spe-cific, in that tracking the propagation of eddies froma time series of images is more informative thanconsidering the averaged image for the same period,especially since averaging introduces biases forpropagating eddies and places emphasis on station-ary ones (note, however, that the actual techniquefor analysing altimetric data smoothes the stationaryeddies and emphasises the propagating ones).
Comparisons with other data sets
Many papers, based on comparisons with otherdata sets, account for the efficiency of IR images todepict oceanic phenomena not only worldwide, butalso in the eastern basin (e.g. Özsoy et al., 1993;Horton et al., 1994; Zodiatis et al., 1998; Marullo etal., 2003). Therefore, we have restricted this sectionto a few additional comparisons, among which arethe POEM data sets. Let us first emphasise theagreement between the thermal (IR) and biological(visible) signatures of mesoscale features (e.g.Arnone and La Violette, 1986 and Fig. 17 inTaupier-Letage et al., 2003, in the western basin;Fig. 1 in Taupier-Letage and Millot, 2003, in theeasternmost part of the eastern basin). Consistencybetween IR images of Algerian eddies and drifting
buoy trajectories was also established by Salas et al.(2002) and Font et al. (2004). We also compared allXBT transects collected in 1999-2000 during theMediterranean Forecasting System Pilot Project(MFSPP) to IR images, both in the western basin(Fuda et al., 2000) and the eastern one: allmesoscale anticyclonic features that were crossedhave a clear in situ signature, at least down to 400-500 m (Manzella et al., 2001; Zervakis et al., 2002;Fusco et al., 2003; Hamad, 2003). Analysing anticy-clonic eddies propagating north off Crete andtracked by their IR signatures has also been backedby moored ADCP time series (Cardin and Hamad,2003). Let us also emphasise the agreement with themost recent numerical results (e.g. Pinardi andMasetti, 2000; Alhammoud et al., 2003, 2005).Finally, agreement with altimetric data is also good,provided that the minima of the sea level anomaliesgenerally associated with mesoscale cyclonic eddies(hence with negative values) are just considered as akind of reference level (hence associated with near-ly zero values, not corresponding to any coherentstructure). Indeed, images show that anticyclonesheavily outnumber cyclones and are roughly twiceas intense and large as defined from altimetry.
This agreement between remotely sensed and insitu observations is to be expected, since validobservations cannot be questioned and must obvi-ously be consistent. But what can differ is theirinterpretation, as in the case of the POEM data sets.Figure 2 shows the dynamical patterns encounteredduring the four major POEM campaigns, whichspanned several week / month periods each, and thecorresponding SST relevant composites. All themajor features evidenced from in situ data aredetected on IR images. For POEM ON 85 (Fig. 2a,b): the cool “West Cretan gyre”, the warm “Mersa-Matruh” in the southwestern Levantine, the 3-polesignature of “Shikmona”, the “Rhodes gyre” and itssoutheastern extension, the “AMC” meandering andits associated eddy. For POEM MA 86 (Fig. 2c, d):the warm “Mersa-Matruh” in the southwesternLevantine, the 2-pole structure of “Shikmona”, thewarm eddy off the gulf of Antalya, the progressionof the “AMC” towards Crete. For POEM AS 87(Fig. 2e, f): the inflow meandering in the channel ofSicily, the northward branch in the Ionian, thecoastal eddy off Libya and Egypt and the cooler onenorth of it, Ierapetra, the multi-pole structure of“Shikmona”, the large “AMC” meander, the“Rhodes gyre” and its northeastward extension. For
SCI. MAR., 70(3), September, 2006, 453-503. ISSN: 0214-8358
SURFACE CIRCULATION IN THE EASTERN MEDITERRANEAN • 463

POEM O 91 (Fig. 2g, h): the flow structure in thechannel of Sicily (different from POEM AS 87), thenorthward branch in the Ionian, Pelops andIerapetra, a coastal eddy in the southwesternLevantine and an offshore one in the southwesternLevantine, the more simple structure of“Shikmona”, the “Cyprus anticyclonic eddy”, the“Rhodes gyre” and its extensions towards both thenortheast and southeast.
It is clear that our analysis of IR images agreeswith our own analysis of all in situ data sets (in par-
ticular the POEM ones), basically evidencing an AWalongslope flow at basin scale and intense mesoscaleeddies. In addition, many papers have shown that allthese eddies generally extend down to the deepestlevels that were sampled, sometimes down to ~2000m at least (e.g. Feliks and Itzikowitz, 1987; Brenner,1989, 1993; Özsoy et al., 1991, 1993; Horton et al.,1994; Zodiatis et al., 1998). Therefore, as for thewestern basin, we think that the visual analysis of IRimages can provide relevant information not only atthe surface but also at depths (down to 100-200 m
SCI. MAR., 70(3), September 2006, 457-503. ISSN: 0214-8358
464 • N. HAMAD et al.
FIG. 2. – Comparison of satellite (IR composites) and in situ (dynamics heights anomaly of the surface during the POEM cruises, fromRobinson et al. (1991) and from Malanotte-Rizzoli et al. (1999)) observations: a, b (November 1985, POEM ON 85), c, d (March 1986,POEM MA 86), e, f (August - early September 1987, POEM AS 87), g, h (October 199, POEM O 91). The main features are identified, usingthe POEM nomenclature (AIS: Atlantic Ionian Stream, AMC: Asia Minor Current, AE: Antalya Eddy, CAE: Cyprus Anticyclonic Eddy, E:
unnamed Eddy, I: Ierapetra, MM: Mersa Matruh, P: Pelops, RG: Rhodes Gyre, S: Shikmona, WCG: West Cretan Gyre).

for the AW flow, potentially down to the bottom forthe mesoscale eddies).
THE AVAILABLE SURFACE CIRCULATIONSCHEMA
Schema at basin scale
Nielsen’s (1912) schema (Fig. 1a), althoughbased on very few hydrological data, shows the AWcirculating counterclockwise and alongslope in theIonian and the Levantine before entering the Aegeanentirely. Then, the Black Sea water joins the AW andboth flow out of the Aegean around Greece beforesplitting into two branches. One branch enters theAdriatic and the other one continues flowing coun-terclockwise in the Ionian, thus joining the Adriaticoutflow south of Italy. This overall counterclock-wise and alongslope circulation is explained byNielsen (p. 134) as “due in the first place to theearth’s rotation, which bends the current to the rightand thus forces the inflowing AW up against thecoast of Africa and constantly maintains the currentsystem” and is shown by any relevant numericalmodel (e.g. Spall, 2004).
Ovchinnikov’s (1966) schema (Fig. 1b) is basedon geostrophic computations from a larger set ofhydrological data. The AW flow describes a mean-der in the central Ionian and generates two clock-wise circuits off Tunisia and Libya. Two relativelylarge counterclockwise circuits are also indicated:one southwest of Crete and the other in the northernIonian. Then, the AW flow meanders in the south-western and central Levantine, generating smallcounterclockwise and clockwise circuits in the areaof Mersa-Matruh before roughly splitting into twobranches. One branch flows alongslope, thus enclos-ing an area that could be assimilated to “Shikmona”,while the other one progresses directly towardsCyprus. Part of the former branch joins the lattereast of Cyprus and both form the “AMC”, whichwill join the other part west of Cyprus to form whatcould be assimilated to the counterclockwise“Rhodes gyre” and to a “West Cyprus gyre”. TheAW flow then penetrates the Aegean.
Lacombe and Tchernia’s (1972) schema (Fig.1c), based on complementary hydrological data,represents a kind of “AIS”, a large counterclockwisecircuit in the central and northern Ionian, and twoclockwise circuits off Tunisia and Libya. Contrary
to Ovchinnikov’s schema, it does not display a“Cretan gyre”. In the Levantine the AW flowdiverges, similarly to what was represented in thewestern basin (see Millot, 1985, for the related dis-cussion). Part of the flow continues its progressionalongslope and counterclockwise at basin scale,while the other part spreads seaward towardsCyprus. Within the “Rhodes gyre” area the schema-tised circulation is rather complex. No AW is shownentering the Aegean, where the major schematisedfeature is the outflow from the Black Sea.
The asset of Robinson et al.’s (1991) schema(Fig. 1d) is the introduction of a kind of mesoscalevariability (even though they mainly describe gyreswhile we describe eddies). Little information is pro-vided in the Ionian, where the AW flow meandersand forms the “AIS”. Two permanent features areindicated, the Pelops eddy and the “Cretan gyre”. Inthe northern Ionian the circulation is indicated toreverse seasonally. The AW flow continues in thecentral Levantine and forms the “MMJ” (called the“Central Levantine Basin Current” by Özsoy et al.,1989). Then, the “MMJ” splits into a series ofbranches. Some branches turn counterclockwisewest of Cyprus, forming the “Rhodes gyre” and the“West Cyprus gyre”, before becoming the “AMC”that merges with the northern parts of both gyres.Other branches turn clockwise and feed a set of per-manent or transient and recurrent clockwise gyres,the major two being known as “Mersa-Matruh” and“Shikmona” (as first named by Hecht et al., 1988).There is no indication of a possible alongslope coun-terclockwise flow; furthermore, a clockwise alongs-lope flow is indicated off the Middle East coasts,south of Cyprus. AW outflows from the southeasternLevantine around Cyprus, forming the “recurrentCC” that will then join the “AMC”. Other featuresare indicated either as recurrent or transient: thecyclonic “Latakia eddy”, the anticyclonic “Antalyaeddy” as well as other anticyclonic eddies in theIonian, the southern Cretan and the southeasternLevantine. The transient anticyclonic eddy southeastof Crete (now named Ierapetra) is indicated with arelatively small size and there is no indication of apossible “AMC” penetration into the Aegean.
Robinson and Golnaraghi (1993) refinedRobinson et al.’s schema (Fig. 1e), hence making itrelatively complex. In the Ionian they represent thesplitting that the “AIS” is said to have encounteredin summer 1987, especially with a major branch thatcirculates clockwise alongslope off Italy and
SCI. MAR., 70(3), September, 2006, 453-503. ISSN: 0214-8358
SURFACE CIRCULATION IN THE EASTERN MEDITERRANEAN • 465

Greece, enclosing the Pelops eddy and entering thesouthern Cretan. Another major branch of the “AIS”meanders and crosses the whole central Ionianbefore joining the former branch. In the Levantine,all mesoscale clockwise features previously indicat-ed in the southeast can possibly merge into a uniqueclockwise circuit. Therefore, the resulting circula-tion in the southeastern Levantine is definitelyclockwise off the Egyptian slope.
The schemata and analyses available at subbasin and meso- scales
The subbasin circulation schemata
With time and increasing data sets and modellingefforts, subbasin scale schemata sometimes differmarkedly from the basin-scale ones, although main-ly based on the same core of data. Within the chan-nel of Sicily, the “AIS” undulates in very differentpaths according to Robinson and Golnaraghi (1993;Fig. 1e), Malanotte-Rizzoli et al. (1997, Fig. 3a) andRobinson et al. (1999, not shown). In the Ionian, theschema by Malanotte-Rizzoli et al. (1997) complet-ed by Napolitano et al. (2000, not shown) is basedon a revisit to the POEM 1986-1987 data set. The“AIS” flowing around southern Sicily bifurcatesnear 37°N into two main branches. The first branchreverses clockwise directly towards Africa andencloses two anticyclonic eddies. No possible devel-opment of this branch south of ~34°N is indicated,and this branch does not contribute any more to thegeneral circulation, contrary to the schema ofRobinson and Golnaraghi (1993) (Fig. 1e). The sec-ond branch extends further into the northeasternIonian as far as ~ 39°N, and then turns clockwise tocross the entire Ionian southeastwards, forming the“Mid-Ionian Jet, MIJ”. Thus the circulation is nolonger clockwise alongslope in the whole northernsubbasin, as represented in the schema of Robinsonand Golnaraghi (1993, Fig. 1e). The “MIJ” entersthe southern Cretan from far offshore, and becomesthe “MMJ”. South of Crete, some of the AW flow(transported eastwards by the “MMJ” and trans-formed into “Levantine Surface Water: LSW”)flows back northwestwards. When entering theIonian, “LSW” forms two branches, one flowinginto the southern Aegean, the other dividing into twosmaller branches that surround the “Cretan cyclone”and the Pelops anticyclone. Surface water originat-
ing from the Adriatic (“Adriatic Sea Water: ASW”)is mainly entrained southeastwards by the “MIJ”across the Ionian and transformed into “Ionian SeaWater: ISW”. A cyclonic eddy south of Italy, acyclonic eddy northwest of Greece and an anticy-clonic eddy between Crete and the Peloponnesehave been added.
In the central part of the basin (33-37°N, 20-30°E), it has been known for a long time (e.g.Lacombe et al., 1958; Burman and Oren, 1970) thatlarge exchanges of surface water between theLevantine and the Aegean / northern Cretan occurthrough the east-Cretan straits. The Zodiatis (1992,1993) analysis is consistent with the Theocharis et al.(1993) schemata for late winter 1986 and late sum-mer 1987 (Fig. 3b,c). The “AMC” always splitsbefore Rhodes. One branch penetrates into theAegean through the Rhodes strait while the otherforms the northern part of the “Rhodes gyre” andpenetrates through the other east-Cretan straits(Karpathos and Kasos) in winter only, when the“Rhodes gyre” has its maximum extension andstrength. The circulation undergoes a large seasonalvariability north and south of Crete. During winter1986 (Fig. 3b), the “AMC” within the northernCretan surrounds two cyclonic eddies while it mergeswith a meandering “MMJ” in the southern Cretan.During summer 1987 (Fig. 3c), the circulation mean-dered eastwards (in opposition to the winter one)within the northern Cretan and through the Karpathosand Kasos straits, while a huge Ierapetra and anintense southward flow due to the Etesians confinedthe “Rhodes gyre” to the east. Within the southernCretan, the interpretation of the data is that the“MMJ” is located far to the south in summer. The“Pelops and Cretan gyres” are roughly similar in bothschemata. The schema of Theocharis et al. (1999,Fig. 3d), based on CTD data from March 1994 toFebruary 1995, shows an “AMC” partly entering theAegean and partly veering south, where it appearslikely to merge with the “MMJ”, which is indicatedto form the northern border of the “Ierapetra gyre”.Refinement since the previous version includes thefollowing permanent features in the northern Cretan:a gyre, an anticyclone and a cyclone.
The schema of Theodorou et al. (1997) (Fig. 3e),based on CTD data in winter 1994, confirms thenorthward spreading of the “AMC” through theeast-Cretan straits shown by Theocharis et al. (Fig.3b, d), but describes an eastward (i.e. opposed) cir-culation in the northern Cretan.
SCI. MAR., 70(3), September 2006, 457-503. ISSN: 0214-8358
466 • N. HAMAD et al.

In the Adriatic, the schema of Artegiani et al.(1997) represents a counterclockwise circulationseparated into segments, with a marked seasonalvariability (Fig. 3f). In winter, the circulation iscomposed only of an inflow on the eastern side ofthe southern Adriatic and a southward current in thenorthwestern area. In summer, only southward seg-ments appear along the remainder of the Italiancoastline. Two major counterclockwise gyres areschematised in the central and southern Adriaticexcept during winter; they are therefore partiallydisconnected from the inflow which is mainly indi-cated for winter.
Studies of specific gyres and eddies
a) PelopsAccording to Theocharis et al. (1999), Pelops is
an anticyclonic deep (>2000 m) feature locatedsouthwest of Peloponnese. There is a general agree-ment that it is forced by the winds (Le Vourch et al.,1992; Golnaraghi and Robinson, 1994; Ayoub et al.,1998). However, it is also considered as an “AIS”meander by Marullo et al. (1999a), as a permanenteddy by Robinson et al. (1991) and gyre byTheocharis et al. (1993, 1999). Matteoda and Glenn(1996) suggest it is an almost persistent feature sub-
SCI. MAR., 70(3), September, 2006, 453-503. ISSN: 0214-8358
SURFACE CIRCULATION IN THE EASTERN MEDITERRANEAN • 467
FIG. 3. – The different schemata of the surface circulation in: the Ionian (a) from Malanotte-Rizzoli et al. (1997); the Cretan in late winter1986 (b) and late summer 1987 (c) from Theocharis et al. (1993), from Theocharis et al. (1999) (d), and from Theodorou et al. (1997)
(e); the Adriatic from Artegiani et al. (1997) (f).

ject to interannual variability since, from weekly IRimages, they infer its continuous presence fromautumn 1990 to spring 1992, its absence during ~2years, and then its temporary occurrence during the1994 and 1995 winter-spring periods. According toAyoub (1997) who analysed altimetric data (1992-1996), Pelops represents a complex series of eddiesmoving along the Greek coasts, which is generatedin late autumn and persists until the end of the win-ter with a maximal intensity in November-December. Larnicol et al. (2002) analysed similardata (1993-1999) and indicate that Pelops is recur-rent, displaying a seasonal variability with astrengthening in autumn-winter. Although they alsoindicate an interannual variability of its location,Pelops is generally located south of Peloponnese inautumn-winter and west-southwest of it in spring-summer, thus agreeing with Matteoda and Glenn(1996) on its tendency to propagate westward.
b) “Western Cretan gyre”It has been described as a “permanent cyclonic
gyre” located southwest of Crete, its size varyingaccording to the authors (e.g. Ovchinnikov, 1966,Fig.1b, Robinson et al., 1991-1993, Fig. 1d-e).However, according to satellite images and in situdata (e.g. Le Vourch et al., 1992; Theocharis et al.,1993; Matteoda and Glenn, 1996), the relativelycool SST values and the associated doming structuremainly occur from late summer to early winter as aconsequence of the Etesians.
c) IerapetraThis intense anticyclonic eddy located southeast
of Crete was first studied by Burnett et al. (1991),who named it the “East Cretan eddy”, and byTheocharis et al. (1993) who first named itIerapetra. It has a diameter of 100 to 150 km, it canoccupy half of the southern Cretan (Hecht andGertman, 2001) and its signature can extend downto at least 1500 m (Theocharis et al., 1999).Although it is mentioned as a gyre (Larnicol et al.,1995; Lascaratos and Tsantilas, 1997; Theocharis etal., 1993, 1999), there seems to be a general agree-ment about the Horton et al. (1994) hypothesis thatIerapetra is due to the curl imposed on the Etesiansby the Crete orography. Ierapetra could be intensi-fied by the outflow from the Aegean through theKasos strait (Kotsovinos, 1997).
However, there is a disagreement about its for-mation period and longevity. Larnicol et al. (1995)
indicate that Ierapetra intensified at the end ofsummer, was weak in spring and absent in June-July during the period October 1992 to September1994. Ayoub (1997) and Ayoub et al. (1998) indi-cate a weakening of this eddy from winter tospring and an intensification from summer untillate autumn during the period October 1992 toDecember 1993. According to Matteoda and Glenn(1996), Ierapetra persisted during the whole stud-ied period (October 1990 to March 1995), exceptfor the 1993 and 1994 summers. According to theLascaratos and Tsantilas (1997) analysis of 155weekly IR composites from the period July 1993 toJune 1996, Ierapetra undergoes an annual cyclewith some interannual variability. It is generated inspring-summer, becomes fully developed in latesummer and disappears in the following spring.According to Larnicol et al. (2002), the Ierapetraformation in 1996 and 1997 was specific with anoccurrence far to the south of its normal position.As already suggested by Theocharis et al. (1993),these authors closely link the Ierapetra variabilitywith the variation in latitude of the position of the“MMJ”.
d) “Mersa-Matruh”According to Brenner’s (1989) analysis of
POEM data (October 1985, March 1986), this fea-ture is an “Egypt eddy” that is generated in summerclose to the Egyptian coasts by an unstable mean-dering of the “NAC” and then propagates ~160 kmnortheastwards at ~1 km/d. According to other stud-ies, this feature is a permanent gyre called “Egyptgyre” (Said, 1984) or “Mersa-Matruh gyre”(Robinson et al., 1991; Tziperman and Malanotte-Rizzoli, 1991; Malanotte-Rizzoli and Berga-masco, 1991). Golnaraghi (1993) claims it is thestrongest gyre in the eastern basin (up to 350 km indiameter) frequently interacting with the “MMJ”.“Mersa-Matruh” is also described as a complex sys-tem composed of several mesoscale eddies (Özsoyet al., 1989; Horton et al., 1994; Ayoub, 1997) or asa meander of the “MMJ” (Larnicol et al., 2002).Zervakis et al. (2002) consider that “Mersa-Matruh”is a stable anticyclone that progressively disappearsalong a specific transect, probably having disinte-grated into smaller scales, and suggest that it is morea closed eddy (transport >4 Sv) than a meander ofthe “NAC”.
Horton et al. (1994) and Ayoub (1997) mentionthat the most convenient period to observe an
SCI. MAR., 70(3), September 2006, 457-503. ISSN: 0214-8358
468 • N. HAMAD et al.

intense “Mersa-Matruh” would be during the weak-ening / absence of Ierapetra while the analysis of thePOEM-1991 data (Malanotte-Rizzoli et al., 1999)shows the simultaneous presence of a strongIerapetra and a strong “Mersa-Matruh”. Accordingto the numerical simulations of Roussenov et al.(1995), “Mersa-Matruh” is generated in summer andintensifies in November before splitting into twocells. Larnicol et al. (1995) mention that it does nothave any clear recurrence period and is charac-terised by rather short time scales. According toother model results (Malanotte-Rizzoli, 1994;Zavatarelli and Mellor, 1995; Brankart andBrasseur, 1998) and the analysis of weekly andmonthly IR satellite composites from the period1983 to1992 (Marullo et al., 1999a,b), “Mersa-Matruh” can be absent.
e) “Shikmona”Some authors indicate that “Shikmona” is com-
posed of anticyclonic mesoscale eddies originatingin the north (Feliks and Itzikowitz, 1987; Brenner,1989). However, Özsoy et al. (1989, 1991), POEMGroup (1992), Robinson et al. (1991) and Larnicolet al. (2002) indicate that a recurrent clockwise gyreis generated there by the “MMJ”. According toAyoub et al. (1998) and Zodiatis et al. (1998),“Shikmona” represents a complex system composedof mesoscale eddies, the positions, sizes, and inten-sities of which vary markedly. An anticyclonic eddylying south of Cyprus, which Brenner (1989) callsthe Cyprus eddy, and estimated to have a ~3-yearlifetime (Brenner, 1993) is expected to be the majorelement of this system by Özsoy et al. (1993) andAyoub (1997).
“Shikmona” is given to be either permanent(Hecht, 1988; Özsoy et al., 1989) or recurrent(Robinson et al., 1991). According to models,“Shikmona” is either encountered in all seasonsexcept in winter (Tziperman and Malanotte-Rizzoli,1991), or generated in summer before propagatingwestwards and decaying in late autumn (Roussenovet al., 1995), or absent (Malanotte-Rizzoli andBergamasco, 1991; Malanotte-Rizzoli, 1994;Zavatarelli and Mellor, 1995). Larnicol et al., (1995)indicate that it does not have any clear recurrenceperiod and is characterised by rather short timescales. According to Brenner (1993) and Horton etal. (1994), its surface signature is weak in winterand not always detectable in summer due to thestrong seasonal thermocline.
f) “Antalya gulf eddies”Özsoy et al. (1993) indicate the occurrence (from
1986 to 1990) of eddies with a vertical extent of~300 m at least at both the entrance (where the eddyis said to be recurrent) and the exit (where the eddyis said to be permanent) of the gulf.
g) “Rhodes gyre”It is well known (at least from Nielsen, 1912, p.
140) that a process of dense water formation (main-ly of LIW) occurs in the northern Levantine, morespecifically south of Rhodes. Ovchinnikov (1966) aswell as recent schemata (e.g. Fig. 21c,d, 22b,c) indi-cate that this occurs in an area permanently enclosedby a counterclockwise circulation commonly namedthe “Rhodes gyre”. Özsoy et al. (1989) correlate thisgyre with the Etesians, so that it is expected to bemore intense in summer. While the “Rhodes gyre” issaid to be generated by the Cretan sea outflow(Kotsovinos, 1997) and/or to be delimited in thesouth by the “MMJ” (Robinson et al., 1991),Theocharis et al. (1993, 1999) indicate that the“AMC” surrounds the gyre on its northern and west-ern edges.
In summary, there is clearly no agreement atbasin scale between the “historical” schemata andthe recent (POEM) ones, the major question beingthe occurrence or not of an overall counterclock-wise circulation. Additional debates concern thecharacteristics of nearly all mesoscale features ofthe circulation at subbasin scale, in particular theirforcing mechanism (i.e. are they eddies or gyres?)and lifetime (i.e. are they permanent, recurrent ortransient?).
RESULTS: THE SURFACE CIRCULATIONINFERRED FROM THE IR IMAGES ANALYSIS
Given the amount of data and the time span, wehave found it more efficient to identify regionswhere specific dynamics occur, and to present ouranalysis region by region. For each region, asroughly defined in Figure 1a, we detail one or afew situations that are representative of the overalldynamics there. Note that the AW upper part hasbeen given specific names by previous authorsdepending on the subbasins. However, we consid-er that the AW transformation is a continuousprocess, and we identify surface water everywherewith AW only.
SCI. MAR., 70(3), September, 2006, 453-503. ISSN: 0214-8358
SURFACE CIRCULATION IN THE EASTERN MEDITERRANEAN • 469

The channel of Sicily
The channel of Sicily is logically the first regionto deal with for AW circulation in the eastern basin.However the visual analysis is most difficult there(see below), and therefore readers that are inexperi-enced in analysing thermal patterns might want totemporarily skip this sub-section. Indeed, complexand shallow bathymetry (continental shelves,banks, islands) within and southwards from thechannel generates mesoscale turbulence thatincreases the AW “self-mixing” and tends todecrease the AW SST there. The frequent occur-rence of several-day episodes of strong northwest-erly winds, especially in winter, suddenly inducesintense mixing within a strip through the channelsof Sardinia and Sicily. Overall, SST values arelower near Sicily than near Tunisia due to the slopeof the interface between the AW inflow and the
LIW (Levantine Intermediate Water) outflow, andto the upwelling induced by the dominant north-westerly winds. Out of the channel, the extremelyshallow bathymetry around the Kerkennah andDjerba Islands (~34°N-11°E) leads to the largest(resp. lowest) SST values encountered in the wholesea in summer (resp. winter, except in the northernAdriatic and Aegean). Finally, the southward open-ing of the channel of Sicily allows AW to flowsouth and to rapidly warm up all year long. To over-come these specific difficulties, we focus on theannual cycle and analyse monthly composites (for1998, Fig. 4). In January, there is a clear splitting ofthe AW flow exiting the channel of Sardinia into abranch that continues alongslope around theTyrrhenian and a second main branch that pene-trates through the channel of Sicily. This splittingcan be seen during the other months as well, exceptduring summertime, within the strip mentioned
SCI. MAR., 70(3), September 2006, 457-503. ISSN: 0214-8358
470 • N. HAMAD et al.
FIG. 4. – The channel of Sicily from January to December 1998. N.B.: In all images the temperature increases from blue (clouds in white) to red.

above, when the northwesterly winds mix AW. It isthus expected to occur all year long. Within thechannel, AW first flows close to Tunisia. Then thecontinental shelf widens near 35-36°N (Fig. 1a), sothat part of the flow tends to follow the coastlinewhile another part tends to follow the shelf edgeand spread in the middle of the channel. Althoughthis is not very clear from Figure 4, a significantamount of AW continues following the (curved)shelf edge and thus hits the African coastline near12-13°E. Images such as the one in Figure 4k sug-gest that some AW can then flow clockwise over theTunisian (and partly Libyan) continental shelf.
The Ionian from 1994 to 2001 and from May1997 to December 1999
Due to the complex bathymetry and processesoccurring in the channel of Sicily, AW enters theIonian over its whole southern part so that the surfacecirculation there is a priori relatively complex. Inaddition, the overall counterclockwise circulationexpected from basic considerations should close there(see Fig. 1a). Moreover, as the Ionian has a largemeridian extension and characteristic forcings andfeatures, it varies markedly from north to south.Given the complexity of the phenomena, as well asthe long lifetimes and the large drifts of mesoscale
eddies, we first describe the whole subbasin during adecadal period and then detail mesoscale featuresduring a few consecutive years.
The whole subbasin from 1994 to 2001 (Fig. 5)
The January composites show a branch spreadingin the northern half of the subbasin from 1994 to 1997that is weaker in 1998 and absent from 1999 to 2001.Full-resolution monthly composites available fromMarch 1993 and low-resolution composites from pre-vious years (see Fig. 22) show that this branch hasbeen present from the late eighties (at least) toJanuary-February 1998. Although it could be partlyassociated with the alleged “AIS”, its signature doesnot resemble that of a meander involving most of theAW flow or at least re-joining another branch furthereast. Figure 5 suggests that this AW branch progressednorth-northeastwards before spreading in a diffusivemanner. This branch generated relatively large anticy-clonic features in 1996 as well as mesoscale eddiessuch as F, G and H from May 1997 (see detailed track-ing in Figs. 6 to 8). Southeast of Greece, the Pelopswind-induced eddy displays a marked interannualvariability with, for instance, the occurrence of 2eddies in January 1997, high intensity in January 1998and a weak signature in January 1999 (but still detect-ed in December 1998, see Fig. 8j).
SCI. MAR., 70(3), September, 2006, 453-503. ISSN: 0214-8358
SURFACE CIRCULATION IN THE EASTERN MEDITERRANEAN • 471
FIG. 5. – The Ionian in January from 1994 to 2001.
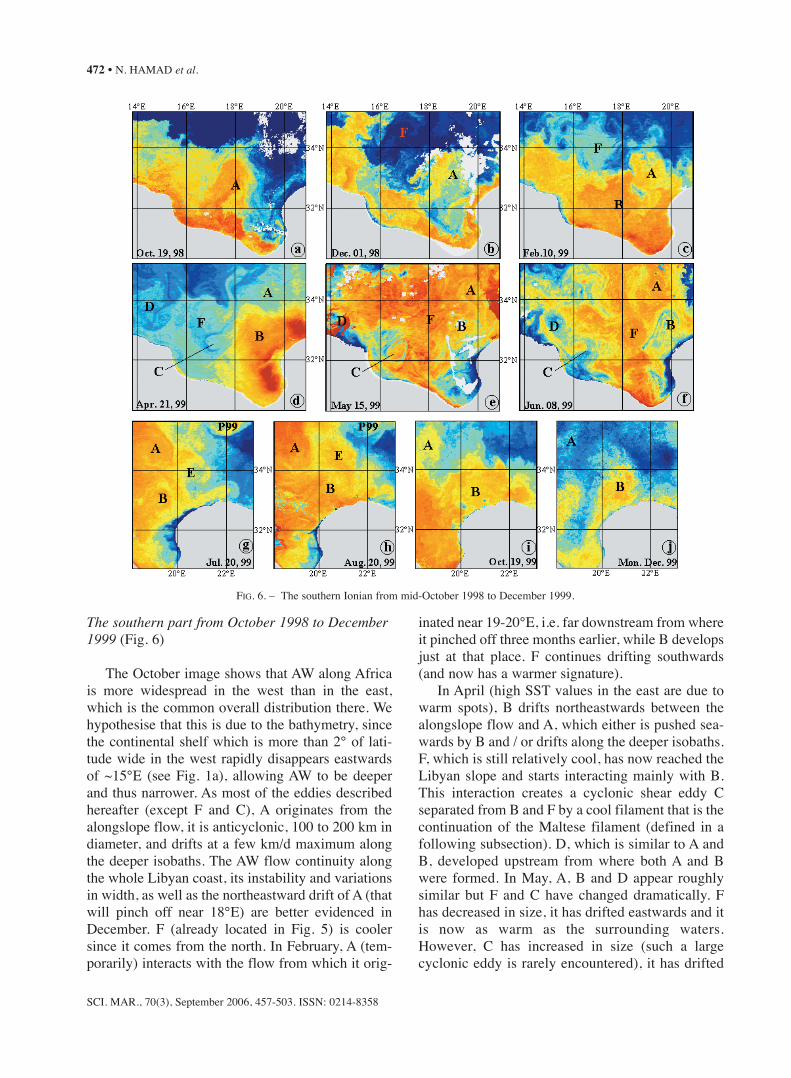
The southern part from October 1998 to December1999 (Fig. 6)
The October image shows that AW along Africais more widespread in the west than in the east,which is the common overall distribution there. Wehypothesise that this is due to the bathymetry, sincethe continental shelf which is more than 2° of lati-tude wide in the west rapidly disappears eastwardsof ~15°E (see Fig. 1a), allowing AW to be deeperand thus narrower. As most of the eddies describedhereafter (except F and C), A originates from thealongslope flow, it is anticyclonic, 100 to 200 km indiameter, and drifts at a few km/d maximum alongthe deeper isobaths. The AW flow continuity alongthe whole Libyan coast, its instability and variationsin width, as well as the northeastward drift of A (thatwill pinch off near 18°E) are better evidenced inDecember. F (already located in Fig. 5) is coolersince it comes from the north. In February, A (tem-porarily) interacts with the flow from which it orig-
inated near 19-20°E, i.e. far downstream from whereit pinched off three months earlier, while B developsjust at that place. F continues drifting southwards(and now has a warmer signature).
In April (high SST values in the east are due towarm spots), B drifts northeastwards between thealongslope flow and A, which either is pushed sea-wards by B and / or drifts along the deeper isobaths.F, which is still relatively cool, has now reached theLibyan slope and starts interacting mainly with B.This interaction creates a cyclonic shear eddy Cseparated from B and F by a cool filament that is thecontinuation of the Maltese filament (defined in afollowing subsection). D, which is similar to A andB, developed upstream from where both A and Bwere formed. In May, A, B and D appear roughlysimilar but F and C have changed dramatically. Fhas decreased in size, it has drifted eastwards and itis now as warm as the surrounding waters.However, C has increased in size (such a largecyclonic eddy is rarely encountered), it has drifted
SCI. MAR., 70(3), September 2006, 457-503. ISSN: 0214-8358
472 • N. HAMAD et al.
FIG. 6. – The southern Ionian from mid-October 1998 to December 1999.

southwestwards and thus strongly interacts with thealongslope flow in a large portion of the coastalzone. In early June, B which is now relatively coolis found between the alongslope flow and A. D hasslightly propagated downstream, F has continuedeastwards, and C is mainly unchanged. Although C
will disappear in late June, its 2.5-month lifetimerepresents a kind of a maximum for a cycloniceddy. F will also be lost by late June but D will berecognised with the same location, shape and sizeduring more than 6 months before being lost in win-ter (not shown).
SCI. MAR., 70(3), September, 2006, 453-503. ISSN: 0214-8358
SURFACE CIRCULATION IN THE EASTERN MEDITERRANEAN • 473
FIG. 7. – The northern Ionian from late May 1997 to March 1998.

The July-December images of the Cyrenaïca zone(part of Libya centred near 32°N-22°E) show the gen-eral circulation of warm AW alongslope, the slow (afew km/d) downstream propagation of B as well asthe westward drift and decay of A. It also shows E(created in April out of the Fig. 6a-f frame), its sea-ward drift and decay (mainly due to the fact that E fedP99, not shown). B will cross the zone (near 20°E)which is seemingly favourable for pinching-off (e.g.A and E), and will be lost downstream in the follow-ing months (not shown). The coastal upwellings oftenencountered west of Cyrenaïca (Fig. 6e-j) displaysmall-scale variability that allows their downstreampropagation to be evaluated to a few km/d.
The northern part from May 1997 to March 1998(Fig. 7)
The daily image in Figure 7a evidences in detailsall features tracked hereafter. In summer, the majorfeature at subbasin scale is the upwelling induced bythe Etesians off the northeastern coasts. An alongs-lope counterclockwise circulation appears there assoon as the Etesians stop, i.e. in September, whichlasts during the whole winter. Its penetration fromthe Ionian into the Adriatic and its splitting beforethe Otranto strait (south of the sub-basin) are evi-denced during all of autumn and winter.
In late May, P’ and P’’ in the east as well as F (thelate stages of which were analysed in the previoussubsection) and G in the west are similar to theeddies shown by Le Vourch et al. (1992) in June andSeptember 1985 resp. (numbered 3 and 7 resp.). P’and P’’ are probably induced by the Etesians while Fand G originate from the branch discussed in thesubsection dealing with the whole Ionian. In-between, the origin of H and of the eddy south of Fand H (not labelled since it will move southwardssoon and be out of the image frames) cannot bespecified. All eddies can still be recognised in July.In August, P’ and P’’ begin to merge while F and Ginteract but do not change significantly. InSeptember P’ and P’’ have completely merged, H isdrifting northeastwards and F and G are still inter-acting. In mid-October and in November, warmwater accumulates roughly where P’ and P’’ wereand in the Pelops area, so that we have named thisfeature P97. H is still individualised while F and Gare still interacting. In December and January, P97 iswarmer than the surroundings and definitely signs acoherent structure. H does not drift significantly,
while F and G begin separating. All these featuresare increasingly marked in February and March.
The central part from April 1998 to December1998 (Fig. 8)
In mid-April and May, P97 drifts westwards, Hdrifts northwards and G decays. F, described in itsearlier and later stages in the two previous subsec-tions, is stationary. J and K develop along the west-ern Libyan slope. In late June to early July, F startsdrifting southwards, P97 and H continue driftingwestwards and northwards resp., and J and K merge(noted K+J) while L is growing upstream. In lateJuly, P97 is between F, which continues driftingsouthwards, and P98, which starts growing.Although the signature of F in early September iscomplex, that of P98 is clear. P97 is north of the seg-ment joining F and P98 while K+J and L are stillpropagating downstream at a few km/d.
The cool filament that crosses most of the sub-basin in Figure 8f (see also Fig. 6d) and can berecognised on all preceding images originating fromthe southern tip of Sicily deserves a specific com-ment. The cool Sicilian coastal waters are entrainedroughly southeastwards by the AW inflow, and pos-sibly by the overall alongslope counterclockwisecirculation in the Ionian (Fig. 1a). This filament,classically named the “Maltese Front”, was studiedin detail by Champagne-Philippe et al. (1982) andstatistically analysed by Le Vourch et al. (1992). Itseparates recent AW in the south that continuouslyflows in (as described by Figs. 3, 4, 5) from resident/ older AW in the north. Since SST values can besimilar in both parts of it, it cannot be considered asa classical front and we propose naming it theMaltese filament. Whatever, this feature is associat-ed with cool water entrained around the various anti-cyclonic eddies, through a paddle-wheel effect, andit has no relation with any kind of “AIS”.
In early October, F and P97 are still well identi-fied and P98 is as coherent as was P97 one year ago.A (see Fig. 6), which first appears in this series inFigures 8e-f, has now drifted northwards andentrains the Maltese filament. Figure 8h in lateOctober does not allow F, P97 or P98 to be evidencedeasily due to clouds, but shows that inflowing watersin the south can be separated by a well-marked frontfrom cooler waters resident in the north. Hence, insitu data collected only in the northern part of thesubbasin (thus sampling only the northern part of a
SCI. MAR., 70(3), September 2006, 457-503. ISSN: 0214-8358
474 • N. HAMAD et al.

turbulent inflow) and analysed without any helpfrom space will erroneously suggest the occurrenceof an “AIS” crossing the subbasin.
The November and December images first certi-fy that F, P97 and P98 are still coherent structures.Incidentally, they show that two wind-inducededdies (P97 and P98), generated in the same place
according to the same seasonal process, can co-existone year and a few 100 km apart. They also showthat F, which was north of the Maltese filamentbefore early September and south of it in earlyDecember, has “crossed” it. Therefore, this filamentdoes not have any proper dynamics but just evi-dences waters entrained from a specific place across
SCI. MAR., 70(3), September, 2006, 453-503. ISSN: 0214-8358
SURFACE CIRCULATION IN THE EASTERN MEDITERRANEAN • 475
FIG. 8. – The central Ionian from mid-April to early December 1998.

the subbasin. Along the Libyan slope, K+J is out ofthe frame, while L has increased and is still propa-gating downstream.
Many eddies are found and seemingly growwhere F was in October 1998, which is just east ofthe Sicilian-Maltese plateau and roughly where theoverall counterclockwise alongslope circulation isexpected to close (Fig. 1a). Whatever the reasons thatmake this area an essential place, eddies formed hereor passing by can then drift in various directions.Indeed, while F propagated southward, three eddieswere shown to drift in series southeastwards (i.e.towards Cyrenaïca), one of which was tracked fromMay 1996 to at least December 1997 (not shown).
The Adriatic from May 1998 to April 1999
Since the dense water formation process domi-nates the regime here, we focus on the seasonal vari-
ability and show a yearly series of monthly compos-ites (Fig. 9). There is no evidence of a clear circula-tion pattern in spring except the cool southward flowalong the Italian coastline and the local warming ofthe Po outflow. In summer, the SST field is dis-turbed by upwellings induced by the Etesians in thenorthern Ionian and in the Adriatic itself. However,from September until spring, a marked inflowoccurred during the 1998-1999 winter that is similarto the one mentioned for the 1997-1998 winter (Fig.7). A counterclockwise gyre starts forming in thesouthern Adriatic in summer and develops inautumn. Its signature intensifies in winter and it isclosely linked to the inflow. A second gyre occurs inthe central Adriatic, from late summer to autumnand winter. No large mesoscale eddies develop there(although they cannot due to the narrowness of thesubbasin, we suggest that this is more likely due todynamical reasons).
SCI. MAR., 70(3), September 2006, 457-503. ISSN: 0214-8358
476 • N. HAMAD et al.
FIG. 9. – The Adriatic from May 1998 to April 1999.

The southern Cretan and the southwesternLevantine from 1996 to 1999
Next we describe features not reported up to nowsuch as: the large southward drift of Ierapetra (I96);the merging of two generations of Ierapetra’s
(I96+I97) and their drift; the persistence and station-arity of I98 and I00 as the reason for the strength ofI99 and I01 resp.; the co-existence of I98/9 and I00/1; the downstream propagation of the Libyaneddies; the merging of two eddies generated by theAW flow.
SCI. MAR., 70(3), September, 2006, 453-503. ISSN: 0214-8358
SURFACE CIRCULATION IN THE EASTERN MEDITERRANEAN • 477
Fig. 10. – The southern Cretan and the western Levantine from early August 1996 to mid-June 1997.

The drift of I96 (Fig. 10)
In early August, I96 is fed from the south by acomplex zone of relatively warm swirls. By lateSeptember, I96 has moved southeastwards while Mis drifting northwards west of it. From early to mid-October, I96 continues drifting, M drifts around ittowards Crete, and N grows in the north. From lateOctober to January, I96 drifts further southwest-wards while M and N still surround it before N dis-appears. From February to April, I96 stops driftingsouthwards. M represents water that mainly origi-nated from the south and is present in spring whereIerapetra forms. In June, I97 begins forming,entraining not only old AW (associated with M) butalso more recent AW, through a paddle-wheel inter-action with I96 still evident alongslope, about 2° oflatitude to the southwest.
The merging of I96 and I97 (Fig. 11)
One month later (Fig. 11a), I96 is still south ofI97, ~100 km apart. O and Y were formed by insta-bility of the flow along the eastern Libyan sloperoughly where Y is, in October 1996 for O and inMay 1997 for Y respectively. Note that O and I96are similarly signed (by warm water from alongs-lope and cooler water from offshore), although dif-ferent processes formed them. However, O and Yhave a markedly different signature while they havethe same origin. In August, I96 drifts northeastwardswhile I97 is stationary. Both I96 and I97 begin inter-acting in September and they have completelymerged by October. They are recognised from nowuntil February 1998 as a single structure namedI96+97. O and Y, which remained stationary untilOctober, start propagating slowly eastwards inNovember. Note that O and I96+97 are close togeth-er in February 1998 and are similarly signed.Meanwhile, Y has markedly decreased in size, it haspinched off from the alongslope flow and it beginsdrifting seawards around O.
The drift of the merged I96+97 towards the western Levantine (Fig. 12)
One month later (March 1998), Y continuesdrifting around O. In late April, Q has developedjust downstream from O (still flanked by Y on itsseaward side) that has drifted westwards. A com-plex zone R appears in the east. In June, I96+97
drifts southeastwards and is aligned with O (thathas continued drifting westwards) and Q; warmwater accumulates north of Q and I96+97, depict-ing an anticyclonic signature; downstream fromI96+97, two eddies can be identified in zone R (theeasternmost one named U’ later in the text). Inearly July, the major evolutions are the diameterincrease of Q, the quasi stationarity of O, theI96+97 location close to the coast, and the smalleddies north of Q and I96+97. By mid-August, O isstill driftless, Q is squeezed between I96+97 andO, and I98 appears close to Crete. In late August-early September, O and I98 display similar signa-tures while Q and I96+97 are elongated northeast-wards. In early October, O becomes less organised,Q (that drifted westwards) feeds I98, I96+97 isnow just upstream from R. In early November, O isno longer identified. It might have decayed, maybedue to its interaction with K+J approachingupstream (see Fig. 8), and be entrained seawardsaround Q (that has continued drifting westwards).Q is still well defined and continues feeding I98. Inthe southwestern Levantine, I96+97 has startedinteracting with R to form a huge (~200 km) anti-cyclonic feature. In late November, the remainderof O is in-between Q and I98, and the southwesternLevantine is still occupied by the feature thatissued from I96+97 and R. Finally (in January), Qis flanked in the northwest by K+J that has propa-gated downstream and has been deflected around it(in the same way as O did with Y at the beginningof the Fig. 11 time series).
The formation and co-existence of I98/9 and I00/1(Fig. 13)
Contrary to I96 and I97 that drifted southwardsbefore merging, I98 (which displays a usual signa-ture in autumn 1998) did not drift from winter tospring 1999. Moreover, it was still well developed inMay-June 1999, i.e. before the Etesians onset. TheAugust image shows that Ierapetra is fed with waterthat originated from both the south (the alongslopeflow off eastern Libya and western Egypt and itsassociated mesoscale eddies) and the northeast (theso-called “AMC”). Thus the Etesians forced analready existing eddy, and I99 is logically namedI98/9 (at least from October 1999), since its genera-tion differs from that of I96+97. Its signatureremained intense throughout the winter 1999-2000.In early spring, I98/9 starts drifting westwards, and
SCI. MAR., 70(3), September 2006, 457-503. ISSN: 0214-8358
478 • N. HAMAD et al.

is located near mid-Crete when I00 starts growing inearly summer 2000. Both are well identified closetogether and do not drift markedly until late spring2001. Hence, I00 is located near the Ierapetra for-mation area in summer 2001 so that, like I98/9, itwill evolve into I00/1. Both I98/9 and I00/1 areclearly identified until the end of autumn 2001.
Eddies merging in the southwestern Levantine (Fig. 14)
The warm feature associated with I96+97 and R inlate February 1999 (Fig. 14a) is similar to that inJanuary (Fig. 12j). Nevertheless, images in-betweenare not clear enough to ascertain whether I96+97 has
SCI. MAR., 70(3), September, 2006, 453-503. ISSN: 0214-8358
SURFACE CIRCULATION IN THE EASTERN MEDITERRANEAN • 479
FIG. 11. – The southeastern Ionian and the southern Cretan from July 1997 to February 1998.

persisted. This feature is thus objectively noted I’.While nothing has markedly changed in the southernCretan, a new feature (S) has grown seawards from I’and R. In April, thermal gradients are weak butimages (not shown) allow Q, I98, I’, R and S, as wellas a new eddy-like feature T to be identified. By mid-May, the situation has changed, except for Q and I98,
since I’ extends seawards and interacts with S. Thesignatures of R and T are difficult to individualise inthis image, but their tracking (with images not shown)indicates that R has disappeared, while T maintains itsposition. In late June I’ continues its seawards drift. Inlate August 1999, I’ decays and its remainder appearsin-between I98, Q, T and S; U is formed alongslope,
SCI. MAR., 70(3), September 2006, 457-503. ISSN: 0214-8358
480 • N. HAMAD et al.
FIG. 12. – The southern Cretan and the western Levantine from March 1998 to January 1999.

downstream from T. I98 is fed both from the south-east by what remains of I’ and from the northeast bythe “AMC” continuation (see also Aug. 99 in Fig. 13).By early September T and S interact (warm water ini-tially entrained by T is now entrained by S). Ten dayslater (Fig. 14g), the warm water is distributed over
both eddies and separating them becomes harder inOctober (Fig. 14h-j; called MM in the XBT section inFigure 3a of Zervakis et al., 2002). All images avail-able in November and December show that T and Shave merged into T+S. Meanwhile, I98 has evolvedinto I98/9 and has a huge signature (see previous sub-
SCI. MAR., 70(3), September, 2006, 453-503. ISSN: 0214-8358
SURFACE CIRCULATION IN THE EASTERN MEDITERRANEAN • 481
FIG. 13. – Ierapetra from October 1998 to December 2001.

section), Q has decreased, and U or a new coastaleddy grows and propagates downstream. From atleast October the images display the continuous sig-nature of the general circulation alongslope. The XBTsections in Figure 3b,c of Zervakis et al. (2002)crossed both T+S and I98/9.
The southeastern Levantine in 1996, 1998 and1999
It is relatively difficult to study the area of anti-cyclonic activity of Shikmona. Firstly because dur-ing summertime a warm surface layer develops that
SCI. MAR., 70(3), September 2006, 457-503. ISSN: 0214-8358
482 • N. HAMAD et al.
FIG. 13 (Cont.). – Ierapetra from October 1998 to December 2001.

often covers the mesoscale features’ thermal signa-tures. Secondly because mesoscale eddies therehave small dimensions and change rapidly in bothform and position, and thirdly because many insta-bility processes affect the general alongslope flowand feed the offshore zone. Situations can be
described, nevertheless, and those of summer-autumn 1998, 1996 and 1999 are detailed.
In summer 1998, Figure 15 evidences threeeddies named U’ (originated from an alongslopeflow instability in the southwestern Levantine, Fig.12c), U” (suspected to have an origin similar to that
SCI. MAR., 70(3), September, 2006, 453-503. ISSN: 0214-8358
SURFACE CIRCULATION IN THE EASTERN MEDITERRANEAN • 483
FIG. 13 (Cont.). – Ierapetra from October 1998 to December 2001.

of U’) and V (that might be of different origin). U’propagates northeastwards and progressively leavesthe coast while U” and V drift more slowly towardsnorth and east-southeast respectively. Several small-er scale features (noted with lower-case letters), thatoriginated from the instability of the alongslopeflow, are then entrained by the larger eddies. As aresult of these interactions the signatures of the lat-
ter are highly variable: for instance V mainlyentrains water from the east in August andNovember, and from the south in late September. InJuly U’ is clearly embedded in the alongslope flow,it grows and slowly moves northeastwards, so thatby November it has pinched off and becomes a partof the Shikmona anticyclonic activity system. InFigure 15l the circulation appears clearly, with a
SCI. MAR., 70(3), September 2006, 457-503. ISSN: 0214-8358
484 • N. HAMAD et al.
FIG. 14. – The southern Cretan and the southwestern Levantine from late February to December 1999.

flow alongslope in the south that propagates east-ward (see the propagation and deformation due toinstability of the cooler signature of its outer edge,especially from 15a to 15d, and from 15g to 15j) andits continuation alongslope northwards althoughlocally and temporarily disturbed by V: in Figure 15lthe entrainment around 33°N due to V signs a south-ward (mesoscale) current.
The summer 1996 situation (Fig. 16a-d) differsin that it shows only one large eddy offshore (locat-ed slightly north of where V was in Fig. 15), inter-
acting with other anticyclonic eddy-like structuresthat originated alongslope. By autumn 1996 the gen-eral circulation appears to be organised in the sameway as it was described in late 1998. The instabilityof the southern alongslope flow is also well signedby the deformation of the cooler signature of itsouter edge (Fig. 16a-d).
Similar features are encountered in summer 1999(Fig. 16g-l), although if V were a permanent eddy, itwould now be located more to the south. Thealongslope northward current is evident from the
SCI. MAR., 70(3), September, 2006, 453-503. ISSN: 0214-8358
SURFACE CIRCULATION IN THE EASTERN MEDITERRANEAN • 485
FIG. 15. – The southeastern Levantine from mid-July to mid-November 1998.

propagation of the warm filament-like feature locat-ed near 32°N-34°E (Fig. 16g-j).
The northern Levantine from 1996 to 1999
The series in Figure17 shows, in addition to thosein Figures 15 and 16, the continuity of the overallalongslope flow off the Middle East and Turkey. It israre to observe the AW bypassing Cyprus northwardswest of it, and if it does the alongslope circulation co-exists. The small (30-60 km) eddies W1 and W2
propagate downstream at 0-3 km/d off MiddleEastern coasts and rapidly evolve (X1 and X2 aredescribed below). The major aim of this series is toprovide a different analysis of the features previous-ly named “Rhodes gyre”, “West Cyprus gyre” and“Latakia eddy” (see Fig. 1d). Indeed, a cyclonic eddy(or gyre) is, from a hydrological point of view, essen-tially a doming structure that can easily be confusedwith a zone of dense water, possibly at rest, sur-rounded by a flow of lighter water. In the case of the“Latakia eddy”, surrounding is partly due to
SCI. MAR., 70(3), September 2006, 457-503. ISSN: 0214-8358
486 • N. HAMAD et al.
FIG. 16. – The southeastern Levantine from early August to early November 1996 (a-f); from mid-August to late September 1999 (g-l).

“Shikmona” and partly due to the angle of the coast-line. For the “Rhodes and West Cyprus gyres”, sur-rounding by the general circulation is always clear inthe north but much more variable elsewhere (the ori-gin of N is shown in Fig. 10).
From June to August 1996 (Fig. 18a-c), X1 is sta-tionary off Turkey and seemingly blocks the“AMC”, since part of the latter flows alongslopeshoreward from X1 while warm water accumulatesupstream at the gulf of Antalya entrance as a huge“AMC” meander. In September-October the“AMC” flows around X1 and the meander continuesgrowing upstream. Finally, the two seaward exten-sions of the “AMC” join and isolate a patch of coolwater in the middle of the gulf that is not a closedcyclonic eddy. From November 1996 to February1997, X1 has progressed shoreward and is now fullyembedded in the “AMC”, while the meanderupstream of X1 is now organised as another eddyX2, which looks like X1 (characteristic diametersand propagation speeds are ~100 km and 0-3 km/d).However, contrary to X1, which will remain station-ary until February 1997 (i.e. at least 8 months total),X2 propagates downstream until February, when itinteracts with X1. Then, X1 begins propagatingdownstream and X2 drifts seaward, and both areseen in March and April. X1 and X2 signatures arelost by May (the signatures are not convincingenough to be tracked).
Figure 19a displays an unusual signature (itseastern (resp. western) side suggests an anticyclonic(resp. cyclonic) motion) at the place where the sig-nature of X2 was lost. This might be due to themonthly composition, although it resembles the sig-
nature encountered from September to November1996 (partly due to X1 at that time). In addition, ananticyclonic eddy appears downstream close towhere X1 was lost. Both new structures are clearlyidentified as anticyclones in September. They arenamed X3 and X4, since the continuity with X1 andX2 resp. could not be established. Note that X3 tem-porarily prevents most of the current flowingbetween Rhodes and the continent and even entrainswater from the Aegean (possibly expelled by theEtesians) into the Levantine (Fig. 19b). FromOctober 1997 to January 1998, X3 propagatesdownstream south of Rhodes, while X4 developsand seems ready to pinch off. Both eddies are thenlost in late winter-spring. In August 1998, a new(possible continuity with X4 could not be estab-lished) eddy X5 similar to X1 develops, showingsimilar interactions with the general flow. However,it soon propagates downstream as far as Rhodeswhere it is lost in January 1999.
The Aegean and northern Cretan
The Aegean
Most of the variability is seasonal, and the over-all SST distribution is mainly governed by theEtesians (well known). We thus analyse monthlycomposites for a year (1998, Fig. 20).
No overall circulation features appear in May,while the upwelling induced eastward by theEtesians and the associated accumulation of warmerwater off Greece appear clearly in June. From Julyto November, the east-west SST gradient decreases
SCI. MAR., 70(3), September, 2006, 453-503. ISSN: 0214-8358
SURFACE CIRCULATION IN THE EASTERN MEDITERRANEAN • 487
FIG. 17. – The northern Levantine from mid-November 1996 to mid-December 1996.

SCI. MAR., 70(3), September 2006, 457-503. ISSN: 0214-8358
488 • N. HAMAD et al.
FIG. 18. – The northern Levantine from late June 1996 to May 1997.

SCI. MAR., 70(3), September, 2006, 453-503. ISSN: 0214-8358
SURFACE CIRCULATION IN THE EASTERN MEDITERRANEAN • 489
FIG. 19. – The northern Levantine from August 1997 to January 1999.

since most of the warmer water is progressivelyentrained partly out of the Aegean and partly alongCrete, and also since in early summer the intensifi-cation of the Etesians extends mixing. Since windmixing and drift are reduced by the orography, thecoolest waters are observed in the Aegean centralpart in-between the islands. Warmer waters offTurkey could reveal some northward spreading ofthe “AMC”, but most of it is confined in the north-ern Levantine and the northern Cretan. FromDecember to April, the “AMC” penetrates into theAegean off Turkey and in the northern Cretan whilecool waters propagate southwards off Greece.
The northern Cretan
The general situation in the August 1999 com-posite (Fig. 21a) is similar to that in the July-August1998 ones (Fig. 20). Figure 21a evidences a 100-kmanticyclonic eddy Z1 that propagates eastwards at~1 km/d. In late November another eddy Z2 is cre-ated, and both Z1 and Z2 propagate eastwards untilFebruary. The signature of Z1 is lost in March after
8 months but, from May to September and maybeNovember, it or another eddy (noted Z3) is detectedwhere Z1 was lost. In December 2000 Z3 can nolonger be tracked, but Z2 is still there, roughly at theplace it occupied in February 2000 and even inDecember 1999, i.e. one year before. Cycloniceddies of smaller scales and much shorter lifetimes(a few weeks) can be encountered episodically alongthe eastern Cretan slope.
DISCUSSION
The circulation features we have inferred fromthe analysis of satellite imagery differ less fromthe historical schemata than from the recent(POEM-type) ones. The major question is: doesAW meander across the central parts of the basin,or does it flow counterclockwise at basin scale,and more precisely alongslope? The POEM in situdata sets did not cover the southernmost part of thebasin (see Fig. 2); nevertheless the derivedschemata discarded the possibility of an eastward
SCI. MAR., 70(3), September 2006, 457-503. ISSN: 0214-8358
490 • N. HAMAD et al.
FIG. 20. – The Aegean from May 1998 to April 1999.

AW flow off Africa. However, Millot (1992) fos-tered Nielsen’s basic considerations about theeffect of the earth’s rotation, and also promoted acounterclockwise circulation at basin-scale in theeastern basin. The AW flow at basin scale is dis-cussed in the next subsection.
Currently, interpretations of the same POEMdata sets differ: they hold the features named“Mersa-Matruh” and “Shikmona” either as perma-nent, recurrent and/or transient, when our analysis(also coherent with the POEM observations, see Fig.2) always shows the presence of different eddies in
SCI. MAR., 70(3), September, 2006, 453-503. ISSN: 0214-8358
SURFACE CIRCULATION IN THE EASTERN MEDITERRANEAN • 491
FIG. 21. – The northern Cretan from August 1999 to December 2000.

these areas. Then the underlying question is: howwell have the mesoscale processes and variabilitybeen described and understood? The preliminaryanalysis of IR images by Le Vourch et al. (1992)showed that the AW flow is markedly unstable.Millot (1992) emphasised similarities with the west-ern basin, with mesoscale meanders characterising
the flow in the north and large meanders evolvinginto eddies characterising the flow in the south. ThePOEM in situ data were collected every ~ halfdegree, and such a large sampling interval preventsmesoscale features being described correctly. In thesame way one survey per year does not yields rele-vant information about the temporal evolution of the
SCI. MAR., 70(3), September 2006, 457-503. ISSN: 0214-8358
492 • N. HAMAD et al.
FIG. 22. – The eastern basin of the Mediterranean Sea in December from 1985 to 1996.

mesoscale features. We compare our results with theother available analyses region by region in the restof subsections.
The whole basin
Figure 22 shows the monthly composites forNovember available from 1985 to 1996 (to cover, inparticular, all POEM experiments). Note that all othermonths display similar overall features except, obvi-ously, those linked to seasonal variability. Althoughthe interannual variability cannot be neglected, theoverall features we have inferred in the results sectioncan be evidenced. One is the intensity of themesoscale activity (eddies) in the southern part, andthe activity, to a lesser extent (meanders), in the north.But most importantly, the warmest (lightest) AW isseen alongslope, and it clearly flows counterclock-wise around the basin. There is no evidence of anycross-basin flow or jet, all the more since the warmerAW signature is continuous from Libya to at least theentrance of the Aegean. Therefore, it is Nielsen’sschema that, up to now, best represents the large-scalefeatures of the AW circulation.
The channel of Sicily
The AW flow splitting at the entrance of thechannel of Sicily is better represented by the schemaof Nielsen than by the schemata of Ovchinnikov andof Lacombe and Tchernia, since most of the inflowseems to be constrained along the Tunisian sloperather than spreading across the whole channel. Atleast concerning the splitting, our analysis is consis-tent with the numerical results of Molcard et al.(2002) and shows that it mainly occurs north ofTunisia, just at the channel entrance.
Within the channel, the intense upwelling offSicily prevents checking the most recent circulationdiagram of Robinson et al. (1999) there, which indi-cates a major inflow meandering off Sicily anddescribes a series of “semi-permanent features” suchas vortices and crests. This diagram differs from theones by Robinson and Golnaraghi (1993, Fig. 1e)and by Malanotte-Rizzoli et al. (1997, Fig. 3a) sinceAW, although still meandering, is represented flow-ing close to Sicily and north of Malta. In 1994 and1995, Robinson et al. (1999) launched drifters southof Sicily that were entrained northwards alongslopein the Ionian by the branch previously discussed(thus further supporting the consistency between our
image analysis and in situ observations). However,although one drifter launched in the central part ofthe channel joined the drifters discussed above, sev-eral others drifted southwards off Tunisia. Their tra-jectories further east are unfortunately not shown,probably since this was not the focus of the paper. Inany case, care must be taken when attempting to linkfluxes to drifter trajectory statistics, since it wouldrequire deploying the drifters homogeneously acrossthe flow. In other words, the southward flow wouldprobably have been investigated too if more driftershad been launched closer to Tunisia.
In any case, the images suggest that AW is con-fined mainly along Tunisia within the channel itselfwhile, just south of the channel, most of the flowprogresses in its central part. This could seem incon-sistent with basic considerations about the Corioliseffect that should constrain any flow along the con-tinental slope. However, it has been demonstratedthat where the shelf is wide (e.g. the Gulf of Lionsin the western basin), the general circulation followsthe slope (depths >100-200 m) more than the coast-line (Millot, 1999), because it has a significantthickness. The alongslope circulation around theTunisian continental shelf is well evidenced in thenumerical results of Pierini and Rubino (2001). It isthus clear that, although one (upper) part of AW con-tinues flowing along the coastline over the Tunisianshelf, the slope guides another part. Both “branches”are due to the Coriolis effect at different depths but,from a kinematic point of view, it might be that thebranch on the shelf rapidly slackens due to the bot-tom stress while the branch along the slope is stillintense (as in the Gulf of Lions). For more detailssee Béranger et al. (2004). Far south from the chan-nel, where the Tunisian shelf rapidly reduces (near12-13°E), the main branch hits the coastline near theTunisia-Libya border and partly veers to its rightbefore penetrating westwards over the shelf. There,the circulation is quite well represented by theschema of Lacombe and Tchernia (the clockwisegyre in Ovchinnikov’s schema is probably too largeand not linked with the bathymetry). However, nei-ther the southward flow along the Tunisian coastlinenor the variability of the circulation over theTunisian shelf have been schematised.
The Ionian
This subbasin is one of the most complicated tostudy with in situ as well as remotely sensed data.
SCI. MAR., 70(3), September, 2006, 453-503. ISSN: 0214-8358
SURFACE CIRCULATION IN THE EASTERN MEDITERRANEAN • 493

Firstly because the AW flow is markedly disturbedby its passage through the channel of Sicily wherebathymetric and meteorological / climatic condi-tions have a large spatial and temporal variability.Secondly, upon exiting this relatively wide channelmainly in its central part, AW flows into a muchwider domain and is thus not very well channelled,so that various complex features can be generated.Finally, the overall counterclockwise circuit closesthere (as conceived by Nielsen, Fig. 1a). We focusfirst on the overall circulation and then on themesoscale phenomena.
The overall circulation
The first point concerns the “AIS” meandering inthe northern part of the Ionian that is said byMalanotte-Rizzoli and Bergamasco (1989, 1991)and Robinson and Golnaraghi (1993) to be a sum-mertime feature and to finally form the “MMJ”. Theseries of images in Figures 5 and 22 shows that anorthward flow off Sicily is an actual feature,although it does not look like a meander. This flowwas documented not only by the POEM 1987, 1991and 1995 hydrological data, but also by drifters’ tra-jectories between 1994 and 1997 (Poulain, 1998;Robinson et al., 1999). According to Pinardi et al.(1997), this meander was established in 1987 by ananomalous wind stress curl that reversed the circula-tion from clockwise to counterclockwise. Satelliteimages (e.g. Fig. 5) show that this feature is not sea-sonal but interannual, was there in the late eighties,and decayed in January-February 1998.Hydrological data indicate that it persisted untilAugust 1998 and confirm that it is an interannualfeature, and Manca et al. (2003) suggest that it wasforced for about one decade by the mean wind stresscurl. In 1999 and 2002, recent AW was only foundin the southern Ionian (Manca et al., 2002). In addi-tion, the imagery shows that more than a meanderthat would continue eastwards, this feature must bethought of as a branch spreading northwards andmore or less decaying there, without any continuity(after G, Fig. 5, 7) with the circulation in the east.From at least spring 1997 to spring 1998 (Fig. 7), Fand G in the branch did not move, which may indi-cate that the branch was decaying. Moreover, fromspring 1998 (Fig. 8), F began drifting southward, i.e.against the direction of the former branch. Thisanalysis is consistent with the drifters’ trajectories ofPoulain (1998). The salinity, temperature and
dynamic height distributions in Figure 18 ofMalanotte-Rizzoli et al. (1997) could also be inter-preted as a dead-end branch, rather than the inferredmeander schematised in Figure 3a.
The imagery also shows the permanence of themain AW flow along the Libyan slope with roughlyconstant characteristics, and its dominance when thebranch spreading northward decayed (see Fig. 22). Italso shows the seasonal variability of the alongslopeflow from the Ionian into the Adriatic, which is actu-ally highest in winter (Artegiani et al., 1997), and itseventual splitting before the channel of Otranto thatcloses the overall counterclockwise circulation,even when a branch spreads northwards from Sicily.
The mesoscale phenomena
All images in the Ionian illustrate the variabilityof the thermal signature of mesoscale eddies in avery complex environment. This signature (which isalso the in situ one!) demonstrates how difficult theinference of a circulation diagram can be withoutany help from satellite imagery. For instance, sam-pling only the edges of a series of anticycloniceddies can lead to misinterpret them as a permanentstream meandering across a subbasin, even if no nettransport is associated with such an eddy-field.
We confirm that Pelops is generated by theEtesians in summer south of the Peloponnese beforedrifting roughly westwards (as indicated by e.g.Matteoda and Glenn, 1996). In addition, we showthat it could be generated over some earlier eddies,we have tracked it (P97) for more than one year andwe have thus shown that two generations of Pelops(e.g. P97 and P98) could co-exist a few 100 kmapart. The Pelops’ counterpart (the “Western Cretangyre”), although basically different and stationary(as previously described), displays the same season-al variability.
We have illustrated, for the first time, the gener-ation, propagation (0-3 km/d) and pinching-off ofmesoscale (50-250 km) eddies off the westernLibyan slope. Interactions with their parent currenthave also been documented.
Finally, we have tracked for about two years ananticyclonic eddy (F) that crossed most of the sub-basin from north to south (while others were trackedcrossing it from northwest to southeast). Initiallyfound just east of Sicily and issuing from the AWbranch discussed above, it first remained stationaryfor ~1 year. Then, it propagated southwards and
SCI. MAR., 70(3), September 2006, 457-503. ISSN: 0214-8358
494 • N. HAMAD et al.

reached the Libyan shelf ~1 year later, stronglyinteracting there with a Libyan anticyclonic eddy ina dramatic, although probably rare, way. Indeed, theinteraction generated a small cyclonic eddy that rap-idly became relatively large and which then strong-ly interacted with the alongslope flow itself. TheMaltese filament can be entrained around anticy-clonic eddies across the whole southern subbasin.
The Adriatic
The schema of Artegiani et al. (1997) reproducesmost of the features evidenced by the imagery butdisagrees with our analysis, since the southern gyreis seen to strengthen in winter. Indeed, the imagesshow a close link between the inflow and the zoneof dense water formation that is not schematised,although this is consistent with what is expected inthis zone and is clearly supported by drifters’ trajec-tories (Poulain, 2001). The available schemata canthus be improved in the Adriatic.
The southern Cretan and the southwesternLevantine
Although we did not focus on the “WesternCretan gyre”, due to the lack of interesting results,we parallel (see previous subsections) the cyclonic-anticyclonic paired eddies found east of the strait ofBonifacio (eddies not named yet) and south of thewest-Cretan straits (Pelops and the “Western Cretangyre”). The main reasons could be a strong oro-graphic effect, relatively narrow straits and theabsence of marked alongslope circulation in bothplaces. We differentiate this from what occurs southof the east-Cretan straits, although the dynamics ofIerapetra is similar to that of Pelops. Indeed, theTurkish orography is less marked than the Cretanone, this set of straits is relatively wide and the gen-eral circulation is intense there (see subsection onthe northern Levantine).
In the western Cretan and northern Bonifaciozones, the wind stress curl entrains (on its left) sur-face water into a counterclockwise rotation andEkman pumping creates a doming structure. Whenthe wind stops, geostrophic adjustment tends togenerate a cyclonic rim current all around the dom-ing that can persist up to one year (Crépon et al.,1989). However, although one drifter started acyclonic loop before being lost southwest of Crete(Matteoda and Glenn, 1996), the Cretan cyclone
seems (at least from space) neither intense nor long-lived. Although this cyclone was rarely sampled (atmesocale at least), it is probably less intense thanthe Bonifacio cyclone clearly evidenced withdrifters (Artale et al., 1994) and seen from spacenearly all year long. When warm waters cover sucha doming structure after a period of calm or non-adequate winds, their signature is lost from spacealthough it can still be detected with in situ data.This seems to occur (from the imagery analysis)more frequently for the Cretan cyclone than for theBonifacio one. It is hypothesised that the differenceof intensity is not due to winds that are stronger andmore frequent in the Bonifacio area, but that theBonifacio cyclone, cornered between Corsica andthe Italian peninsula, is intensified where the over-all counterclockwise circulation along the peninsu-la joins. The Cretan cyclone, as it is far away fromthe overall alongslope circulation along Africa,does not interact with it.
Ierapetra is generated by the Etesians every sum-mer-autumn off southeastern Crete. It is clearly fedsporadically by water coming from the overallalongslope counterclockwise circulation, accordingto several processes. Classically, the wind stress curlthat generates Ierapetra itself and the western Cretancyclone induces in-between them a northward flowtowards Crete that feeds both eddies. According tothe images that show the shadowing effect of Creteon the Etesians up to Africa, it must be consideredthat, whatever the wind stress curl is, waters pushedagainst Africa mainly on both sides of Crete flowback to the north more easily leeward of it. In addi-tion, feeding occurs from the south through a pad-dle-wheel effect via the Libyan anticyclonic eddies.Finally, feeding also occurs from the northeastthrough the “AMC”. Ierapetra can drift (as I96),interact with Ierapetra formed one year later (I97),merge with it (I96+97), drift close to the Africanslope before, upon decaying (I’), feeding the newlyformed Ierapetra (I98). It can also remain stationary.Then, if it survives in spring (as I98 and I00), due tobeing fed by other eddies or even since it is sus-tained by any northerly wind, it will give rise to anunusually large Ierapetra one year later (as I98/9 andI00/1). Finally, since a huge Ierapetra (I98/9) driftedwestwards and remained there in a relatively quietarea (leeward of Crete and away from the more tur-bulent area in the south) while another Ierapetra(I00/1) was growing, two generations of Ierapetrascan be found close together for a while.
SCI. MAR., 70(3), September, 2006, 453-503. ISSN: 0214-8358
SURFACE CIRCULATION IN THE EASTERN MEDITERRANEAN • 495

Large (100-250 km) eddies in the African coastalzone result from instability processes affecting thealongslope circulation off Libya and off westernEgypt. They have similar characteristics so that wename them Libyo-Egyptian eddies. They propagateat most at 3 km/d, and can be tracked for years (upto ~2 at least). They have been observed deflectingseaward eddies approaching from upstream, feedingIerapetra, and modifying the whole alongslope flow.
Whatever their origin (i.e. the Ierapetra area orthe Libyo-Egyptian slope), mesoscale eddies canmerge, making “Mersa-Matruh” an area continuous-ly occupied by slowly propagating and constantlyinteracting anticyclonic eddies. It is worth notingthat T or T+S in late October - November 1999 (Fig.14i-k) was recognised as “Mersa-Matruh” byZervakis et al. (2002), who sampled it with XBTs(thus validating again our interpretation of its signa-ture) and inferred a transport of more than 4 Sv (ref-erence level at 460 m). Large eddies seem to accu-mulate in the Mersa-Matruh area. We thus supposethat, similarly to the Algerian eddies, they undergothe planetary b effect and non-linearities (seeTaupier-Letage and Millot, 1988) and we hypothe-sise that their deep extent somehow traps them in theHerodotus trough (~3,000 m, see Fig. 1a). Thereforewe suggest naming the associated eddy field SLW
(for area of eddy accumulation in the westernLevantine). Instead of a permanent or recurrent“Mersa-Matruh” eddy or gyre we have shown thatthere were several eddies permanently in this area,which explains the numerous discrepancies in the“Mersa-Matruh” status found in the literature.
Finally, none of the images support the occur-rence of a “MMJ” as the warmer signature of AW isquasi-continuous alongslope, and rather patchy(eddy-scale) offshore. Indeed, as stated by Özsoy etal. (1993, p. 1082), “the persistence and continuityof a cross-basin current could not be well definedand the current system cannot be separated from theeddy field that partly defines it”. As an example,when mesoscale eddies are fully resolved andcrossed, there is no structure corresponding to a“MMJ” on hydrological transects (e.g. Figs. 7 and 9of Marullo et al., 2003). Moreover, while none ofthe XBT transects performed during the MFSPPexperiment evidenced a “MMJ”, all of them evi-denced an alongslope eastward circulation off Egypt(Zervakis et al., 2002) that is still called “MMJ” byFusco et al. (2003). It is worth noting that the asso-ciated transport of ~1 Sv is relatively low with
respect to those in the larger mesoscale eddies (sev-eral Sv), but it is consistent with both the inflow atSicily and the amount of AW transformed by densewater formation processes in the whole basin.
The southeastern Levantine
The mesoscale phenomena in the Shikmona areacan hardly be detailed due to their relatively smallscale (mostly 10s of km, up to 100 km) and rapidevolution in shape and position (propagation speedsof 0 to 10 km/d). It might be that the eddy found inthe northeast (named V) is the Cyprus anticycloniceddy previously described, although images do notsupport the 3-year lifetime indicated by Brenner(1993). However, complex anticyclonic activity (asmentioned by Özsoy et al., 1993) is observed year-round making “Shikmona” an area permanently fedfrom the south and the east by the alongslope (coun-terclockwise) flow (note that we did not find anyevidence of the “MMJ” feeding “Shikmona” fromthe northwest, as suggested by the POEM-typeschemata). Therefore, we suggest naming the asso-ciated eddy field SLE (for area of eddy accumulationin the eastern Levantine). As in the case of “Mersa-Matruh”, this explanation allows the controversiesabout the status of “Shikmona” to be settled: sinceeddies permanently accumulate, those observedthere logically have different positions and sizes intime. However, a major difference with SLW is thatthere may be only one large eddy.
The northern Levantine
Although a large anticyclone in SLE can some-times extend far to the north, so that some water cansporadically flow northwards west of Cyprus, theoverall general circulation is clearly alongslope offthe Middle East and Turkey. Contrary to what wasindicated by Robinson et al. (1991), the whole“AMC” does not originate locally from the “CC”but from further upstream (i.e. up to Libya).Sometimes a meander increases at the place whereW1 was observed (Fig. 16b-c), which is interpretedas the “Latakia eddy”. However, we have not seenany eddy detach there, and the northward propaga-tion of the features is most common. Therefore, wedo not identify a specific “Latakia eddy”. In a simi-lar way, the combination of the alongslope flow, andthe presence of a large anticyclone in SLE and offCyprus may lead to interpreting a “West Cyprus
SCI. MAR., 70(3), September 2006, 457-503. ISSN: 0214-8358
496 • N. HAMAD et al.

gyre” where there is in fact mainly cool waterroughly at rest surrounded by the warmer generalcirculation. However, the Etesians, which blowthrough the east-Cretan straits and interact with theorography, can generate a cyclone there that is moreor less similar to the “Western Cretan gyre”,although less intense since the Turkish orography issmoother than the Cretan one. This might be the rea-son why some water from the alongslope circulationcan be entrained seawards in a cyclonic way (seeFig. 17 south from X1), maybe up to SLE. Thisentrainment depends on the wind and seems to besuperficial and limited, and there is no evidence ofany closed permanent gyre there. Such a tenuousborder between the “West Cyprus gyre” and the“Rhodes gyre” has also been described in the west-ern basin between the Ligurian and Provençal sub-basins (Wald, 1985).
The “West Cyprus gyre” and Ierapetra could beconsidered as the paired cyclonic-anticycloniceddies associated with the east-Cretan strait, as wedid for the “Western Cretan gyre” and Pelops (andfor the eddies east of Bonifacio). However, the east-Cretan strait is, when considering northerly winds(i.e. not only the Etesians but also those advectingcold and dry continental air masses in winter), muchlarger than the other straits are. Therefore, betweenthe zones characterised by large wind stress curl val-ues and occupied by the paired eddies, there is a cen-tral zone characterised by much lower curl valuesand possibly larger speed values. Surface water inthis central zone is more mixed than on either side,SST values there are always relatively low. Whensurface water has been swept away and/or mixedwith deeper water in winter, part of the water col-umn is homogenised, and thus can no longer beentrained by the wind, so large amounts of densewater (especially LIW) are formed.
Geostrophic adjustment clearly gives rise to a rimcurrent (e.g. Crépon et al., 1989) around a zone ofdense water formation in the open ocean. However,mechanisms are certainly not so simple when thezone is close to the coast because of winds blowingfrom land. Consistently, no image and no in situ dataaccount for any rim current surrounding these zonesthat could correspond to the alleged “Rhodes gyre”and “Lion gyre” (e.g. Roussenov et al., 1995).Winter images evidence the “AMC” flowing bothinto the Aegean off Turkey and along the southernslope of the islands from Turkey to Crete. They alsoevidence the fact that this “AMC” is disconnected
from the warm waters found in the south that arelinked to the numerous mesoscale eddies (e.g. N)described there. Therefore, even if there must be aneastern basin Northern Current linked to the densewater formation in the northern Levantine, we do notconceive a “Rhodes gyre” stricto sensu.
The Aegean and northern Cretan
From late autumn to early spring, the northwardpenetration of the “AMC” over cooler waters isclear because the Etesians have pushed surfacewaters away from the Turkish coasts. At the sametime, waters cooled in the north by air - sea interac-tions and by mixing with fresh water outflows prop-agate southwards off Greece, so that there is a clearcounterclockwise circulation in most of the Aegeanin winter. This circulation does not close in thenorthern Cretan since part of the warm waters pene-trating through the east-Cretan strait tend to followthe slope associated with the islands in the centralAegean and thus flow (always counterclockwise andalongslope) directly towards the west-Cretan strait.
In summer, the Etesians push the warm waterstowards Greece and southwards so that the surfacecirculation is still alongslope and counterclockwisein the western Aegean. It is worth noting that whilemost of the warm water outflows from the west-Cretan strait, a significant part flows along thenorthern coast of Crete, generating mesoscale anti-cyclonic eddies there. Once created, the eddies prop-agate eastwards and can be tracked for ~1 year (e.g.Z2 in Fig. 21). Surface water can be pushed in thisway by northerly winds and create similar eddiesduring other seasons as well. In summer, the circu-lation off Turkey is not so clear, and probably lessintense, so that the counterclockwise circuit mightnot be closed.
The schema in Figure 3b-c correctly representsthe penetration of the “AMC” into the Aegean,except for its northward extent, while only theschema in Figure 3d gives a consistent idea of thecirculation off Greece. None of the characteristics ofthe mesoscale activity in the northern Cretan (main-ly anticyclones ~100 km in diameter stationary orpropagating eastwards at ~1 km/day along Crete)are correctly schematised. The overall circulation inthe whole area is mainly westwards in the north inwinter and eastwards in the south in summer. Thisyear-round alongslope and counterclockwise circu-lation has not been well schematised up to now.
SCI. MAR., 70(3), September, 2006, 453-503. ISSN: 0214-8358
SURFACE CIRCULATION IN THE EASTERN MEDITERRANEAN • 497

CONCLUSION
The circulation of the Atlantic Water (AW) in theeastern basin of the Mediterranean Sea has beeninferred from the visual analysis of IR satelliteimages (all monthly composites available from 1985and weekly and daily composites (~1000) during theperiod 1996 to 2000). Our approach results from thefact that analysing individual images visually pro-vides more information for understanding processesthan performing unsupervised statistical analyses.The present analysis is the follow-up of the analysis
of images spanning the eighties from numerousstudies that link remotely sensed and in situ obser-vations in the western basin, and of detailed com-parisons between the western and eastern basins.The information we infer is not consistent with anyof the basin-scale schemata that have been widelyreferred to during the last decade, nor with most ofthe schemata available at subbasin scale. Despite thefact that Nielsen’s schema (Fig. 1a) does not evi-dence any mesoscale feature, which is easily under-stood, it is the one that we find the most compatiblewith our analysis, since it emphasises the major
SCI. MAR., 70(3), September 2006, 457-503. ISSN: 0214-8358
498 • N. HAMAD et al.
FIG. 23. – The eastern basin of the Mediterranean Sea in January 1998 (a), and the schema of the surface circulation (b).
effect of the earth’s rotation on the overall circula-tion. This can be deduced from all images shownabove, as well as from the monthly composite ofJanuary 1998 we present in Figure 23a. The latterillustrates all the conclusions detailed hereafter, andwill help in understanding the circulation schema wepropose in Figure 23b.
Our analysis shows that a continuous flow of AWprogresses mainly counterclockwise as an alongs-lope flow around most of the subbasins, hence form-ing a basin-wide gyre. AW first splits off northernTunisia and enters the channel of Sicily mainlyalong Tunisia. Then, most of it spreads in the middleof the channel due to the widening of the Tunisianshelf. A small part of the flow penetrates towards thecentral Ionian as complex mesoscale eddies thatpropagate roughly southeastwards and / or as anorthward branch probably induced by the wind atan interannual time scale (i.e. not at a seasonal one,and without re-joining the remainder of the flow).Although the relative importance of the brancheshas yet to be established, it seems that most of theAW flow continues southwards around the Tunisiancontinental shelf, thus hitting the western Libyanslope and partly turning clockwise over the Tunisianshelf. Finally, most of the AW flow concentrates inthe southern Ionian along the eastern Libyan slope.The whole flow clearly continues alongslope in boththe southern Cretan and the whole Levantine. Inwinter especially, and thanks to the decay of theEtesians, the AW flow then penetrates into theAegean and the northern Cretan where it circulatescounterclockwise before progressing around Greeceup to inside the Adriatic and along southern Italy. Anincreasing number of numerical results (e.g. Pinardiand Masetti, 2000; Alhammoud et al., 2003, 2005)and data analyses (Fusco et al., 2003) support suchan alongslope counterclockwise general circulation(basin-wide gyre).
The AW flow is unstable all along its circuit andgenerates mesoscale eddies. In addition, othermesoscale eddies are generated by the interaction ofthe Etesians with the orography. Original featureshave been specified at subbasin scale:
- In the Ionian, eddies generated in the centralpart, either directly from the AW inflow or from thewind-induced branch, can propagate south-south-eastwards across the whole basin and finally disturbthe circulation along the Libyan slope. Other eddiesgenerated by the instability of the alongslope flowoff western Libya can pinch off, follow the deeper
isobath, re-interact with the parent flow aroundCyrenaïca and then either drift seawards along thedeepest isobaths or continue propagating alongslopedownstream. Pelops is formed every year by theEtesians south / southwest of the Peloponnese. If itdoes not decay rapidly, it can then drift westwardsfor more than 1 year, so that two successive Pelopscan be found a few 100 km apart. All these eddiescan reach diameters of ~100 to 250 km, have life-times of 1 to 2 years, and propagate and/or drift at afew km/d.
- In the southern Cretan, the eddies generated bythe instability of the alongslope flow can reachdiameters of 200 to 250 km. Some of them seem topinch off near the place where the deep isobathsdivert seaward (~20°E). Most of them propagatedownstream at up to ~3 km/d until the southwesternLevantine (we call them Libyo-Egyptian eddies),but they can also remain quasi-stationary and thendeflect seaward eddies approaching from upstream.
- Ierapetra is an anticyclonic eddy generated dur-ing all summer-autumn periods by the Etesianssoutheast of Crete, possibly reaching a diameter of~200 km. Ierapetra is fed by waters entrained by thewind stress curl, associated with the eastern-Creteorography, and by the whole-Crete shadowingeffect. Indeed, this effect extends as far as Africa andallows waters pushed there to flow back northwardsin the lee of the island. Ierapetra can also be fedfrom the northeast by the overall AW flow. Ierapetracan have lifetimes of a few years, drift towards theLibyan slope, interact with the Libyo-Egyptianeddies, interact and merge with the Ierapetra of theformer generation, or remain stationary, thus beingsustained by all northerly wind events, and finallyby the Etesians the year after to give rise to an espe-cially intense Ierapetra.
- In the southwestern Levantine, the Libyo-Egyptian eddies formed by instability of the alongs-lope flow upstream can propagate downstream,remain stationary, occasionally move upstream,interact and / or merge with other eddies and / ordecay. New eddies can be generated there and rapid-ly grow before eventually merging and drifting sea-wards along the deepest isobaths. The SST signatureof eddies there is markedly dependent on theEtesians, although most (if not all) of them are notwind-induced. In any case, the largest eddies (trans-port of several Sv, Zervakis et al., 2002) do notpropagate further east, probably due to their deepextent and to the sloping up of the isobaths, and / or
SCI. MAR., 70(3), September, 2006, 453-503. ISSN: 0214-8358
SURFACE CIRCULATION IN THE EASTERN MEDITERRANEAN • 499

the planetary b effect and the non-linearities. The3000 m Herodotus through off Mersa-Matruh seemsto trap the eddies (most probably because of theirvertical extent), so that eddies are permanentlyfound there. Thus we name this accumulation of(anticyclonic) eddies in the western Levantine SLW.Then, contrary to what has been accepted hitherto,the area known as “Mersa-Matruh” is not occupiedby a recurrent / permanent eddy/gyre, but by slowlypropagating and merging anticyclonic eddies thatoriginated elsewhere.
- We suppose that the succession of the northernedges of these mesoscale eddies must have beenmistaken for a central meandering eastward “Mid-Mediterranean Jet”.
- In the southeastern Levantine, only medium-sized (100-150 km) anticyclonic eddies can (proba-bly due to topography) propagate downstreamalongslope off Egypt at a few km/d before beingentrained seawards by the deepest isobaths and con-tributing to the anticyclonic structure known as“Shikmona”. Smaller-scale features (10s km) issuefrom the alongslope flow off the Middle East andpropagate downstream at up to ~10 km/d beforegenerally evolving as plumes, pinching off and thenalso feeding “Shikmona”. We name this area where(anticyclonic) eddies accumulate, fed either fromthe east or south by smaller eddies and plumes orig-inated from the alongslope flow, SLE.
- In the northern Levantine, the instability of thealongslope circulation generates another kind ofmesoscale feature: well defined anticyclonic eddiesup to ~50 km off the easternmost part of Turkey and~100 km in the Antalya-Rhodes area, which areeither stationary or propagating downstream at up to3 km/d for months. These eddies can markedly mod-ify the circulation in the east-Cretan straits.
- In the northern Cretan, the anticyclonic eddiesprobably originate from the instability of the part ofthe flow entrained southwards by the Etesians, andwhich cannot pass through the west-Cretan strait.These eddies have diameters of 50 to 100 km, prop-agate eastward off Crete at 0 to 2 km/d, and can betracked for months.
- From Greece to southern Italy, the instability ofthe gyre does not seem to generate significantmesoscale eddies.
The original description of the surface circula-tion we came up with leads us to extend the hypoth-esis about the effect of the bathymetry that was firstput forwards by Nielsen (1912) and to propose a
new understanding of the processes. Essentially, theanalysis of the IR imagery and our expertise in thewestern basin lead us to assume that any stable cur-rent will be constrained alongslope by the effect ofthe earth’s rotation. As the surface flow is generallya few 100 metres thick, it roughly follows the 100-200 m isobaths. Now, as soon as an instability devel-ops and an anticyclonic eddy grows, a coupling iscreated between the surface layer and the deeperone, the larger the eddy the deeper (a priori) its ver-tical extent. Assuming that eddies often extenddown to the bottom leads us to assume that they areactually guided by the deeper isobaths. This there-fore explains why eddies pinch off preferentiallywhere deeper isobaths spread seaward, and whylarge eddies with long lifetimes are preferentiallyfound where the bathymetry is deep enough. Thismight also explain why large eddies propagatingdownstream skip the southeastern corners of theIonian and the Levantine. Obviously, this hypothe-sis, which is consistent with all data sets in the west-ern basin, must be tested with adequate models andtheoretical analyses, and be supported by adequatedata sets (which is the goal of EGYPT, seewww.ifremer.fr/lobtln). In addition, we think thatonly the wind-induced anticyclonic eddies Pelopsand Ierapetra, characterised by their year of forma-tion, should be given a name preserving their geo-graphical reference.
The topography in the eastern basin is relativelycomplex and the meteorological-climatic conditionsthere lead to several zones of dense water formation;therefore, several segments of the counterclockwisealongslope circulation could be identified (as beforein the western basin). However, we think that thisbasin-wide gyre has basically two major compo-nents. One would be the Libyo-Egyptian Currentwhich generates the relatively large Libyo-Egyptianeddies that will interact, merge and accumulate inthe area SLW, hence directly spreading AW up to thezone where LIW is formed (this current is the exactcounterpart of the Algerian Current). The otherwould be an eastern-basin Northern Current thatcould be considered as an entity (even though morecomplex than in the western basin), extending moreor less continuously from the Middle East to south-ern Italy. Note that the similarities and differencesthat we see between the eastern and western basins,which were first partially emphasised by Millot(1992), have now been specified by Millot andTaupier-Letage (2005b).
SCI. MAR., 70(3), September 2006, 457-503. ISSN: 0214-8358
500 • N. HAMAD et al.

To conclude, our understanding of the processesis very different from what has been interpreted upto now. Our analysis is consistent with all availablein situ and remote data sets and is supported by themost recent numerical simulations. Instead of con-sidering that there is a continuous meanderingjet/stream crossing the whole basin in its central partas in the POEM-schemata, and also consideringwhat is occurring in the south, we believe that i) theAW circulation forms an alongslope and counter-clockwise gyre at basin scale, ii) the mesoscaleeddies, either generated by the instability of the gyrein the south (the Libyo-Egyptian Current) or by thewinds (the Etesians), play a fundamental role (theeddy-transport is much larger than the gyre-trans-port), iii) the gyre in the north (the NorthernCurrent) does not form a rim current around thezones of dense water formation.
ACKNOWLEDGEMENTS
Najwa Hamad received support for her PhD fromthe High Institute of Marine Research, University ofTishreen, Syria. A. Abbas, J.-L. Fuda and G.Rougier are warmly acknowledged for their help.We have used data sets from the archiving and dis-tributing centres of the DFD/DLR (ISIS/EOWEB,AVHRR), NASA (AVHRR Pathfinder), JRC/Ispra(SeaWIFS), CLS-MFSPP (sea level anomalies), andSISMER (hydrological data). We also benefitedfrom the AVHRR images processed by the SAT-MOS/CMS (Météo-France/INSU agreement), froma catalogue of images kindly provided by A.Lascaratos, and from the XBT data collected duringMFSPP.
REFERENCES
Alhammoud, B., K. Béranger, L. Mortier and M. Crépon. – 2003. Acomparison study between a high resolution numerical modelresults and observations in eastern Mediterranean Sea. In:Proceedings of the 2nd Int. Conf. on Oceanography of theEastern Mediterranean and Black Sea, pp. 344-352. Ankara .
Alhammoud, B., K. Béranger, L. Mortier, M. Crépon and I.Dekeyser. – 2005. Surface circulation of the Levantine Basin:comparison of model results with observations. Prog.Oceanogr., 66: 299-320.
Arnone R. and P. La Violette. – 1986. Satellite definition of bio-optical and thermal variation of coastal eddies associated withthe African Current. J. Geophys. Res., 91: 2351-2364.
Artale, V., M. Astraldi, G. Buffoni and G.P. Gasparini. – 1994.Seasonal variability of gyre scale circulation in the northernTyrrhenian Sea. J. Geophys. Res., 99: 14127-14137.
Artegiani, A., D. Bregant, E. Paschini, N. Pinardi, F. Raicich andA. Russo. – 1997. The Adriatic Sea General Circulation. Part
II: Baroclinic Circulation Structure. J. Phys. Oceanogr., 27:1515-1532.
Ayoub, N. – 1997. Variabilité du niveau de la mer et de la circula-tion en Méditerranée à partir des données altimetriques et dechamps de vent. Comparaison avec des simulationsnumériques. Ph.D. thesis, Univ. Paul Sabatier, Toulouse.
Ayoub, N., P.Y. Le Traon and P. De Mey. – 1998. A description ofthe Mediterranean surface variable circulation from combinedERS-1 and TOPEX/POSEIDON altimetric data. J. Mar. Syst.,18: 3-40.
Béranger K., L. Mortier, G.-P. Gasparini, L. Gervasio, M. Astraldiand M. Crépon. – 2004. The dynamics of the Sicily Strait: acomprehensive study from observations and models, Deep-SeaRes. II, 51(4-5): 411-440.
Brankart, J.M. and P. Brasseur. – 1998. The general circulation inthe Mediterranean Sea: a climatological approach. J. Mar. Syst.,18: 41-70.
Brenner, S. – 1989. Structure and evolution of warm core eddies inthe eastern Mediterranean Levantine basin. J. Geophys. Res., 94(C9): 12593-12602.
Brenner, S. – 1993. Long-term evolution and dynamics of a persist-ent warm core eddy in the Eastern Mediterranean Sea. Deep-Sea Res., 40(6): 1193-1206.
Burman, I. and O.H. Oren. – 1970. Water outflow close to bottomfrom the Aegean. Cah. Oceanogr., 22: 775-780.
Burnett, W.H., J.A. Price and P.E. La Violette. – 1991. The surfacecirculation around Crete inferred from drifter buoy trajectoriesand satellite imagery. Mar. Technol. Soc. Conf.: 869-875.
Cardin, V. and N. Hamad. – 2003. Cretan Sea circulation fromADCP and SST data during 2000-2001. In: Proceedings of the2nd Int. Conf. on Oceanography of the Eastern Mediterraneanand Black Sea, pp. 47-53. Ankara.
Champagne-Philippe, M., D. Guevel and R. Frouin. – 1982. Etudedu Front de Malte à partir de données de télédétection et demesures in situ. Ann. Hydro., 757: 65-98.
Crépon, M., L. Wald and J.M. Monget. – 1982. Low-frequencywaves in the Ligurian Sea during December 1977. J. Phys.Oceanogr., 87: 595-600.
Crépon, M., M. Boukthir, M. Barnier and F. Aikman III. – 1989.Horizontal ocean circulation forced by deep water formation.Part I: An analytical study. J. Phys. Oceanogr., 19: 1781-1792.
Feliks, Y. and S. Itzikowitz. – 1987. Movement and geographicaldistribution of anticyclonic eddies in the Eastern LevantineBasin. Deep-Sea Res., 34 (9): 1499-1508.
Font J., J. Isern-Fontanet and J. Salas. – 2004. Tracking a big anti-cyclonic eddy in the western Mediterranean Sea. Sci. Mar.,68(3): 331-342.
Fuda, J.L., C. Millot, I. Taupier-Letage, U. Send and J.M.Bocognano. – 2000. XBT monitoring of a meridian sectionacross the Western Mediterranean Sea. Deep-Sea Res. I, 47:2191-2218.
Fuda, J.L., G. Etiope, C. Millot, P. Favali, M. Calcara, G. Smriglioand E. Boschi. – 2002. Warming, salting and origin of theTyrrhenian Deep Water. Geophys. Res. Lett., 29(19):1898,doi:10.1029/2001GL014072.
Fusco, G., G.M.R. Manzella, A. Cruzado, M. Gacic, G.P.Gasparini, V. Kovacevic, C. Millot, C. Tziavos, Z. Velásquez,A. Walne, V. Zervakis and G. Zodiatis. – 2003. Variability ofmesoscale features in the Mediterranean Sea from XBT dataanalysis. Ann. Geophys., 21: 21-32.
Golnaraghi, M. – 1993. Dynamical studies of the Mersa Matruhgyre: Intense meander and ring formation events. Deep-SeaRes., 40 (6): 1247-1267.
Golnaraghi, M. and A.R. Robinson. – 1994. Dynamical studies ofthe Eastern Mediterranean circulation. In: P. Malanotte-Rizzoliand A.R. Rodinson (eds.) Ocean processes in ClimateDynamics: Global and Mediterranean Examples, NATO ASISeries, 419, pp. 395-406. Kluwer Academic Publ., Dordrecht.
Hamad, N. – 2003. La circulation de surface dans le bassin orien-tal de la Méditerranée d’après les observations satellitairesinfrarouges. Ph.D. thesis, Univ. Méditerranée.
Hamad, N., C. Millot and I. Taupier-Letage. – 2004. The surfacecirculation in the eastern basin of the Mediterranean Sea: newelements. In: Proceedings of the 2nd Int. Conf. onOceanography of the Eastern Mediterranean and Black Sea,pp. 2-9. Ankara.
Hamad N., C. Millot and I. Taupier-Letage. – 2005. A new hypoth-
SCI. MAR., 70(3), September, 2006, 453-503. ISSN: 0214-8358
SURFACE CIRCULATION IN THE EASTERN MEDITERRANEAN • 501

esis about the surface circulation in the eastern basin of theMediterranean Sea. Prog. Oceanogr. 66: 287-298.
Hecht, A., N. Pinardi and A.R. Robinson. – 1988. Currents, watermasses, eddies and jets in the Mediterranean Levantine Basin.J. Phys. Oceanogr., 18: 1320-1353.
Hecht, A. and I. Gertman. – 2001. Physical features of the EasternMediterranean resulting from the integration of POEM datawith Russian Mediterranean Cruises. Deep-Sea Res., 48:1847-1876.
Horton, C., J. Kerling, G. Athey, J. Schmitz and M. Clifford. –1994. Airborne expendable bathythermograph surveys of theEastern Mediterranean. J. Geophys. Res., 99(C5): 9891-9905.
Kotsovinos, N.E. – 1997. The Ierapetra and Rhodes Gyres: anassumption for their generation. Proc. Hell. Symp. Oceanogr.Fish, 1: 161-164.
Lacombe, H., P. Tchernia and G. Benoist. – 1958. Contribution àl’étude hydrologique de la mer Egée en période d’été. Bull. Inf.Coec., 8: 454-468.
Lacombe, H. and P. Tchernia. – 1972. Caractères hydrologiques etcirculation des eaux en Méditerranée. In: D. Stanley (ed.), TheMediterranean Sea: a natural sedimentation laboratory, pp.25-36. Dowden, Hutchinson and Ross Inc., Stroudsburg.
Larnicol, G., P.Y. Le Traon, N. Ayoub and P. De Mey. – 1995.Mean sea level and surface circulation variability ofMediterranean Sea from 2 years of TOPEX/POSEIDONaltimetry. J. Geophys. Res., 100: 25163-25177.
Larnicol, G., N. Ayoub and P.Y. Le Traon. – 2002. Major changesin Mediterranean Sea level variability from 7 years ofTOPEX/POSEIDON and ERS-1/2 data. J. Mar. Syst., 33-34:63-89.
Lascaratos, A. and S. Tsantilas. – 1997. Study of the seasonal circleof the Ierapetra gyra, using satellite imager. Proc. Hell. Symp.Oceanogr. Fish, 1: 165-168.
Le Vourch, J., C. Millot, N. Castagné, P. Le Borgne and J.P. Olry. –1992. Atlas of thermal fronts of the Mediterranean Sea derivedfrom satellite imagery. Mém. Inst. Océanogr. Monaco, 16.
Malanotte-Rizzoli, P. and A. Bergamasco. – 1989. The circulationof the Eastern Mediterranean, part I : The barotropic, wind-driven circulation. Oceanol. Acta, 12 (4): 335-351.
Malanotte-Rizzoli, P. and A. Bergamasco. – 1991. The wind and ther-mally driven circulation of the eastern Mediterranean Sea. Part II: the baroclinic case. Dyn. Atm. Oceans, 15 (3-5): 355-419.
Malanotte-Rizzoli, P. – 1994. Modeling the general circulation ofthe Mediterranean. In: P. Malanotte-Rizzoli and A.R. Rodinson(eds.) Ocean processes in Climate Dynamics: Global andMediterranean Examples, NATO ASI Series, 419, pp. 307-321.Kluwer Academic Publ., Dordrecht.
Malanotte-Rizzoli, P., B.B. Manca, M. Ribera d’Alcala, A.Theocharis, A. Bergamasco, D. Bregant, G. Budillon, G.Civitarese, D. Georgopoulos, A. Michelato, E. Sansone, P.Scarazzato and E. Souvermezoglou. – 1997. A synthesis of theIonian Sea hydrography, circulation and water mass pathwaysduring POEM-Phase I. Prog. Oceanogr., 39: 153 -204.
Malanotte-Rizzoli, P., B.B. Manca, M. Ribera d’Alcala, A.Theocharis, S. Brenner, G. Budillon and E. Özsoy. – 1999. TheEastern Mediterranean in the 80s and in the 90s: the big transi-tion in the intermediate and deep circulations. Dyn. Atm.Oceans, 29: 365 - 395.
Manca, B.B., Ursella, L. and P. Scarazzato. – 2002. New develop-ment of the Eastern Mediterranean circulation based on hydro-logical observations and current measurements. In: F. Boero etal. (eds,) 2nd National Conference of Conisma, Mar. Ecol.,PSZN, 23 (1): 237-257.
Manca, B.B., A. Crise, and L. Ursella. – 2003. Recent advances inobserving the upper thermocline circulation in the Ionian Sea inresponse to changes in wind stress curl. In: Proceedings of the2nd Int. Conf. on Oceanography of the Eastern Mediterraneanand Black Sea, pp. 10-17. Ankara.
Manzella, G. M. R., V. Cardin, A. Cruzado, G. Fusco, G. Gacic, C.Galli, C., G. – P. Gasparini, T. Gervais, V. Kovacevic, C.Millot, L. Petit De la Villeon, G. Spaggiari, M. Tonani, C.Tziavos, Z. Velásquez, A. Walne, V. Zervakis and G. Zodiatis.– 2001. EU-sponsored effort improves monitoring of circula-tion variability in the Mediterranean. EOS Trans. AGU, 82 (43):497-504.
Marullo, S., R. Santoleri, P. Malanotte-Rizzoli and A. Bergamasco.– 1999a. The sea surface temperature field in the Eastern
Mediterranean from the advanced very high resolutionradiometer (AVHRR) data - Part I. Seasonal variability. J. Mar.Syst., 20: 63-81.
Marullo, S., R. Santoleri, P. Malanotte-Rizzoli and A. Bergamasco.– 1999b. The sea surface temperature field in the EasternMediterranean from the advanced very high resolutionradiometer (AVHRR) data - Part II. Interannual variability. J.Mar. Syst., 20: 83-112.
Marullo S., E. Napolitano, R. Santoleri, B. B. Manca and R. Evans.– 2003. The variability of Rhodes and Ierapetra gyres studiedby remote sensing observation, hydrographic data and modelsimulations during LIWEX (october 1994-april 1995). J.Geophys. Res., 108(C9): 8119, DOI: 10.1029/2002JC001393.
Matteoda, A.M. and S.M.Glenn. -1996. Observations of recurrentmesoscale eddies in the Eastern Mediterranean. J. Geophys.Res., 101(C9): 20687-20709.
Millot, C. – 1985. Some features of the Algerian Current. J.Geophys. Res., 90(C4): 7169-7176.
Millot, C. – 1987. Circulation in the Western Mediterranean Sea.Oceanol. Acta, 10: 143-149.
Millot, C. – 1991. Mesoscale and seasonal variabilities of the circu-lation in the Western Mediterranean. Dyn. Atm. Oceans, 15:179-214.
Millot, C. – 1992. Are there major differences between the largestMediterranean Seas? A preliminary investigation. Bull. Inst.Oceanogr. Monaco, 11: 3-25.
Millot, C. – 1999. Circulation in the Western Mediterranean Sea. J.Mar. Syst., 20: 423-442.
Millot C. – 2005. Circulation in the Mediterranean Sea: evidences,debates and unanswered questions. In: C. Marrasé and P.Abelló (eds.) Promoting marine science: Contributions to cele-brate the 50th anniversary of Scientia Marina, Sci. Mar., 69(Suppl. 1): 5-21.
Millot, C., I. Taupier-Letage and M. Benzohra. – 1990. TheAlgerian eddies. Earth-Sci. Rev., 27, 203-219.
Millot, C., M. Benzohra and I. Taupier-Letage. – 1997. Circulationoff Algeria inferred from the mediprod-5 current meters. Deep-Sea Res., 44 (9): 1467 -1495.
Millot C. and I. Taupier-Letage. – 2005a. Additional evidence ofLIW entrainment across the Algerian Basin by mesoscaleeddies and not by a permanent westward-flowing vein. Progr.Oceanogr., 66: 231-250.
Millot C. and I. Taupier-Letage. – 2005b. Circulation in theMediterranean Sea. In: A. Saliot (ed.) The Handbook ofEnvironmental Chemistry, 5 (K), pp. 29-66. Springer-Verlag,Heidelberg.
Molcard, A., L. Gervasio, A. Griffa, G.-P. Gasparini, L. Mortier andT. Özgökmen. – 2002. Numerical investigation of the SicilyChannel dynamics: density current and water mass advection.J. Mar. Syst., 36 (3-4): 219-238.
Napolitano, E., T. Oguz, P. Malanotte-Rizzoli, A. Yilmaz and E.Sansone. – 2000. Simulations of biological production in theRhodes and Ionian basins of the Eastern Mediterranean. J. Mar.Syst., 24: 277-298.
Nielsen, J.N. – 1912. Hydrography of the Mediterranean and adja-cent waters. Rep. Dan. Oceanogr. Exp. Medit., 1: 77-192.
Obaton, D., C. Millot, G. Chabert D’Hières and I. Taupier-Letage.– 2000. The Algerian Current: comparisons between in situ andlaboratory measurements. Deep-Sea Res. I, 47: 2159-2190.
Ovchinnikov, I.M. – 1966. Circulation in the surface andIntermediate Layers of the Mediterranean. Oceanology, 6: 48-59.
Özsoy, E., A. Hecht and Ü. Ünlüata. – 1989. Circulation andhydrography of the Levantine Basin. Results of POEM coordi-nated experiments 1985-1986. Prog. Oceanogr., 22: 125 -170.
Özsoy, E., A. Hecht, U. Ünlüata, S. Brenner, T. Oguz, J. Bishop,M.A. Latif and Z. Rozentraub. – 1991. A review of theLevantine Basin circulation and its variability during 1985-1988. Dyn. Atm. Oceans, 15: 421-456.
Özsoy, E., A. Hecht, U. Ünlüata, S. Brenner, H.I. Sur, J. Bishop,M.A. Latif, Z. Rozentraub and T. Oguz. – 1993. A synthesis ofthe Levantine Basin circulation and hydrography 1985-1990.Deep-Sea Res., 40: 1075 -1119.
Pierini, S. and A. Rubino. – 2001. Modeling the oceanic circulationin the area of the strait of Sicily: the remotely forced dynamics.J. Phys. Oceanogr., 31(6): 1397-1412.
Pinardi, N., G. Korres, A. Lascaratos, V. Roussenov and E. Stanev.– 1997. Numerical simulation of the interannual variability of
SCI. MAR., 70(3), September 2006, 457-503. ISSN: 0214-8358
502 • N. HAMAD et al.

the Mediterranean Sea upper circulation. Geophys. Res. Let.,24(4): 425-428.
Pinardi, N. and E. Masetti. – 2000. Variability of the large scalegeneral circulation of the Mediterranean Sea from observationsand modelling: a review. Palaeogeogr., Palaeoclimatol.,Palaeoecol., 158: 153-173.
POEM Group. – 1992. General circulation of the EasternMediterranean. Earth Sci. Rev., 32: 285-309.
Poulain, P.M. – 1998. Lagrangian measurements of surface circula-tion in the Adriatic and Ionian seas between November 1994and March 1997. Rapp. Comm. int. Mer Medit., 35: 190-191.
Poulain, P.M. – 2001. Adriatic Sea surface circulation as derivedfrom drifter data between 1990 and 1999. J. Mar. Syst., 29: 3-32.
Puillat, I., I. Taupier-Letage. and C. Millot. – 2002. Algerian Eddieslifetime can near 3 years. J. Mar. Syst., 31: 245-259.
Robinson, A.R., M. Golnaraghi, W.G. Leslie, A. Artegiani, A.Hecht, E. Lazzoni, A. Michelato, E. Sansone, A. Theocharisand Ü. Ünlüata - 1991. The Eastern Mediterranean general cir-culation : features, structure and variability. Dyn. Atm. Oceans,15: 215-240.
Robinson, A.R. and M. Golnaraghi. – 1993. Circulation and dynam-ics of the Eastern Mediterranean Sea; Quasi-Synoptic data-driven simulations. Deep-Sea Res., 40(6): 1207-1246.
Robinson, A.R., J. Sellschopp, A. Warn-Varnas, W.G. Leslie, C.J.Lozano, P.J. Haley Jr, L.A. Anderson and P.F.J. Lermusiaux. –1999. The Atlantic Ionian Stream. J. Mar. Syst., 20: 129-156.
Roussenov, V., E. Stanev, V. Artale and N. Pinardi. – 1995. A sea-sonal model of the Mediterranean Sea general circulation. J.Geophys. Res., 100 (C7): 13515 -13538.
Ruiz, S., J. Font, M. Emelianov, J. Isern-Fontanet, C. Millot and I.Taupier-Letage. – 2002. Deep structure of an open sea eddy inthe Algerian Basin. J. Mar. Syst., 33-34: 179-195.
Said, M.A. – 1984. Water circulation in the central and Easternbasins of the Mediterranean Sea and the formation of the inter-mediate water masses. Ph. D. thesis, Univ. Odessa (in Russian).
Salas, J., C. Millot, J. Font and E. García-Ladona, 2002. Analysis ofmesoscale phenomena in the Algerian Basin observed with drift-ing buoys and infrared images. Deep-Sea Res., 49(2): 245-266.
Sammari, C., C. Millot and L. Prieur. – 1995. The circulation in theLigurian Sea inferred from the Prolig-2 experiment. Deep-SeaRes., 42(6): 893-917
Spall, M. (2004). Boundary currents and watermass transformationin marginal seas. J. Phys. Oceanogr., 34: 1197-1213.
Taupier-Letage, I. and C. Millot. – 1988. Surface circulation in theAlgerian basin during 1984. Oceanol. Acta, sp. issue 9: 79-85.
Taupier-Letage, I. and C. Millot. – 2003. Why biological time seriesrequire physical ones?. In: Mediterranean biological time
series, CIESM Workshop Monograph, 22: 93-100.Taupier-Letage, I., C. Millot, S. Dech, R. Meisner, J-L. Fuda, I.
Puillat, C. Bégué, B. Rey and C. Albérola. – 1998. Suivi desstructures dynamiques de moyenne échelle dans le bassinalgérien pendant l’opération ELISA (1997-1998) par l’imageriesatellitale thermique NOAA/AVHRR: les obstacles potentiels àune reconnaissance automatique. Oceanis, 24(3): 153-174.
Taupier-Letage, I., I. Puillat, P. Raimbault and C. Millot. – 2003.Biological response to mesoscale eddies in the Algerian Basin.J. Geophys. Res., 108(C8): 3245-3267.
Theocharis, A., D. Georgopoulos, A. Lascaratos and K. Nittis. – 1993.Water masses and circulation in the central region of the EasternMediterrranean : Eastern Ionian, South Aegean and NorthwestLevantine, 1986-1987. Deep-Sea Res., 40 (6): 1121-1142.
Theocharis, A., E. Balopoulos, S. Kioroglou, H. Kontoyiannis andA. Iona. – 1999. A synthesis of the circulation and hydrographyof the South Aegean Sea and the straits of the Cretan Arc(March 1994-January 1995). Prog. Oceanogr., 44: 469 -509.
Theodorou, A., A. Theocharis and E. Balopoulos. – 1997.Circulation in the Cretan Sea and adjacent regions in late win-ter 1994. Oceanol. Acta, 20 (4): 585 -596.
Tziperman, E. and P. Malanotte-Rizzoli. – 1991. The climatologi-cal seasonal circulation of the Mediterranean Sea. J. Mar. Res.,49: 411 - 434.
Wald, L. – 1985. Apport de la télédétection spatiale en infrarougeproche et moyen à la connaissance du milieu marin. Ph. D. the-sis, Univ. Toulon et du Var.
Zavatarelli, M. and G.L. Mellor. – 1995. A numerical study of theMediterranean Sea circulation. J. Phys. Oceanogr., 25(6):1384-1414.
Zervakis, V., G. Papadoniou, C. Tziavos and A. Lascaratos. – 2002.Seasonal variability and geostrophic circulation in the EasternMediterranean as revealed through a repeated XBT transect.Ann. Geophys., 20: 1-15.
Zodiatis, G. – 1992. On the seasonal variability of the water massescirculation in the NW Levantine Basin-Cretan Sea and flowsthrough the eastern Cretan Arc straits. Ann. Geophys., 10: 12-24.
Zodiatis, G. – 1993. Circulation of the Cretan Sea water masses(Eastern Mediterranean Sea). Oceanol. Acta, 16(2): 107-114.
Zodiatis, G., A. Theodorou and A. Demetropoulos. – 1998.Hydrography and circulation south of Cyprus in late summer1995 and in spring 1996. Oceanol. Acta, 21: 447-458.
Scient. ed.: J. FontReceived March 17, 2005. Accepted March 20, 2006.Published online July 14, 2006.
SCI. MAR., 70(3), September, 2006, 453-503. ISSN: 0214-8358
SURFACE CIRCULATION IN THE EASTERN MEDITERRANEAN • 503
