the sub-prime crisis and equity markets: bandaid solutions for a bleeding jugular? by alex frino...
TRANSCRIPT

The sub-prime crisis and equity markets: Bandaid solutions for a
bleeding jugular?by
Alex Frino
Finance Discipline

This talk
• The US real-estate bubble bursts
• How the burst found its way into equity markets and across the pacific
• The band-aid solutions put up by equity market regulators
• ASIC: A case study in a firm decisive regulator

The real estate bubble
Source: Shiller (2008), The Sub-Prime Solution

Shillers offers lots of explanations for the bubble
• An “epidemic” driven by house price optimism
• Information cascades
But not why it burst….

A contributor to the “epidemic”
• Comparable sales models contributed to the epidemic:– AVM’s– Desktop/Drive-by valuers– Valuation agents

Source: Office of Federal Housing Enterprise Oversight
US House prices
0.00
50.00
100.00
150.00
200.00
250.00
19
91
1
19
91
4
19
92
3
19
93
2
19
94
1
19
94
4
19
95
3
19
96
2
19
97
1
19
97
4
19
98
3
19
99
2
20
00
1
20
00
4
20
01
3
20
02
2
20
03
1
20
03
4
20
04
3
20
05
2
20
06
1
20
06
4
20
07
3
20
08
2
When did the bubble burst? a first look

Source: S&P
When did the bubble burst? a second look
Case Shiller Composite
0.00
50.00
100.00
150.00
200.00
250.00
Jan-
87
Jan-
88
Jan-
89
Jan-
90
Jan-
91
Jan-
92
Jan-
93
Jan-
94
Jan-
95
Jan-
96
Jan-
97
Jan-
98
Jan-
99
Jan-
00
Jan-
01
Jan-
02
Jan-
03
Jan-
04
Jan-
05
Jan-
06
Jan-
07
Jan-
08
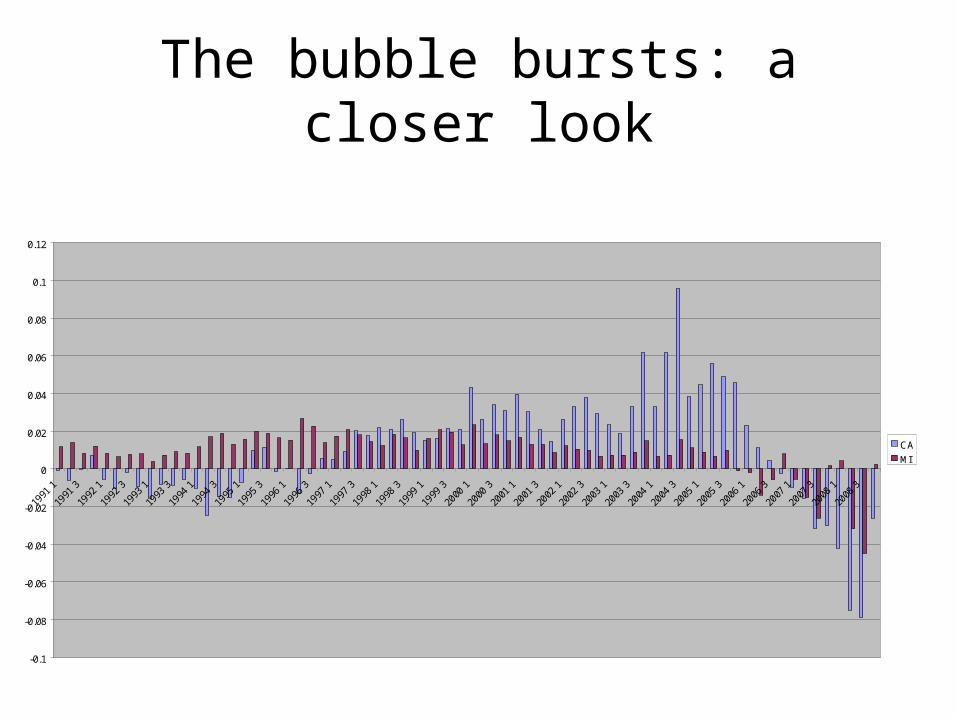
The bubble bursts: a closer look
-0.1
-0.08
-0.06
-0.04
-0.02
0
0.02
0.04
0.06
0.08
0.1
0.12
1991
1
1991
3
1992
1
1992
3
1993
1
1993
3
1994
1
1994
3
1995
1
1995
3
1996
1
1996
3
1997
1
1997
3
1998
1
1998
3
1999
1
1999
3
2000
1
2000
3
2001
1
2001
3
2002
1
2002
3
2003
1
2003
3
2004
1
2004
3
2005
1
2005
3
2006
1
2006
3
2007
1
2007
3
2008
1
2008
3
CA
MI

-0.15
-0.1
-0.05
0
0.05
0.1
0.15
1991
1
1991
3
1992
1
1992
3
1993
1
1993
3
1994
1
1994
3
1995
1
1995
3
1996
1
1996
3
1997
1
1997
3
1998
1
1998
3
1999
1
1999
3
2000
1
2000
3
2001
1
2001
3
2002
1
2002
3
2003
1
2003
3
2004
1
2004
3
2005
1
2005
3
2006
1
2006
3
2007
1
2007
3
2008
1
2008
3
AK
AL
AR
AZ
CA
CO
CT
DC
DE
FL
GA
HI
IA
ID
IL
IN
KS
KY
LA
MA
MD
ME
MI
MN
MO
MS
MT
NC
ND
NE
NH
NJ
The real-estate market in free fall

Australian house pricesRP Data Rismark Hedonic Index
350.000
370.000
390.000
410.000
430.000
450.000
470.000
490.000
Oct
-04
No
v-0
4
De
c-0
4
Jan
-05
Fe
b-0
5
Ma
r-0
5
Ap
r-0
5
Ma
y-0
5
Jun
-05
Jul-
05
Au
g-0
5
Se
p-0
5
Oct
-05
No
v-0
5
De
c-0
5
Jan
-06
Fe
b-0
6
Ma
r-0
6
Ap
r-0
6
Ma
y-0
6
Jun
-06
Jul-
06
Au
g-0
6
Se
p-0
6
Oct
-06
No
v-0
6
De
c-0
6
Jan
-07
Fe
b-0
7
Ma
r-0
7
Ap
r-0
7
Ma
y-0
7
Jun
-07
Jul-
07
Au
g-0
7
Se
p-0
7
Oct
-07
No
v-0
7
De
c-0
7
Jan
-08
Fe
b-0
8
Ma
r-0
8
Ap
r-0
8
Ma
y-0
8
Jun
-08
Jul-
08
Au
g-0
8
Se
p-0
8
Oct
-08
No
v-0
8
De
c-0
8
Jan
-09
Fe
b-0
9

What caused the real-estate bubble to burst?
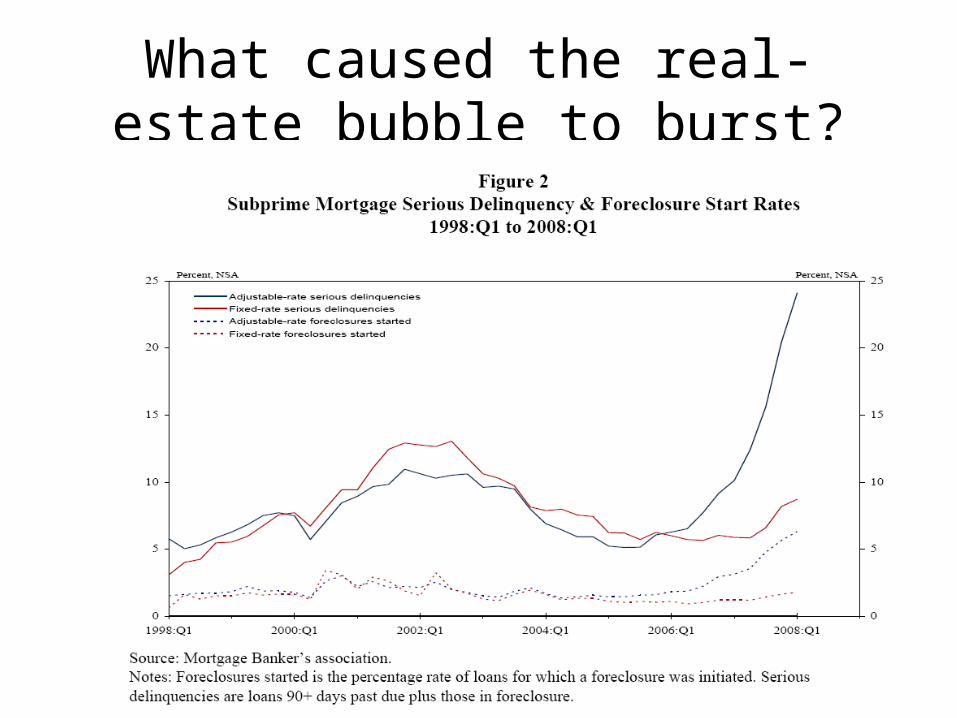
What caused the real-estate bubble to burst?
The virus• Mortgage backed securities
• Sub-prime paper
• Toxic debt
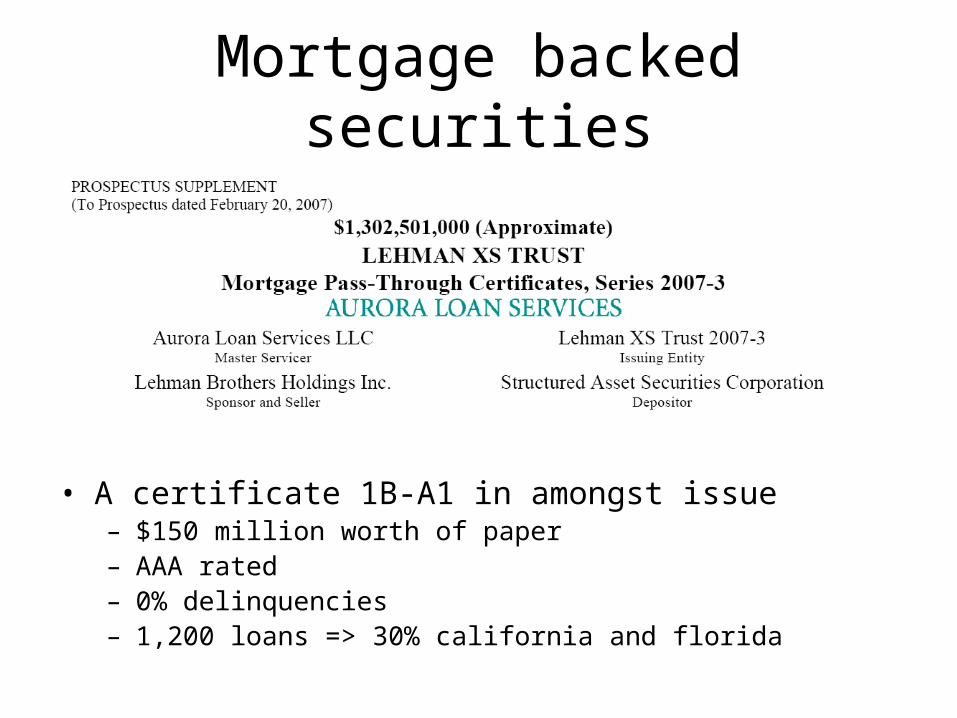
Mortgage backed securities
• A certificate 1B-A1 in amongst issue– $150 million worth of paper– AAA rated– 0% delinquencies– 1,200 loans => 30% california and florida
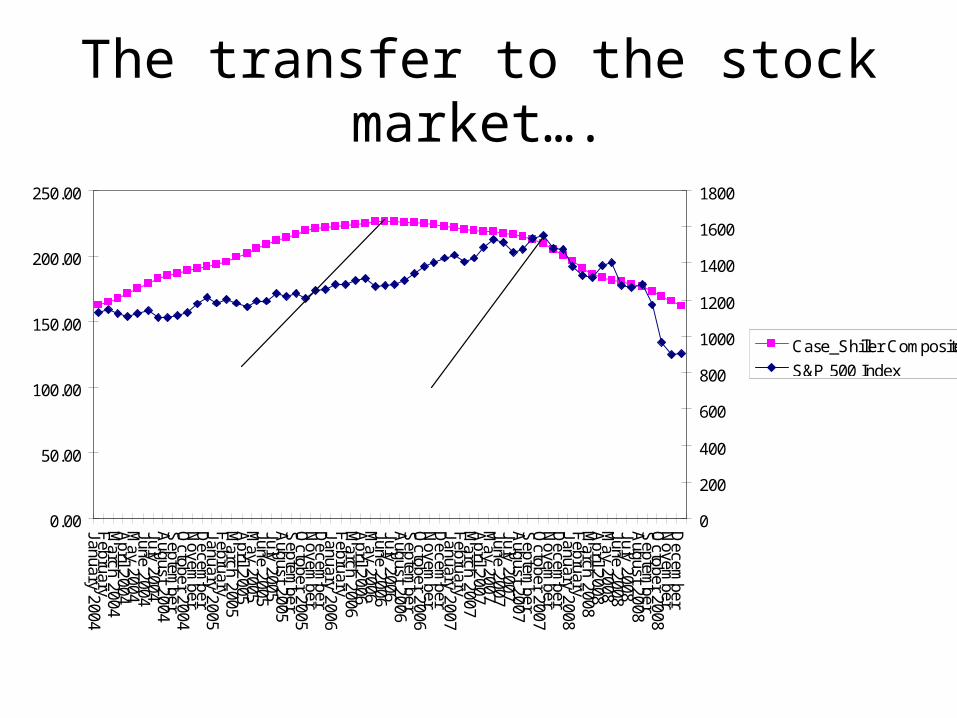
The transfer to the stock market….
0.00
50.00
100.00
150.00
200.00
250.00
January 2004F
ebruaryM
arch 2004A
pril 2004M
ay 2004June 2004July 2004A
ugust 2004S
eptember
October 2004
Novem
berD
ecember
January 2005F
ebruaryM
arch 2005A
pril 2005M
ay 2005June 2005July 2005A
ugust 2005S
eptember
October 2005
Novem
berD
ecember
January 2006F
ebruaryM
arch 2006A
pril 2006M
ay 2006June 2006July 2006A
ugust 2006S
eptember
October 2006
Novem
berD
ecember
January 2007F
ebruaryM
arch 2007A
pril 2007M
ay 2007June 2007July 2007A
ugust 2007S
eptember
October 2007
Novem
berD
ecember
January 2008F
ebruaryM
arch 2008A
pril 2008M
ay 2008June 2008July 2008A
ugust 2008S
eptember
October 2008
Novem
berD
ecember
0
200
400
600
800
1000
1200
1400
1600
1800
Case_Shiller Composite
S&P 500 IndexJune 2006
October 2007

The transfer to the stock market….
0.00%
20.00%
40.00%
60.00%
80.00%
100.00%
120.00%
140.00%
3/01/2006 3/07/2006 3/01/2007 3/07/2007 3/01/2008 3/07/2008
Financials
S&P 500

The transfer to the stock market….
-60.00%
-50.00%
-40.00%
-30.00%
-20.00%
-10.00%
0.00%
10.00%
3/01/2006 3/04/2006 3/07/2006 3/10/2006 3/01/2007 3/04/2007 3/07/2007 3/10/2007 3/01/2008 3/04/2008 3/07/2008 3/10/2008
22 Feb 2007
Markett
Financialst RR
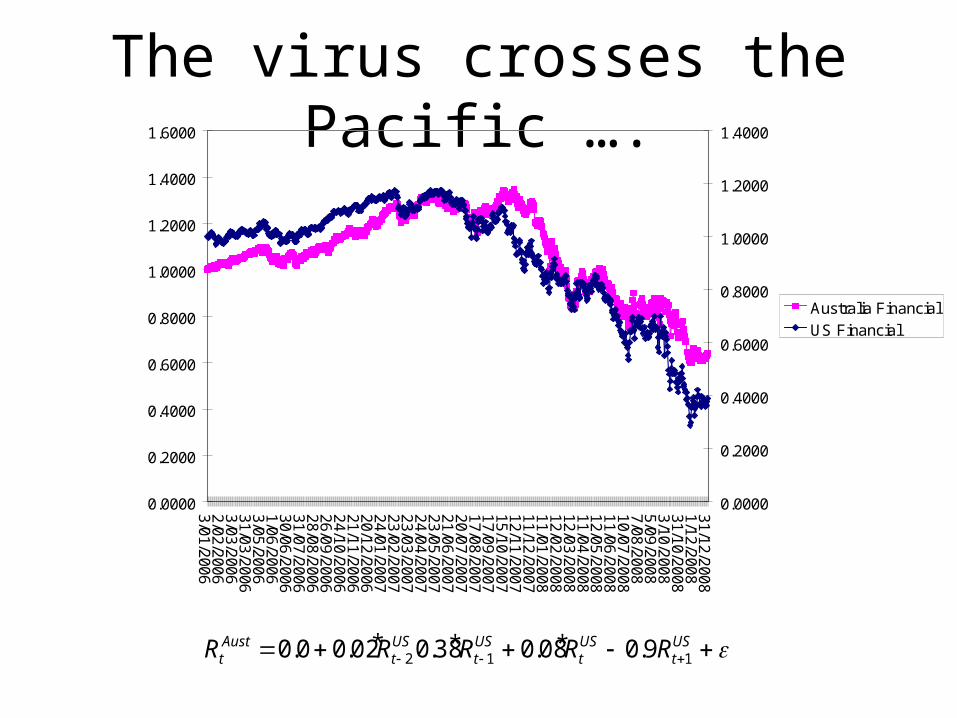
The virus crosses the Pacific ….
0.0000
0.2000
0.4000
0.6000
0.8000
1.0000
1.2000
1.4000
1.6000
3/01/20062/02/20063/03/200631/03/20063/05/20061/06/200630/06/200631/07/200628/08/200626/09/200624/10/200621/11/200620/12/200624/01/200723/02/200723/03/200724/04/200723/05/200721/06/200720/07/200717/08/200717/09/200715/10/200712/11/200711/12/200711/01/200812/02/200812/03/200811/04/200812/05/200811/06/200810/07/20087/08/20085/09/20083/10/200831/10/20081/12/200831/12/2008
0.0000
0.2000
0.4000
0.6000
0.8000
1.0000
1.2000
1.4000
Australia Financial
US Financial
USt
USt
USt
USt
Austt RRRRR 112 9.008.038.002.00.0 * * *

RP Data Rismark Hedonic Index
350.000
370.000
390.000
410.000
430.000
450.000
470.000
490.000
Oct-0
4
Dec-0
4
Feb-0
5
Apr-0
5
Jun-
05
Aug-0
5
Oct-0
5
Dec-0
5
Feb-0
6
Apr-0
6
Jun-
06
Aug-0
6
Oct-0
6
Dec-0
6
Feb-0
7
Apr-0
7
Jun-
07
Aug-0
7
Oct-0
7
Dec-0
7
Feb-0
8
Apr-0
8
Jun-
08
Aug-0
8
Oct-0
8
Dec-0
8
Feb-0
9
RP Data Rismark Hedonic Index

and crosses the Atlantic ….
0.00
0.20
0.40
0.60
0.80
1.00
1.20
1.40
3/01/2006 3/07/2006 3/01/2007 3/07/2007 3/01/2008 3/07/2008
UK financials
USA Financials

The response of the regulators(bans on naked short selling)
Market Covers Start date End date
USA FINS 21/07/2008Japan ALL 28/08/2008 31/03/2009France FINS 19/09/2008 IndefiniteSwitzerland ALL 19/09/2008 IndefiniteGermany FINS 20/09/2008 31/03/2009Singapore BUY-INN 22/09/2008Italy FINS 22/09/2008 31/05/2009Netherlands FINS 22/09/2008 28/02/2009Belgium FINS 22/09/2008 20/03/2009Luxembourg ALL 22/09/2008 IndefinitePortugal FINS 24/09/2008 IndefiniteIceland FINS 6/10/2008
Austria FINS 28/10/2008 30/04/2009
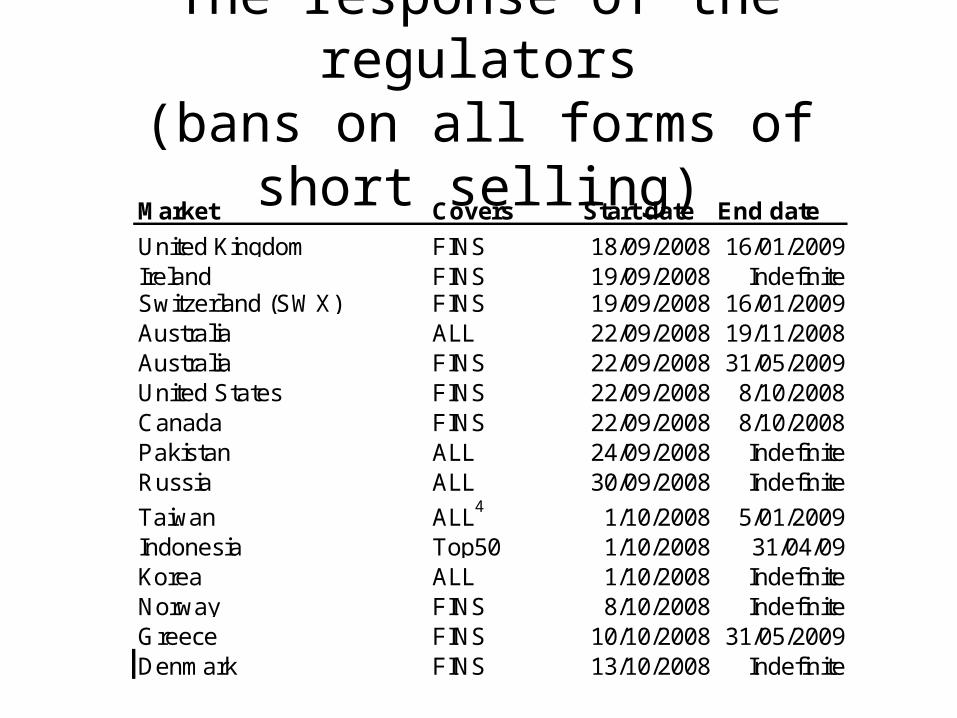
The response of the regulators(bans on all forms of short selling)
Market Covers Start date End date
United Kingdom FINS 18/09/2008 16/01/2009Ireland FINS 19/09/2008 IndefiniteSwitzerland (SWX) FINS 19/09/2008 16/01/2009Australia ALL 22/09/2008 19/11/2008Australia FINS 22/09/2008 31/05/2009United States FINS 22/09/2008 8/10/2008Canada FINS 22/09/2008 8/10/2008Pakistan ALL 24/09/2008 IndefiniteRussia ALL 30/09/2008 Indefinite
Taiwan ALL4 1/10/2008 5/01/2009Indonesia Top50 1/10/2008 31/04/09Korea ALL 1/10/2008 IndefiniteNorway FINS 8/10/2008 Indefinite Greece FINS 10/10/2008 31/05/2009Denmark FINS 13/10/2008 Indefinite
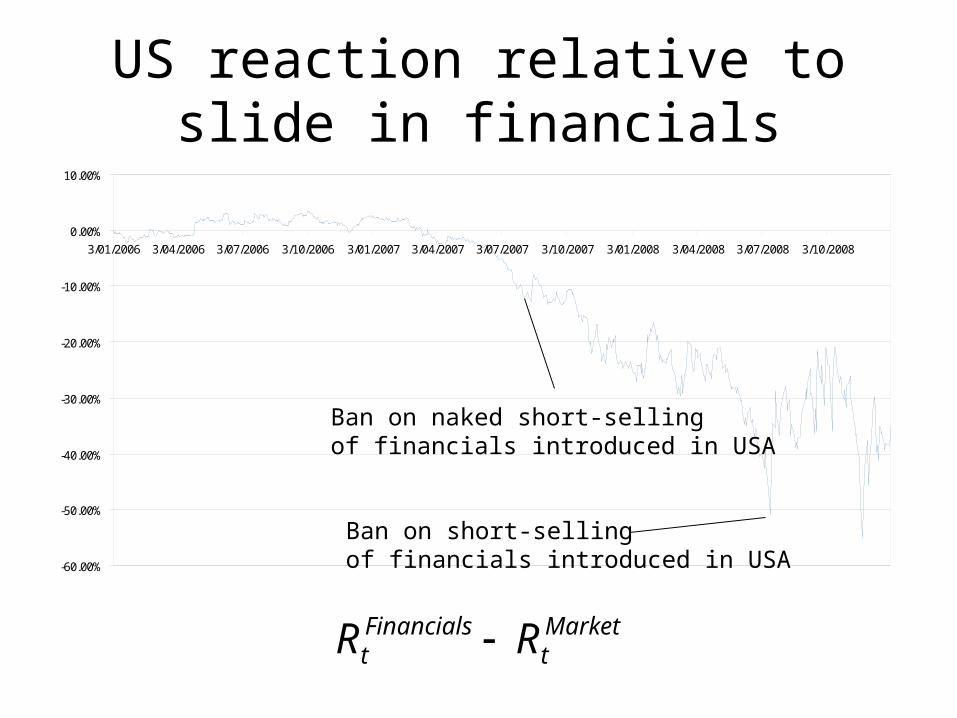
US reaction relative to slide in financials
-60.00%
-50.00%
-40.00%
-30.00%
-20.00%
-10.00%
0.00%
10.00%
3/01/2006 3/04/2006 3/07/2006 3/10/2006 3/01/2007 3/04/2007 3/07/2007 3/10/2007 3/01/2008 3/04/2008 3/07/2008 3/10/2008
Markett
Financialst RR
Ban on naked short-sellingof financials introduced in USA
Ban on short-sellingof financials introduced in USA

The response of our decisive regulator
2008 AnnouncementFri 19 Sep ■ Bans naked short sales
Sunday 21 Sep ■ Bans covered short salesMonday 22 Sep ■ Covered short sales for hedging permitted
Tue 23 Sep ■ Covered short sales for hedging, dual listed entities, exchange traded options, index arb, market makers etc. allowed
Wed 24 Sep ■ Lending permitted

The effect of the response…
-5 -4 -3 -2 -1 0 1 2 3 4 5
-4.00%
-2.00%
0.00%
2.00%
4.00%
6.00%
8.00%
10.00%
-5 -4 -3 -2 -1 0 1 2 3 4 5
UK
USA
Canada

The effect of the response…
Market Market IndexFinance Index Beta Estimation Period Event date
UK FTSE-All Shares FT 1.19 06/08/06 - 06/08/08 19/09/08
USA S&P 500 Composite S5fINL 1.43 02/06/06 - 02/06/08 16/07/08
Canada S&P/ TSX Composite SPTEQFI 0.70 05/08/06 - 05/08/08 19/09/08

A bandaid solution at best…
-60.00%
-50.00%
-40.00%
-30.00%
-20.00%
-10.00%
0.00%
10.00%
20.00%
3/01/2006 3/05/2006 3/09/2006 3/01/2007 3/05/2007 3/09/2007 3/01/2008 3/05/2008 3/09/2008
UK_M.A.I._CAR
US_M.A.I_CAR
Canada_M.A.I_CAR
USA Announces ban on naked short selling of financials
UK Announces ban Canada announces ban
CAR’s of Financial IndexesUSA Announces short selling ban on financials

Closing comments
• The equities markets dramatic fall was caused by toxic debt
• Short selling attacked a symptom not the problem
• So why do we still have short selling bans?