the study of bonding behaviour between fibre …eprints.utm.my/id/eprint/2631/1/71920.pdf ·...
TRANSCRIPT

VOT 71920
THE STUDY OF BONDING BEHAVIOUR BETWEEN FIBRE REINFORCED POLYMER COMPOSITE PLATE
AND CONCRETE PRISM UNDER TROPICAL CLIMATE
DR. YOB SAED ISMAIL
RESEARCH VOTE NO: 71920
FAKULTI KEJURUTERAAN MEKANIKAL UNIVERSITI TEKNOLOGI MALAYSIA
2004

1
UTM/RMC/F/0014 (1998)
UNIVERSITI TEKNOLOGI MALAYSIA Research Management Centre
PRELIMINARY IP SCREENING & TECHNOLOGY ASSESSMENT FORM
(To be completed by Project Leader submission of Final Report to RMC or whenever IP protection arrangement is required)
1. PROJECT TITLE IDENTIFICATION :
THE STUDY OF BONDING BEHAVIOUR BETWEEN FIBRE REINFORCED POLYMER COMPOSITE
PLATE AND CONCRETE PRISM UNDER TROPICAL CLIMATE Vote No:
2. PROJECT LEADER :
Name : DR. YOB SAED ISMAIL
Address : FAKULTI KEJURUTERAAN MEKANIKAL, UTM, 81310 UTM SKUDAI
Tel : 07-5576160 samb. 4685 Fax : 07-5576160 e-mail : [email protected]
3. DIRECT OUTPUT OF PROJECT (Please tick where applicable)
4. INTELLECTUAL PROPERTY (Please tick where applicable)
Scientific Research Applied Research Product/Process Development
71920
Lampiran 13
Structure
Algorithm
Data
Method/Technique
Demonstration/ Prototype
Product/Component
Process
Software
Not patentable
Patent search required
Patent search completed and clean
Invention remains confidential
No publications pending
No prior claims to the technology
Technology proctected by patents
Patent pending
Monograph available
Inventor technology champion
Industrial partner identified

2
UTM/RMC/F/0014 (1998)
5. TECHNICAL DESCRIPTION AND PERSPECTIVE
Please tick an executive summary of the new technology product, process, etc., describing how it works. Include brief analysis that compares it with competitive technology and signals the one that it may replace. Identify potential technology user group and the strategic means for exploitation. a) Technology Description
The use of non-metallic advanced composite materials, in the form of fibre reinforced polymers
(FRP), is now receiving widespread attention of the construction industry, particularly for the applications in
plate bonding technology to upgrade (strengthening) and/or rehabilitate reinforced concrete (RC), wood or
steel structural elements. Most of the published data to date are related to short term structural behaviour
of CFRP-adhesive-concrete interfaces bonding performances and durability characteristics that are
exposed to Europe and US wheathering environments, but no information related to tropical wheathering
effects are reported so far.
The rate of natural deterioration of any material can be relaltively slow or rapid, but it is generally a
steady state process. However, the processes of degradation in metals are very different from those in
FRP’s. In metals, the deterioration processes are mainly electrochemical in nature, whereas in FRPs these
are largely physiochemical. However, when the FRPs are used in conjunction with concrete to form a plate
composite beam, the long-term serviceability or integrity of the plate-adhesive-concrete member does not
solely depend on the the plate material bu also equally, if not more importantly, on the properties, of the
interfaces involved in the joint, namely, the plate-adhesive and adhesive-concrete interfaces. Therefore,
the durability aspects of FRP plate bonding system whether using CFRP or GFRP plate is to be well
understood before the system need to be applied in tropical wheather environments.
b) Market Potential
The finding of test results and data analysis have a good potential to be used to predict future
mechanical integrity performances and durability characteristics of RC structures strengthened (externally
bonded with epoxy) with FRP plate. The data are able to provide such important information for structural
consultant/engineer in their design analysis.
c) Commercialization Strategies
Basically, the research that has been done was focused on gathering mechanical and durability
characteristics data that could be used in strengthening the reinforced concrete structures such as beams,
slabs and columns. The data can be published through meeting with Public Works Department personnel,
applicators and journals, etc.
Signature of Projet Leader :- Date :-

3
8. RESEARCH PERFORMANCE EVALUATION
a) FACULTY RESEARCH COORDINATOR Research Status ( ) ( ) ( ) ( ) ( ) ( ) Spending ( ) ( ) ( ) ( ) ( ) ( ) Overall Status ( ) ( ) ( ) ( ) ( ) ( ) Excellent Very Good Satisfactory Fair Weak Good
Comment/Recommendations :
………………………………… Name : ………………………………………
Signature and stamp of Date : ……………………………………… JKPP Chairman b) RMC EVALUATION
Research Status ( ) ( ) ( ) ( ) ( ) ( ) Spending ( ) ( ) ( ) ( ) ( ) ( ) Overall Status ( ) ( ) ( ) ( ) ( ) ( ) Excellent Very Good Satisfactory Fair Weak Good
Comments :-
UTM/RMC/F/0014 (1998)

4
RE
Recommendations:
……………………………………………….. Name : ……………………………………………
Signature and Stamp of Dean / Deputy Dean Date : ……………………………………………
Research Management Centre
UTM/RMC/F/0014 (1998)
Need further research
Patent application recommended
Market without patent
No tangible product. Report to be filed as reference

i
ABSTRACT Keywords: CFRP Plate, concrete, bond stress, tension-compression test
Carbon Fibre Reinforced Polymer (CFRP) composites have been used
successfully as strengthening material for reinforced concrete structures by
externally plate-bonded technique. The CFRP materials have characteristics
such as lightweight, high tensile strength and modulus to weight ratio, non-
magnetic and highly corrosion resistant. Many studies have shown that
using plate-bonded technique, the performance of the strengthened concrete
member was enhanced. In this technique, the surface preparation of
concrete substrate and CFRP material along with the type of epoxy
adhesive used are the critical factors affecting the bonding performance of
the system. This paper discusses the experimental result on the bonding
characteristics between CFRP plate and concrete. The bond stress was
determined along the 200 mm bond length of the bonded CFRP plate to
concrete. A 50 mm width by 1.6 mm thick CFRP plate was used and
bonded to 100x100x300 mm concrete prism. The bonded CFRP plate to
concrete prism was tested under tension-compression loads and the results
have shown that at lower load level, the shear stress distribution along the
bonded length was relatively linear and uniform. However, at higher load
when micro cracking occurred along the lap joints the shear stress
distribution became non-linear. The investigation on mode of failure of the
sample shows that the bond between the CFRP plate and concrete was very
good.
Key researchers:
Dr. Yob Saed Ismail Dr. Abdul Rahman Mohd.Sam
Mr. Shukur Abu Hassan
ii
TABLE OF CONTENT
CHAPTER SUBJECTS PAGE
ABSTRACT i
TABLE OF CONTENT ii
LIST OF FIGURE vii
LIST OF TABLE x
1 INTRODUCTION 1
1.0 Introduction 1
1.1 Research Objective 2
1.2 Research Scope 2
1.3 Research Methodology 3
2 LITERATURE REVIEW 5
2.0 Introduction 5
2.1 Definition Of Composite Material 5
2.1.1 Advantages Of FRP 5
2.2 General Properties Of FRP 6
2.3 Reinforcing Fibres 7
2.3.1 Carbon Fibres 8
2.4 Resin 10
2.4.1 Epoxies 11

iii
2.5 Performance Characteristic Of FRP Components 14
2.5.1 Environmental Conditions 14
2.5.2 Temperature Effect 14
2.5.3 Creep 15
2.5.4 Stress-Rupture/ Stress Corrosion 15
2.5.5 Wet Behaviour 15
2.6 Concrete 17
2.6.1 Portland Cement 17
2.7 Hardened Concrete 17
2.7.1 Water: Cement Ratio Law 17
2.7.2 Gain in Strength With Ages 18
2.8 Factors Affecting Concrete Strength 19
2.8.1 Compaction 19
2.8.2 Curing 19
2.8.3 Temperature 20
2.8.4 Heat Of Hydration 21
2.9 Modulus Of Elasticity 21
2.10 Tensile Strength 21
2.11 Literature Review On Bonded Joint 22
2.12 Bonded Joint Definition 22
2.12.1 Advantages And Disadvantages Of Bonded Joint 23
2.13 Mechanism And Bond Models 23
2.13.1 Mechanical Interlocking Model 23
2.13.2 Diffusion Model 24
2.13.3 Model Of Weak Boundary Layer 25
2.14 Bonded Joint Configuration 26
2.15 Terminology And Hierarchy Of Connection Design 27
2.16 Loading Modes 29
2.17 Failure Modes 30
2.18 Joint Geometry Effect On Joint Strength 31

iv
2.19 Adherends 33
2.20 Surface Treatments 33
2.21 Bonded Joint Design Principle 33
2.22 Adhesive 35
2.22.1 Adhesive Mechanical Properties 36
2.23 Elastic Properties And Deformation 37
2.24 Design Procedure For Tensile Shear Loading 38
2.25 Factors Considered In Designing Adhesive Bond Joint 41
2.26 Lap Joints 42
2.27 Mechanism Of Bond Failure 43
2.27.1 Failure Of Interface ( An Adhesive Failure ) 43
2.27.2 Failure In The Adhesive (A Cohesive Failure) 44
2.27.3 Failure In The Adherend 44
2.28 Environmental Effects On Adhesive Bonded Joints 45
2.29 Environmental Durability Of Adhesive Joints 45
2.29.1 Environmental And Service Conditions 46
2.29.1.1Resistance To Temperature 46
2.29.1.2Resistance To Moisture 47
2.29.1.3Resistance To chemical Attack 47
2.29.2 Resistance To Fire 47
2.30 Factors Affecting Joint Durability 48
2.30.1 Adherend Type And Nature 48
2.30.2 Adhesive Type/ Cure Cycle 48
2.30.3 Quality Of FRP Material 49
2.30.4 Bonding Operation 49
2.30.5 Joint Design 50
2.30.6 Exposure Conditions 50
2.31 Theory Of Moisture Diffusion 50
2.32 Free Phase Model (Fick’s Law) 51
2.33 Effects Of Moisture Absorption On FRP Components 53
2.33.1 Weight Increase 53

v
2.33.2 Plasticization Of Matrix And Decrease Of Glass
Transition Temperature 55
2.33.3 Reduction In Strength 57
2.34 Effects Of Water Absorption On Adhesive Bonding 59
3 EXPERIMENTAL SETUP 65
3.0 Introduction 65
3.1 Details Of Materials 65
3.1.1 Concrete Prism 65
3.1.2 CFRP Plate 66
3.1.3 Joint Adhesive 67
3.2 Preliminary Test 67
3.2.1 Test Rig Design And Preparation 67
3.2.2 Specimen Preparation 68
3.2.3 Tests Set Up 69
3.3 CFRP Plates Bonded Concrete Prism Pull- Out Test 70
3.3.1 Test Rig Design And Preparation 70
3.3.2 Specimen Preparation 72
3.3.3 Test Set Up 78
3.3.3.1 Measurements And Instrument 79
4 RESULTS AND DISCUSSION 82
4.0 Introduction 82
4.1 Bonding Properties 82
4.2 Average Bond Strength 83
4.3 Local Strain 84
4.4 Force Transfer Between CFRP Plate And Concrete 87
4.5 Local Shear Stress Distribution 92
4.6 Average Bond Strength 95

vi
4.7 Maximum Bond Stress Concentration Factor 96
4.8 Failure Mode Analysis 97
4.8.1 Failure Mode Analysis For Control I Sample 97
4.8.2 Failure Mode Analysis For Control II Sample 101
4.8.3 Failure Mode Analysis Hot/Wet/ Dry Sample 104
5 CONCLUSIONS AND SUGGESTIONS 108
5.1 Conclusions 108
5.2 Suggestions For Future Study 110
REFERENCES 112
APPENDIXES 114

vii
LIST OF FIGURE
FIGURE TITLE PAGE
1.1 Research experimentation programme 4
2.1 Stress-strain curves for typical fibre,resin and FRP 7
composite
2.2 Tensile stress versus tensile strain of various type
of reinforcing fibres 8
2.3 Relation between cement 18
2.4 Effect of duration of damp curing on the strength
of concrete 20
2.5 Good wetting and poor wetting 24
2.6 Inter diffusion across the interface 25
2.7 Seven classifications of wealth boundary layers 26
2.8 Type of joints used in adhesive-bonding flat adherends 26
2.9 Design procedure of adhesive joint 27
2.10 Loading modes or type of stresses 29
2.11 Areas of failure initiation and critical strength 30
2.12 Stress distribution of lap joint 31
2.13 A typical adhesive shear stress distribution in a lap
joint according to elastic-plastic model 32
2.14 Relative joint of various joint configurations 35
2.15 Typical brittle and ductile adhesive behavior 36
2.16 Deformation of rigid members 37
2.17 Deformation of elastic members 37
2.18 Half lap length (c) as a function of parameter 39

viii
2.19 Tensile force on single lap joint 42
2.20 Exaggerated deformation in loaded single lap joint 43
2.21 Cohesive and adhesive bond failure 44
2.22 Moisture absorption curves 55
2.23 Glass transition temperature versus exposure time 57
2.24 GFRP-concrete bonded system details 59
2.25 Typical longitudinal plate force transfer for mix A 60
2.26 Typical longitudinal plate force transfer for mix B 60
2.27 Typical shear stress distribution for mix A 61
2.28 Typical shear stress distribution for mix B 61
2.29 Relation between bond strength and compressive strength 62
2.30 Different potential failure modes in a plate bonded joint 63
3.1 Concrete prism dimension and a CFRP plate bonded 65
3.2 CFRP plate dimensions 66
3.3 Test rig preparation 68
3.4 Two units of test rig 68
3.5 CFRP plate bonded with mild steel plate 69
3.6 Schematic diagram of specimen 69
3.7 Schematic diagram of tension compression test rig 70
3.8 Schematic diagram of tension compression test rig
Test set-up (second trial) 71
3.9 Front view of tension compression test rig and test
specimen for second trial 71
3.10 Mild steel end tabs bonded CFRP plate drilling process 72
3.11 Concrete prism with hacked area 72
3.12 Bonding process and CFRP plate 73
3.13 (a) CFRP plates bonded concrete prism specimen details 74
3.13 (b) CFRP plates bonded concrete prism specimen details 75
3.13 (c) Schematic diagrams of gauge locations on concrete prism
for control II 75
3.14 Condition that sample totally submerged into water 76

ix
3.15 (a) Compressive local acting on 50% on top of concrete
prism surface for sample control I 77
3.15 (b) Uniform compressive load acting on top of concrete
prism surface for control II 78
3.16 Instron 100kN universal testing machine instrument set-up 79
3.17 Process roughing CFRP surface and soldering process 80
4.1 Geometry and material parameters of the CFRP plate
Concrete prism under tension compression 83
4.2 Graph applied load versus local strain for control I sample 84
4.3 Graph applied load versus local strain for control II sample 85
4.4 Graph applied load versus local strain for hot/wet/dry 86
4.5 Schematic diagram of gauge locations on CFRP plates
for control I sample 89
4.6 Local load distribution at CFRP plate (sample I) 89
4. 7 Schematic diagram of gauge locations on CFRP 90
4.8 Local load distribution at CFRP plate (sample II) 90
4.9 Local load distribution at CFRP plate (hot/wet/dry) 91
4.10 The strain gauges location notation 93
4.11 Shear stress distribution for sample 94
4.11 Shear stress distribution for sample (hot/wet/dry) 95
4.12 Failure mode analysis for control I sample 99
4.12 Failure mode analysis for control I sample 100
4.13 Failure mode analysis for control II sample 102
4.13 Failure mode analysis for control II sample 103
4.14 Failure mode analysis for control (hot/wet/dry) 105
4.14 Failure mode analysis for control (hot/wet/dry) 106

x
LIST OF TABLES
TABLE TITLE PAGE
2.1 Mechanical properties of carbon fibre 9
2.2 Typical properties of epoxy 11
2.3 Property comparisons between an epoxy resin
with various reinforcement and various metals 12
2.4 Environmental conditions 14
2.5 Results of environmental durability testing 54
2.6 Results of environmental durability testing 56
2.7 Results of environmental durability testing 58
3.1 Specification of TML strain gauge at CFRP plate 80
4.1 Average bond strength and maximum applied for
control I, II and hot/wet/dry samples 96
4.2 Maximum local bond stress and location for control I,II,
hot/wet/dry sample 96
4.3 Maximum bond stress concentration factor for control
I,II and hot/wet/dry sample 97

CHAPTER I
INTRODUCTION
1.0 Introduction
In the area of civil construction industry that rapidly expanded in the middle of
last century is reaching a critical age, the security of bridges and buildings that
represents investment of trillions of dollars is being now questioned. Deficiencies in the
existing inventory range from those related to wear, environmental deterioration and
aging of structural components, increasing of traffic demands and changing traffic
patterns. The long term durability of any this construction material is very important in
order to ensure that the structure able to maintain its integrity and provides the service
according to its design throughout its service life. Thus the deteriorated concrete
structures due to environmental attack require repair and preventive maintenance or
sometimes need strengthening due poor initial design or to extend their service life.
In area of strengthening deteriorated reinforced concrete members, plate-bonding
system using steel has been widely used [9]. However due to possible corrosion
problems and handling aspect during installation, other alternatives materials are being
investigated. With the advancement in the materials technology, a relatively high
durability and high strength composite material known as Fibre Reinforced Polymer
(FRP) is accommodate to replace steel plate [10]. The use of FRP materials i.e. carbon
fibre reinforced polymer (CFRP) and glass fibre reinforced polymer (GFRP) are now
receiving widespread attention for applications in plate bonding technology to upgrade

and / or rehabilitate the reinforced concrete (RC) structures. It is ranging from the
retrofit and rehabilitation of buildings and bridges to the construction of new structural
system in most of the developed country such as USA, Canada, Japan and most of the
European countries [8]. FRP plate bonding technology advantages compare to steel joint
such as low stress concentration, no bearing stress, lighter weight, high stiffness and
strength-to-weight ratios, stiffer joints beside higher durability to most environment
conditions. There is also serious concern about the long-term durability of CFRP
materials as shown by the decision not to use these materials to strengthen the A3 trunk
road in Europe [10]. Therefore, durability of FRP plate bonding system whether using
CFRP or GFRP plate is needed to be well understood before the system need to be
applied.
1.1 Research Objective
The objective of this research is to study the effects of designated exposure
conditions onto adhesive bonding of CFRP plate and concrete prism characteristic.
1.2 Research Scope
The study focus on the mechanical properties of CFRP plate and concrete prism
bonded system due to tropical climate exposure. The study cover on the short term
exposure of test samples. Samples were exposed to three (3) types of conditions,
namely:
• Laboratory (as control),
• Outdoor
• Plain water (Wet/Dry cycle).
The effects of tropical climate conditions were determined through Tension-
Compression (Pull-out Test) and observation through samples mode of failures. The

bond characteristic were determined by comparison in term of ultimate load at failure,
bond strength and mode of failure between control and exposed samples.
1.3 Research Methodology
In this project, CFRP plate bonded to concrete prism using epoxy adhesive
samples were prepared and exposed to different environmental conditions such as
indoor, outdoor, and plain water. In short term (Phase I), the control sample was tested
immediately after they are prepared to determine the bond properties. The rest of test
samples were exposed to the designated environmental condition up to 6 months prior
testing. The results obtain were compared with the control results.
Figure 1.1 shows the experimentation programme for the investigation of the
effect the environment on the adhesive bonding properties between the CFRP plate and
concrete. The CFRP plate bond to concrete specimens were prepared and exposed under
wet-dry cycles to plain water conditions. During the exposure period, the CFRP plate
and the adhesive will be monitored to detect any sign of durability problem. The strain
changes with time of the concrete beam and CFRP plate were monitored by fixing
demec discs on their surface. After that pull-out test was carried out to determine the
bonding characteristic before and after the exposure.

Figure 1.1: Research experimentation programme
Experimentation Programme
EXPOSURE CONDITION:
i. Lab (Control)
DURATION:
Immediately test
after the specimens are prepared
• Unstressed
TYPE OF TEST:
• Pull-out
EXPOSURE CONDITION:
i. Outdoor
ii. Plain water (wet/dry)
DURATION:
Short-term (6 months)
• Unstressed
TYPE OF TEST:
• Pull-out

CHAPTER II
LITERATURE REVIEW
2.0 Introduction
In this chapter, the study focuses on properties and characteristic of FRP
composite materials, i.e. epoxy and concrete. Factors such as environmental conditions,
temperature effect, creep, wet / dry behaviour and stress corrosion were studied.
2.1 Definition of Composite Material
A composite material is a combination of two or more materials (reinforcing
elements, fillers and matrix binder), differing in form or composition on a macro scale.
The constituents retain their identities; that is, they do not dissolve or merge completely
into one another although they act in concert. Normally, the components can be
physically identified and exhibit an interface between one another [1].
2.1.1 Advantages of FRP
Among the benefits of FRP composites are as follows:
• Due to their multifunctional aspect, composites are able to meet diverse design
requirements.
• Weight saving are significant.

• Corrosion resistance is outstanding.
• Fatigue and fracture attributes are numerous.
• Impact and damage tolerance characteristics are excellent.
• Flexibility in product styling and aesthetic.
• Low thermal expansion can be achieved, but will vary significantly with the
matrix material selected, the fibre types and orientation.
• Manufacturing and assembly are simplified due to part integration.
2.2 General Properties of FRP
Fibre reinforced composite materials are blends of a high strength, high modulus
fibre with a hard enable liquid matrix. In this form, both fibres and matrix retain their
physical and chemical identities yet they produce a combination of properties that
cannot be achieved with either of the constituents acting alone [4]. The bonding of these
aligned fibres into the softer matrix material results in a fibre-reinforced composite
material with superior properties in the fibre direction [4]. Since the fibres are highly
directional, the resultant composite will exhibit anisotropic behaviour much like steel
acting in reinforced concrete.
Typical composite material properties include low specific gravity modulus-to-
weight ratio. Most FRP materials are resistant to corrosion. Another characteristic of
FRP materials is the linear stress-strain curve up to failure. Matrix materials deform
plastically, whereas the fibres, in general, do not. The stress and strain relationship
between resins, fibres and composites is shown in Figure 2.1[7].

Figure 2.1: Stress-strain curves for typical fibre, resin and FRP composite [7]
Since the FRP composite strength performance are dominated by the
reinforcement, this plastic deformation or yield is seldom exhibited by the composite for
structural design purposes. Brittle failure is the typical failure mode for FRP composite
under excessive mechanical loading stresses.
2.3 Reinforcing Fibres
Fibres ideally comprise 60% - 70% of volume fraction of the composite and are
the principal load carrying members. Hand lay-up methods may produce laminates with
lower fibre volumes, which may range in between 30%-50% of fibre content. Fibres
primarily act in tension tend to have low transverse strength. For handling purposes, the
individual fibres are brought together in ‘bundles’ called tows and roving. The fibres can
be used in this form or further processed into tow sheets, fabrics or mats. The three most
common fibres types used in polymer matrix composites are carbon, glass and aramid.
Figure 2.2 shows the relationship between stress and strain of the different
fibres[7]. The gradient of each curve indicates the stiffness (modulus) of the fibre, the
steeper gradient, the higher the stiffness.
Fibre
FRP Composite
Resin
Tensile Stress
Strain
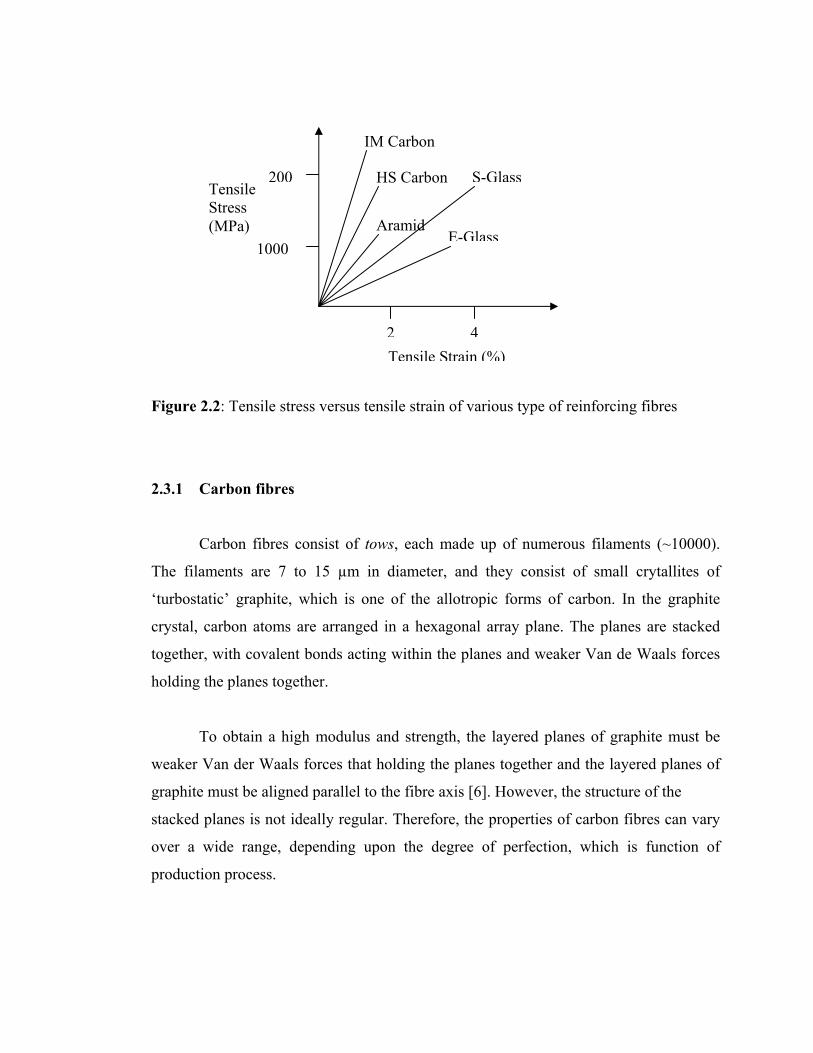
Figure 2.2: Tensile stress versus tensile strain of various type of reinforcing fibres
2.3.1 Carbon fibres
Carbon fibres consist of tows, each made up of numerous filaments (~10000).
The filaments are 7 to 15 µm in diameter, and they consist of small crytallites of
‘turbostatic’ graphite, which is one of the allotropic forms of carbon. In the graphite
crystal, carbon atoms are arranged in a hexagonal array plane. The planes are stacked
together, with covalent bonds acting within the planes and weaker Van de Waals forces
holding the planes together.
To obtain a high modulus and strength, the layered planes of graphite must be
weaker Van der Waals forces that holding the planes together and the layered planes of
graphite must be aligned parallel to the fibre axis [6]. However, the structure of the
stacked planes is not ideally regular. Therefore, the properties of carbon fibres can vary
over a wide range, depending upon the degree of perfection, which is function of
production process.
200
1000
IM Carbon
HS Carbon
Aramid
S-Glass
42
E-Glass
Tensile Strain (%)
Tensile Stress (MPa)

Three precursor materials are used at present to produce carbon fibres: rayon,
polyacrylonitrile (PAN), and isotropic and liquid crystalline pitches. Rayon and isotropic
pitch precursors are used to produce low modulus carbon fibres (≤ 50 GPa). Higher
modulus carbon fibres (≥ 200 GPa) are made from PAN or liquid crystalline
(mesophase) pitch precursor. Carbon fibres are not wet by molten metals and difficult to
wet with resins, especially the higher modulus fibres [1].
Carbon fibres are immune to moisture, corrosive environment, solvents bases
and weak acids. However, oxidation becomes a problem at elevated temperature. The
unidirectional type of carbon fibre is anisotropic material, and its transverse modulus
is an order of magnitude less then its longitudinal modulus. The material has a very
high fatigue and creep resistance.
Table 2.1: Mechanical properties of carbon fibre [3]
Typical Properties High
Strength
High
Modulus
Ultra-High
Modulus
Density (g/ cm³) 1.8 1.9 2.0-2.1
Young’s Modulus (GPa) 230 370 520-620
Tensile Strength (GPa) 2.48 1.79 1.03-1.31
Tensile Elongation (%) 1.1 0.5 0.2

2.4 Resin
Resin is a solid or pseudosolid organic material, usually of high molecular
weight, that exhibits a tendency to flow when subjected to stress. In reinforced polymer,
the material used to bind together the reinforcement material is called the matrix [1].
Matrix is the essentially homogeneous resin or polymer material in which the fibre
system of a composite is imbedded. Both thermoplastic and thermoset resins may be
used, as well as metals, ceramics and glasses [1].
Resins by their nature are at least an order of magnitude weaker than the
reinforcing fibres embedded in them. They are more susceptible to heat and fire and
generally more susceptible to solvents, water, acids and bases than the fibres. All resins
exhibit substantial levels of creep and have large coefficient of thermal expansion
(CTE). Resin matrices allow stresses to be shared across the reinforcing fibres in
laminate. This sharing action allows the laminate to act in a more homogeneous manner
that develops the superior properties of the FRP. Resins also act as protective coating
that shields the fibres from abrasion and from certain environmental aggressive factors.
Long-term durability of polymer matrices is associated with a gradual change in
physical properties, which occurs with time and loading. Pre-stressing composite
materials may have significant long-term effects on the polymer matrix. Creep rupture
has been known to occur in FRP composites due to viscoplastic behaviour of the
polymer matrix and is not a function of the fibres. The three most commonly used resin
systems are epoxies, polyesters and vinylesters.

2.4.1 Epoxies
Epoxy resins are used extensively in polymer composite materials for a variety
of structural applications. They are the most versatile of the commercially available
matrices. Depending on the chemical structures of the resin and the curing agent, the
availability of numerous modifying reactants, and the conditions of cure, it is possible to
obtain toughness, chemical and solvent resistance, mechanical response, ranging from
extreme flexibility to high strength and hardness, resistance to creep and fatigue,
excellent adhesion to most fibres, heat resistance and excellent electrical properties.
All epoxy resins contain the epoxide, oxirane, or ethoxylene group, where R
represents the point of attachment to the remainder of the resin molecule. The epoxide
function is usually a 1,2- or α-epoxide that appears in the form called the glycidyl group,
which is attached to the remainder of the molecule by an oxygen, nitrogen, or carboxyl
linkage, hence, the terms glycidyl ether, glycidyl amine, or glycydyl ester. Curing of the
resin results from the reaction of the oxirane group with compounds that contain reactive
hydrogen atoms:
Epoxies tend to have higher viscosities than both polyesters and vinylesters
systems. They also have longer curing times and are the most expensive of the three
systems. Typical physical and mechanical properties of epoxy system is given in Table
2.2 [4].
Table 2.2: Typical properties of epoxy
Properties Value
Tensile Strength (MPa) 55-130
Tensile Modulus (GPa) 2.8-4.1
Elongation (%) 3.0-10.0
Density (g/ cm³) 1.2-1.3
Shrinkage (%) 1-5

The epoxy resins constitute an important and rapidly growing class of resins for
use in reinforced plastic and as adhesives system. However a fairly good model of the
structure can be built and knowledge is increasing rapidly on the molecular structure and
its various reactions. Property comparisons between an epoxy resin various
reinforcements and various metals are given in Table 2.3 [1].
Table 2.3: Property comparisons between an epoxy resin with various reinforcements
and various metals
Unidirectional Strength
Material Density
(g/ cm³)
Tensile
(MPa)
Compressive
(MPa)
Unidirectional
tensile modulus
(GPa)
Carbon (AS4) 1.55 1482 1227 145
Carbon (HMS) 1.63 1276 1020 207
S-glass 1.99 1751 496 59
E-glass 1.99 1103 490 52
Aramid 1.38 1310 290 83
Aluminum (7075-T6) 2.76 572 MPa 69
Titanium 4.42 1103 MPa 114
Steel 8.0 1241- 1379 MPa 207
a) Effect of Fibre Reinforcements
Epoxies form a strong interphase; laminates made with these matrices reflect
their fibre properties to a large extent. The three fibres most commonly used are glass,
polyaramid and carbon. Carbon fibres are the most versatile and have the best balance of
properties as epoxy matrix reinforcement. Compare to glass and polyaramid fibres, they
are superior in tensile, flexural, compressive and fatigue (tension-tension) properties.

b) Advantages of Epoxy Resins
The advantages of epoxy resins over other polymers as adhesive agents for civil
engineering use can be summarized as follows (Mays and Follows Hutchinson, 1992).
• High surface activity and good wetting properties for a variety of substrates.
• May be formulated to have a long open time (the time between mixing and
closing of the joint).
• High cured cohesive strength, so the joint failure may be dictated by the
adherend strength, particularly with concrete substrates.
• May be toughened by the inclusion of a dispersed rubber phase.
• Minimal shrinkage on curing, reducing bond line, strain and allowing the
bonding of large areas with only contact pressure.
• Low creep and superior strength retention under sustained load.
• Able to accommodate irregular or thick bond lines.
• Blending with a variety of materials to achieve desirable properties can readily
modify formulation.
These various modifications make epoxy adhesives relatively expensive in
comparison to other adhesives. However, the toughness, range of viscosity and curing
conditions, good handling characteristic, high adhesive strength, inertness, low
shrinkage and resistance to chemicals have meant that epoxy adhesives have found
many applications in constructions, for example, repair materials, coatings and as
structural and non-structural adhesives.

2.5 Performance Characteristic of FRP Composites
2.5.1 Environmental Conditions
FRP composites can be expected to show excellent durability characteristic
within a normal range of conditions, which includes:
Table 2.4: Environmental conditions
Temperature:
Range -30°C to 62°C for long term
(greater than 1000 hours) exposure and
1100°C for short term (under 2 hours) fire
exposure,
Moisture: Full immersion in fresh or salt water for
long term exposure at 0°C to 40°C,
pH: 3.0 to 10.0 for long term exposure, and
Ultraviolet radiation: UV index of 10 for long term exposure,
and
Hydrocarbons/pollutants: Immersion in specific concentrations for
extended periods of time.
2.5.2 Temperature Effect
The thermal energy supplied above the glass transition temperature Tg allows the
resin chains to move and to become more flexible. This will lowers the load or sharing
capacity of the resin and results in preferential loading of individual fibres (the shorter
ones). Since the load is no longer shared among the groups of fibres the loading on
individual fibres may exceed the capacity of that fibre and it breaks. The next shorter
fibres pick up the load and if it high, they break and so on. Ultimate load carrying
capacity of the FRP can be lowered by 30-40% in some extreme cases.

2.5.3 Creep
Of the FRP components discussed, only carbon and glass fibres do not creep.
Aramids and all the matrices do exhibit creep to varying degrees. Creep in FRP’s is a
fibre-dominated property. If the fibre is either carbon or glass, is uncrimped and is
securely fastened at the termination points there will be no creep, as the composite will
act in an almost perfectly elastic manner. The fibres may straighten under load, the
composite may slip in its anchorage and there is a possibility that relaxation stress relief
of the polymer matrix can continuously load the fibre even after the external load is
released (Karbhari, 1997) [4].
2.5.4 Stress-Rupture/ Stress Corrosion
Carbon fibre is relatively unaffected by this phenomenon at stress levels up to
80% of ultimate. Premature failure can be caused by the matrix being adversely affected
by stress either with or without a hostile environment.
Glass and aramids fibres are susceptible to both stress rupture and stress
corrosion, which can lead to premature failure under load. The quality of the matrix
system used has a significant effect on the attack by alkalis, for example polyester and
vinylester resins are more susceptible to chain scission (cutting or breaking) by hydroxyl
ions because they contain ester linkages. Epoxy resin based composites, which do not
contain these linkages, may be 2 to 4 orders of magnitude more durable.
2.5.5 Wet Behaviour
The resin matrix will absorb water. The amount of water is dependent on the
resin type and water temperature. There are usually two immediate effects of water
absorption on the matrix, first, lower the glass transition temperature (Tg) and the latter

resin loses stiffness. Both of these effects are partially reversible in epoxy resin systems
when the water is removed from the matrix by drying. With polyesters and vinylesters,
the changes can be either reversible or not, depending on the time and temperature of the
exposure.
Epoxies have no ester linkages in their structure, thus the polymer chain is not
easily hydrolyzed 1- water exposure, vinylesters and polyesters, as their names imply,
have these linkages and thus can be permanently damaged, particularly by high
temperature water immersion. Damage to fibreglass/ epoxy laminates may be caused by
the intrusion of moisture to the resin fibre interface. Such intrusions may break the 1-
Hydrolysis is a form of scission where ester linkages C-O-C are split by water to form
Hydroxyl groups (-OH) at the ends of the split chains. Further, the presence of moisture
can leach sodium and other metallic ions from the glass causing strength loss over time.
Moisture is thought to gain access into the FRP by three mediums, namely:
• By capillary action along the longitudinal axis of the fibre at the resin fibre
interface.
• Through crack and voids in the structure.
• By diffusion through the matrix.
Factors 2 and 3 are demonstrable while factor 1 has been debated in the scientific
literature. That there is water present at the glass –resin interface is not in question. How
it comes to be present is the issue. The surface of glass fibres is highly processing by
some accounts up to 8 molecular layers thick. Aramid fibres absorb up to 13% by weight
moisture, which can have a deleterious effect on tensile strength and can affects the resin
fibre interface. Carbon fibre is relatively inert to water and the only effects on carbon
laminates are the effects of moisture on the resin matrix. As alluded to the above, the
higher the temperature the faster and more severe the permanent affects of moisture
intrusions become. Chemical reactions roughly double in speed for each 10°C increase
in temperature.

2.6 Concrete
Concrete is composed of crushed stone, sand, Portland cement and water. When
these materials are mixed together a plastic mass is formed which may be placed in a
box and compacted in it. After a period the box may be stripped to reveal a block of
hardened concrete having the same shape as the interior of the box into which it was
placed [12].
2.6.1 Portland Cement
The fundamental property of Portland cements is that when it is mixed with
water, chemical reactions (called hydration) take place, which change the structure of
the plastic mass whereby it becomes hard and rigid [12]. This chemical reaction does not
rely on the absorption of carbon dioxide will take place under water.
2.7 Hardened Concrete
2.7.1 Water: Cement Ratio Law
Duff Abrams in the U.S.A. stated the first fundamental law, which is the basis of
all concrete technology; this is the famous water: cement ratio law, which may be stated
as follows:
“For the same materials and conditions of test, the strength of fully compacted
concrete depends only on the ratio of water to cement used in the mix.”
The relation between 28-day compressive strength and the proportion of cement
to water in the mix is shown in Figure 2.3, for weigh batching and for volume batching.
This applies to ordinary Portland cement, average aggregates, reasonable site control and

standard test procedure. In practice, the test result show considerable scatter and the
curves on Figure 2.3 give the “minimum strengths” which may be expected at the
various cement: water ratio by mass.
Figure 2.3: Relation between cement: water ratio and minimum 28-day compressive
strength of concrete [12]
2.7.2 Gain in Strength with Ages
As the chemical reactions of hydration proceed, the strength of the concrete
increases. The strengths at the various ages are referred to the strength developed at 28
days as 100%. The criterion of 28-days age was chosen arbitrarily and was adopted by
early designers on the basis that it was desirable to load the structure about four weeks
after the concrete had been placed.
Working stresses used by the design engineer are based on the strength at 28
days. At this age the concrete has reached a high proportion of its potential strength. The
diagram is based on the compressive strength of standard concrete test cubes. So long as
water is present the concrete will continue to gain strength and may be 20% higher than
the 28-day strength at 3 months and 30% higher at 6 months.
0 1
10
20
30
40
1.2 2.4
Probable min 28 day strength MPa
Weigh Batching
Volume Batching
2.8 Factors Affecting Concrete Strength
2.8.1 Compaction
The relation between strength and water: cement ratio is applicable only to
concrete, which can be fully compacted with the available equipment. In badly
compacted concrete there are air voids and spaces, which obviously reduce its strength.
It is obvious that the elimination of voids by proper compaction is as important in
securing good quality concrete as close control of the water: cement ratio. This was
recognized by Duff Abrams and mentioned in his original paper on water: cement ratio.
Dry mixes of low workability cannot be consolidated by hand methods
(damping, ramming, rodding and spading) and vibrators must be used. Vibration makes
the concrete fluid so that it flows into the corners and round the reinforcement, and
allows air to be expelled. Mixes of high workability should not be vibrated because
vibration is liable to cause segregation. When vibrators are used it is imperative that
adequate stand-by equipment is ready for immediate use in case of breakdowns.
2.8.2 Curing
As has been stated, the hardening of concrete is due to the chemical reaction
between cement and water; if there is no water present the chemical reaction cannot
proceed. Therefore, when concrete is allowed to dry out, the chemical reaction of
hydration stops, the hardening process stops and there is no further gain in strength.
Concrete must be kept continuously damp and the procedure for doing this is known as
curing or damp curing. The effect of reducing the damp curing period is shown on
Figure 2.4. The time taken for a structural member to dry out will vary with ambient
conditions of temperature, humidity and wind, and also with the shape and size of the
member. Thin floor slabs are particularly vulnerable and, as with plaster and floor
screeds, the loss in strength can be particularly severe if curing is not maintained.

Figure 2.4: Effect of duration of damp curing on the strength of concrete (thick section)
[12]
Curing may be achieved by:
a) Retaining the forms in position in beams, columns, soffits etc.
b) Ponding with water on large, level exposed surfaces.
c) Covering with sand, hessian etc., and keeping moist by spraying with water.
d) Spraying the uncovered surface with water at frequent intervals.
e) Precast units may be submerged in water.
f) Covering with waterproof paper or plastic sheeting.
g) Spraying the surface with a curing compound. (In the last two methods, no water
is added but evaporation of mixing water is prevented)
2.8.3 Temperature
Most chemical reactions proceed more rapidly at higher temperatures. The
hydration of cement follows this rule and consequently concrete gains strength more
rapidly when the curing temperature is increase. On the other hand, the gain in strength
is slower when the curing temperature is reduced. During cold spells it is advisable to
place concrete on a rising temperature, not when the temperature is falling.

2.8.4 Heat of Hydration
As with many other chemical reactions, heat is generated when cement hydrates.
This is useful in cold weather concreting because once the hydration has started the heat
generated will compensate for the heat lost from exposed surfaces and through the
shutters.
In large mass concrete dams the heat of hydration causes a rise in the
temperature of the concrete because the rate of heat generation is greater than the rate at
which it is dissipated to the atmosphere on the surface. Internal stresses may be created
in the concrete, which might cause cracking in the structure. For such conditions, low
heat cements are used the concrete mix is designed to have a low cement content.
2.9 Modulus of Elasticity
The stress-strain relationship for concrete is not linear, but the portion of the
curve at low stresses may be regarded as being linear and the modulus of elasticity
determined from it. The modulus of elasticity of concrete, Ec, may be taken as 20 GPa
for most design purposes.
2.10 Tensile Strength
The tensile strength of concrete is very much lower than the compressive
strength and, although there is no direct relationship, the strength in tension if often
assumed to be one tenth (1/10) that in compression. Concrete has a brittle type of failure
and consequently the use of plain (unreinforced) sections could be dangerous if high
tensile stresses occur. The compression strength and tensile strength of concrete are as
below:

MPacc 6040/ −=σ (Compressive strength)
( ) MPaMPatc 646040101
/ −≈−=σ (Tensile strength)
2.11 Literature Review on Bonded Joint
The literature review focuses on theory and mechanism of adhesive bonding,
joint design, mechanism of bond failure, formulation of bond strength, force transfer and
local shear stress distribution.
2.12 Bonded Joint Definition
Adhesive joint is the process of uniting material such as adherend with the aid of
an adhesive, a substance that is capable to hold such materials together by surface
attachment. Generally, as from its definition, bonded joint where the surface are held
together by means of structural adhesive. This type of joint must satisfy all these
following conditions to meet the purpose;
• The adhesive should not exceed it allowable shear stress. The performances of
the joint depend to the adjustment of the maximum shear stresses to be less than
the joint shear strength.
• The adhesive also not exceed an allowable tensile (peel) stress.
• The adherend is not exceed the through thickness tensile stress allowable
• The adherend must not exceed the allowable in-plane shear stress.
Typically, one or more of the three conditions above will become critical before
in-plane shear stress limit in the adherends exceed.

2.12.1 Advantages and Disadvantages of Bonded Joint
In respect to the adhesive or bonded joint system, advantages and disadvantages
offered by the system are described as follows:
1) Advantages
• Allows fabrication of smoother parts.
• Permits use of lighter weight materials which can minimizes the stress
concentration.
• Joints different type of substrates.
2) Disadvantages
• Required suitable curing temperature, pressure and time to reach the maximum
bond strength.
• Sensitive to aggressive environmental conditions such as in dry and wet cycles.
• The bonding process preparation is very critical and need to follow strict
procedure.
• Difficult in accessing the bonding characteristic at site.
• Bonding inspection and measurement is relatively expensive.
2.13 Mechanism and Bond Models.
2.13.1 Mechanical Interlocking Model
This oldest adhesion theory considers adhesion to be result of the mechanical
interlocking of polymer adhesive into the pores and other superficial asperities of
substrates. The roughness and porosity of substrates (adherend) are generally the factors
as wet ability by the adhesive is sufficient shown in Figure 2.5[A]. Otherwise, the non-
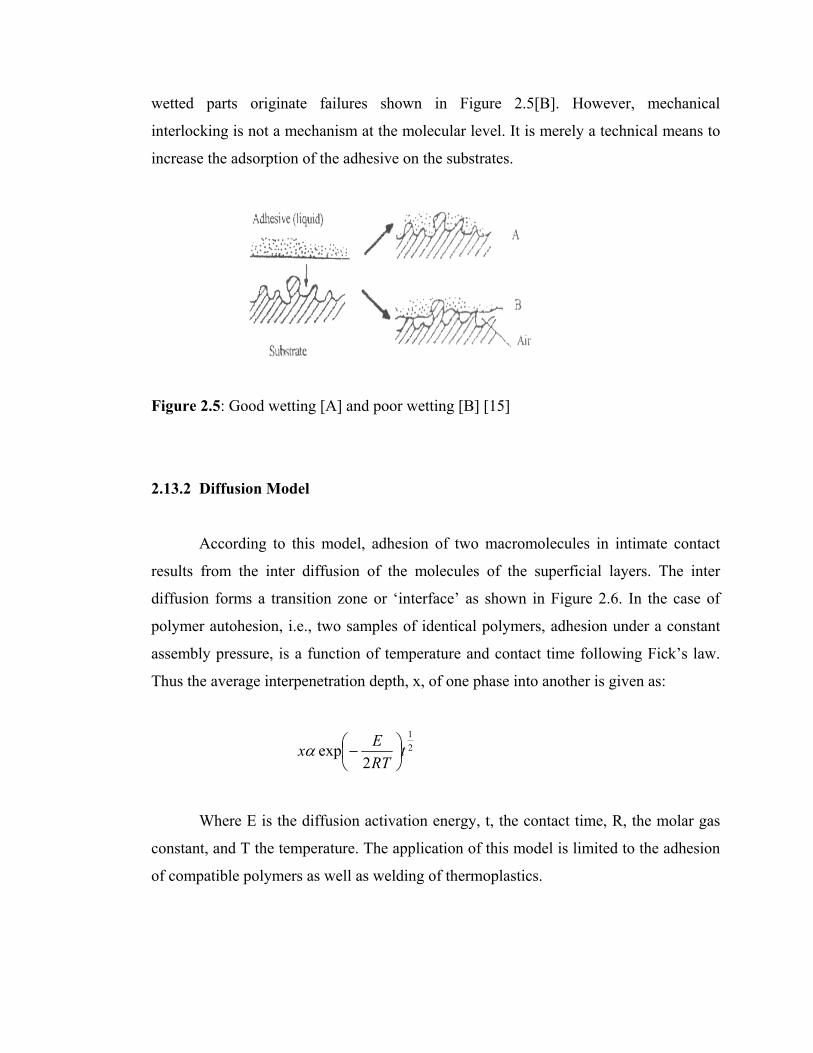
wetted parts originate failures shown in Figure 2.5[B]. However, mechanical
interlocking is not a mechanism at the molecular level. It is merely a technical means to
increase the adsorption of the adhesive on the substrates.
Figure 2.5: Good wetting [A] and poor wetting [B] [15]
2.13.2 Diffusion Model
According to this model, adhesion of two macromolecules in intimate contact
results from the inter diffusion of the molecules of the superficial layers. The inter
diffusion forms a transition zone or ‘interface’ as shown in Figure 2.6. In the case of
polymer autohesion, i.e., two samples of identical polymers, adhesion under a constant
assembly pressure, is a function of temperature and contact time following Fick’s law.
Thus the average interpenetration depth, x, of one phase into another is given as:
21
2exp t
RTEx ⎟
⎠⎞
⎜⎝⎛−α
Where E is the diffusion activation energy, t, the contact time, R, the molar gas
constant, and T the temperature. The application of this model is limited to the adhesion
of compatible polymers as well as welding of thermoplastics.

Figure 2.6: Inter diffusion across the interfaces [15]
2.13.3 Model of Weak Boundary Layer
Bikerman [15] showed that, in the separation of an assembly, the propagation of
the failure is very unlikely to take place exactly at the interface. The fracture is, in fact,
cohesively propagated in either solid in contact. Thus, whatever the mechanism
governing the assembly formation, the strength of the assembly only depends on the
bulk properties of the adherends.
Bikerman also indicated that another failure mechanism might occur when the
fracture moves forward in a weak interfacial layer located between two materials. Figure
2.7 illustrates graphically the seven classes of weak boundary layers that were
considered by Bikerman. The Bikerman model is simple, but was criticized in the past. It
is now, admitted that many cases of poor adhesion can be attributed of these weak
interfacial layers. Model of weak boundary layers. The seven Bikerman classes, (1) air
pores, (2) and (3) impurities at the surface, (4) to (7) reactions between components and
medium.
Interface

Figure 2.7: Seven classifications of weak boundary layers [15]
2.14 Bonded joint configurations
The joint using adhesive must be carefully designed and prepared. The aim of the
joint is to obtain maximum strength for a given bond area. In designing adhesive joint
the basic characteristics of adhesives must dictate the design. The type of joints used in
adhesive-bonding flat adherends is shown in Figure 2.8.
Figure 2.8: Type of joints used in adhesive-bonding flat adherends.(7)
Air pore Impurities Reactions

2.15 Terminology and Hierarchy of Connection Design.
Figure 2.9: Design procedure of adhesive joint flowchart (1)

Referring to EUROCOMP design code and handbook, the procedure of joint
design should follow the flow as shown in Figure 2.9. The process starts with
recognizing the joint requirements such as to support and distributing the internal forces
and moments then followed by selecting the joint category. This step is usually
determined by loads that need to be transferred, or by the required joint efficiency as a
fraction of the strength. The geometry of the member to be joint, suitability of the
fabrication, component dimensions, manufacturing environment and number of
components to be produced must also be considered. Another important factor effecting
joint durability are service environment and the lifetime of the structure, requirements
set for the reliability of the joint, and disassembly or not, weather tightness, aesthetics
and cost.
The third step is selecting the joining technique. They are three most common
methods usually applied namely;
• Mechanical connections: bolted and riveted joints (shear loaded fastener), bolted
and riveted joints (axially loaded fasteners), clamped joints, threaded, contact
joints, strap joints and embedded fasteners.
• Bonded connections: adhesively bonded joints, laminated joints, molded joints,
bonded insert joints and cast-in joints.
• Combined connections: bonded-bolted joints and bonded-riveted joints.
Finally, the selection of joint configuration must be made. Typical of joint
configurations and loading within each joining technique are illustrated in Figure 2.10
[1]:

Figure 2.10: Loading modes or type of stresses.
2.16 Loading modes
In bonded joint [1], there is four main loading modes may occur and they are as
follows:
• Out-plane loads acting on a thick adherend produce peel loads.
• Tensile, torsional or pure shear loads imposed on adherends produce shear
stresses.
• Out-of-plane tensile loads produce tensile stresses
• Out-of-plane tensile loads acting on stiff and thick adherends at the end of the
joint produce cleavage.
Simultaneously, the joint typically loaded by several of these load components.
Using this joint, the tensile, cleavage and peel loads should be avoided because it will
effect the joint connection. While the adhesive layers of bonded joint should primarily

be stressed in shear or compression. The strains (deformation) should also be considered
at the area where non-linear behavior of adherends or adhesive is expected.
2.17 Failure Modes
There are three primary failure modes [1] that can be seen on bonded joint failure
namely;
• Adhesive failure that means a rupture of an adhesive bond, such that the
separation is at the adhesive- adherend interface. This failure is mainly due to a
material mismatch or in adequate surface treatment, so should be avoided.
• Cohesive failure of adhesive means that when the adhesive fails due to loads
exceeding the adhesive strength.
• Cohesive failure of adherend means that when the adherend fails due to loads in
excess of the adherend strength.
Figure 2.11 below shows the typical locations of possible failure initiation and critical
strength.
Figure 2.11: Areas of failure initiation and critical strength.

When the connection (single/double-lap and single/double strap) loaded with in-
plane loads, the concentration of stress failure exist at the ends of the over lap. Figure
2.12 shows the shear stress distribution. The location where high shear stresses occurred
can be said as the failure initiation.
Figure 2.12: Stress distribution of lap joint.
2.18 Joint Geometry Effect on Joint Strength
The joint strength also affected by the joint geometry with certain configuration.
The most basic problems of bonded joint are the unavoidable shear stress concentrations
and inherent eccentricity of the forces. The two problems causing peel stresses in both,
adhesive and adherends. From Figure 2.13, it can be seen that the shear stresses are
maximum at the end of the overlap.

Figure 2.13: A typical adhesive shear stress distribution in a lap joint according to
elastic-plastic model.
The effects of the eccentricity are the greatest in lap and strap joints. It should be
known that the static load-bearing capacity of a bonded lap or strap joint cannot be
increased significantly by increasing the lap length beyond the minimum needs. But, the
bond length must long enough to provide a moderate loaded adhesive area in the middle
to resist creep deformations of the adhesive.
The peel stresses can be reduced by increasing the adherend stiffness without
increasing its thickness, increasing the lap length, tapering the ends of the adherends and
using adhesive fillets. Adhesive fillets used and adherend ends tapered will reducing
stress concentrations at the end of the overlap [1].

2.19 Adherends
The through thickness properties of the adherends must also be considered.
Beside that, delamination due to peel and interlaminar shear stresses should be given an
attention especially for highly orthotropic unidirectional materials [1]
2.20 Surface Treatments
Adherend surface treatment is greatly important because it will affect an
adequate joint strength and produce bond failure. So, all the bond surfaces shall be
properly treated prior to bonding and adhesive application procedure purposed by the
supplier must strictly follows.
2.21 Bonded Joint Design Principle
In general, the loads imposed on the bonded joint structure must be obtained
from the whole structure analysis. Besides, the bond line must ensure capable to transfer
the applied loads between the joints members. While the adherends are capable of with-
standing, the joint induced internal loadings. The evaluation of the basic components
strength which to be joined under the applied external loads is a part of the component
design process. (1)
The experimental specimen which will be tested is designed based on analytical
models for plate-to-plate connection and supplemented by testing. The assumption made
that the joint is a perfect bonding between the adhesive and the adherends. This means,
there are no slip occurred along the bond area and the force applied were transferred
uniformly to each part of the adherends. It is shown that from the failure of cohesive in
the adhesive or adherend always occur before the adhesive failure at the interface. If the

following have occurred, the assumption may become invalid; so must be considered
properly.
• Non-suitable chemical of the adhesive and adherends. The adhesive cannot
provide a good bonding and high strength needed. Besides, the adhesive will
give a chemical reaction between the adhesive matrix and the adherends matrix.
• In adequate surface treatment. For examples, the surface is not roughen perfectly,
the surface of bonding area is contaminated and not fully degrease by the
solvent, the pressure applied while bonding is also not enough.
• Environment factors such as temperature and pressure during bonding. The
bonding process should not been done during high humidity where the water will
dissolved between the adhesive pore and will effect the bond strength. There
must be enough time for the adhesive to cure and should be applied on suitable
dry controlled environment.
Referring from the testing of the specimen, it is a perfect bonding if the failure
mode is not an adhesive failure. If the slip occurred, the surface treatment should be
improved or the adhesive or a joint configuration shall be changed. The design of
bonded joints shall be based on practically and tolerances of the manufacturer.
Referring to the Figure 2.14, it can be seen that the different type of joint has it
own mode of failure. For double strap joint, the major problem occurs is peel failure if
compared to the others joint technique likely to have shear failure.

Figure 2.14: Relative joint strength of various joint configurations. (1)
2.22 Adhesive
There are a few ways that the adhesive have been categorized, such as:
• Adhesive type: this factor divide the adhesives based on the polymer type
whether it has thermo set (infusibility and insoluble after curing) or thermoplastic
(fusible and soluble and soften when heated) base.
• Curing process activation; whether it chemical, solvent, heat or other activation.
• Curing process requirements; it looks at curing temperature and cycle, curing
pressure and cycle or post-curing.
• Form of adhesive; the form of adhesive whether paste, liquid or film.

2.22.1 Adhesive Mechanical Properties
In applications, there are few important mechanical properties have to be given
full attention and understood;
• shear modulus
• shear strength
• maximum shear strain
• tensile modulus
• tensile (peel) strength.
All the properties should be obtained from the manufacturer or by testing.
Consideration of environmental factors, such as temperature, moisture and chemical
among the factors will affect the mechanical properties of the bond characteristics. From
the Figure 2.15, it can seen that the adhesives have either ductile or brittle behavior and
should be also considered when the joint is applied. Referring at creep property,
adhesives will creep under constant load even at the room temperature especially at
elevated temperature. Usually, thermo set adhesives have better creep resistance than
thermoplastic adhesives.
Figure 2.15: Typical brittle and ductile adhesive behavior. (1)

2.23 Elastic Properties and Deformation
Figure 2.16 shows the schematic figure of a single-lap joint with uniform lap
thickness loaded in tension. Assuming the double lap joint deform as single lap joint
configuration, theoretically the deformation and its failure occurred as shown in Figure
2.16. The upper and lower part represent as an adherends while adhesive in the middle.
The members deform concentrically and the adhesive in shear when load applied. There
are two type that the specimen can be categorized; rigid members and elastic members.
If the members were rigid, equal amount of load would transfer along the adhesive, and
the shear deformation would be equal in all part of adhesive.
Figure 2.16: Deformation of rigid members. (1)
In reality, the members are always have elasticity and will deform continuously
through their lengths. The greater amount of load were transferred at the load ends of the
overlap mean by the higher displacement between the members occurs as shown in
Figure 2.17.
Figure 2.17: Deformation of elastic members. (1)

The strength of the joint is depending on the yield strength of the adherend, its
modulus and thickness. The thickness of the adhesive bond is important. The layer must
be as thin as possible to avoid joint starvation. The analysis of the durability of joint
related to a few matters:
• Type of adhesive: Different adhesive provides different bond strength and
characteristic. The selection of the adhesive should be done carefully based on
the type of joint, strength needed, and the materials to be connected and
considering the application.
• Adherend used: The adherends be used should be suitable and to the adhesive.
Each adherend has it own properties that will provide different durability.
• Adherend preparations: Adherend should be prepared follows the correct
procedure to give the good adhesion and absorption by the contact between
adherend and the adhesive.
• Curing process; temperature and pressure: The adhesive only will give high bond
strength if completely cured. To reach this situation, the bonding needs enough
setting time, dry and clean environment and suitable curing temperature.
Uncompleted curing process can cause slipping problems of the adherends.
• Adhesive thickness: The thickness of the adhesive should be controlled; not to
thick or less. Thick bond layer will create an unexpected force and moment.
Besides, it will risk a peel failure. The less thickness could caused lower strength
of bonding and easily fractured.
2.24 Design Procedure for Tensile Shear Loading
This is the procedure need to be followed for designing double-lap joints which
loaded by tensile shear loading by referring to Eurocomp, the following steps and
formulation used as standard guidelines in designing double-lap joint of FRP-concrete.

Step 1
Figure 2.18: Half lap length (c) as a function of parameter β/t
Firstly, determine the lap length (L = 2c) using a standard graph of C versus B/t
shows in Figure 2.18. Parameter β/t is defined from the equation (2.1):
a
a
EttG
t8
=β ............(2.1)
where;
Ga = adhesive shear modulus (N/mm2)
E = adherend Young’s modulus (N/mm2)
t = minimum adherend thickness (mm)
ta = adhesive layer thickness (mm)

Step 2
To calculate the maximum adhesive shear stress for double-lap joint, the equation (2.2)
is used:
⎥⎦
⎤⎢⎣
⎡Ω+=
)cosh()sinh(
)sinh()cosh(
4max cc
ccP fk
o λλ
λλγλ
τ .........(2.2)
where
⎟⎟⎠
⎞⎜⎜⎝
⎛+=
iiooa
a
tEtEtG 212λ
and
Pk = characteristic load per unit width
Ω = the greater of ( 1 – Ψ )/( 1 + Ψ ) or ( Ψ – 1 )/( 1 + Ψ )
where
oo
ii
tEtE
2=ψ

Step 3
The magnitude of the adhesive shear stress maximum value is determined by ;
oallowableo ττ ≤max
where
m
kooallowable γ
ττ ,=
2.25 Factors Considered in Designing Adhesive Bond Joint
It is really need to give an attention to a few factors to make an appropriate and
effective adhesive bond joint. Basically, it towards to four main points, the material
involved the job requirement, the job design and cost. The sub-factors are referring to:
• Type of material to be joined
• Hardness conditions and surface finishes
• Adherends thickness
• Part function
• The temperature range that the joint or assemble must be able to withstand
• The temperature of environment for most of service life and time period
• Test referred
• Contamination in contact to the bond (solvents, oil and other fluids); the
temperature and exposure type
• Electrical continuity
• Required joint strength
• Stress withstands (tensile, shear, peel, compression, impact, vibration and etc.)
• Tolerance of temperature and pressure of bonded part.(1)

2.26 Lap Joints
This is the most common adhesive joints configuration. It is simple to make, can
be used with thin adherends and stress the adhesive in its strongest direction. The lap
joint, however, is offset and their shear forces are not in line, as shownin Figure 2.19. It
can be seen the stress is concentrated at the ends of the lap. The greater part of the
overlap (adjacent to the center) carries a comparatively low stress. If the overlap length
is increased by 100%, the load carrying capability is increased by a much lower
percentage. The most effective way to increase the bond strength is to increase the joint
width. In addition to overlap length width and length, the strength of the lap joint is
dependent on the yield strength of the adherend. The modulus and the thickness of the
adherend determine its yield strength, which should not exceed the joint strength.
Figure 2.19: Tensile force on sinle-lap joint showing (a) unloaded joint, (b) joint under
stress, and (c) stress distribution in adhesive [11]

Figure 2.20: Exaggerated deformation in loaded single lap joint showing the
adhesive shear stress, τ and the adherend tensile stress, σ (a) with
rigid adherends, (b) with elastic adherends [11]
Consideration has to be done for the interpretation of the results between rigid
and elastic adherends. Rigid adherends create constant shear lap strength along the
thickness of the adhesives, while elastic adherends create a variable stress (Fig. 2.20).
2.27 Mechanism of Bond Failure
Failure of adhesive can occur in three different modes.
2.27.1 Failure at Interface (An Adhesive Failure) [16]
This may arise through failure of an interlayer between the parent adherend
material and adhesive (an oxide coating or primer layer) or through failure of the
adhesive to bond to the surface. In practice, the interface is not flat and the surface
topography acts to create a layer where there is both adhesive and adherend present. The
complexity of the layer militates against modeling at this level in any detail. However,

the purpose of the layer is to transfer normal and shear loads between the adherend and
the adhesive and its effect on joint performance (other than failure) is negligible.
2.27.2 Failure in the Adhesive (A Cohesive Failure)
Cohesive failure occurs through excessive strain with the adhesive material and
may occur anywhere within the adhesive layer. Stresses and strains peak at the ends of
the overlap however and generally close to an adherend. The various mode of failure are
illustrated in Figure 2.21.
Figure 2.21: Cohesive and adhesive bond failure [14]
2.27.3 Failure in the Adherend [16]
This will arise through excessive strain within the adherend material and is more
common for brittle materials. In particular, joints made with adherends of fiber
reinforced composite material and toughened adhesive initially fail by adherend failure,
usually delamination of ply closest to the adhesive.

2.28 Environmental Effects on Adhesive Bonded Joints
The effect of exposure condition on CFRP and concrete such as moisture
absorption is studied. This chapter is divided into four sections, namely, Theory of
Moisture Diffusion, Effects of Moisture Absorption on FRP Materials, Effects of Water
Absorption on Adhesive Bonding, and Past Research Review.
2.29 Environmental Durability of Adhesive Joints
The environmental resistance of any bonded assembly FRP system depends on
the durability of the individual components materials, as well as on the bond between
them. For example, in the use of FRP materials for external strengthening of concrete,
the individual components are the concrete, the fiber reinforced polymer composite and
the adhesive, which is usually an epoxy. The long-term integrity of bonded joints
implies both chemical and mechanical durability under varying temperature, moisture
and other environmental factors, which for external purposes may include spray from
de-icing salts or from the sea. Adhesive bonded joints with equivalent bond strength
values in short-term static tests may differ markedly with respect to the durability.
The measured residual joint strength after environmental exposure is a function
of change in the cohesive properties of the adherends and in the adhesion between the
adhesives and the adherend. Therefore, joint durability demands a three-fold
consideration of the structural integrity of the cured adhesive, the adherends and the
environmental stability of the interface.

2.29.1 Environmental and Service Conditions
The bonded joints used in a civil engineering environment may be subjected to a
variety conditions. The normal service conditions to be considered are shown as follows;
• Temperature fluctuation
• Moisture (humidity, liquid water, salt spray)
• Chemical attack (oil, fuel, chemical spills)
• Fire
• Loads (dynamic and static)
These service conditions should be considered in conjunction with the loading
conditions, which, for bridge strengthening, relate primarily to peak short term static
loading. Sustained loading (leading to creep), fatigue and impact may also need to be
considered.
2.29.1.1 Resistance to Temperature
It has been established that water, in liquid or vapour form, represents one of
the most harmful environments for bonded joints (Kinloch,1993). This problem is that
water is found universally and the polar groups that confer adhesive properties make the
adhesive inherently hydrophilic. High energy of substrate surfaces is also generally
hydrophilic. For example, concrete itself is susceptible to the effects of moisture. The
properties of the matrix resin in FRP materials, together with the properties of adhesives
are susceptible to the effects of heat and moisture. The result of moisture absorption,
which is reversible, is to lower the glass transition temperature (Tg) of these materials,
leading to the change in their mechanical properties. The effect of elevated temperature
is to reduce the strength and modulus of polymers: the Tg of the adhesive is likely to be
rather less than that of the matrix resin, so that the adhesive is the governing factor.

2.29.1.2 Resistance to Moisture
Adhesive bonded joints are generally attacked by exposure to moisture and
elevated temperature. In a well mode joint where a sound bond has been achieved, the
main effect will be on the adhesive layer. A small amount of moisture-induced
plasticization of the adhesive in highly stressed regions may actually be beneficial in
reducing stress concentrations. However, a small reduction in joint strength should
normally be anticipated in relation to the effects of environmental conditions on the
adhesive itself.
2.29.1.3 Resistance to Chemical Attack
The resistance of connections to chemical attack depends upon the nature of the
liquid and its effects on both the composite components and the adhesive. Alkalis can
cause severe matrix resin softening with a consequent effect on any form of connection.
Isophtalic polyesters provide better resistance than orthophthalic polyesters in terms
alkalis and organic solvents and are to be preferred for the majority of glass fiber
reinforced plastic (GFRP) components. FRP components made with vinyl ester resins
are still better, but a little more expensive. Epoxy materials, both as the matrix resin and
as adhesives, are regarded as very inert in acids and alkalis.
2.29.2 Resistance to Fire
The resistance of joints to the effects of fire implies consideration of the entire
FRP structure, and a useful commentary is contained in the EURO COMP Design Code
(Clarke, 1996). FRP materials and adhesives are very poor conductors of heat, which is
an advantage over metals, but they can also possess a large coefficient of thermal
expansion in directions that they do not have a significant amount of continuous fiber
reinforcement. The effect of dimensional changes of the components and joints directly

affected by fire or heat should therefore be considered. Adhesive are weaked by
influence of elevated temperature and may burn if exposed directly to fire.
2.30 Factors Affecting Joint Durability
The main factors that influence joint performance and durability are briefly
described as follows;
2.30.1 Adherend Type and Nature
One of the most important factors in joint durability is the environmental
stability of the adhesive-adherend interface [4]. Changes in the adhesive and the
adherend can be allowed for changes in adhesion. Thus, optimization of surface
conditions and pretreatments often represents the key to minimizing joint durability. If
properly prepared, the surfaces of both concrete and FRP materials are relatively stable
and the durable bonds with epoxy adhesives are formed relatively easy. This is in
contrast to the situation with the steel plate bonding, for which an adequate standard of
surface preparation for mild steel surfaces is quite hard to achieve in practice.
Furthermore, the surface of steel is fairly unstable, especially in the presence of
water, such that bonds to the oxide layer are susceptible to degradation. The substitution
of FRP materials for steel strengthening is motivated in a large part by the assurance of
superior bond integrity.
2.30.2 Adhesive Type/ Cure Cycle
The adhesive system selected is clearly very important. Generally a two-part cold
curing paste-epoxy material is used without a primer. However, sometimes a primer may

be required for substrate surfaces to ensure satisfactory adhesion. Conceptually,
adhesives represent natural candidates for joining FRP materials because they are often
similar in composition and nature to the composite matrix resin. The fundamental
concepts involved in adhesive selection are that it should:
• Adhere well to the surface involved
• Exhibit low permeability to water
• Posses appropriate physical and mechanical properties
2.30.3 Quality of FRP Material
The quality of the FRP material itself should be high for several reasons. These
include the need for reproducible and predictable properties (for design and prediction
purpose), flatness (to ensure uniform bonding and bond line thickness) and excellent
consolidation (to reduce permeability and mechanical weakness). A poorly made
composite will give raise to durability problems sooner or later.
2.30.4 Bonding Operation
The bonding operation, including protection of the working environment, is
important to give a high quality of joint. Trained operatives working under skilled
supervision should ensure that the surface preparation, adhesive application, temporary
clamping arrangements and adhesive curing details are handled adequately. Poor control
of the bonding operation generally manifests itself subsequently in joint performance
and durability problems.

2.30.5 Joint Design
Joint design has an important bearing on joint durability. The joint design
concepts are allowed for a large bond area and to avoid unacceptable large stress
concentration in the joint. The synergistic effects of high temperature, excess moisture
and applied stress normal to the bond line are undoubtedly detrimental. Joint design
should therefore seek to minimize the buildup of stress concentrations which give raise
to indirect peel and cleavage loads at adherend/ adhesive interface.
2.30.6 Exposure Conditions
Experience with structural adhesive bonding has shown that the mechanical
properties of bonded joints often deteriorate under warm and wet conditions. (Bodnar,
1997; Kinloch, 1983). This is because the joints comprise either high energy substrates
such as metals, glasses and ceramics or else permeable substrates such as concrete and
timber (Venable, 1984; Mays and Hutchnson, 1992). Furthermore, failure at the
adhesive/ substrate interface, rather than the failure within the adhesive layer itself, is
commonly found only after environmental exposure.
2.31 Theory of Moisture Diffusion
Experimental studies have shown that FRP are exposed to moisture or chemical
solutions, free ions (i.e. OH- and Cl- ions) and water molecules would diffuse into the
fiber matrix system and react with the fiber or matrix, thus causing micro cracking and
fracturing of the matrix and loss in fiber cross-section. This would result in loss strength
and stiffness of the composite. The single free phase model of absorption (i.e. Fick’s
law) was used to simulate moisture diffusion into the rebar and tendon specimens. Fick’s
law assumes that molecules are not bound by material, and the driving force behind
diffusion is the ion concentration gradient. For example, tendon and rebar diffusion

specimens were 102mm in length with both ends epoxy-coated in order for diffusion to
occur only normal to the surface of the sample. (i.e. radial direction for cylindrical
specimen. In order to simplify the analysis, the following two assumptions are
introduced:
1. The radius to length ratio of test specimen is much less than one (i.e. r0 <<1)
2. The diffusivity inside the composite material is constant.
Diffusion specimens were oven dried at temperature of 65ºC until no change in
weight was observed. Then, they were immersed in solutions, and weight changes were
recorded using a Mettler Balance. The objective was to determine the percent weight
gain M (%) of the composite as a function of the square root of exposure time 21
)(t .
2.32 Free Phase Model (Fick’s Law)
The free phase model of absorption of Fick’s law can be written as:
tc
xcD
∂∂
=∂∂
²²
Where D is the diffusion coefficient (mm²/min), c is the ion concentration (mol/l)
at a distance “x”(mm) measured in the direction normal to the surface, and “t” is the
exposure time (min). A time dependent coefficient (G) can be related to the diffusion
coefficient, D by:
( )
( )∑∞
+
⎥⎦
⎤⎢⎣
⎡⎟⎠⎞
⎜⎝⎛+−
−=−−
=0 ²12
²²²12exp
²1
jhD
j
mmmm
G
t
im
i
π
πδ

Where “h” is the specimen thickness, mi, is the initial weight of moisture in the
sample, and mm is the weight of moisture when sample is fully saturated.
It is of interest to determine the moisture content as a percentage of weight gain
of the composite (M). Thus, M (%) is calculated as:
100(%) ×−
=d
d
WWW
M
Where W and Wd are the moist weight and the dry weight of the specimen,
respectively. The initial part of the M (%) vs. (t) 1/2 relationship is linear indicating
Fickian diffusion in samples, and after a period of time that is dependent on the type of
fiber, matrix material, temperature, and type of solution, the curve would level off
towards on asymptotic value corresponding to Mm at saturation. After an extended
period of time that is also dependent on the same aforementioned factors, a rapid
nonlinear increase in M with respect to (t) 1/2 occurs, indicating non-Fick’s diffusion
ceases to be valid. For a sufficiently short period of time, the diffusivity D can be
calculated from the initial linear part of the M vs. (t) 1/2 relationship as follows:
2
12
2
120 116
²⎟⎟⎠
⎞⎜⎜⎝
⎛
−⎟⎟⎠
⎞⎜⎜⎝
⎛ −=
ttMMMr
Dm
π
Where M1 and M2 are the percentage moisture content at times t1 and t2
corresponding to the beginning and end of the time interval, and ‘r0’ is the radius of the
test specimen.
It is important to determine the diffusivity D because it provides a direct measure
of moisture penetration, which can be used to determine the depth of the damaged zone
in which the matrix and fibers are assumed to no longer be able to transfer any tensile
forces. The depth of the damaged zone “x” due to alkali OH- and chloride Cl- attack can
be calculated from:
tCDx ...2=

Where C is hydroxyl or chloride ion concentration (mol/l). If the initial radius of
the sample is ‘r0’ (mm), the radius of the residual of the residual area is ‘rr’ (mm) and the
initial strength is Pu (kN), then the predicted residual tensile strength Pp (kN) is
calculated as:
2
0
2
0
1 ⎟⎟⎠
⎞⎜⎜⎝
⎛=⎟⎟
⎠
⎞⎜⎜⎝
⎛−=
rr
PrxPP r
uup
2.33 Effects of Moisture Absorption on FRP Components
Moisture is thought to gain access into FRP by three separate routes:
• By diffusion through the matrix resin
• By capillary flow along the longitudinal axis of the fiber at the fiber-resin
interface
• Through the cracks and voids in the structure
In general, the effects of exposure to moisture or aqueous solution are discussed in the
following section.
2.33.1 Weight Increase
Moisture absorption will caused weight gain of FRP material after certain
duration of exposure. An environmental durability testing was performed on Master
Builder. Inc. CF130/MBrace™ Saturant Epoxy carbon/epoxy composite system by
engineering and Technology Group, THE AEROSPACE CORPORATION, EISegundo.
MBrace™ [19] is a carbon/epoxy is a hand lay-up composite system that is fabricated in
–situ on the structure being reinforced or repaired. The results of the experiment are
shown in Table 2.5.

Table 2.5: Results of environmental durability testing [19]
Environmental exposure &
durations
Weight Change (%)
2 ply
(thickness: 1mm)
6 ply
(thickness: 3mm)
100% humidity/38ºC
1000 hours
2000 hours
10,000 hours
1.13
1.41
1.51
0.95
1.03
1.46
Salt water
Immersion at 23ºC
1000 hours
2000 hours
10,000 hours
1.14
1.24
1.48
0.65
0.88
1.37
Alkali solution
Immersion in CaCO3, pH= 9.5
and 23ºC
1000 hours
2000 hours
10,000 hours
1.24
1.27
1.31
0.44
0.88
1.37
It is observed that the CF130/MBrace™ Saturant Epoxy System had positive
weight changes; attributed to moisture absorption, after the humidity, salt water and
alkali exposures. Moisture exposure was higher for the 2-ply panels than for the 6-ply
panels. This is because the 2-ply panels equilibrated with the environmental more
rapidly than the thicker 6-ply panels. Figure 2.22 shows the moisture absorption curves
for the 10,000 hours. The plots show that 30-50% of the total moisture absorption
occurred in the first 20 days for all exposure conditions. Moisture absorption appeared to
reach saturation at 1.3-1.5% after approximately 150 days for the 2-ply panels. The 6-

ply panels were reaching this level of moisture absorption at the end of the 417-day
exposure.
Figure 2.22: Moisture absorption curves for 10,000-h panels for CF130/Mbrace
™Saturant Epoxy [19]
2.33.2 Plasticization of Matrix and Decrease of Glass Transition Temperature
In general, glass transition temperature (Tg) was increased by elevated
temperatures due to advancement of the cure state of the epoxy matrix and was
decreased by moisture absorption due to plasticization of the epoxy. The glass transition
temperature is the center of the temperature range in which a non-crystalline solid
change from being glass-brittle to being viscous. The results of durability environmental
testing on effects of moisture absorption on glass transition temperature are shown in
Table 2.6.
The Tg’s samples exposed to moisture were only 4-5ºC lower than those for the
control samples. For the exposures in which the material was exposed to heat and
temperature, the thermal effect dominated, and the Tg was increased. This indicates that
the Tg will probably increase in service relative to the control samples due to exposure to
summer temperatures. Thus, the baseline, dry Tg will probably be closer to 70ºC in

service and probably will not decrease below 65ºC even after prolonged moisture
exposure. The effect of temperature and moisture absorption is also demonstrated by
plots of Tg versus exposure time. It is observed that most of the reduction in Tg for these
exposure conditions occurred in the first 42 days (1000 hours). This is due to the fact
that most of the moisture absorption occurred this period. Initially, Tg increased in the
humidity chamber due to the elevated temperature, but with long term exposure to
humidity, there was a slight decrease. But, even after 10,000 hours in the humidity
chamber, Tg was higher than for the control panels. The competing effects of
temperature and moisture absorption are also demonstrated by plots of Tg versus
exposure day and weight gain shown in Figure 2.23.
Table 2.6: Results of environmental durability testing [19]
Environmental exposure & durations Glass Transition Temperature (ºC)
Control 67, 73, 67, 70
100% humidity/38ºC
1000 hours
2000 hours
10,000 hours
75
80
70
Salt water
Immersion at 23ºC
1001 hours
2000 hours
10,000 hours
65
71
63
Alkali solution
Immersion in CaCO3, pH= 9.5 and 23ºC
1000 hours
2000 hours
10,000 hours
65
73
62
Dry heat at 60ºC
1000 hours
3000 hours
84
91
20 Freeze/ Thaw Cycles 72

2.33.3 Reduction in Strength
The competing effect of moisture absorption is reduction in strength.
Environmental durability testing performed on Master Builders Inc.
CF130/MBrace™Saturant Epoxy carbon/ epoxy composite system showed that there is
reduction in strength of the samples after certain exposure durations. The results are
summarized as Table 2.7.
Figure 2.23: (a) Glass transition temperature versus exposure time (b) Glass
transition temperature versus moisture absorption [19]

Table 2.7: Result of environmental durability testing [19]
Environmental exposure
& durations
Tensile strength (ksi)
and % of reduction
compared to control
Short beam shear
strength (ksi) and % of
reduction compared to
control
Control 636 7.8
100% humidity/38ºC
1000 hours
3000 hours
10,000 hours
591 (7.0%)
540 (15.1%)
596 (6.3%)
7.6 (2.6%)
7.2 (7.7%)
6.9 (11.5%)
Salt water
Immersion at 23ºC
1000 hours
3000 hours
10,000 hours
619 (2.7%)
623 (2.0%)
610 (4.1%)
7.5 (3.9%)
7.6 (2.6%)
6.8 (12.8%)
Dry heat 60ºC
1000 hours
3000 hours
637 (0.2% increase)
582 (8.5%)
9.5 (21.8% increase)
8.6 10.3% increase)
20 Freeze/ Thaw Cycles 561 (11.8%) 7.5 (3.9%)
Moisture absorption caused small decrease in SBSS and moisture dry-out and
elevated temperatures caused increases in SBSS. The maximum decreases in SBSS were
around 10-15% after 417 days in salt water, the alkali solution or the humidity chamber.
The maximum increase was around 10-20% after the dry heat exposure. The beneficial
effect of the elevated temperature in the humidity chamber on Tg was not observed for
the SBSS data. Additional curing of the epoxy matrix did not diminish the degrading
effects of moisture absorption on SBSS.

2.34 Effects of Water Absorption on Adhesive Bonding
An experiment carried out by K.B. Armstrong on wedge testing adhesive bonded
joints made from dry, water immersed and dried, CFRP laminates based on Ciba
Fibredux 914 showed the effect of water absorption on CFRP bonded system. Five
groups of the samples were tested. The samples bonded with Hysol EA 9394 adhesive
were tested on dry, immersed and dried, with CFRP adherend using mechanical abrasion
as the surface preparation. Hysol EA 9390 repair resin was tested on abraded dry
samples and on dry, and immersed and dried, peel ply surfaces. The test method used
was the wedge test to ASTM D3762. From the result obtained, it is observed that the
long term durability of repairs to CFRP laminates based on Ciba Fibredux 914 should be
excellent if surface preparation and drying are properly carried out prior to bonding.
A research carried out by Department of Mechanical Engineering, University of
Sheffield [21] shows the influence of aggressive exposure conditions on the behaviour
of adhesive bonded concrete-GFRP joints. The details of materials geometry and
instrumented gauges used in test programme used in the experiment are shown in Figure
2.24:
Figure 2.24: GFRP-Concrete Bonded System Details [21]

There are two type of concrete mixture used in this study namely type A and B.
The typical longitudinal plate force transfer for concrete mix A and B are shown as
Figure 2.25 and Figure 2.26. From the figures, it is observed that the load transfer from
the plate to concrete at low loads are fairly linear, and occurs at a uniform rate, and this
is occurs at a uniform rate, between 50 mm and 100 mm.
Figure 2.25: Typical longitudinal plate force transfer for mix A: (a) control, (b) wet/dry
(c) freeze-thaw and (d) dual [21]
Figure 2.26: typical longitudinal plate force transfers for mix B: (a) control, (b) wet/dry
(c) freeze-thaw and (d) dual [21]

The transfer of the longitudinal force from the plate to the concrete creates shear
stresses both in the epoxy adhesive, at the concrete-adhesive and plate-adhesive
interfaces. The typical shear stress distributions for concrete mix A and B are shown as
Figure 2.27 and Figure 2.28. The overall trends shown by the data in Figure 2.27 and
Figure 2.28 is that at low plate load levels, the bond shear stress is maximum near the
free edge.
Figure 2.27: Typical shear stress distribution for mix A: (a) control, (b) wet/dry, (c)
freeze thaw and (d) dual [21]
Figure 2.28: Typical shear stress distributions for mix B: (a) control, (b) wet/dry, (c)
freeze thaw and (d) dual [21]

Figure 2.29: Relation between bond strength and compressive strength [7]
Another finding should be noted in Figure 2.29 is the increase of bond strength
with the increase of compressive strength of concrete. In other words, the bond strength
decreases with the decrease of the compressive strength of concrete. In case of concrete
deterioration, the decrease of compressive strength affect strongly on the tensile-type of
bond strength.
From the test, it is observed that, the failure of an adhesive bonded plate-concrete
joint subjected to a uniaxial tensile can occur in three ways: (a) ‘cohesive failure’ in the
adhesive layer (Figure 2.30a); (b) ‘adhesion failure’ (Figure 2.30b) and (c) ‘concrete
shearing failure’ (Figure 2.30c). Besides, it was observed that in specimens with
concrete mix A (strength lower than mix B) there were certainly more signs of ‘adhesion
failure’ than specimens with concrete mix B. This relatively more severe deterioration of
the interface with concrete mix A is primarily due to the strength of the concrete.
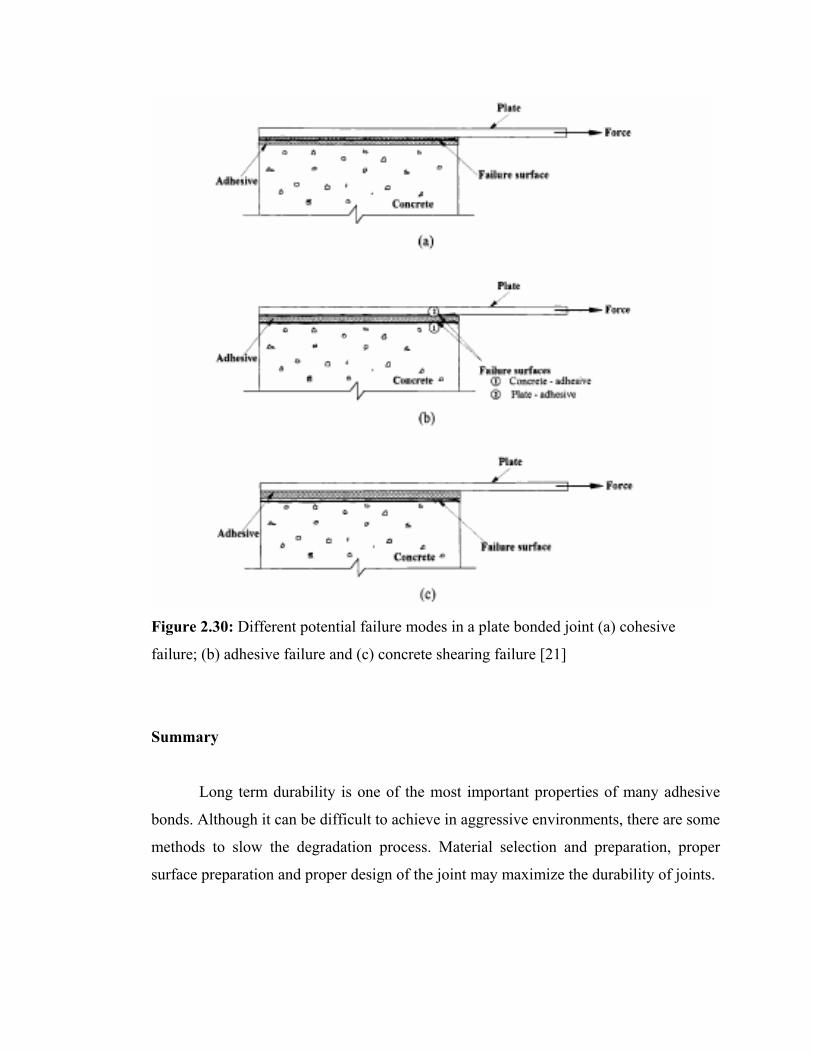
Figure 2.30: Different potential failure modes in a plate bonded joint (a) cohesive
failure; (b) adhesive failure and (c) concrete shearing failure [21]
Summary
Long term durability is one of the most important properties of many adhesive
bonds. Although it can be difficult to achieve in aggressive environments, there are some
methods to slow the degradation process. Material selection and preparation, proper
surface preparation and proper design of the joint may maximize the durability of joints.

The duration of the exposure indications that continuation of the exposure
regimes will lead to loss of the load capacity and failure. The bond strength increases
with the increase of compressive strength of concrete. The futures of FRP materials are
very bright. They offer inherent advantages over traditional materials with regard to high
strength-to-weight ratio, design flexibility, corrosion resistance, low maintenances and
extended service life.

100 mm 250 mm
CHAPTER III
EXPERIMENTAL SETUP
3.0 Introduction
The experiment setup chapter is divided into three sections, namely; Details of
Materials, Preliminary Test (Joint Properties of Mild Steel End Tab) and CFRP Plates
bonded Concrete Prism Pull-out Test.
3.1 Details of Materials
3.1.1 Concrete Prism
(b) Figure 3.1: (a) Concrete prism dimensions (b) A CFRP plate bonded to each concrete
prism

50 mm
390 mm
A total of three concrete prisms with the dimension of 100mm x 100mm x 250
mm were prepared. The geometry of the test samples used in this study is shown in
Figure 3.1. The concrete was designed to reach compressive strength 40 MPa at the age
of 28 days. The concrete was produced using maximum coarse aggregate size of 10 mm
with water cement ratio of 0.47. Superplasticizer was used to enhance the workability of
the fresh concrete.
3.1.2 CFRP Plate
The average thickness of the plate is 1.35 mm and the width is 50 mm shown in
Figure 3.2. The CFRP plate used consist of unidirectional carbon fibre with 70% by
volume fraction. The CFRP plate produced through pultrusion method and the CFRP
plates known as Sika Carbodur type S512 have properties of the plate is shown in Table
A1.2. The modulus elastic of CFRP plate obtained from manufacturer specification is
165 GPa and mean tensile strength is 2800 MPa.
(a) (b)
Figure 3.2: (a) CFRP plate dimensions (b) Two mild steel end tab bonded to each
CFRP plate

3.1.3 Joint Adhesive
The adhesive used for bonding is epoxy-based 2-component adhesive mortar
(Sikadur ® 30) with mixing ratio of 3:1. (parts by weight). The adhesive tensile strength
is 30 MPa and shear strength is 20 MPa with the Tg value of 62 ºC was used for bonding
of CFRP-concrete.
3.2 Preliminary Test (Joint Properties of Mild Steel End Tab – CFRP plate)
The objective of the testing is to determine the ultimate load and to study the
mode of failure of mild steel end tabs and CFRP bonded at bolt hole region.
3.2.1 Test Rig Design and Preparation
Two mild steel rods diameter of 65 mm and length of 175 mm had been used to
produce the test rig. The diameter of the mild steel rod was reduced to 32 mm x length
55 mm and 55 mm x length 120 mm respectively. A solid plate width 8 mm x length 100
mm was slot out from the mild steel rod using Milling Machine. Both surface of the test
rig were flatted so that it is easy to place bolt and nut and fasten to the CFRP. A hole
diameter of 13 mm is made pass through the upper test rig (15.5 mm from upper edge).
A pin is applied at the hole to connect to connector of Instron Machine. Another two
hole (diameter 10 mm) were made (15 mm and 37.5 mm respectively from lower edge).
High tensile mild steel Bolt and nut (M10) will be applied to fasten the CFRP plate to
the rig. Part of the test rig preparation is shown in Figure 3.3.

Finally, the finished test rig was sprayed with primer type paint to avoid
corrosion. Upper and bottom test rig were shown in Figure 3.4.
3.2.2 Specimen Preparation
Two mild steel strips geometries of 50 mm x 1.5 mm x 500 mm have been used
as end tab for CFRP plate. One surface of the strip was sand blasted in order to remove
any dirt or rust. After sand blasted, the strip was cut into size of 50 mm x 70 mm. For
second attempt, the size of tab was changed to 50 mm x 150 mm. The plates were
bonded to CFRP plate using Sikadur® 30-type epoxy. The adhesive is applied on the
rough surface. The epoxy could be bonded perfectly at the rough surface. A hole was
made at both the end tab after bonding using drilling machine. This plate is used as end
(a) (b)
Figure 3.3: (a) (b) Test rig preparation (drilling process)
Connector of Instron-100 kN Universal Testing Machine
(a)
Figure 3.4: (a) Two units of test rig (b) Upper test rig
pinned to connector of Instron-100 kN Universal Testing
Machine (b)

tab in order to strengthen the CFRP plate. It is used to ensure that CFRP plate do not tear
off prematurely under tensile loads. This hole will finally connected to CFRP/concrete
test rig. The CFRP plate bonded with wild steel plate sample is shown in Figure 3.5.
Figure 3.5: CFRP plate bonded with mild steel plate (end tab)
3.2.3 Test Set Up
The equipments were set up as Figure 3.6. Three specimens were tested in order
to determine ultimate failure load and to study the failure behavior at end tabs pin/bolt
hole.
Mild steel end tab
CFRP Plate
Bolt Hole M10
Connection pin
Strain gauges (back to back)
(a) (b)
Figure 3.6: (a) Schematic diagram of specimen (b) Experiment set up for
preliminary test
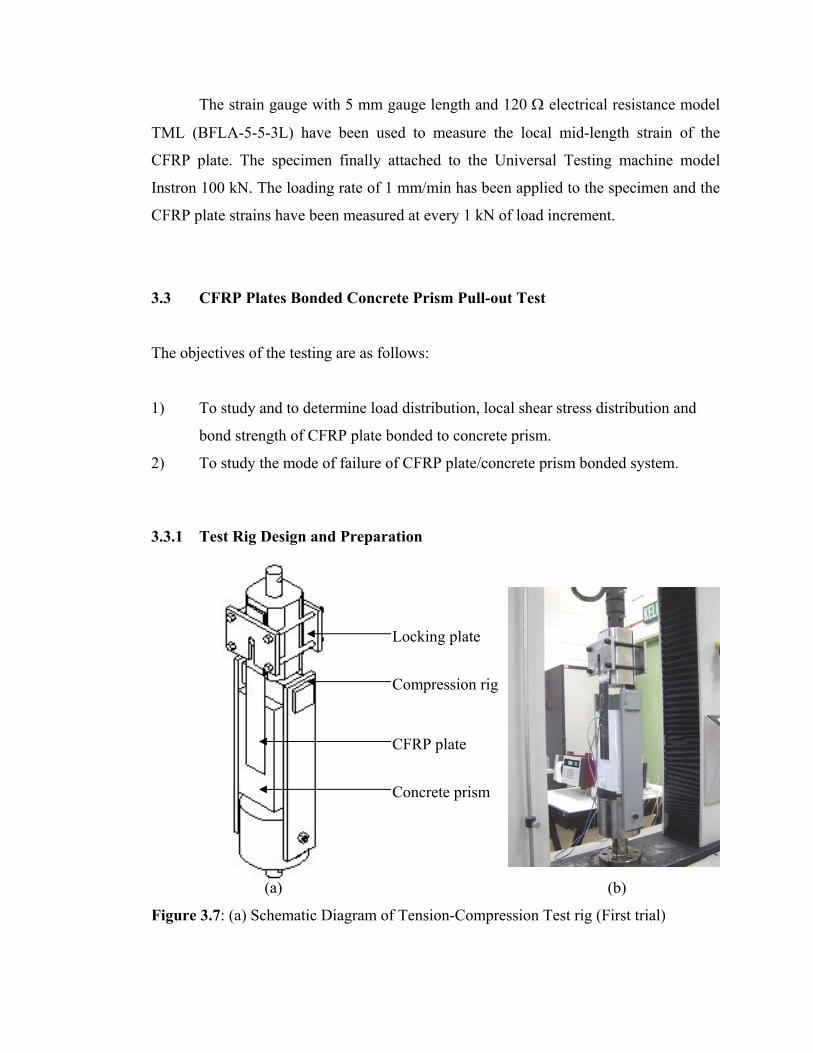
The strain gauge with 5 mm gauge length and 120 Ω electrical resistance model
TML (BFLA-5-5-3L) have been used to measure the local mid-length strain of the
CFRP plate. The specimen finally attached to the Universal Testing machine model
Instron 100 kN. The loading rate of 1 mm/min has been applied to the specimen and the
CFRP plate strains have been measured at every 1 kN of load increment.
3.3 CFRP Plates Bonded Concrete Prism Pull-out Test
The objectives of the testing are as follows:
1) To study and to determine load distribution, local shear stress distribution and
bond strength of CFRP plate bonded to concrete prism.
2) To study the mode of failure of CFRP plate/concrete prism bonded system.
3.3.1 Test Rig Design and Preparation
Figure 3.7: (a) Schematic Diagram of Tension-Compression Test rig (First trial)
Concrete prism
CFRP plate
Locking plate
Compression rig
(a) (b)

Figure 3.8: (a) Schematic diagram of Tension-Compression test rig (b) Test set-up
(second trial)
Note: Compressive block is placed on top of concrete prism to provide uniform
compressive load.
Figure 3.9: Front view of Tension-Compression test rig and test specimen for second
trial
Fastened with bolt and nut (M10)
Concrete prism
CFRP plate
Lock
Compression rig * Compressive block
Fastened with bolt and nut (M10)
(a) (b)

3.3.2 Specimen Preparation
1. Two mild steel plates with dimension 50 mm width x 150 mm length and 2 mm
thickness were bonded to one of the CFRP plate. Total two CFRP plates with
dimension 50 mm width x 390 mm length with mild steel end tab were prepared
for each specimen.
2. A 10 mm diameter bolt hole was drilled at mild steel end tabs bonded CFRP
plate for inserting bolt while setup the testing (Figure 3.10).
Figure 3.10: Mild steel end tabs bonded CFRP plate drilling process
3. The concrete surface that will be bonded to CFRP plate is roughed using Air
Tool Hammer. The contact bond surface of the concrete prism is prepared by
scrabbling tool until the course aggregate (i.e. > 8 mm) is visible (Figure 3.11).
Total two opposite surfaces were hacked. This is to provide mechanical
interlocking type surface for bonding purpose.
Hacked area (150 mm x 60 mm)
Figure 3.11: (a) Concrete prism with hacked area

4. The surface of the concrete is ensured free from dust, loose material by using
vacuum cleaner. The surface also confirmed to be level as possible using
standard leveling gauge.
5. CFRP plate surface was roughened with sand paper. During sanding, a
precaution not to damage the fibre outer surface.
6. Two CFRP plate with mild steel end tab were bonded to both side of concrete
prism referring Figure 3.12.
7. Totally 10 unidirectional strain gauges were bonded to the CFRP plates (side A
and B respectively) for Control I sample, referring to Figure 3.13 (a). For Control
II and Hot/Dry/Wet samples, totally 12 unidirectional strain gauges were
installed to the CFRP plates respectively, referring to Figure 3.13 (b). Besides
that, three electrical strain gauges have been bonded to the concrete surface for
both Control II and Hot/Dry/Wet samples, referring to Figure 3.13 (c) in order to
investigate the level of compressive stress along the concrete prism length.
(a) (b)
Figure 3.12: (a) Bonding process (b) CFRP plates with mild steel end tab bonded to
concrete prism preparation

Side B
Side A
Free edge A
Figure 3.13 (a): (i) CFRP plates bonded concrete prism specimen details (Control I
sample) (ii) Tension-Compression test set up

Figure 3.13 (b): CFRP plates bonded concrete prism specimen details (Control II and
Hot/Dry/Wet samples)
Figure 3.13 (c): Schematic diagram of Gauge locations on concrete prism for Control II
and Hot/Dry/Wet samples
Side A
Side B
Free edge A
Free edge A

The specimens were exposed to the following conditions before undergone pull
out test, and they are as follows;
1. Laboratory (as control) Code name: 2 L
2. Hot/Wet/Dry condition Code name: 3 HWD
Besides that, the Hot/Wet/Dry condition specimen was exposed to constant
temperature 50ºC in the oven for 6 hours (10 am - 4 pm), then, it was placed into plain
water (totally submerged) for 12 hours (starting 10 am) in lab condition. After that, the
specimen is dried in laboratory environment. There were total 6 cycles have been carried
out for the specimen starting from 31st of December 2002 until 12th of January 2003. The
pH value of tap water was found at about 8.4 using HORIBA U10 (Figure 3.14), while
DO is about 9.8 mg/l. There are no salt content in the water.
There were 2 specimens used as control. One of them is used for first trial in
Concrete Prism bonded CFRP Plate Pull-out Test. And the other is used for second trial
of the test. Both control sample experienced different type of compressive load during
final test. The loading conditions are shown in Figure 3.15 (a) and Figure 3.15 (b).
(a) (b) Figure 3.14: (a) Condition that Sample totally submerged into water (b) Procedure
measuring pH water

For first trial (Control I sample) of pull out test, compressive block was not
installed in the Tension-Compression system. The load distribution is not uniform and
high loads concentrate at middle top surface of concrete, which is shown in Figure 3.15
(a). Compressive load is more uniform acting on concrete top surface for samples
Control II and Hot/Wet/Dry shown in Figure 3.15 (b).
Figure 3.15 (a): Compressive load acting on 50% on top of concrete prism surface for
sample Control I
Compression rig
Control I sample
CFRP plate
P

Figure 3.15 (b): Uniform compressive load acting on top of concrete prism surface for
Control II and Hot/Wet/Dry samples
3.3.3 Test Set Up
Procedures:
The equipments set up as shown in Figure 3.16. Two laboratory condition
samples and a Hot/Wet/Dry sample were tested in order to determine load
distribution and local shear stress distribution. The Universal Testing Machine model
Instron 100 kN has been used and tensile loading rate of 1 mm/min has been applied
on the sample up to failure. The strains have been measured at every 5 kN of load
increment.
P
Compression rig
CFRP plate
Control II sample

3.3.3.1 Measurements And Instrumentation
The loading performances of test specimens were monitored through
measurements of applied load and local strain distribution along the plate joint. The
strain gauges (manufactured by Tokyo Sokki Kenkyujo Co. Ltd.) were bonded at
specific location along the CFRP plate as shown in Figure 3.13. The measurements of
strain were recorded at every 5 kN increment of applied load until the specimen fail. The
specification of the strain gauge is shown in Table 3.1. Besides that, the installation
process of the strain gauges is shown in Figure 3.17.
Figure 3.16: Instron-100kN Universal Testing Machine Instrumentation Set-up
(CFRP plates bonded concrete prism pull out test)
Strain gauges output signal
Fixed gripper
CFRP/concrete bonded Specimen
Load frame
Moving gripper
Computer
Data logger TDS-302
Plotter
Control panel (console)
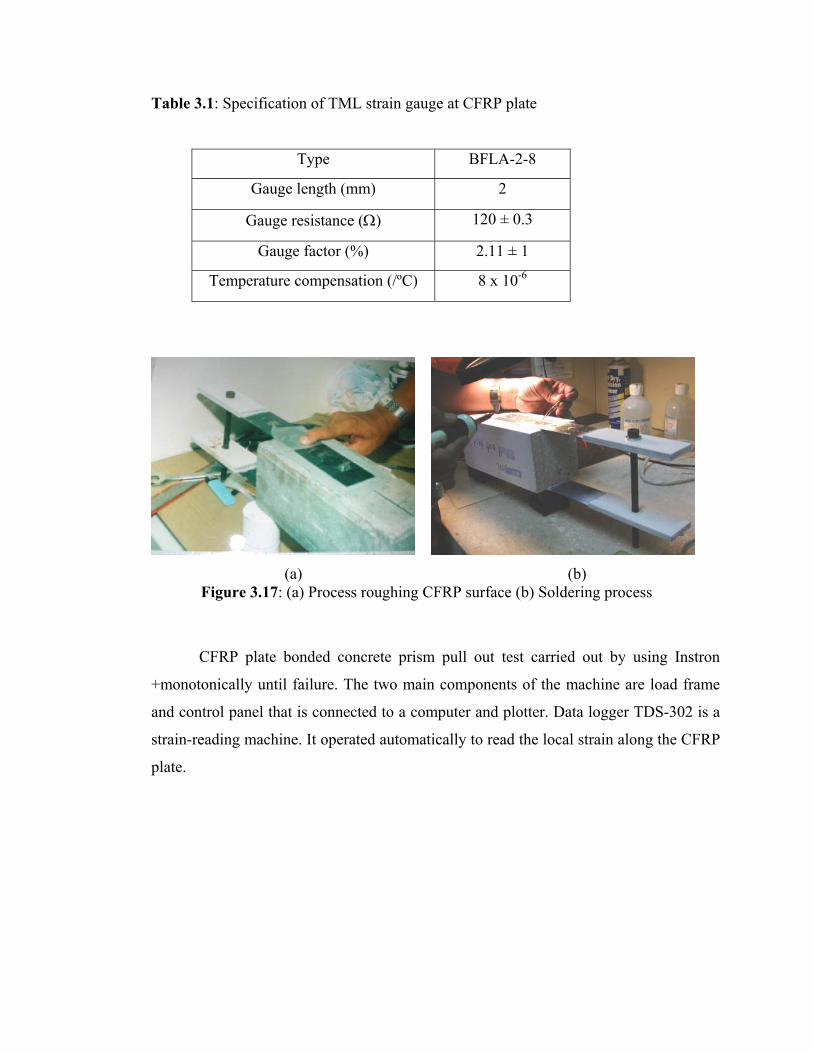
Table 3.1: Specification of TML strain gauge at CFRP plate
Type BFLA-2-8
Gauge length (mm) 2
Gauge resistance (Ω) 120 ± 0.3
Gauge factor (%) 2.11 ± 1
Temperature compensation (/ºC) 8 x 10⁻⁶
CFRP plate bonded concrete prism pull out test carried out by using Instron
+monotonically until failure. The two main components of the machine are load frame
and control panel that is connected to a computer and plotter. Data logger TDS-302 is a
strain-reading machine. It operated automatically to read the local strain along the CFRP
plate.
(a) (b) Figure 3.17: (a) Process roughing CFRP surface (b) Soldering process

3.4 Summary
Experimental set up is divided into two important parts, test sample preparation
and test facilities set up. The data collected through the experiment is strains reading,
obtained from the data logger. The local strain along the plate and applied tensile load
were collected up to failure.
CHAPTER IV
RESULTS AND DISCUSSION
4.0 Introduction
In this chapter, the discussion focus onto the influence of aggressive exposure
conditions on the behaviour of CFRP plate bonded concrete prism’s joints. The result of
the study will be presented in terms of bonding behaviour and the failure mode of the
test samples.
4.1 Bonding Properties
In the analysis, we assumed perfect bonding between CFRP plate and concrete
prism and considered concrete prism as a rigid adherend that create constant shear stress
along the thickness of the adhesives.
In this section, the bonding properties, such as load at failure, bond strength, load
transfer, local strain behaviour and local shear stress distribution for each sample will be
discussed. The results will be presented in terms of graphs and charts.
The result directly obtained from the load tests and the recorded readings through
data logger: Applied load of Instron Machine, (2) local strain on CFRP plate. These test
data have been analysed and are discussed in the following sections.

4.2 Average Bond Strength
Referring Figure 4.1, when a CFRP/Concrete bonded system subjected to
tension-compression (pull-out) loading system by assuming there is perfect bonding of
the specimen, the average bond strength can be determined by the following equation,
Average Bond strength, τav = A
P2max
= BL
P
02maxδ
(1)
Where,
Pmax = Ultimate applied load (N)
AB = Bond area (b x LB) (mm²)
0δ = Width of CFRP plate (mm)
LB = Bond length (mm)
Figure.4.1: Geometry and material parameters of the CFRP Plate-Concrete Prism
Under Tension-Compression
x
Ei Gi ti
to
η
P
2P
-c c
Eo Go
dx 2P

4.3 Local Strain
Control I Sample: Applied load (kN) versus Local strain (µ)- Side A
0102030405060
-500 0 500 1000 1500 2000 2500 3000
Local strain (µ)
App
lied
load
(kN
)
-30 mm 15 mm 35 mm 65 mm 95 mm 125 mm
0
10
2030
40
50
60
-500 0 500 1000 1500 2000 2500 3000
App
lied
load
(kN
)
-30 mm 15 mm 35 mm 65 mm 95 mm 125 mm
Control I Sample: Applied load (kN) versus Local strain (µ)- Average
0
10
20
30
40
50
60
-500.0 0.0 500.0 1000.0 1500.0 2000.0 2500.0 3000.0
Local strain (µ)
App
lied
load
(kN
)
-30 mm 15 mm 35 mm 65 mm 95 mm 125 mm
Figure 4.2: Graph Applied load versus Local strain for Control I sample (a) Side A
(b) Side B and (c) Average
(a)
(c)
(b)

Control II Sample: Applied load (kN) versus Local strain (µ)- Side A
0
10
20
30
40
50
60
-500 0 500 1000 1500 2000 2500 3000 3500 4000
Local strain (µ)
App
lied
load
(kN
)
0 mm 15 mm 35 mm 65 mm 95 mm 125 mm
Control II Sample: Applied load (kN) versus Local strain (µ)- Side B
0
10
20
30
40
50
60
-500 0 500 1000 1500 2000 2500
Local strain (µ)
App
lied
load
(kN
)
0 mm 15 mm 35 mm 65 mm 95 mm 125 mm
Control II Sample: Applied load (kN) versus Local strain (µ)- Average
0
10
20
30
40
50
60
-500 0 500 1000 1500 2000 2500 3000
Local strain (µ)
App
lied
load
(kN
)
0 mm 15 mm 35 mm 65 mm 95 mm 125 mm
Figure 4.3: Graph Applied load versus Local strain for Control II sample (a) Side
A
(b)
(c)
(a)

Hot/Wet/Dry Sample: Applied load (kN) versus Local strain (µ)- Side A
010203040506070
0 500 1000 1500 2000 2500 3000
Local strain (µ)
App
lied
load
(kN
)
0 mm 15 mm 35 mm 65 mm 95 mm 125 mm
Hot/Wet/Dry Sample: Applied load (kN) versus Local strain (µ)- Side B
0
10
20
30
40
50
60
70
0 500 1000 1500 2000 2500 3000 3500 4000 4500
Local strain (µ)
App
lied
load
(kN
)
0 mm 15 mm 35 mm 65 mm 95 mm 125 mm
Hot/Wet/Dry Sample: Applied load (kN) versus Local strain (µ)- Average
010203040506070
0 500 1000 1500 2000 2500 3000 3500 4000
Local strain (µ)
App
lied
load
(kN
)
0 mm 15 mm 35 mm 65 mm 95 mm 125 mm
Figure 4.4: Graph Applied load versus Local strain for Hot/Wet/Dry sample (a) Side A
(b) Side B and (c) Average
(a)
(b)
(c)

The local strain is recorded through data logger and the data listed as in
Appendix A2, Table A2.1-A2.3. In this case, the strains are measured at every 5 kN
increment of applied load up to failure. Graphs applied load versus local strain (Figure
6.-6.3) are plotted.
From the graphs applied load versus local strain (figure 4.2-4.4), at 0 mm (from
free edge A), it showed linear line pattern. At 15, the line becomes bilinear which the
strains increase steadily at uniform rate.
At 35 mm and 65 mm (located approximately at the center of bonded length), it
showed ductile line pattern. The slope, ε∆
∆=
Fm is high at low load levels referring to
graphs (figure 4.2-4.4). At 95 and 125 mm, the slopes become steeper. The highest slope
m is obtained at 95 mm, almost 90°.
It can be concluded that a high load is needed to increase ε∆ at interior bonded
area (away from free edge A). The line at low load level is linear. The line become non
linear at high load level due to cracking of concrete.
4.4 Force Transfer Between CFRP Plate and Concrete
The variations of the longitudinal plate force along the bonded CFRP plate
length are being evaluated from the recorded strain along the plate. These forces are
calculated at every 5 kN of applied load increment. The local load at CFRP plate can be
computed from equation (17) Chapter III based on Hooke’s Law. We assumed that the
force transfer is linear along the bond line. The properties of equation (17) are as
follows;

E = CFRP Young’s Modulus
= 165 GPa (referred to manufacturer’s specification),
A= cross-section area of CFRP plate
= 1.2 x 50 mm²
ε = local strain on CFRP plate
In this case, we assumed that the tensile modulus of CFRP plates remain constant
up to failure and the force distribution is linear along the plate. The calculated data is
shown in Appendix A2, Table A2.4-A2.6. Gauge locations on CFRP plate for Control I
and Control II samples were shown in Figure 4.4 and Figure 4.6 respectively. The local
load distribution at CFRP plate for different samples is plotted and shown in following
figures.
Forces transfer between CFRP plate and concrete prism can be calculated by the
following equation with an assumption that perfect bonding occurs between CFRP plate
and concrete prism. From Hooke’s Law, it can be seen that;
εσ
=E (2)
And it is known that; AF
=σ (3)
Substitute into equation (2), finally yield
εEAF = (4)
Where,
σ = Tensile stress at CFRP plate, MPa
Ac = Cross-section area of CFRP plate, m²
E = CFRP Young’s Modulus, GPa
F = Local load at CFRP plate, N
ε = Local strain at CFRP plate, µε
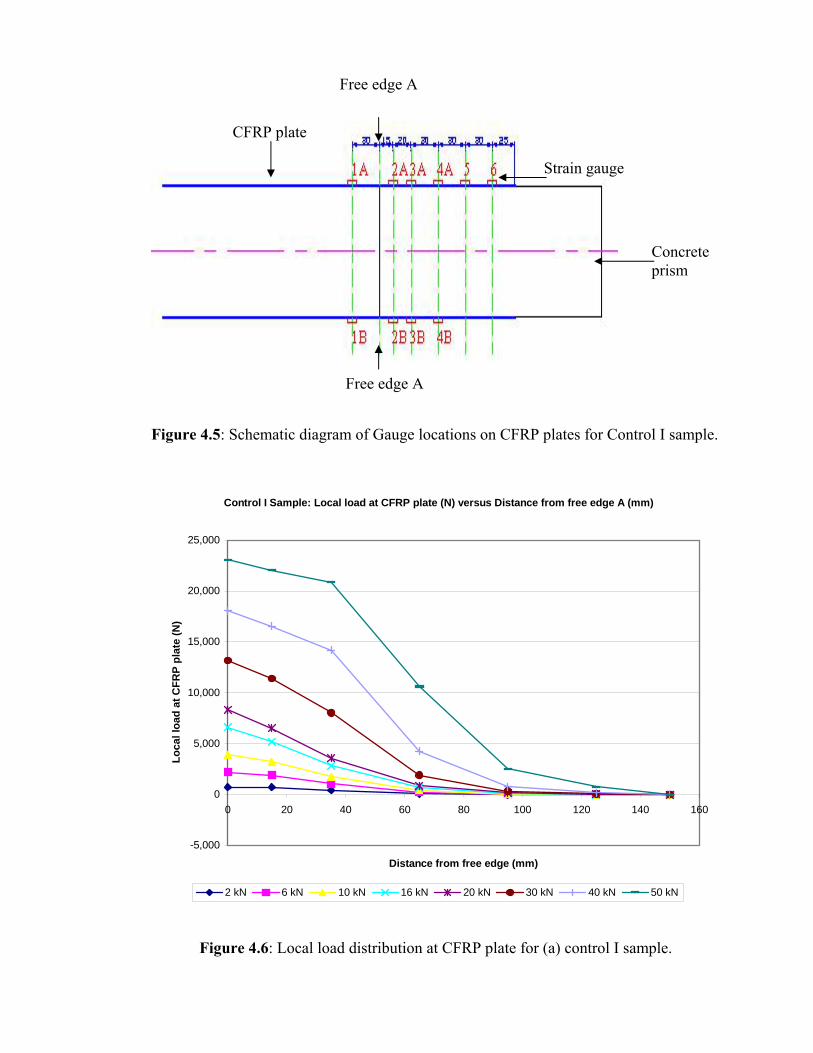
Figure 4.5: Schematic diagram of Gauge locations on CFRP plates for Control I sample.
Control I Sample: Local load at CFRP plate (N) versus Distance from free edge A (mm)
-5,000
0
5,000
10,000
15,000
20,000
25,000
0 20 40 60 80 100 120 140 160
Distance from free edge (mm)
Loca
l loa
d at
CFR
P pl
ate
(N)
2 kN 6 kN 10 kN 16 kN 20 kN 30 kN 40 kN 50 kN
Figure 4.6: Local load distribution at CFRP plate for (a) control I sample.
Free edge A
Free edge A
Strain gauge
Concrete prism
CFRP plate

Figure 4.7: Schematic diagram of Gauge locations on CFRP plates for Control II and
Hot/Wet/Dry samples.
Control II Sample: Local load at CFRP plate (N) versus Distance from free edge A (mm)- Average A and B
0
5,000
10,000
15,000
20,000
25,000
30,000
0 20 40 60 80 100 120 140 160
Distance from free edge (mm)
Loca
l loa
d at
CFR
P pl
ate
(N)
5 kN 10 kN 15 kN 20 kN 30 kN 40 kN 50 kN 55 kN
Figure 4.8: Local load distribution at CFRP plate for (b) control II sample.
Free edge A
Free edge A
Strain gauge
Concrete prism
CFRP plate

Hot/Wet/Dry Sample: Local load at CFRP plate (N) versus Distance from free edge A (mm)-Average A and B
0
5,000
10,000
15,000
20,000
25,000
30,000
35,000
0 20 40 60 80 100 120 140 160
Distance from free edge (mm)
Loca
l loa
d at
CFR
P pl
ate
(N)
5 kN 10 kN 15 kN 20 kN 30 kN 40 kN 50 kN 55 kN 60 kN
Figure 4.9: Local load distribution at CFRP plate for (c) Hot/Wet/Dry sample.
Firstly, The results obtained in graph local load at CFRP plate versus distance
from free edge A (Figure 4.7,4.8 and 4.9) show that the load transfer from the plate to
the concrete at low loads are fairly linear, and occurs at uniform rate. The force
distribution becomes much more non-uniform and non-linear near the free edge A. It
becomes increasingly uniform and constant implying local debonding or cracking of
concrete at this location.
Secondly, the graph also clearly shows that higher force transfer lengths at higher
loads. In other words, both the total force transfer length and the local separation at the
edge A increase progressively with increase in the applied loads. The maximum applied
load before failure for Control I, Control II and Hot/Wet/Dry sample are 55.22 kN,
57.93 kN and 64.94 kN respectively.

From graph (Figure 4.8), the maximum load transfer is in the range of 0-35 mm
from free edge A at all load levels. The total forces transfer length at high loads level
increase progressively. The maximum load transfer is at 55 kN applied load at 15 mm
from free edge A. The lines at 50 kN and 55 kN applied loads intersect twice at the
range 40-70 mm. In this case, concrete started to crack at 30 kN. The lines for 30 kN and
higher applied load level become non linear. Cracking or local debonding causes non-
uniform local loads at higher load levels. Applied force concentrated at cracking area
due to high strain value is being suspected.
From graph (Figure 4.9), the maximum load transfer is in the range 0-40 mm
from free edge A at all load levels. The graph clearly shows that higher force transfer
lengths at higher loads level. The lines at 50 kN and 55 kN applied loads intersect twice
at the range 40-60 mm. In this case, concrete started to crack at 20 kN. Non-uniform
local loads at 20 kN applied load and higher load levels are due to concrete cracking and
local debonding.
4.5 Local Shear Stress Distribution
The transfer of the longitudinal force from the CFRP plate to the concrete creates
shear stress in the epoxy adhesive, and at the concrete-adhesive and plate-adhesive
interfaces. Assuming a linear variation of the longitudinal force between two
consecutive located strain gauges, the local shear stress along the bonded plate length
can be computed from equation (18). The properties of equation (18) are as follows;

Figure 4.10: The strain gauges location notation
Shear stress distribution,Lb
F∆×
∆=τ (18)
where,
∆F = Difference in longitudinal force between two consecutive strain
gauge locations, N
= 21 FF − ( ,, 21 FF … nF = local load on CFRP plate)
L∆ = Spacing between two consecutive strain gauge locations, m
These local shear stress distributions were evaluated for Control I, control II and
Hot/Wet/Dry samples and histograms were plotted as shown in Figure 4.10 (a), (b) and
(c). Local shear stresses are shown in the form of histograms and curve line.
The overall trend shown by the graphs in Figure 4.11 is at low load levels, the
bond shear stress is maximum near the free edge A. At these load levels, the force
transfer length between the plate and the concrete is relatively short. However, with
increase of the applied loads, the forces transfer length increases, and local cracking and
debonding at the free edge A moved the location of the maximum force and shear stress
further from the free edge A into the interior down the bonded length.
In conclusion, from the graphs local shear stress distribution versus distance
from free edge A for the three samples above, the lines shifted to center of bonded area
j i
∆L
CFRP plate Strain gauge

with increasing applied load. In other words, the maximum shear stress or bond strength
shifted to interior bonded area with increasing applied load. At low load levels, the bond
stress is maximum near the free edge A. At these load levels, the force transfer length
between the plate and the concrete is relatively short. The force transfer lengths increase
progressively at high loads level.
Control I Sample: Local shear stress distribution (Pa) versus Distance from free edge (mm)
01.000.0002.000.0003.000.0004.000.0005.000.0006.000.0007.000.0008.000.000
0 20 40 60 80 100 120 140
Distance from free edge (mm)
Loca
l she
ar s
tress
di
strib
utio
n (P
a)
10 kN 20 kN 30 kN 40 kN 50 kN
Control II Sample: Local shear stress distribution (Pa) versus Distance from free edge A (mm)- Average
0
2.000.000
4.000.000
6.000.000
8.000.000
0 20 40 60 80 100 120 140
Distance from free edge (mm
Loca
l she
ar s
tress
di
strib
utio
n (P
a)
10 kN 20 kN 30 kN 40 kN
50 kN 55 kN
Figure 4.11: Shear stress distribution (a) for Control I sample and (b) for Control II
sample
(b)

Hot/Wet/Dry Sample: Local shear stress distribution (Pa) versus Distance from free edge A (mm)- Average
0
2,000,000
4,000,000
6,000,000
8,000,000
10,000,000
12,000,000
0 20 40 60 80 100 120 140
Distance from free edge (mm
Loca
l she
ar s
tress
dis
tribu
tion
(Pa)
10 kN 20 kN 30 kN 40 kN 50 kN 60 kN
Figure 4.11: Shear stress distribution (c) for Hot/Wet/Dry sample
4.6 Average Bond Strength
The average bond strength can be computed referring equation (14) Chapter III.
The properties of equation (14) are as follows;
Pmax = Ultimate load, kN
A = Bonded area (b x LB)
b = Width of CFRP bond plate
LB = Bond length
The measured maximum applied load of Control I, Control II and Hot/Wet/Dry
samples are 55.22 kN, 57.93 kN and 64.94 kN respectively. Therefore, the average bond
strengths for Control I sample can be calculated as follows:
For Control I sample,
τav = 250150222.55
mmkN
××
= 3.681 MPa
(c)

Table 4.1: Average bond strengths and maximum applied load for Control I, Control II
and Hot/Wet/Dry samples
Condition of samples Average bond strengths
(MPa)
Maximum applied load
(kN)
Control I 3.681 55.22
Control II 3.862 57.93
Hot/Wet/Dry (6 cycles) 4.329 64.94
In comparison, average bond strength for Hot/Wet/Dry sample is the highest
among three samples. The maximum recorded applied load before failure is 64.94 kN.
4.7 Maximum Bond Stress Concentration Factor
Table 4.2: Maximum local bond stress and location for Control I, Control II and
Hot/Wet/Dry samples
Condition of samples Location from free edge
A, i-j (mm)
Maximum local bond stress
(MPa)
Control I 35-65 6.85
Control II 65-95 7.73
Hot/Wet/Dry 15-35 10.24
Maximum bond stress concentration factor can be determined by,
λ =averageττ max

For Control I sample,
PaPa
36813336850800
=λ
= 1.86
Table 4.3: Maximum bond stress concentration factor for Control I, Control II and
Hot/Wet/Dry samples
Condition of samples Maximum bond stress
concentration factor
Control I 1.86
Control II 2.00
Hot/Wet/Dry 2.40
4.8 Failure Mode Analysis
The failure of adhesive bonded double lap shear of CFRP plate-concrete
subjected to tension-compression loadings system can occur in three ways: (a) cohesive
failure in the adhesive layer; (b) adhesion failure and (c) concrete shearing failure. After
pull out test, the failure surfaces on the plate and concrete were carefully inspected and
the results are discussed in the following sections.
4.8.1 Failure Mode Analysis For Control I Sample
The failure at side A of Control I sample was largely dominated by concrete
shearing (Figure 4.12 (a)). There is 35 mm deep of concrete piece at the free edge A left
after pull-out test. At side A of CFRP plate, there is 90 mm length of concrete left-over

covered by 150 mm of total bond length (Figure 4.12 (b)). The shape of concrete left-
over piece is similar to wedge, referring to Figure 4.12 (e). The compressive stress
highly concentrated within the middle of top concrete surface. The crack propagated due
to high compressive load on top of concrete surface. This mode of failure clearly show
that the adhesive used was capable of providing stronger adhesion than the shear
strength of the concrete.
At Side B, about 85 mm length of interlaminar filamentary shear out type of
failure of CFRP plate at 50 mm from free edge A, referring to Figure 4.12 (c). The
remaining area near the free edge A on the CFRP plate is still remain with thin piece of
concrete that failure looked like concrete shearing failure (Figure 4.12 (d)). The failure
at this side was mixed mode type of failure that combined concrete shearing and CFRP
plate interlaminar filamentary shear out. Figure 4.12 (f) showed both side of CFRP plate
surface after pull-out test.

Figure 4.12: (a), (b), (c), (d) Failure mode analysis for Control I sample
Concrete shearing failure
mode at side A
Concrete shearing failure mode at side A
Concrete shearing failure mode at side B
Cohesive failure mode at side B
A A
Interlaminar filamentary of CFRP plate bonded to concrete surface failure
(b)
(c) (d)
(a)
B B

Figure 4.12: (e), (f) Failure mode analysis for Control I sample
Concrete shearing failure mode at side A
A B
A
B
(f)
(e)

4.8.2 Failure Mode Analysis For Control II Sample
For Control II sample, the CFRP plate fully debonded from concrete surface at
side A (Figure 4.13 (a)). The failure at side A for Control II sample was fully dominated
by concrete shearing. At side A concrete prism, appeared a groove with 5 mm deep at
100 mm from free edge A (Figure 4.13 (a)), local cracking has been created at this area
progressively on concrete prism. Uniform compressive load acting on top of concrete
prism. Therefore, the failure mode of CFRP/concrete behaved more consistent in term
shear-out failure compared to Control I sample.
Thin left-over concrete piece remain bonded along 110 mm length started from
free edge A on the CFRP plate (Figure 4.13 (b)). Besides that, there was a small area
that has been affected by CFRP plate shear out failure, referring to Figure 4.13 (d). In
this case, it is called mixed failure mode due to combination of concrete shearing and
CFRP plate shear out failure. Concrete shearing failure mode is clearly showed in Figure
4.13 (e). At another side, by visual inspection, it shows that the CFRP plate still bonded
to concrete prism (Figure 4.13 (c)). Due to visual inspection onto the bonding line and
concrete surface, there is no indication of crack occurs within the suspected area.

Figure 4.13: (a), (b), (c) Failure mode analysis for Control II sample
A A
Left-over piece at side A
(a) (b)
Concrete shearing

Figure 4.13: (d), (e) Failure mode analysis for Control II sample
CFRP plate shear out failure mode at side A
Concrete shearing failure mode at side A
Concrete shearing failure mode at Side A
A A
(d) (e)

4.8.3 Failure Mode Analysis Hot/Wet/Dry Sample
For Hot/Wet/Dry sample, by visual inspection it seen that the CFRP plate still in
good condition while concrete prism shows indication of cracks along free edge A of
side A(Figure 4.14 (a)).
The failure mode at side B for Hot/Wet/Dry sample can be categorized as mixed
failure mode, referring to Figure 4.14 (b). It combined CFRP plate shear out failure,
cohesive failure through adhesive and concrete shearing failure, referring to Figure 4.14
(b).
For CFRP plate at side B, it is equally affected by CFRP plate shear out,
cohesive failure at the adhesive layer and concrete shearing failure mode, referring to
Figure 4.14 (c). In addition, Figure 4.14 (e) and (f) showed CFRP shear out, cohesive
failure and concrete shearing failure respectively.

Figure 4.14: (a), (b), (c), (d) Failure mode analysis for Hot/Wet/Dry sample
Concrete cracked at side A
A B
CFRP shear out failure mode and left-over piece
Cohesive failure mode at Side B
Concrete shearing failure mode at Side B
B
CFRP plate shear out failure mode at side B
Cohesive failure mode at side B
B
(a) (b)
(c) (d)

Figure 4.14: (e), (f) Failure mode analysis for Hot/Wet/Dry sample
B B
CFRP shear out failure mode at side B Cohesive failure
mode at side B Concrete shearing failure mode at side B
(e) (f)

Summary
The same point of three cases above is there was always concrete shearing failure
at area near the free edge A. The bond strength of Hot/Wet/Dry sample is much higher
that Control I and Control II samples.

CHAPTER V
CONCLUSIONS AND SUGGESTIONS FOR FUTURE STUDY
5.1 Conclusions
A series of concrete prism bond with CFRP plate have been tested under
tension-compression loading system using Instron Universal Testing Machine in
order to study the effects of Hot/Wet/dry exposure condition. An assessment in this
project has been made of changes the exposure conditions. Comparison of bonding
properties and failure modes based on the concrete prism bond with CFRP plate
under two different exposure conditions has indicated different bonding
characteristic. Based on this experiment, the major conclusions of this study are as
follows:
Force Transfer Between Plate and Concrete
• Concrete prism bonded CFRP plates under Hot/Wet/Dry condition shows the
highest force transfer length compared to Control samples.
• The forces transfer between plate and concrete is almost zero at end of bond area.
• The forces transfer decrease steadily (almost linear) from free edge A at low load
levels and occurred at uniform rate.
• Higher force transfer lengths are found at higher load levels.

Shear/Bond Stress Distribution
• At low load levels, maximum local bond stress is found at near the free edge A.
• The force transfer length is relatively short at low load levels.
• Local cracking and debonding at the free edge A shift the location of the
maximum force and shear stress further into the interior down the bonded length.
• Maximum bond stress shifted to interior down the bonded length with increase of
load levels.
Local Strain on CFRP Plate
• High load is needed to increase ε∆ at interior bonded area (away from free edge
A).
• Strain increases steadily (almost linear) with the increase of applied load at free
edge A.
• Ductile curve pattern is found at center of bonded area for all samples.
Average Bond Strength and Maximum Applied Load
• Concrete prism bonded CFRP plates under Hot/Wet/Dry condition implied the
highest average bond strength compared to Control samples.
• The highest applied load (before failure) is found on Hot/Wet/dry sample
compared to Control samples with 12.1% increase of load.
Failure Mode Analysis
• Concrete shearing failure occurred at area near the free edge A for all samples.
• The failure mode for each sample was different.
• Mixed mode failure that combined concrete shearing, CFRP plate shear out and
cohesive failure at adhesive interface is clearly shown on Hot/Wet/Dry samples.
• Loading configuration on top of concrete prism affected failure mode of sample.

Bond Stress Factor
• Highest bond stress factor is obtained at Hot/Wet/Dry sample and concentrated at
area 15-35 mm from free edge A.
5.2 Suggestions for Future Study
During the preparation of the test samples experimentation and testing, few
problems have been faced. These obstacles may affect the performance of the test data
collected. Therefore, some suggestions were given as below to improve the overall
performance of the study.
• In this project, the geometry of the concrete prism is not consistent throughout
the length. Improper specimen and surface preparation was also the factors that
affect the data collected. And, the surface and specimen should be well
controlled within a clean room in order to avoid dust etc.
• In this project, one sample was tested for exposure regime (Hot/Wet/Dry
sample). We suggested to increase the test samples for other type of conditions,
so, more results can be compared.
• The test set up for this project is complex. High cost is needed to carry out the
experimentation and testing. We suggested to simplify the test set up especially
test rig design.
• Various thickness, width and bond length of composite, various adhesive
thickness and adhesive type can be tested for the further observation of bonding
properties.

• The concrete bond surface is suggested to be roughed using sand blast method
instead of using air tool. The surface is improper by using air tool. It is difficult
to control bond surface contour.
• The exposure duration instead of 6 cycles should be increased to study the long-
term performance of the joint durability.
• For Hot/Wet/Dry sample, the specimen was exposed in different environment
such as in Oven and submerged in water. The sample was left to dry at lab
environment. We suggested sample should be exposed to natural environment.
As alternative, a sample can be placed into weathering chamber because it save
time and it is easier to handle.
• Comparison study by using finite element package such as MSC Nastran could
be suggested in future in order to save time. FEM only could be suggested if only
a complete database of materials properties being provided.

REFERENCES
[1] Barnes RA, Baglin PS, Mays GC and Subedi NK. “ External steel plate systems for
the shear strengthening of reinforced concrete beams.” Structural Engineer, 2001, No.
23. pp 1162 – 1176.
[2] Hollaway LC and Leeming MB. “Strengthening of reinforced concrete structures.”
Woodhead Pub Ltd. England. 1999. pp 11-45.
[3] Jansze W. “Strengthening of reinforced concrete members in bending by externally
bonded steel plates.” Deft University of Technology. 1997. pp 1-8.
[4] Jones R, Swamy RN and Ang TH. “Under and over-reinforced concrete beams with
glued steel plates.” International Journal of Cement and Composites. 1982. Vol. 4 No.
1. pp 19-32.
[5] Jones R, Swamy RN and Charif A. “Plate separation and anchorage of reinforced
concrete beams strengthened by epoxy-bonded steel plates.” The Structural Engineers.
1988. Vol. 66 No.5. pp 85-94.
[6] Klaiber FW, Dunker KF, Wipf TJ and Sanders WW Jr. “Methods of strengthening
existing higway bridges.” NCHRP Rep. 193, Transportation research Board. Washington
DC 1987.
[7] Mukhopadhyaya P, Swamy N, Fellow, ASCE and Lynsdale C. “Optimizing
structural response of beams strengthened with GFRP plates.” Journal of Composites
for Construction. 1998. No. 2. pp 87 – 95.
[8] Swamy RN, Jones R and Bloxham JW. “Structural behaviour of reinforced concrete
beams, strengthened by epoxy-bonded steel plates.” The Structural Engineers. 1987.
Vol. 65 No. A2. pp 59-68.

[9] Quantrill RJ and Hollaway LC. “The flexural rehabilitation of reinforced concrete
beams by the use of prestressed advanced composite plates.” Comp Science &
Technology. 1998. No. 58. pp 1259 – 1275.
[10] Saadatmanesh H and Ehsani MR. “RC beams strengthened with GFRP plates. I:
experimental study.” Journal of Structural Engineers. 1991. Vol. 117 No.111. pp 3417-
3433.
[11] Van Gemert D. “Force transfer in epoxy bonded steel / concrete joints.” International
Journal of Adhesion and Adhesives. 1980. Vol.1 No. 2. pp 67-72.

APPENDIX
1. Paper entitled “BOND CHARACTERISTICS OF CFRP PLATE EPOXY BONDED TO CONCRETE
UNDER TENSION-COMPRESSION LOADS” presented on Malaysia Science and
Technology Congress (MSTC2003), on 23th – 25th September 2003, Kuala
Lumpur, Malaysia.
Shukur Abu Hassan1, Abdul Rahman Mohd. Sam2, Yob Saed Ismail3, Tan Chin Han4, Tan Sek Lin5
1 Faculty of Mechanical Engineering, Universiti Teknologi Malaysia, MSc 2 Faculty of Civil Engineering, Universiti Teknologi Malaysia, PhD
3 Faculty of Mechanical Engineering, Universiti Teknologi Malaysia, PhD 4Faculty of Civil Engineering, Universiti Teknologi Malaysia, BSc (Undergraduate
student) 5Faculty of Mechanical Engineering, Universiti Teknologi Malaysia, BSc
(Undergraduate student) Tel: 607-5535978, Fax: +607-5566159 Email address: [email protected]
ABSTRACT: Carbon Fibre Reinforced Polymer (CFRP) composites have been used successfully as strengthening material for reinforced concrete structures by externally plate-bonded technique. The CFRP materials have characteristics such as lightweight, high tensile strength and modulus to weight ratio, non-magnetic and highly corrosion resistant. Many studies have shown that using plate-bonded technique, the performance of the strengthened concrete member was enhanced. In this technique, the surface preparation of concrete substrate and CFRP material along with the type of epoxy adhesive used are the critical factors affecting the bonding performance of the system. This paper discusses the experimental result on the bonding characteristics between CFRP plate and concrete. The bond stress was determined along the 200 mm bond length of the bonded CFRP plate to concrete. A 50 mm width by 1.6 mm thick CFRP plate was used and bonded to 100x100x300 mm concrete prism. The bonded CFRP plate to concrete prism was tested under tension-compression loads and the results have shown that at lower load level, the shear stress distribution along the bonded length was relatively linear and uniform. However, at higher load when micro cracking occurred along the lap joints the shear stress distribution became non-linear. The investigation on mode of failure

of the sample show that the bond between the CFRP plate and concrete was very good.
Keywords: CFRP Plate, concrete, bond stress, tension-compression test 1.0 INTRODUCTION For cases where individual structural elements such as concrete beams, columns (for bridges, piers, parking lots, and even buildings) are in critical need of strengthening due to several reason such as corrosion of steel reinforcement in structural concrete, aging and deterioration of materials and changing or increasing traffic demands, therefore, direct replacement by new structural elements is not an option because of structural, practical, or economical constraints, making repair and rehabilitation a necessity [1]. In these cases, CFRP in the form of plate is applied to the tension surface of the concrete member is an easy and effective ways to increase the ultimate strength and the stiffness of the structural members [2,3,4].
CFRP is highly considered due to highly durable under various aggressive environmental conditions such as under polluted industrial area and under extreme temperatures. They are also considered to have relatively high durability when compared to that of metals used in construction. It is well known that many polymeric materials, like FRP, are prone to moisture absorption, and the swelling and dissolution can have serious implications on their mechanical properties. However, when FRP are used in conjunction with concrete to form a plate bonded composite beam, then the integrity of the plate-adhesive-concrete member does not solely depend on the plate material but also equally, on the properties of the interfaces involved in the joint, namely, the plate-adhesive and adhesive-concrete interfaces [6].
The epoxy synthetic based adhesives systems that currently developed by various manufacturers around the world have shown an excellence mechanical and physical behaviour when being used in civil construction for various applications [7]. The increasing used of this type of structural adhesive in strengthening and upgrading using bonded steel or FRP plates technique need to be understood by engineers especially about the bonding performances when epoxy being used to bond different type of materials, for example FRP to steel or FRP to concrete.
This paper presented the experimental study of bonding behaviour of CFRP plate-concrete prism joint under tension-compression loads while the results will be discussion onto local load distribution, load transfer length, bond stress distribution, and modes of failure. 2.0 Experimental Programme 2.1 Details of Materials for Tension-Compression Bond Test
A total of three CFRP Plate-epoxy-concrete prism control sample have been prepared namely BOSTUS-C01, BOSTUS-C02 and BOSTUS-C03. The concrete prisms size of 100 x 100 x 300 mm was designed to reach compressive strength of 40 MPa at the age of 28 days. The concrete was produced using maximum coarse aggregate size of

10 mm with water cement ratio of 0.47. The unidirectional CFRP plate of 1.6 mm x 50 mm x 390 mm with an average tensile strength and modulus of 2400 MPa and 135 GPa respectively, was used in this study [8]. The bonded of concrete prism was prepared by sand blasting technique and clean with chemical solvent (acetone) prior bonding to CFRP plate. Resifix 31, two-part (epoxy and hardener the ratio of 3:1) was mixed using a slow speed electric mixer until the mixture showed a uniform grey material. The epoxy was applied to both bonded surface of concrete and CFRP respectively just after the mixed. The bonding process has been done using special design of bonding jig that controlled bond alignment, bond pressure and adhesive thickness. The bonding process of CFRP Plate-epoxy-concrete is shown in Figure C1.
2.2 Measurements and Instrumentation for Tension-Compression Bond Test
The static tensile load was applied uniformly using Universal Testing Machine Model Instron 100 with loading rate of 1 mm/min. The load has been applied onto the specimen up to failure. Twelve 120-Ω TML type BFLA-2-5 electrical strain gauges of 2 mm gauge length have been installed onto the CFRP plates for both side A and B, respectively as shown in Figure C2. The CFRP plate strains have been measured at every 5kN load increment and were recorded using data logger TDS-303 up to failure. Four units of TML LVDT sensitivity of 500 x 10-6/mm and maximum displacement of 25 mm have been installed at both parallel side at upper stressed end and lower free end. These instruments have been used to measure a relative displacement (slip) between CFRP Plate and concrete. 3.0 Results and Analysis
The test data have been analysed and are discussed as follows;
Side B
FIGURE C1: Electrical strain gauges location
Free edge
Side A
CFRP Plate
CFRP Plate
concrete

3.1 Force Transfer between CFRP Plate and Concrete Prism The ultimate tension applied load near to failure for specimen CI and CII is
55.22kN and 57.93kN respectively. By assuming perfect bonding between the CFRP plate and concrete prism, the local longitudinal force and load transfer at various load level along the bonded plate length for each specimen was analysed and calculated from the local CFRP strain data. The result obtained shows that local load at location 0 mm (free edge A) is half the value of applied load. From the plotted graph in Figure 3, it showed that the load transfer from the CFRP plate to the concrete for specimen CII at low load level is fairly linear and occurs at the uniform rate. At this stage, bond transfer length is quite short. However, when the applied load increased, it can be seen that the force distribution becomes much more non-uniform and non-linear.
Control II Sample: Local load at CFRP plate (N) versus Distance from free edge A (mm)- Average A and B
0
5.000
10.000
15.000
20.000
25.000
30.000
0 20 40 60 80 100 120 140 160
Distance from free edge (mm)
Loca
l loa
d at
CFR
P p
late
(N
)
5 kN 10 kN 15 kN 20 kN 30 kN 40 kN50 kN 55 kN
FIGURE 3: Local Load Distribution along CFRP Plate for Specimen CII
3.2 Strain distribution along the bonded CFRP Plate The data of strain distribution along the bonded CFRP plate were analysed.
Average strain at both side of CFRP plates for each specimen was calculated and plotted as shown in Figure 4. At low load level, strain distribution along the plates for both specimens are fairly linear and uniform but with further increase of loads, the local strain become non-uniform and non-linear.

FIGURE 4: Graph Local Strain versus Distance for Specimen CII
3.4 Bond stress distribution
The average bond stress was calculated using formula [6,7], τave = Fult / (2 x LB x w), where F ult = ultimate applied load, LB = length of bonded surface and w = width of bonded surface is shown in Table 1.
TABLE 1: CFRP Plate-Concrete Prism Bond Stress Experimental Results
Specimen Average bond stress, τave (MPa)
Maximum local bond stress, τlocal (MPa)
Maximum bond stress concentration factor, λ
Location from free edge A (mm)
CI 3.68 6.85 1.86 35 – 65
CII 3.88 7.73 2.00 65 - 95
The transfer of the longitudinal force from the CFRP plate to the concrete prism creates shear stress in the plate-adhesive, adhesive and concrete-adhesive interfaces. With the known value of plate width and distance between two gauges, local bond stress along the bonded length can be determined by using [6,7], τlocal= ∆Fi -j / (b x ∆L). Where, ∆Fi-j = difference in longitudinal force between two consecutive strain gauge locations. ∆Li-j = distance between two consecutive strain gauge location and b = with of the CFRP plate. The different between two consecutives local force are assumed linear. The local bond stress distribution along the bonded length is calculated on 10kN, 30kN, 50kN and at ultimate load for both specimens. The result on bond stress distribution for both specimens is easy to interprete in form of histogram as in Figure 5(a) and 5(b).
Control II Sample: Local strain (µ) versus Distance from free edge A for every load increment (mm)- Average
0
500
1000
1500
2000
2500
3000
0 20 40 60 80 100 120 140
Distance from free edge for every load increment (mm)
Loca
l stra
in (µ
)
10 kN 20 kN 30 kN 40 kN 50 kN

From Figure 5, both specimens show the maximum local stress concentration at nearby free edge A of bonding length at low applied load level. It can be explained by the force transfer length is short and the maximum plate force occur at this location. However, the increase of the applied load, the local shear stress propogated from free edge A into the interior bonded length. The increasing of local debonding between CFRP and concrete when further increased of the applied load is the main reasons contribute to full debonding of CFRP from concrete.
3.5 Modes of failures
FIGURE 5(a): Typical Shear Stress Distribution for Specimen CII
Control I Sample: Local shear stress distribution (Pa) versus Distance from free edge (mm)
0
1.000.000
2.000.000
3.000.000
4.000.000
5.000.000
6.000.000
7.000.000
8.000.000
0 20 40 60 80 100 120 140
Distance from free edge (mm)
Loca
l she
ar s
tress
dis
tribu
tion
(Pa)
10 kN 20 kN 30 kN 40 kN 50 kN
Control II Sample: Local shear stress distribution (Pa) versus Distance from free edge A (mm)- Average
0
1.000.000
2.000.000
3.000.000
4.000.000
5.000.000
6.000.000
7.000.000
8.000.000
0 20 40 60 80 100 120 140
Distance from free edge (mm
Loca
l she
ar s
tress
dis
tribu
tion
(Pa)
10 kN 20 kN 30 kN 40 kN 50 kN 55 kN
FIGURE 5(b): Typical Shear Stress Distribution for Specimen CII

The type of modes of failure of CFRP-concrete can be occured in three
conditions, that is: (1) cohesive failure; (2) adhesive failure, and (3) concrete shearing failure [6].
From the observation on specimen CII, the bond failure is mostly contibute by concrete shearing and this due to high stress developed at free edge A of the specimen. The crack is then propagated down and toward the bonded area. Both side of the bonded joint was pullout and failure mode on side A is dominant by concrete shearing as shown in Figure 6 (a).
FIGURE 6 (a) : Failure Modes for Specimen CII (Side A)
FIGURE 6 (b) : Failure Modes for Specimen CII (Side B)
Free edge A
Concrete shearing
epoxy intact onto CFRP due to concrete shearing
CFRP Interlamina filamentary failure
Concrete failure due to high stress concentration

The failure nearby free edge A of the bonding area at side B shown in Figure 6 (b) sustain concrete shearing and formed little interlamina filamentary type of failure of CFRP plate which bonded to concrete surface. Both conditions showed the bonding of epoxy used is still good. Failure mode on side A shows that shear strength of concrete is weak at high load level. The overall of failure mode for specimen CII is concrete shearing with uniform thickness for the most bonding area. 4.0 CONCLUSION
The conclusions of this study are as follows: 1. The load transfer from the CFRP plates to the concrete at low load level is fairly
linear and occurred at a uniform rate. 2. At higher loads level, the local force distribution become non-uniform and non-linear
with local debonding occurred at free edge A. 3. Local bond stress distribution and local strain are both influenced by crack history,
where the debonding of the CFRP plate by concrete microcraking caused the progressive growth of bond transfer length.
4. CFRP-concrete failure mode mostly dominant by concrete shearing failure due to low tensile or shear strength of concrete compared with CFRP and epoxy adhesive.
5.0 REFERENCES [1]. Vistasp M. Karbhari, Lei Zhao. “Use of composites for 21st century civil infrastructure”, Computer methods in applied mechanics and engineering. 185, pp. 433-454, 2000 [2]. Houssam Toutanji, Gerardo Ortiz. “The effect of surface preparation on the bond interface between FRP sheets and concrete members” Composite Structure Journal. S3, pp. 457-462, 2001. [3]. A.R. Mohd. Sam, S. Abu Hassan and I. Johan Azmi, “ Performance of GFRP Plate as Strengthening Material for Reinforcement Concrete Beams,” Research Seminar on Materials and Construction, Oct 29th –30th 2002, UTM, Malaysia. [4]. A.R. Mohd. Sam, S. Abu Hassan and K. Wee Seng, “ Performance of Concrete Column Strengthened with CFRP Sheet,” Research Seminar on Materials and Construction, Oct 29th –30th 2002, UTM, Malaysia. [5]. A.R. Mohd. Sam, S. Abu Hassan and C. Hoe Cheong, “ The Flexural Behaviour of Reinforced Concrete Beams Strengthened with CFRP Plates,” Research Seminar on Materials and Construction, Oct 29th –30th 2002, UTM, Malaysia. [6] P. Mukhopadhyaya*, R.N.Swamy, C.J.Lynsdale. “Influence of aggressive exposure conditions on the

behaviour of adhesive bonded concrete-GFRP joints.” Construction and Building Materials Journal.12,1998 pp. 427-446. [7]. Chajes M.J., Finch W.W., Januszka T.F. and Thomson T.A., “Bond and Force Transfer of Composite Material Plates Bonded to Concrete,” ACI Structural Journal/March-April, 1996 [8]. A.R. Mohd. Sam, S. Abu Hassan and Y. Saed Ismail, “ Tensile Behaviour of CFRP and GFRP Reinforcements,” Research Seminar on Materials and Construction, Oct 29th –30th 2002, UTM, Malaysia.

UNIVERSITI TEKNOLOGI MALAYSIA
UTM/RMC/F/0024 (1998)
BORANG PENGESAHAN
LAPORAN AKHIR PENYELIDIKAN
TAJUK PROJEK : THE STUDY OF BONDING BEHAVIOUR BETWEEN FIBRE
FIBRE REINFORCED POLYMER COMPOSITE PLATE AND
CONCRETE PRISM UNDER TROPICAL CLIMATE
Saya: DR.YOB SAED ISMAIL
(HURUF BESAR)
Mengaku membenarkan Laporan Akhir Penyelidikan ini disimpan di Perpustakaan Universiti Teknologi Malaysia dengan syarat-syarat kegunaan seperti berikut :
1. Laporan Akhir Penyelidikan ini adalah hakmilik Universiti Teknologi Malaysia.
2. Perpustakaan Universiti Teknologi Malaysia dibenarkan membuat salinan untuk tujuan rujukan sahaja.
3. Perpustakaan dibenarkan membuat penjualan salinan Laporan Akhir
Penyelidikan ini bagi kategori TIDAK TERHAD.
4. * Sila tandakan ( / )
SULIT (Mengandungi maklumat yang berdarjah keselamatan atau Kepentingan Malaysia seperti yang termaktub di dalam AKTA RAHSIA RASMI 1972). TERHAD (Mengandungi maklumat TERHAD yang telah ditentukan oleh Organisasi/badan di mana penyelidikan dijalankan). TIDAK TERHAD TANDATANGAN KETUA PENYELIDIK
Nama & Cop Ketua Penyelidik Tarikh : _________________
√
CATATAN : * Jika Laporan Akhir Penyelidikan ini SULIT atau TERHAD, sila lampirkan surat daripada pihak berkuasa/organisasi berkenaan dengan menyatakan sekali sebab dan tempoh laporan ini perlu dikelaskan sebagai SULIT dan TERHAD.
Lampiran 20