the structure, electrical properties and chemical
TRANSCRIPT

RSC Advances
PAPER
Ope
n A
cces
s A
rtic
le. P
ublis
hed
on 0
1 Ju
ne 2
017.
Dow
nloa
ded
on 1
0/27
/202
1 8:
31:0
7 PM
. T
his
artic
le is
lice
nsed
und
er a
Cre
ativ
e C
omm
ons
Attr
ibut
ion-
Non
Com
mer
cial
3.0
Unp
orte
d L
icen
ce.
View Article OnlineView Journal | View Issue
The structure, el
AGH University of Science and Technology, F
al. A. Mickiewicza 30, 30-059 Krakow, Polan
12 617 52 36; Tel: +48 12 617 25 37
† Electronic supplementary informa10.1039/c7ra04205a
Cite this: RSC Adv., 2017, 7, 28898
Received 13th April 2017Accepted 24th May 2017
DOI: 10.1039/c7ra04205a
rsc.li/rsc-advances
28898 | RSC Adv., 2017, 7, 28898–289
ectrical properties and chemicalstability of porous Nb-doped SrTiO3 – experimentaland theoretical studies†
Ewa Drozdz * and Andrzej Kolezynski
A series of porous SrTi1�xNbxO3 samples (with x ¼ 0, 1, 2 and 3 mol%) were prepared by wet synthesis and
sintered at 1573 K. Single phase samples were obtained for each composition, as confirmed by XRD
measurements. For all samples, aging tests in CO2/H2O atmosphere and electrochemical impedance
spectroscopy measurements in air and hydrogen (reduced) atmosphere were carried out.
Simultaneously, for model superstructures corresponding to 2 and 3 mol% experimental compositions,
FP-LAPW DFT calculations of electronic structure and bonding properties (using QTAiM approach) were
performed. Both experimental and theoretical results show an increase of cell parameters with
increasing niobium amount. The influence of the amount of niobium on the microstructure of the
synthesized samples as well as on their chemical stability was also observed. Electrical properties
measurements showed different conduction mechanism for synthetic air and reduced atmosphere, i.e.
mixed ionic-electron conduction and dominating electron conduction, respectively.
Introduction
SrTiO3 is one of the best known and most widely used perov-skite materials with interesting properties primarily resultingfrom structure doping with aliovalent additives. Nowadays, thestudies devoted to its potential use, among others, as materialsfor energy conversion (therein mixed ionic-electronic conduc-tors1–3 and thermoelectric materials4,5) are becoming increas-ingly important from applicational viewpoint. The modicationof various properties of SrTiO3 material can be achieved by itscarefully designed doping in one (or simultaneously both)cationic sublattices with various admixtures. A lot of papershave been devoted to studies on defects and electrical proper-ties of bulk Nb–SrTiO3 materials (inter alia6–8) but they con-cerned dense materials consisting of grains with at leastmicrometer sizes. Only a few papers [e.g.9,10] put stress on themicrostructure (grain size and porosity) in the context of theseproperties. Abrantes et al.9 observed, during evaluation ofresponse time of Nb-doped materials in different atmospheres,that the transient response of very porous samples with 5 mol%Nb aer suddenly changing from reducing to oxidizing condi-tions are much shorter than in the case of bulk ones. Thusdense materials react slowly to changes in the atmosphere,while in the porous materials respective changes are much
aculty of Materials Science and Ceramics,
d. E-mail: [email protected]; Fax: +48
tion (ESI) available. See DOI:
08
faster (the diffusion time inside individual grains becomes evenaround six order of magnitude smaller). This information isvaluable from applicational viewpoint – in the case of the solid–gas reactions, the porous microstructure provides large surfacefor the possible reaction. This makes porous Nb-doped SrTiO3
very interesting materials from the viewpoint of its possible useas composite component for SOFC anodes or oxide membranesin gas sensors (e.g. it is well known that in the case of SOFCmaterials themost important factor is the amount/effective areaof TPB – Triple Phase Boundaries, directly related to porositylevel which is required to be higher than 30 vol% and grain sizewhich has to be nanosized).
The drawback of expanded surface materials is, however, anincrease of the yield of competitive, disturbing reactions. One ofthe fundamental property of this type of perovskite materials istheir pure stability in atmosphere containing carbon dioxideand water vapor.11–13 This factor is especially important formaterials that would potentially work in hydrocarbon environ-ment due to a possibility of oxidation of organic carbon tocarbon dioxide. Compared to ceranes, titanates, they exhibithigher chemical stability (in CO2 and H2O atmosphere) and,what is more, strontium titanate is one of the most stablerepresentatives of this perovskite group. To our best knowledge,the effect of aliovalent dopant introduction to titanium sub-lattice on chemical stability of SrTiO3 in the presence of CO2/H2O has not been studied so far. On the other hand, the onlystudy on introduction of donor dopant to strontium sub-latticeshowed that substituting strontium with yttrium does not lowerthe chemical stability of strontium titanate.14 Analogous studieson donor doping inuence on chemical stability were
This journal is © The Royal Society of Chemistry 2017

Paper RSC Advances
Ope
n A
cces
s A
rtic
le. P
ublis
hed
on 0
1 Ju
ne 2
017.
Dow
nloa
ded
on 1
0/27
/202
1 8:
31:0
7 PM
. T
his
artic
le is
lice
nsed
und
er a
Cre
ativ
e C
omm
ons
Attr
ibut
ion-
Non
Com
mer
cial
3.0
Unp
orte
d L
icen
ce.
View Article Online
conducted with respect to other perovskite systems (cobaltite,15
ferrite16) and their results indicate that the niobium dopant in Bsublattice stabilizes such systems. The authors of these workstook into consideration thermodynamical aspect of niobiumaddition based on average metal–oxygen bond energy (ABE).The idea of such calculations (ABE) was originally proposed byVoorhoeve et al.17 to estimate the binding energy of oxygen withmetal ions in perovskite oxides.
There are also many theoretical studies reported in literature(based on both, DFT and HF calculations), devoted to variousproperties of niobium doped SrTiO3 materials. One can ndtheoretical papers analyzing structural, electrical and catalyticproperties of doped and undoped perovskite structures,including Nb-doped strontium titanate.18–21 Based on variouscomputational methods, insulator to metal transition, theposition of Nb dopants (Ti, Sr or interstitial initial sites) withinNb-doped SrTiO3 structure, partial ionic charges and unit cellsize dependence on dopant as well as doping mechanism andproperties and formation energies of substitutional or vacancydefects and dependence of electrical and optical properties onpoint defects has been studied.22–28
Most of theoretical papers devoted to electrical properties ofNb-doped SrTiO3 contain detailed analysis of electronic struc-ture properties (DOS and bandstructure).22,23,29 However, thesepapers were concerned with some heavy doping models (highniobium concentrations), most probably due to prohibitiverequirements for computer power in the case of big supercellcalculations, necessary to model (low dopant concentration)and only recently, the calculations of electronic structure andoptical properties for smaller niobium concentration (0.74–2.5at% of niobium, corresponding to approx. 4–14 at% of titaniumatoms substituted by niobium) has been reported.28 Moreover,these works report some opposite ndings, like e.g. oppositetendency of partial, charge transfer due to titanium substitutionwith niobium, towards oxygen or niobium22,23 (HF or DFT ones).
Although Delugas et al.29 stated that high-Nb doping concen-tration in SrTiO3 are experimentally achievable and apparentlykeen to reach of high electron mobility, in practice, niobiumconcentration in titanium perovskite structures is limited to fewper cents, due to interference with other phases being synthe-sized simultaneously, resulting in synthesis of multiphase,inhomogeneous materials.6,30,31 Therefore much more realisticare the simulations of the systems with much lesser amount ofdoping agent. In this work, the results of WIEN2k FP-LAPW DFTcalculations of electronic structure and topological properties ofelectron density, carried out for Nb doped SrTiO3 model struc-tures (for 0.42 at% and 0.56 at% of niobium, corresponding toapprox. 2 mol% and 3 mol% of Ti substituted by Nb) and used inanalysis of experimental results are presented.
ExperimentalSynthesis
Porous undoped and Nb-doped SrTiO3materials were obtained bywet synthesis – sol–gel method. Ti(O–iPr)4—titanium(IV) isoprop-oxide and niobium ethoxide were applied as precursors of tita-nium and niobium respectively. These two reagents were
This journal is © The Royal Society of Chemistry 2017
dissolved in anhydrous methanol and next cations were com-plexed by addition of citric acid. Then the aqueous solution ofstrontiumnitrate (the concentration was conrmed by gravimetricanalysis) was introduced into methanol solution containing tita-nium and niobium cations. The obtained sol was heated onmagnetic stirrer at around 453 K until its densication (transitionto a gel). Aer the calcination (1173 K) the pallets under pressure 5� 105 Pa were formed and next sintered at 1573 K for 8 hours.
All reagents used for the synthesis were analytically pure(provided by Aldrich or Avantor Company).
A series of samples SrTi1�xNbxO3 where x ¼ 0, 1, 2, 3 mol%were obtained and characterized.
Methods
Phase composition and unit cell parameters were determinedbased on XRD measurements carried out on Philips X'Pert Prodiffractometer with monochromatized Cu-Ka radiation fordiffraction angles 2q, within the range from 20 to 100. UsingRietveld phase analysis, the amounts of observed phases andcrystallographic parameters were determined quantitatively.The crystallite sizes were estimated from the X-ray line broad-ening of the selected peaks, using Scherrer's approach.
The observation of pallets fracture morphology was per-formed using scanning electron microscopy (SEM) (NovaNanoSEM 200 FEI and Oxford Instruments) coupled with X-rayenergy dispersive spectroscopy (EDAX company apparatus). Thepallets porosity was measured using Archimedes method andspecic surface by BET method.
The electrical properties of obtained samples were examinedby means of impedance spectroscopy (Solartron, FRA 1260 withdielectric interface 1294). Before measurements, platinum pastewas applied on the pallets (sintered at 1573 K, 10 mm in diam-eter and a thickness of 2.5 mm) and red. The measurementswere performed in temperature range of 573–973 K in syntheticair and mixture of 10% H2 in Ar. The frequency range was 0.1Hz–1 MHz and the amplitude of the sinusoidal voltage was10 mV. Before the actual test the samples were initially annealedat hydrogen/argon atmosphere for 24 h (heated to 1023 K, kept atthis temperature for an hour and then cooled to room temper-ature). Moreover, samples were equilibrated for 30 min at thespecic temperature before actual EIS measurement.
In order to determine the chemical stability in CO2 and H2Oatmosphere, the undoped and Nb-doped SrTiO3 pallets wereexposed to carbon dioxide and water vapour-containing atmo-sphere (7% CO2 and 100% HR) for 700 h at room temperature.In order to check the stability of samples (original and subjectedto aging procedure), thermogravimetric measurements (on SDT2960 TA Instruments apparatus) coupled with mass spectros-copy (QMD 300 ThermoStar Balzers mass spectrometer) wereused. All samples weighing around 50 mg were placed in SDTapparatus in platinum crucible and heated in synthetic airatmosphere with 10 deg min�1 heating rate.
Computational details
Ab initio calculations were carried out using Full PotentialAugmented Plan Wave Method (FP-LAPW) within Density
RSC Adv., 2017, 7, 28898–28908 | 28899
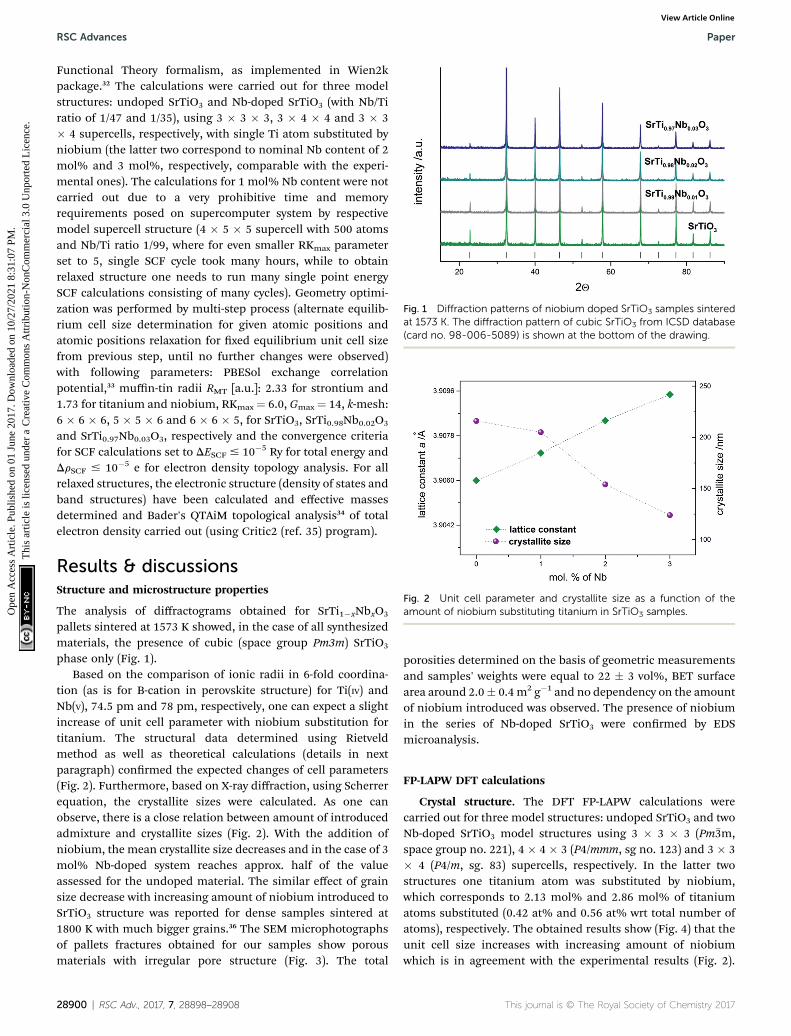
Fig. 1 Diffraction patterns of niobium doped SrTiO3 samples sinteredat 1573 K. The diffraction pattern of cubic SrTiO3 from ICSD database(card no. 98-006-5089) is shown at the bottom of the drawing.
Fig. 2 Unit cell parameter and crystallite size as a function of theamount of niobium substituting titanium in SrTiO3 samples.
RSC Advances Paper
Ope
n A
cces
s A
rtic
le. P
ublis
hed
on 0
1 Ju
ne 2
017.
Dow
nloa
ded
on 1
0/27
/202
1 8:
31:0
7 PM
. T
his
artic
le is
lice
nsed
und
er a
Cre
ativ
e C
omm
ons
Attr
ibut
ion-
Non
Com
mer
cial
3.0
Unp
orte
d L
icen
ce.
View Article Online
Functional Theory formalism, as implemented in Wien2kpackage.32 The calculations were carried out for three modelstructures: undoped SrTiO3 and Nb-doped SrTiO3 (with Nb/Tiratio of 1/47 and 1/35), using 3 � 3 � 3, 3 � 4 � 4 and 3 � 3� 4 supercells, respectively, with single Ti atom substituted byniobium (the latter two correspond to nominal Nb content of 2mol% and 3 mol%, respectively, comparable with the experi-mental ones). The calculations for 1 mol% Nb content were notcarried out due to a very prohibitive time and memoryrequirements posed on supercomputer system by respectivemodel supercell structure (4 � 5 � 5 supercell with 500 atomsand Nb/Ti ratio 1/99, where for even smaller RKmax parameterset to 5, single SCF cycle took many hours, while to obtainrelaxed structure one needs to run many single point energySCF calculations consisting of many cycles). Geometry optimi-zation was performed by multi-step process (alternate equilib-rium cell size determination for given atomic positions andatomic positions relaxation for xed equilibrium unit cell sizefrom previous step, until no further changes were observed)with following parameters: PBESol exchange correlationpotential,33 muffin-tin radii RMT [a.u.]: 2.33 for strontium and1.73 for titanium and niobium, RKmax ¼ 6.0, Gmax ¼ 14, k-mesh:6 � 6 � 6, 5 � 5 � 6 and 6 � 6 � 5, for SrTiO3, SrTi0.98Nb0.02O3
and SrTi0.97Nb0.03O3, respectively and the convergence criteriafor SCF calculations set to DESCF # 10�5 Ry for total energy andDrSCF # 10�5 e for electron density topology analysis. For allrelaxed structures, the electronic structure (density of states andband structures) have been calculated and effective massesdetermined and Bader's QTAiM topological analysis34 of totalelectron density carried out (using Critic2 (ref. 35) program).
Results & discussionsStructure and microstructure properties
The analysis of diffractograms obtained for SrTi1�xNbxO3
pallets sintered at 1573 K showed, in the case of all synthesizedmaterials, the presence of cubic (space group Pm3m) SrTiO3
phase only (Fig. 1).Based on the comparison of ionic radii in 6-fold coordina-
tion (as is for B-cation in perovskite structure) for Ti(IV) andNb(V), 74.5 pm and 78 pm, respectively, one can expect a slightincrease of unit cell parameter with niobium substitution fortitanium. The structural data determined using Rietveldmethod as well as theoretical calculations (details in nextparagraph) conrmed the expected changes of cell parameters(Fig. 2). Furthermore, based on X-ray diffraction, using Scherrerequation, the crystallite sizes were calculated. As one canobserve, there is a close relation between amount of introducedadmixture and crystallite sizes (Fig. 2). With the addition ofniobium, the mean crystallite size decreases and in the case of 3mol% Nb-doped system reaches approx. half of the valueassessed for the undoped material. The similar effect of grainsize decrease with increasing amount of niobium introduced toSrTiO3 structure was reported for dense samples sintered at1800 K with much bigger grains.36 The SEM microphotographsof pallets fractures obtained for our samples show porousmaterials with irregular pore structure (Fig. 3). The total
28900 | RSC Adv., 2017, 7, 28898–28908
porosities determined on the basis of geometric measurementsand samples' weights were equal to 22 � 3 vol%, BET surfacearea around 2.0� 0.4 m2 g�1 and no dependency on the amountof niobium introduced was observed. The presence of niobiumin the series of Nb-doped SrTiO3 were conrmed by EDSmicroanalysis.
FP-LAPW DFT calculations
Crystal structure. The DFT FP-LAPW calculations werecarried out for three model structures: undoped SrTiO3 and twoNb-doped SrTiO3 model structures using 3 � 3 � 3 (Pm�3m,space group no. 221), 4 � 4 � 3 (P4/mmm, sg no. 123) and 3 � 3� 4 (P4/m, sg. 83) supercells, respectively. In the latter twostructures one titanium atom was substituted by niobium,which corresponds to 2.13 mol% and 2.86 mol% of titaniumatoms substituted (0.42 at% and 0.56 at% wrt total number ofatoms), respectively. The obtained results show (Fig. 4) that theunit cell size increases with increasing amount of niobiumwhich is in agreement with the experimental results (Fig. 2).
This journal is © The Royal Society of Chemistry 2017

Fig. 3 SEMmicrophotographs of fractures of Nb-doped SrTiO3 pallets (1, 2 and 3mol% of Nb). All microphotographs were prepared at the samemagnification (20 000�).
Paper RSC Advances
Ope
n A
cces
s A
rtic
le. P
ublis
hed
on 0
1 Ju
ne 2
017.
Dow
nloa
ded
on 1
0/27
/202
1 8:
31:0
7 PM
. T
his
artic
le is
lice
nsed
und
er a
Cre
ativ
e C
omm
ons
Attr
ibut
ion-
Non
Com
mer
cial
3.0
Unp
orte
d L
icen
ce.
View Article Online
This is a direct result of local structure modication in niobiumproximity: while niobium ions are only slightly bigger thantitanium ones (78 vs. 74.5 pm), Nb–O bonds are visibly biggerthan Ti–O bonds (�1.965 A vs.�1.95 A, Table 2.) and so are theiroctahedra. Moreover, since niobium and titanium polyhedraare corner-shared, the increased length of Nb–O bonds leads toa shrinkage of respective Ti–O bonds and titanium polyhedradeformation. In the case of perovskite materials in order todetermine the extent of polyhedral deformation one can use theso called polyhedra deformation indicators:37–39 distortion indexD, quadratic elongation <l>, bond angle variance s2 and effec-tive coordination number ECoN (detailed description can be
Fig. 4 Unit cell and band gap sizes calculated for undoped and 2mol%and 3 mol% niobium doped SrTiO3 optimized model superstructures(full geometry optimization, i.e. unit cell size and atomic position hasbeen carried out).
This journal is © The Royal Society of Chemistry 2017
found in ESI†). The results of structural analysis based on theabove descriptors are presented in Table 1 (only rst two coor-dination spheres are shown, since 3rd coordination sphere with8 titanium atoms has approx. 6.75 A and 6.77 A radius for 2mol% and 3 mol% Nb-doped SrTiO3, respectively, which ismore than a half of the nearest distance between two niobiumatoms in these structure, equal to 11.68 A and 11.71 A respec-tively). When we look closer at the detailed information aboutthe properties of titanium octahedra in 1st and 2nd coordinationsphere of niobium polyhedron (depicted on Fig. 5), we canobserve that in both doped structures, 6 titanium polyhedra in1st coordination sphere are visibly more distorted (octahedronelongation, bond length distortion, bond angle variance) than12 belonging to 2nd coordination sphere, for which thisdistortion is almost negligible.
Electron density topology. Based on the total electrondensities obtained in FP-LAPW calculations for model struc-tures, the topological analysis of electron density using Bader'sQTAiM method was carried out and respective bond criticalpoints (BCP) properties are presented in Table 2 (since there aremany symmetrically nonequivalent atoms in unit cells of modelstructures and therefore also of BCPs, only average values arepresented here). The obtained results show that all bonds havesignicant ionic character and Sr–O bonds are much weakerthan Nb–O and Ti–O ones (several times lower charge concen-tration in bonding region) and thus they will be more prone tochanges than bonds formed by B cations and titanium octa-hedra are slightly distorted (the further from niobium octahe-dron, the smaller distortion) in order to compensate B cation–oxygen bonds changes when niobium is introduced into SrTiO3
structure.
RSC Adv., 2017, 7, 28898–28908 | 28901
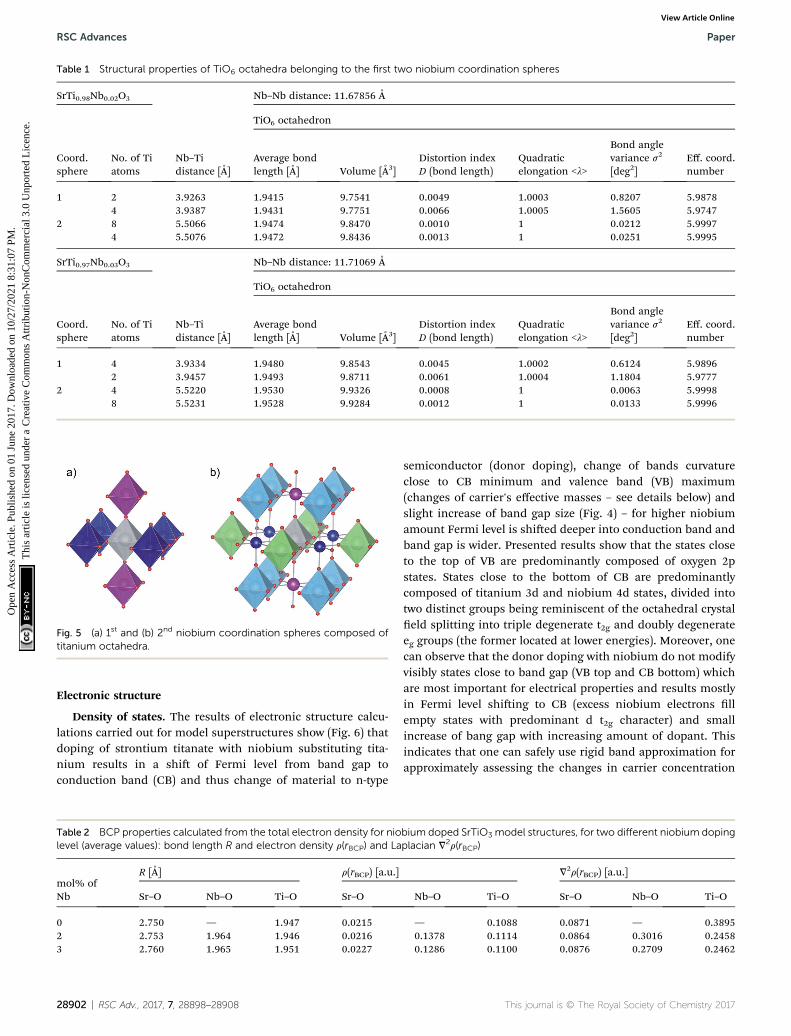
Table 1 Structural properties of TiO6 octahedra belonging to the first two niobium coordination spheres
SrTi0.98Nb0.02O3
Nb–Tidistance [A]
Nb–Nb distance: 11.67856 A
Coord.sphere
No. of Tiatoms
TiO6 octahedron
Average bondlength [A] Volume [A3]
Distortion indexD (bond length)
Quadraticelongation <l>
Bond anglevariance s2
[deg2]Eff. coord.number
1 2 3.9263 1.9415 9.7541 0.0049 1.0003 0.8207 5.98784 3.9387 1.9431 9.7751 0.0066 1.0005 1.5605 5.9747
2 8 5.5066 1.9474 9.8470 0.0010 1 0.0212 5.99974 5.5076 1.9472 9.8436 0.0013 1 0.0251 5.9995
SrTi0.97Nb0.03O3
Nb–Tidistance [A]
Nb–Nb distance: 11.71069 A
Coord.sphere
No. of Tiatoms
TiO6 octahedron
Average bondlength [A] Volume [A3]
Distortion indexD (bond length)
Quadraticelongation <l>
Bond anglevariance s2
[deg2]Eff. coord.number
1 4 3.9334 1.9480 9.8543 0.0045 1.0002 0.6124 5.98962 3.9457 1.9493 9.8711 0.0061 1.0004 1.1804 5.9777
2 4 5.5220 1.9530 9.9326 0.0008 1 0.0063 5.99988 5.5231 1.9528 9.9284 0.0012 1 0.0133 5.9996
Fig. 5 (a) 1st and (b) 2nd niobium coordination spheres composed oftitanium octahedra.
RSC Advances Paper
Ope
n A
cces
s A
rtic
le. P
ublis
hed
on 0
1 Ju
ne 2
017.
Dow
nloa
ded
on 1
0/27
/202
1 8:
31:0
7 PM
. T
his
artic
le is
lice
nsed
und
er a
Cre
ativ
e C
omm
ons
Attr
ibut
ion-
Non
Com
mer
cial
3.0
Unp
orte
d L
icen
ce.
View Article Online
Electronic structure
Density of states. The results of electronic structure calcu-lations carried out for model superstructures show (Fig. 6) thatdoping of strontium titanate with niobium substituting tita-nium results in a shi of Fermi level from band gap toconduction band (CB) and thus change of material to n-type
Table 2 BCP properties calculated from the total electron density for niolevel (average values): bond length R and electron density r(rBCP) and La
mol% ofNb
R [A] r(rBCP) [a.u.]
Sr–O Nb–O Ti–O Sr–O
0 2.750 — 1.947 0.02152 2.753 1.964 1.946 0.02163 2.760 1.965 1.951 0.0227
28902 | RSC Adv., 2017, 7, 28898–28908
semiconductor (donor doping), change of bands curvatureclose to CB minimum and valence band (VB) maximum(changes of carrier's effective masses – see details below) andslight increase of band gap size (Fig. 4) – for higher niobiumamount Fermi level is shied deeper into conduction band andband gap is wider. Presented results show that the states closeto the top of VB are predominantly composed of oxygen 2pstates. States close to the bottom of CB are predominantlycomposed of titanium 3d and niobium 4d states, divided intotwo distinct groups being reminiscent of the octahedral crystaleld splitting into triple degenerate t2g and doubly degenerateeg groups (the former located at lower energies). Moreover, onecan observe that the donor doping with niobium do not modifyvisibly states close to band gap (VB top and CB bottom) whichare most important for electrical properties and results mostlyin Fermi level shiing to CB (excess niobium electrons llempty states with predominant d t2g character) and smallincrease of bang gap with increasing amount of dopant. Thisindicates that one can safely use rigid band approximation forapproximately assessing the changes in carrier concentration
bium doped SrTiO3 model structures, for two different niobium dopingplacian V2r(rBCP)
V2r(rBCP) [a.u.]
Nb–O Ti–O Sr–O Nb–O Ti–O
— 0.1088 0.0871 — 0.38950.1378 0.1114 0.0864 0.3016 0.24580.1286 0.1100 0.0876 0.2709 0.2462
This journal is © The Royal Society of Chemistry 2017
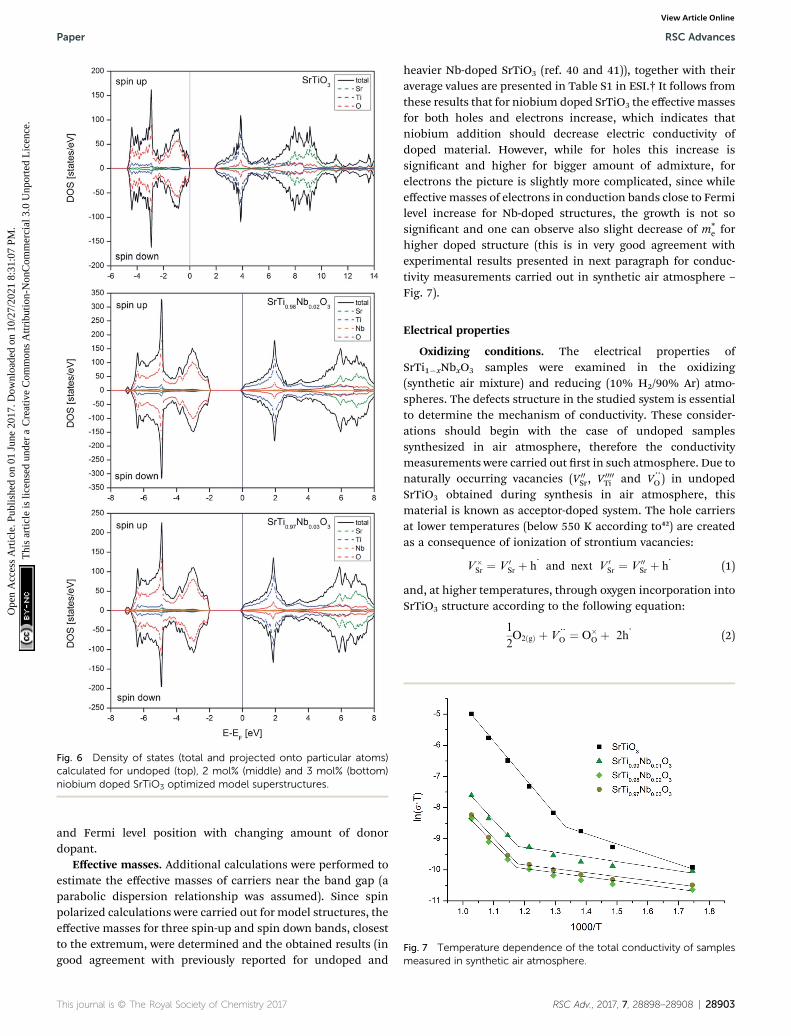
Fig. 6 Density of states (total and projected onto particular atoms)calculated for undoped (top), 2 mol% (middle) and 3 mol% (bottom)niobium doped SrTiO3 optimized model superstructures.
Fig. 7 Temperature dependence of the total conductivity of samplesmeasured in synthetic air atmosphere.
Paper RSC Advances
Ope
n A
cces
s A
rtic
le. P
ublis
hed
on 0
1 Ju
ne 2
017.
Dow
nloa
ded
on 1
0/27
/202
1 8:
31:0
7 PM
. T
his
artic
le is
lice
nsed
und
er a
Cre
ativ
e C
omm
ons
Attr
ibut
ion-
Non
Com
mer
cial
3.0
Unp
orte
d L
icen
ce.
View Article Online
and Fermi level position with changing amount of donordopant.
Effective masses. Additional calculations were performed toestimate the effective masses of carriers near the band gap (aparabolic dispersion relationship was assumed). Since spinpolarized calculations were carried out for model structures, theeffective masses for three spin-up and spin down bands, closestto the extremum, were determined and the obtained results (ingood agreement with previously reported for undoped and
This journal is © The Royal Society of Chemistry 2017
heavier Nb-doped SrTiO3 (ref. 40 and 41)), together with theiraverage values are presented in Table S1 in ESI.† It follows fromthese results that for niobium doped SrTiO3 the effective massesfor both holes and electrons increase, which indicates thatniobium addition should decrease electric conductivity ofdoped material. However, while for holes this increase issignicant and higher for bigger amount of admixture, forelectrons the picture is slightly more complicated, since whileeffective masses of electrons in conduction bands close to Fermilevel increase for Nb-doped structures, the growth is not sosignicant and one can observe also slight decrease of m*
e forhigher doped structure (this is in very good agreement withexperimental results presented in next paragraph for conduc-tivity measurements carried out in synthetic air atmosphere –
Fig. 7).
Electrical properties
Oxidizing conditions. The electrical properties ofSrTi1�xNbxO3 samples were examined in the oxidizing(synthetic air mixture) and reducing (10% H2/90% Ar) atmo-spheres. The defects structure in the studied system is essentialto determine the mechanism of conductivity. These consider-ations should begin with the case of undoped samplessynthesized in air atmosphere, therefore the conductivitymeasurements were carried out rst in such atmosphere. Due tonaturally occurring vacancies (V 00
Sr, V 0000Ti and V cc
O ) in undopedSrTiO3 obtained during synthesis in air atmosphere, thismaterial is known as acceptor-doped system. The hole carriersat lower temperatures (below 550 K according to42) are createdas a consequence of ionization of strontium vacancies:
V�Sr ¼ V 0
Sr þ hc and next V 0Sr ¼ V 00
Sr þ hc (1)
and, at higher temperatures, through oxygen incorporation intoSrTiO3 structure according to the following equation:
1
2O2ðgÞ þ V cc
O ¼ O�O þ 2hc (2)
RSC Adv., 2017, 7, 28898–28908 | 28903
RSC Advances Paper
Ope
n A
cces
s A
rtic
le. P
ublis
hed
on 0
1 Ju
ne 2
017.
Dow
nloa
ded
on 1
0/27
/202
1 8:
31:0
7 PM
. T
his
artic
le is
lice
nsed
und
er a
Cre
ativ
e C
omm
ons
Attr
ibut
ion-
Non
Com
mer
cial
3.0
Unp
orte
d L
icen
ce.
View Article Online
Further increase of temperature leads to an equilibrium shito the le and to change of conductionmechanism as a result ofionic conductivity appearance.
The substitution of niobium in titanium site results inincorporation of additional electrons:
Nb2O5 ������!SrTiO32Nbc
Ti þ 2e0 þ 5O�O (3)
which can: occupy empty states in conduction band (thus beingdelocalized and able to recombine with holes in the system); betrapped at titanium sites, which results in Ti4+ reduction to Ti3+
ions, trapped at oxygen vacancies (which can be described byfollowing equations: (a) V cc
O ¼ V cO þ e and (b) V c
O ¼ V�cO þ e);
create small polarons localized at titanium site. The latter effect(with additional, possible introduction of oxygen to the struc-ture) are most probable under oxidizing atmosphere.
Simultaneously with niobium, a larger amount of oxygen (incomparison with undoped SrTiO3 structure) is introduced to thestructure. As a consequence the strontium and/or titaniumvacancies can be created. According to43 the formation energyfor titanium vacancies is higher than for strontium ones, so thelatter are more energetically favorable and the process occur-ring in air atmosphere can be described by the followingequation:
x
2Nb2O5 þ Sr�Sr þ ð1� xÞTi�Ti þ ð3� 2xÞO�
O/
xNbcTi þ ð1� xÞTi�Ti þ SrSr þ x
2V 00
Sr þ�3þ x
2
�OO (4)
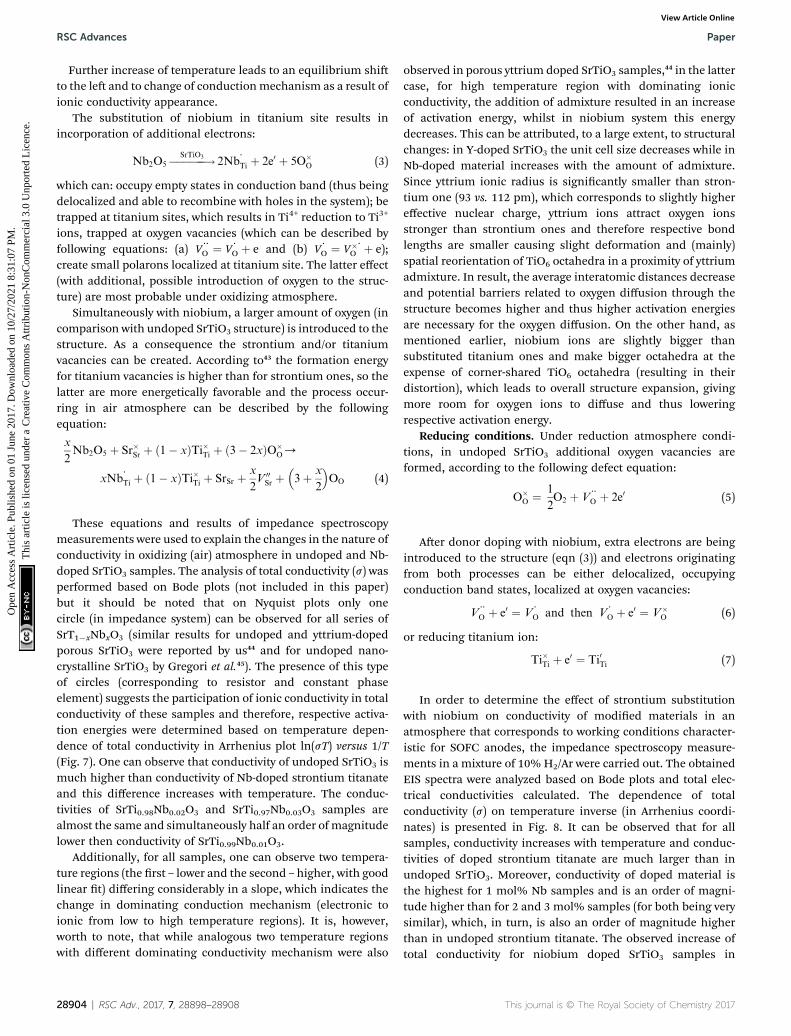
These equations and results of impedance spectroscopymeasurements were used to explain the changes in the nature ofconductivity in oxidizing (air) atmosphere in undoped and Nb-doped SrTiO3 samples. The analysis of total conductivity (s) wasperformed based on Bode plots (not included in this paper)but it should be noted that on Nyquist plots only onecircle (in impedance system) can be observed for all series ofSrT1�xNbxO3 (similar results for undoped and yttrium-dopedporous SrTiO3 were reported by us44 and for undoped nano-crystalline SrTiO3 by Gregori et al.45). The presence of this typeof circles (corresponding to resistor and constant phaseelement) suggests the participation of ionic conductivity in totalconductivity of these samples and therefore, respective activa-tion energies were determined based on temperature depen-dence of total conductivity in Arrhenius plot ln(sT) versus 1/T(Fig. 7). One can observe that conductivity of undoped SrTiO3 ismuch higher than conductivity of Nb-doped strontium titanateand this difference increases with temperature. The conduc-tivities of SrTi0.98Nb0.02O3 and SrTi0.97Nb0.03O3 samples arealmost the same and simultaneously half an order of magnitudelower then conductivity of SrTi0.99Nb0.01O3.
Additionally, for all samples, one can observe two tempera-ture regions (the rst – lower and the second – higher, with goodlinear t) differing considerably in a slope, which indicates thechange in dominating conduction mechanism (electronic toionic from low to high temperature regions). It is, however,worth to note, that while analogous two temperature regionswith different dominating conductivity mechanism were also
28904 | RSC Adv., 2017, 7, 28898–28908
observed in porous yttrium doped SrTiO3 samples,44 in the lattercase, for high temperature region with dominating ionicconductivity, the addition of admixture resulted in an increaseof activation energy, whilst in niobium system this energydecreases. This can be attributed, to a large extent, to structuralchanges: in Y-doped SrTiO3 the unit cell size decreases while inNb-doped material increases with the amount of admixture.Since yttrium ionic radius is signicantly smaller than stron-tium one (93 vs. 112 pm), which corresponds to slightly highereffective nuclear charge, yttrium ions attract oxygen ionsstronger than strontium ones and therefore respective bondlengths are smaller causing slight deformation and (mainly)spatial reorientation of TiO6 octahedra in a proximity of yttriumadmixture. In result, the average interatomic distances decreaseand potential barriers related to oxygen diffusion through thestructure becomes higher and thus higher activation energiesare necessary for the oxygen diffusion. On the other hand, asmentioned earlier, niobium ions are slightly bigger thansubstituted titanium ones and make bigger octahedra at theexpense of corner-shared TiO6 octahedra (resulting in theirdistortion), which leads to overall structure expansion, givingmore room for oxygen ions to diffuse and thus loweringrespective activation energy.
Reducing conditions. Under reduction atmosphere condi-tions, in undoped SrTiO3 additional oxygen vacancies areformed, according to the following defect equation:
O�O ¼ 1
2O2 þ V cc
O þ 2e0 (5)
Aer donor doping with niobium, extra electrons are beingintroduced to the structure (eqn (3)) and electrons originatingfrom both processes can be either delocalized, occupyingconduction band states, localized at oxygen vacancies:
V ccO þ e0 ¼ V c
O and then V cO þ e0 ¼ V�
O (6)
or reducing titanium ion:
Ti�Ti þ e0 ¼ Ti0Ti (7)
In order to determine the effect of strontium substitutionwith niobium on conductivity of modied materials in anatmosphere that corresponds to working conditions character-istic for SOFC anodes, the impedance spectroscopy measure-ments in a mixture of 10% H2/Ar were carried out. The obtainedEIS spectra were analyzed based on Bode plots and total elec-trical conductivities calculated. The dependence of totalconductivity (s) on temperature inverse (in Arrhenius coordi-nates) is presented in Fig. 8. It can be observed that for allsamples, conductivity increases with temperature and conduc-tivities of doped strontium titanate are much larger than inundoped SrTiO3. Moreover, conductivity of doped material isthe highest for 1 mol% Nb samples and is an order of magni-tude higher than for 2 and 3 mol% samples (for both being verysimilar), which, in turn, is also an order of magnitude higherthan in undoped strontium titanate. The observed increase oftotal conductivity for niobium doped SrTiO3 samples in
This journal is © The Royal Society of Chemistry 2017

Fig. 8 Temperature dependence of the total conductivity of samplesmeasured in 10% H2/Ar atmosphere.
Paper RSC Advances
Ope
n A
cces
s A
rtic
le. P
ublis
hed
on 0
1 Ju
ne 2
017.
Dow
nloa
ded
on 1
0/27
/202
1 8:
31:0
7 PM
. T
his
artic
le is
lice
nsed
und
er a
Cre
ativ
e C
omm
ons
Attr
ibut
ion-
Non
Com
mer
cial
3.0
Unp
orte
d L
icen
ce.
View Article Online
reducing atmosphere in comparison with respective values forundoped compound can be attributed to extra electrons comingfrom niobium, acting as donor dopant (eqn (2)). The drop ofconductivity for 2 and 3 mol% samples with respect to 1 mol%sample can be attributed to electron concentration decreasedue to the partial localization of electrons coming from oxygenvacancies formation process on niobium cation, which lead toreduction of Nb5+ to Nb3+. This can be conrmed by change ofsamples color from almost white (light cream) before to blue(blue-grey) aer reduction process.
It is well known that the conductivity of perovskite materialsdepends strongly (even a few orders of magnitude) on porosityand the amount of grain boundaries (and thus on grain sizes)9,46
and therefore our results showing values of total conductivitiesmeasured of porous nanocrystalline Nb doped SrTiO3 samplessmaller than respective ones obtained for dense microcrystal-line samples, are as expected.
Taken together, the observed character of conductivitychanges (an increase with temperature), impedance spectraproperties (no semicircles in tested frequency range) andtheoretical calculations conrm predominant electronic char-acter of conductivity in Nb-doped SrTiO3 for low oxygen partialpressure, so based on ln(s) vs. 1/T dependence (Fig. 8) respectiveconductivity activation energies were determined and are pre-sented in Table 3.
The results indicate that unlike in synthetic air atmosphere,when reducing atmosphere is used, niobium introduction toSrTiO3 structure leads to a drop of conductivity activation
Table 3 The calculated activation energy determined for measurement
Atmosphere/temperature range
Ea [eV]
SrTiO3 Sr
Air synt. Low temp. 0.27 � 0.05 0.1High temp. 1.03 � 0.02 0.9
10% H2/Ar all range 0.79 � 0.01 0.6
This journal is © The Royal Society of Chemistry 2017
energy, which is smallest for SrTi0.99Nb0.01O3 samples andincreases back with the increasing amount of niobium added,becoming for SrTi0.97Nb0.03O3 almost identical as for undopedsamples.
Chemical stability. The results of the studies on chemicalstability of strontium titanate reported in papers referred inintroduction gave hope that presented system exhibits highresistance to carbon dioxide and water vapor. To verify thishypothesis with respect to SrTi1�xNbxO3 system, undoped andNb-doped SrTiO3 samples were annealed in CO2/H2O atmo-sphere for four weeks. Next, the fragments of pellets were sub-jected to thermal analysis with simultaneous analysis ofgaseous products by means of mass spectrometry. The ther-mogravimetry (TG) curves for all samples without exposition onCO2/H2O (Fig. 9a) show only traces of mass loss resultingmainlyfrom desorption of a small amount of surface-adsorbed CO2.The ionic currents corresponding to CO2 and H2O (m/z¼ 44 andm/z ¼ 18 respectively) hardly changed during the wholemeasurements for both undoped and doped SrTiO3. Similareffect was observed on both TG and mass spectra in the case ofundoped strontium titanate subjected to aging, indicating thatthe CO2/H2O atmosphere practically did not affect the chemicalstability of this material. A completely different behavior wasobserved on TG/MS curves for Nb-doped samples aer aging(Fig. 9b). One can observe two separate regions – the rst onerelated to a release of major amount of H2O and traces of CO2
(up to around 700 K) and the second one (above 700 K) relatedonly to carbon dioxide evolving (in signicantly larger quanti-ties). What is more, low temperature region is not only related toadsorbed water release, but also to some other chemicallybonded water (much higher ionic currents corresponding toH2O were measured for samples aer aging in comparison tosamples not subjected to aging procedure). On the other hand,in the case of carbon dioxide the values of ionic current arealmost at background level in this range of temperature.Formation of strontium hydroxide hydrate during annealingtests is in our opinion the only possible explanation for theeffect observed on TG and ionic currents curves. Unfortunately,due to the fact that strontium hydroxide can be present inseveral different hydrated forms,47 we cannot determine theamount of moles of Sr(OH)2 produced. Eventually, however, asa result of thermal analysis measurements this compounddecomposes to water and strontium oxide. Furthermore it isclearly visible that mass loss below 700 K increases with theamount of Nb admixture in SrTi1�xNbxO3 samples. The secondrange of sample decomposition (above 700 K) is associated withCO2 releasing as the only gaseous product (as conrmed mass
s in synthetic air and 10% H2/Ar atmosphere
Ti0.99Nb0.01O3 SrTi0.98Nb0.02O3 SrTi0.97Nb0.03O3
2 � 0.03 0.10 � 0.02 0.11 � 0.024 � 0.11 0.96 � 0.12 0.95 � 0.096 � 0.01 0.71 � 0.02 0.78 � 0.01
RSC Adv., 2017, 7, 28898–28908 | 28905
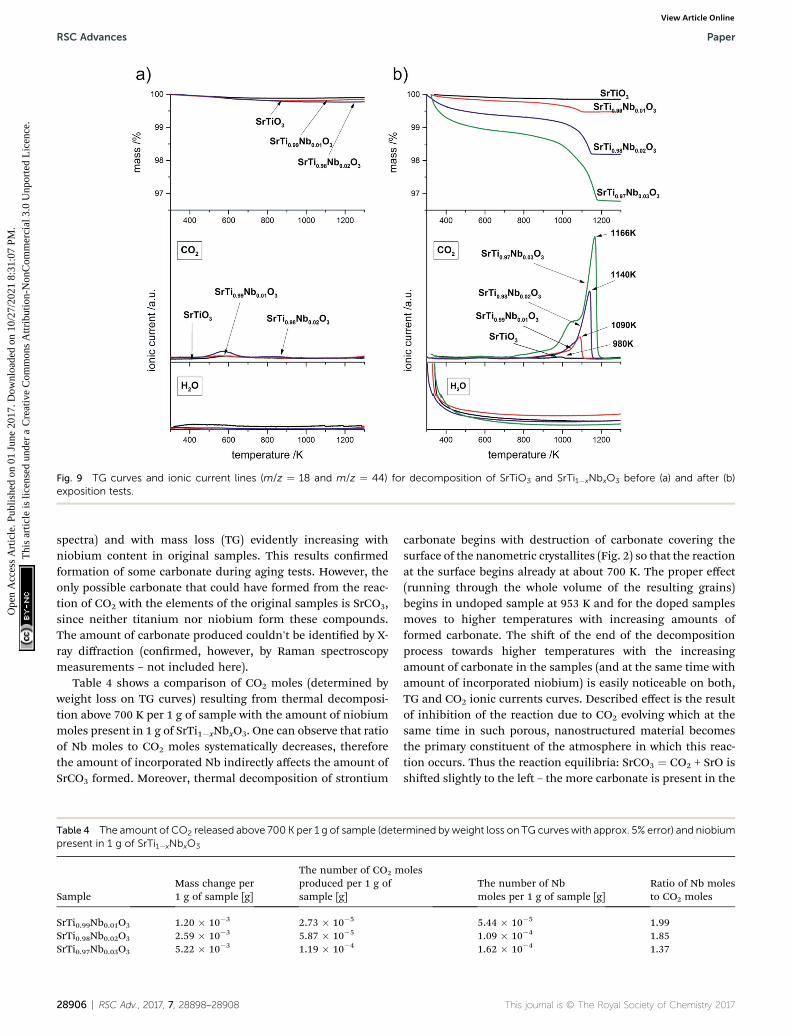
Fig. 9 TG curves and ionic current lines (m/z ¼ 18 and m/z ¼ 44) for decomposition of SrTiO3 and SrTi1�xNbxO3 before (a) and after (b)exposition tests.
RSC Advances Paper
Ope
n A
cces
s A
rtic
le. P
ublis
hed
on 0
1 Ju
ne 2
017.
Dow
nloa
ded
on 1
0/27
/202
1 8:
31:0
7 PM
. T
his
artic
le is
lice
nsed
und
er a
Cre
ativ
e C
omm
ons
Attr
ibut
ion-
Non
Com
mer
cial
3.0
Unp
orte
d L
icen
ce.
View Article Online
spectra) and with mass loss (TG) evidently increasing withniobium content in original samples. This results conrmedformation of some carbonate during aging tests. However, theonly possible carbonate that could have formed from the reac-tion of CO2 with the elements of the original samples is SrCO3,since neither titanium nor niobium form these compounds.The amount of carbonate produced couldn't be identied by X-ray diffraction (conrmed, however, by Raman spectroscopymeasurements – not included here).
Table 4 shows a comparison of CO2 moles (determined byweight loss on TG curves) resulting from thermal decomposi-tion above 700 K per 1 g of sample with the amount of niobiummoles present in 1 g of SrTi1�xNbxO3. One can observe that ratioof Nb moles to CO2 moles systematically decreases, thereforethe amount of incorporated Nb indirectly affects the amount ofSrCO3 formed. Moreover, thermal decomposition of strontium
Table 4 The amount of CO2 released above 700 K per 1 g of sample (detepresent in 1 g of SrTi1�xNbxO3
SampleMass change per1 g of sample [g]
The number of CO2 mproduced per 1 g ofsample [g]
SrTi0.99Nb0.01O3 1.20 � 10�3 2.73 � 10�5
SrTi0.98Nb0.02O3 2.59 � 10�3 5.87 � 10�5
SrTi0.97Nb0.03O3 5.22 � 10�3 1.19 � 10�4
28906 | RSC Adv., 2017, 7, 28898–28908
carbonate begins with destruction of carbonate covering thesurface of the nanometric crystallites (Fig. 2) so that the reactionat the surface begins already at about 700 K. The proper effect(running through the whole volume of the resulting grains)begins in undoped sample at 953 K and for the doped samplesmoves to higher temperatures with increasing amounts offormed carbonate. The shi of the end of the decompositionprocess towards higher temperatures with the increasingamount of carbonate in the samples (and at the same time withamount of incorporated niobium) is easily noticeable on both,TG and CO2 ionic currents curves. Described effect is the resultof inhibition of the reaction due to CO2 evolving which at thesame time in such porous, nanostructured material becomesthe primary constituent of the atmosphere in which this reac-tion occurs. Thus the reaction equilibria: SrCO3 ¼ CO2 + SrO isshied slightly to the le – the more carbonate is present in the
rmined by weight loss on TG curves with approx. 5% error) and niobium
olesThe number of Nbmoles per 1 g of sample [g]
Ratio of Nb molesto CO2 moles
5.44 � 10�5 1.991.09 � 10�4 1.851.62 � 10�4 1.37
This journal is © The Royal Society of Chemistry 2017

Paper RSC Advances
Ope
n A
cces
s A
rtic
le. P
ublis
hed
on 0
1 Ju
ne 2
017.
Dow
nloa
ded
on 1
0/27
/202
1 8:
31:0
7 PM
. T
his
artic
le is
lice
nsed
und
er a
Cre
ativ
e C
omm
ons
Attr
ibut
ion-
Non
Com
mer
cial
3.0
Unp
orte
d L
icen
ce.
View Article Online
material, the higher partial pressure of CO2. For better visuali-zation of this shi on Fig. 9b, the temperature of maxima onCO2 ionic current are appropriately labeled. The most impor-tant conclusion that can be drawn from thermal analysis ofsamples before and post-aging treatment is that niobiumintroduction to SrTiO3 structure causes decrease of chemicalstability of resulting compound.
The experimental results of chemical stability are in oppo-sition to predictions based on earlier cited works.15,16 Therefore,average metal oxygen bond energy (ABE) were estimatedaccording to the following equation:17
ABE ¼ XA
12m
�DHAmOn
�mDHA � n
2�DO2
�
þ XB
6m
�DHBmOn
�mDHB � n
2�DO2
�
where XA, XB, DHAmOnand DHBmOn
are the molar fraction of A-sitecation, B-site cation, the heats of formation of AmOn and BmOn at298 K, respectively. DO2
is the oxygen dissociation energy, DHA
andDHB are the heats of sublimation of metals A and B at 298 K,respectively. Based on the experimental values of respectiveenthalpies,48 the obtained ABE values for SrTi1�xNbxO3 (x ¼ 0,0.01, 0.02, 0.03) are equal to (in J mol�1) �392.00, �392.08,�392.17, �392.25, respectively. These values could suggest thatniobium substitution for titanium in SrTiO3 structure shouldresult in higher bond strength and therefore increased chemicalstability, but in fact, the differences between estimated ABEvalues are denitely too small to draw such conclusion (espe-cially that this model doesn't take into account local structuraldeformation which oen can result in much higher energychanges). Moreover, this model doesn't take into account alsousual formation of additional oxygen vacancies, necessary foroverall lattice charge neutralization. Both these factors are – inour opinion – a source of decreased chemical stability of Nb-doped SrTiO3 samples: when oxygen vacancy is introduced tothe structure, effective coordination number of respectivestrontium polyhedra decreases by one and effectively, forslightly increased lengths of Sr–O bonds, their average strengthalso decreases and so does chemical stability.
Conclusions
Wet synthesis – sol–gel method allowed to obtained porous,nanocrystalline, single phase SrTi1�xNbxO3 (x ¼ 0.0, 0.01, 0.02,0.03) materials with all nominal amount of niobium incorpo-rated to structure. The introduction of niobium admixtureresults in an increase of unit cell volume and simultaneouslydecrease of average crystallite size (with increasing amount ofniobium). The observed changes in structural parameters are invery good agreement with theoretical calculations. QTAiMtopological analysis of electron density show that all bonds havesignicant ionic character, Ti–O and Nb–O bonds are muchstronger than Sr–O and small unit cell size expansion withincreasing amount of niobium results mostly from deformationof titanium octahedra in niobium proximity in order to relax thestructure with longer Nb–O bonds, while TiO6 octahedra lyingfurther from niobium sites remain practically intact.
This journal is © The Royal Society of Chemistry 2017
The results of aging tests carried out in CO2/H2O atmospherefor several weeks showed a worsening of chemical stability withincreasing amount of niobium dopant. This can be a result ofeffective Sr–O bonds weakening in the structure due to titaniumoctahedral deformation in niobium cations proximity andoxygen vacancies introduction in order to neutralize additionalnegative charge due to Nb donor doping. To our knowledge, nosuch tests for this type of the system were carried out earlier.
The electronic structure calculations show that niobiumintroduction into titanium sublattice has donor character andresults in a shi of Fermi level to conduction band (n-typeconductor) and small change in band gap size, increasingwith niobium amount. The calculated effective electron massesincrease with dopant amount, which suggests a lowering of theelectric conductivity (in agreement with experimental resultsobtained for air atmosphere). In reducing atmosphere the totalconductivity increases with the amount of admixture, which isa result of additional carriers introduced with oxygen vacancies.To absolute values of the total conductivity measured inreducing atmosphere are signicantly lower than reported forother Nb-doped SrTiO3 materials, but this is simply due tocompletely different microstructure of those materials (highlydense, microcrystalline materials).
Acknowledgements
This work was nancially supported by the National ScienceCenter of the Republic of Poland, Grant No. 2014/14/E/ST5/00763. FP-LAPW calculations were supported in part byPL-GRID infrastructure.
References
1 S. Suthirakun, G. Xiao, S. C. Ammal, F. Chen, H.-C. Loye andA. Heyden, J. Power Sources, 2014, 245, 1.
2 J. B. Goodenough and Y.-H. Huang, J. Power Sources, 2007,173, 1.
3 A. Kulkarni, F. T. Ciacchi, S. Giddey, C. Munnings,S. P. S. Badwal, J. A. Kimpton and D. Fini, Int. J. HydrogenEnergy, 2012, 37, 19092.
4 N. Wang, H. Chen, H. He, W. Norimatsu, M. Kusunoki andK. Kumoto, Sci. Rep., 2013, 3, 3449.
5 A. V. Kovalevsky, M. H. Aguirre, S. Populoh, S. G. Patricio,N. M. Ferreira, S. M. Mikhalev, D. P. Fagg, A. Weidenkaand J. R. Fradea, J. Mater. Chem. A, 2017, 5, 3909.
6 P. Blennow, A. Hagen, K. K. Hansen, L. R. Wallenberg andM. Mogensen, Solid State Ionics, 2008, 179, 2047.
7 B. Bochentyn, J. Karczewski, T. Miruszewski, A. Krupa,M. Gazda, P. Jasinski and B. Kusz, Solid State Ionics, 2012,225, 118.
8 T. Kolodiazhnyi and A. Petric, J. Electroceram., 2005, 15, 5.9 J. C. C. Abrantes, J. A. Labrincha and J. R. Frade, Sens.Actuators, B, 1999, 56, 198.
10 J. Karczewski, B. Riegel, M. Gazda, P. Jasinski and B. Kusz, J.Electroceram., 2010, 24, 326.
11 G. Sukhdeep, R. Kannan, N. Maffei and V. Thangadurai, RSCAdv., 2013, 3, 3599.
RSC Adv., 2017, 7, 28898–28908 | 28907
RSC Advances Paper
Ope
n A
cces
s A
rtic
le. P
ublis
hed
on 0
1 Ju
ne 2
017.
Dow
nloa
ded
on 1
0/27
/202
1 8:
31:0
7 PM
. T
his
artic
le is
lice
nsed
und
er a
Cre
ativ
e C
omm
ons
Attr
ibut
ion-
Non
Com
mer
cial
3.0
Unp
orte
d L
icen
ce.
View Article Online
12 P. Pasierb, E. Drozdz-Ciesla, R. Gajerski, S. Łabus,S. Komornicki and M. Rekas, J. Therm. Anal. Calorim.,2009, 96, 475.
13 A. Lacz, Ionics, 2016, 22, 1405.14 E. Drozdz, Ł. Łancucki and A. Łacz, J. Therm. Anal. Calorim.,
2016, 125, 1225.15 F. Wang, T. Nakamura, K. Yashiro, J. Mizusaki and
K. Amezawa, Solid State Ionics, 2014, 262, 719.16 L. Gui, Y. Wan, R. Wang, Z. Wang, B. He and L. Zhao, J. Alloys
Compd., 2015, 644, 788.17 R. J. H. Voorhoeve, J. P. Remeika and L. E. Trimble, The
Catalytic Chemistry of Nitrogen Oxides, ed. R. L. Klimishand J. G. Larson, Plenum Publishing Cooperation, NewYork, 1971, p.145.
18 J. D. R. Tilley, Perovskites Structure-Properties Relationships,John Wiley & Sons, United Kingdom, 2015.
19 R. I. Eglitis, Int. J. Mod. Phys. B, 2014, 28, 1430009.20 S. Piskunov, E. Heifets, R. I. Eglitis and G. Borstel, Comput.
Mater. Sci., 2004, 29, 165.21 R. I. Eglitis, S. Piskunov, E. Heifets, E. Kotomin and
G. Borstel, Ceram. Int., 2004, 30, 1989.22 R. I. Eglitis and E. Kotomin, Phys. B, 2010, 405, 3164.23 A. Hamid, Appl. Phys. A: Mater. Sci. Process., 2009, 97, 829.24 C. Zhang, C. L. Wang, J. C. Li, K. Yang, Y. F. Zhang and
Q. Z. Wu, Mater. Chem. Phys., 2008, 107, 215.25 R. K. Astala and P. D. Bristowe, Modell. Simul. Mater. Sci.
Eng., 2004, 12, 79.26 M. Djermouni, A. Zaoui, S. Kacimi and B. Bouhafs, Comput.
Mater. Sci., 2010, 49, 904.27 K. Ozdogan, M. Upadhyay Kahaly, S. R. Sarath Kumar,
H. N. Alshareef and U. Schwingenschlogl, J. Appl. Phys.,2012, 111, 054313.
28 J. Shujuan, Y. Jinliang, S. Guipeng and Z. Yinnu, J. Semicond.,2016, 37, 072001.
29 P. Delugas, A. Filippetti, M. J. Verstraete, I. Pallecchi, D. Marrand V. Fiorentini, Phys. Rev. B: Condens. Matter Mater. Phys.,2013, 88, 1.
30 B. R. Sudireddy, P. Blennow and K. Nielsen, Solid StateIonics, 2012, 216, 44.
31 P. Blennow, K. K. Hansen, L. R. Wallenberg andM. Mogensen, J. Eur. Ceram. Soc., 2007, 27, 3609.
28908 | RSC Adv., 2017, 7, 28898–28908
32 P. Blaha, K. Schwarz, G. Madsen, D. Kvasnicka, and J. Luitz,WIEN2k, An Augmented Plane Wave + Local Orbitals Programfor Calculating Crystal Properties, ed. K. Schwarz, Techn.Universitat Wien, Wien, Austria, 2001.
33 J. P. Perdew, A. Ruzsinszky, G. I. Csonka, O. A. Vydrov,G. E. Scuseria, L. A. Constantin, X. Zhou and K. Burke,Phys. Rev. Lett., 2008, 100, 136406.
34 R. F. W. Bader, Atoms in Molecules: A Quantum Theory,Clarendon Press, Oxford, 1990.
35 A. Otero-de-la-Roza, E. R. Johnson and V. Luana, Comput.Phys. Commun., 2014, 185, 1007.
36 N. Wang, M. Cao, Z. He, Ch. Diao, Q. Zhang, Y. Zhang, J. Dai,F. Zeng, H. Hao, Z. Yao and H. Liu, Ceram. Int., 2016, 42,13593.
37 W. H. Baur, Acta Crystallogr., Sect. B: Struct. Sci., 1974, 30,1195.
38 K. Robinson, G. V. Gibbs and P. H. Ribbe, Science, 1971, 172,567.
39 R. Hoppe, Z. Kristallogr., 1979, 150, 23.40 M. Marques, L. K. Teles, V. Anjos, L. M. R. Scolfaro,
J. R. Leite, V. N. Freire, G. A. Farias and E. F. da Silva Jr,Appl. Phys. Lett., 2003, 82, 3074.
41 W. Wunderlich, H. Ohta and K. Koumoto, Phys. B, 2009, 404,2202.
42 R. A. de Souza, Adv. Funct. Mater., 2015, 25, 6326.43 A. A. Crawford and P. Jacobs, J. Solid State Chem., 1999, 144,
423.44 E. Drozdz, A. Łacz, A. Kolezynski, A. Mikuła and K. Mars,
Solid State Ionics, 2017, 302, 173.45 G. Gregori, S. Heinze, P. Lupetin, H.-U. Habermeier and
J. Maier, J. Mater. Sci., 2013, 48, 2790.46 F. Horikiri, L. Q. Han, A. Kaimai, T. Otake, K. Yashiro,
T. Kawada and J. Mizusaki, Solid State Ionics, 2006, 177,2555.
47 R. Dinescu and M. Preda, J. Therm. Anal., 1971, 5, 465.48 R. A. Robie, B. S. Hemingway and J. R. Fisher,
Thermodynamic Properties of Minerals and RelatedSubstances at 298.15 K and 1 Bar (105 Pascals) Pressure andat Higher Temperatures, U.S. Geological Survey Bulletin,1979, vol. 1452.
This journal is © The Royal Society of Chemistry 2017