the structure and growth pattern of agro-industry of
TRANSCRIPT

UNITED NATIONS INDUSTRIAL DEVELOPMENT ORGANIZATION
The structure and growth pattern of agro-industry of African countries
w o r k i n g p a p e r 0 9 /20 1 2


UNITED NATIONS INDUSTRIAL DEVELOPMENT ORGANIZATIONVienna, 2013
DEVELOPMENT POLICY, STATISTICS AND RESEARCH BRANCHWORKING PAPER 9/2012
The structure and growth pattern of agro-industry of African countries
UNIDO Statistics Unit

Acknowledgements
The Statistics Unit acknowledges the substantial contribution of Ms. Zoi Diamantakou in
preparing this paper, who worked as an intern under the supervision of Shyam Upadhyaya, Unit
Chief. Ms. Dong Guo reviewed the paper and prepared it for publication.
The designations employed, descriptions and classifications of countries, and the presentation of the
material in this report do not imply the expression of any opinion whatsoever on the part of the Secretariat
of the United Nations Industrial Development Organization (UNIDO) concerning the legal status of any
country, territory, city or area or of its authorities, or concerning the delimitation of its frontiers or
boundaries, or its economic system or degree of development. The views expressed in this paper do not
necessarily reflect the views of the Secretariat of the UNIDO. The responsibility for opinions expressed
rests solely with the authors, and publication does not constitute an endorsement by UNIDO. Although
great care has been taken to maintain the accuracy of information herein, neither UNIDO nor its Member
States assume any responsibility for consequences which may arise from the use of the material. Terms
such as “developed”, “industrialized” and “developing” are intended for statistical convenience and do
not necessarily express a judgment. Any indication of, or reference to, a country, institution or other legal
entity does not constitute an endorsement. Information contained herein may be freely quoted or reprinted
but acknowledgement is requested. This report has been produced without formal United Nations editing.
This document reflects work in progress and, as such, has been edited neither in language nor in style. Its
distribution is limited for the purposes of eliciting comments and reviews only.

iii
Table of Contents
1 Introduction ............................................................................................................................. 1
1.1 Purpose of the study ................................................................................................................ 2
1.2 Sources and methods ............................................................................................................... 3
2 Patterns of growth and structure of agro-industrial sector ...................................................... 6
2.1 Agro-industrial production ...................................................................................................... 6
2.2 Structure of agro-industrial sectors in Africa .......................................................................... 8
3 International trade of agro-industrial products ...................................................................... 11
3.1 Export of agro-industrial products ........................................................................................ 12
4 Import of agricultural machinery to Africa ........................................................................... 16
4.1 Patterns of import of agricultural machinery ........................................................................ 16
4.2 Export of products and import of machinery ........................................................................ 23
5 Summary ............................................................................................................................... 26
Annex: List of countries included in export import data analysis ......................................................... 28
References ............................................................................................................................................. 29

iv
List of Figures
Figure 1 Structure of the agro-industrial sector in total manufacturing value added, 2006 .......... 9
Figure 2 Value added of the agro-industrial sector per employee (1995=100) ........................... 10
Figure 3 Share of top exporters of agro-industrial products in Africa in 2008 ........................... 13
Figure 4 Share of agro-industrial exports in total manufacturing: 2000-2008 ............................ 13
Figure 5 Most important importing countries of agricultural machinery in the African region .. 18
Figure 6 Contribution of the African region to world imports of agricultural machinery .......... 20
Figure 7 Growth of agricultural machinery imports: Africa and the world ................................ 23
Figure 8 Index of total exports of agro-industrial products and total imports of agricultural
machinery by theAfrican region ................................................................................... 25
List of Tables
Table 1 Correspondence of ISIC Rev. 3 to SITC Rev. 3: An example ......................................... 5
Table 2 Percentage share of agriculture in GDP of selected African countries ............................ 6
Table 3 Share of agro-industrial sectors in total manufacturing value added in selected country
groups (2007) .................................................................................................................. 7
Table 4 Average value added per employee by sector in US$, 2007 ............................................ 9
Table 5 Leading importers of African agro-industrial products in 2000 and 2008 ..................... 15
Table 6 Total imports of agro-industrial machinery by selected African countries (in million
US$) .............................................................................................................................. 17
Table 7 Structure of agro-industrial machinery imports for selected countries in 2008 (%) ...... 19
Table 8 Import flows of agricultural machinery for the years 2000, 2008 .................................. 21
Table 9 Leading exporters of agricultural machinery to the African region, 2008 ..................... 21
Table 10 Leading global exporters of agricultural machinery, 2008 .......................................... 22
Table 11 Imports of agricultural machinery by selected African countries: 2000-2007 (million
US$) ............................................................................................................................ 23
Table 12 Output of agro-industrial products for selected African countries: 2000-2007 (million
US$) .............................................................................................................................. 24
Table 13 Agricultural products exports: 2000 to 2007 for selected countries (million US$) ..... 25

1
1 Introduction
The agro-industrial sector comprises economic activities relating to manufacturing sectors
primarily engaged in the processing of raw materials and of intermediate agricultural, fisheries
and forestry products. The statistical indicators of the agro-industrial sectors measure the
relative importance of these sectors for manufacturing and the country’s overall economy. The
production relationship between agriculture and industry is a key element for economic growth
in Africa. Agriculture contributes up to 60 percent of GDP in some African countries.
Development economists have emphasized the importance of production and consumption
linkages between the agricultural and manufacturing sector since the onset of decolonization.
Agriculture generates forward linkages with agricultural outputs being supplied as inputs into
manufacturing. Fast growth in agriculture contributes to a rapid rise in agro-processing, which
in turn provides new engines of growth as well as an opportunity to substitute imports.
Agriculture also creates backward production linkages through its demand for intermediate
inputs as well as capital goods such as agricultural machinery and equipment, which are crucial
for raising productivity in the agricultural sector. Agro-industrial sectors comprise a number of
manufacturing activities that have direct production linkages between agriculture and
manufacturing.
The delineation of agro-industrial sectors is based on the supply-based conceptual framework
underlying the International Standard Industrial Classification of All Economic Activities
(ISIC). ISIC revision 3 is used to aggregate manufacturing activity into agro-industrial sectors.
The compilation of statistics for this category requires the underlying data to be available at the
3-digit level of ISIC at least. The main intention in this regard is measuring the relative
contribution of agro-industrial sectors to the value of the principle indicators of manufacturing
such as production, employment and trade. Most of the agro-industrial sectors, albeit not all, are
also resource-based. Therefore, agro-industrial sectors are characterized by low levels of
technological innovation. As industrialization advances towards diversification and technology-
intensive activities, the share of agro-industrial sectors tends to decrease.
In most developing countries, manufacturing is relatively dependent on agricultural supplies.
Agro-industrial sectors account for around 15 percent of manufacturing value added in
industrialized countries, yet their share in developing countries is much higher. The processing
of agricultural supplies dominates the entire manufacturing sector in least developed countries
(LDCs). Agro-industrial sectors accounted for 2/3 of the manufacturing output of LDCs in
2009. These activities also play an important role in absorbing surplus labour from rural areas
and gradually transferring them to the manufacturing workforce. Rural industrialization

2
considerably accelerated manufacturing growth in South Africa and East Asian countries. This
paper presents an overview of the agro-industrial sectors in selected African countries, explores
these sectors’ main production features and tracks the external trade flow routes of agro-
industrial products and agricultural machinery. The paper includes an analysis of (i) the role of
the agro-industrial sector in selected regions; (ii) exports of agro-industrial products, and (iii)
agricultural machinery imports.
1.1 Purpose of the study
Industrial development has the potential not only to modernize sectors of the economy other
than agriculture, construction and services, but also contributes to achieving a variety of social
objectives such as employment, gender equality, maintaining labour standards and facilitating
greater access to education and healthcare. The more developed a country’s industrial capacity,
the greater the potential for economic growth and human development. UNIDO as a specialized
agency of the United Nations in industrial development aims to promote and accelerate
sustainable industrial development worldwide, especially in developing countries. Its main
activities include poverty reduction efforts, inclusive globalization and environmental
sustainability. Statistics makes a significant contribution to the formulation of industrial
development strategies for today’s diverse world. Such strategies must be based on sound
empirical evidence provided by reliable, accurate and internationally comparable statistics.
The economic literature provides clear indications that agro-industries have a significant global
impact on industrial development and poverty reduction in both urban and rural communities.
Agro-industry generates employment and income opportunities by providing work placements
in both farming and off farming activities (FAO & UNIDO, 2008). The agro-industrial sector
has gained a dominant position in manufacturing in a considerable number of countries and in
promoting rapid economic expansion with beneficial effects on agricultural and rural
development. In view of the global importance of the agro-industrial sector, special emphasis is
given to the African region where, according to the African Development Bank, the agro-
industrial sector is the single largest contributor to income and employment generation and
plays a key role in dealing with the region’s challenge to achieve self-sufficiency in food
production, create supply chains, improve agricultural productivity and enhance the
competitiveness of processed export products, reduce rural poverty and foster economic
advancement based on sound environmental management practices. Moreover, the significance
of agro-industrial exports from Africa to the international market should be highlighted
considering that globally processed products account for 80 percent of food and beverage sales
with 60 percent being consumed in high income counties (Wilkinson, 2008).

3
Agricultural mechanization is a component of agro-industrial development. It is the application
of mechanical technology and increased power in agriculture, largely as a means to enhance
productivity and often to achieve results well beyond the capacity of human labour
(FAO/UNIDO 2008). The import of agricultural machinery plays a vital role in international
trade and contributes to agricultural mechanization. Tractors, combines and smaller equipment
such as seed rills are often shipped over considerable distances. Moreover, trade in used
machinery also has an impact: machinery that is nearing the end of its economic life in one
country may still be very profitable in another. The importing country should, however,
consider the condition of the agricultural machinery it imports as well as adequate after-sales
support.
Agro-industrial development is closely linked to agricultural mechanization. Many studies
substantiate the strong correlations between economic growth and the mechanization of
agriculture; countries that have achieved economic growth and resolved their food problems
have also advanced to higher levels of agricultural mechanization, while countries with
stagnating economies and extreme poverty have lagged behind in agro-industrial mechanization
(Yumkella et al., 2011). Moreover, it is a widely held view that international trade (i.e.
agricultural machinery imports) leads to faster technological diffusion and higher rates of
productivity (Helpman, 1997). While this is of significance for all countries, it has dramatic
implications for less developed countries as they seek to catch up with the technological leaders
in OECD (Keller, 1999). Furthermore, according to Coe and Helpman (1997), foreign trade
could be considered a carrier of knowledge in terms of the importance of imports in introducing
foreign trade technology into domestic production and spurring total productivity.
1.2 Sources and methods
In this paper, the agro-industrial sector refers to a subset of the ISIC division pertaining to
manufacturing activities involving the processing of raw materials and of intermediate
agricultural, forestry and fishery products. The subset of the ISIC division underlines the inter-
activity linkages where agriculture serves as a supplier of input and industry as the producer of
consumer goods. Suppliers’ activities include growing crops, raising animals, harvesting timber
and other plants and animals on farms or from their natural habitats. In line with UNIDO
practice, the category agro-industrial sector covers the following eight manufacturing industries:

4
Manufacture of food and beverages
Manufacture of tobacco products
Manufacture of textiles
Manufacture of wearing apparel
Tanning and dressing of leather
Manufacture of wood and wood products
Manufacture of paper and paper products
Manufacture of rubber products.
The paper also analyses imports of agricultural machinery by African countries which comprise
the following SITC categories of machinery specific to particular industries:
i. Cultivating machinery (i.e. agricultural, horticultural or forestry machinery for soil
preparation or cultivation; lawn or sports ground rollers; parts thereof)
ii. Harvesting machines, i.e. harvesting or threshing machinery including straw or fodder
balers; grass or hay mowers; machines for cleaning, sorting or grading seed or grain or
for grading eggs, fruit or other agricultural produce
iii. Dairy machinery and parts thereof, i.e. milking machines and dairy machinery, and
parts thereof
iv. Agricultural, horticultural, forestry, poultry-keeping or bee-keeping machinery n.e.s.
and parts thereof
v. Track-laying and wheeled tractors.
The main data source for this study is the UNIDO Industrial Statistics Database at the 2-digit
level of ISIC revision 3 (INDSTAT2, 2011), which includes long time series by country and by
principle indicators. A subset of countries was created with the statistics on principle indicators
including employment, value added and output. Data were also drawn from the United Nations
Commodity Trade Database and the UNIDO Industrial Demand Supply Database (IDSB).
These sources provide detailed and disaggregated data for exports and imports. UNIDO’s IDSB
database combines the international trade data acquired from UN Comtrade with production
data from the INDSTAT databases. The IDSB database contains data from Comtrade by SITC
Rev. 3 and is converted into the corresponding ISIC Rev 3. Export and import data are
aggregated with production data into two major country groups according to UNIDO’s
5
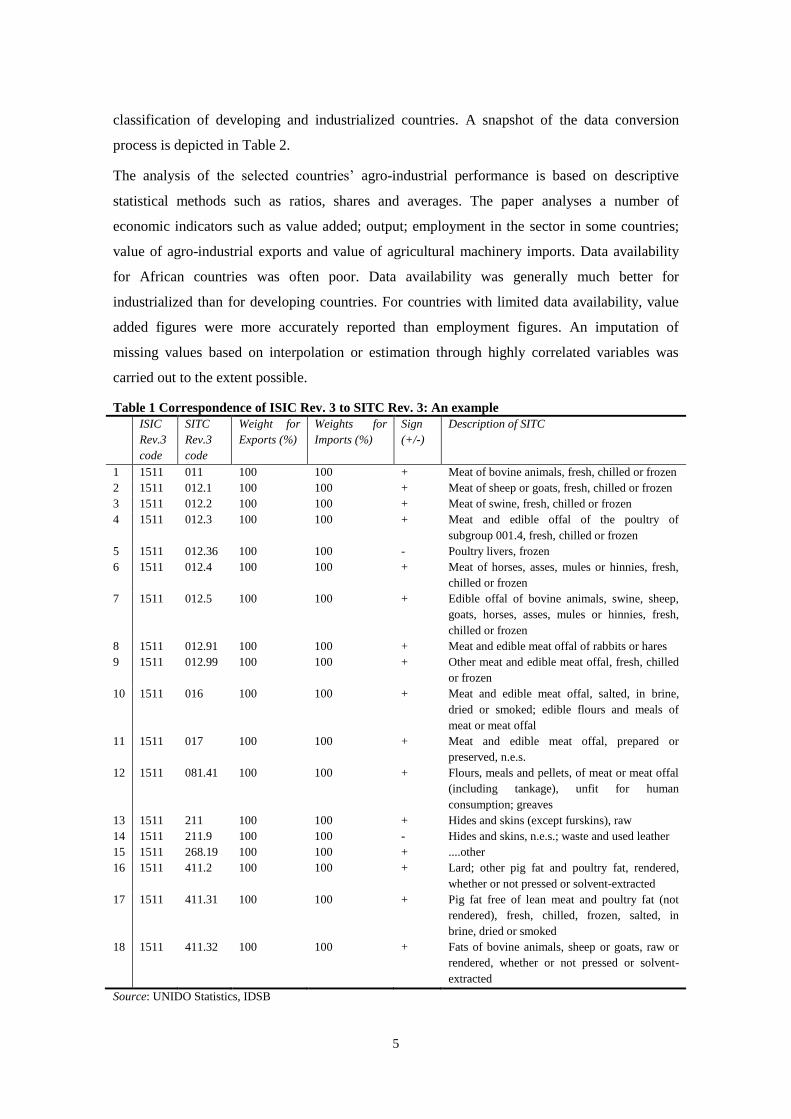
classification of developing and industrialized countries. A snapshot of the data conversion
process is depicted in Table 2.
The analysis of the selected countries’ agro-industrial performance is based on descriptive
statistical methods such as ratios, shares and averages. The paper analyses a number of
economic indicators such as value added; output; employment in the sector in some countries;
value of agro-industrial exports and value of agricultural machinery imports. Data availability
for African countries was often poor. Data availability was generally much better for
industrialized than for developing countries. For countries with limited data availability, value
added figures were more accurately reported than employment figures. An imputation of
missing values based on interpolation or estimation through highly correlated variables was
carried out to the extent possible.
Table 1 Correspondence of ISIC Rev. 3 to SITC Rev. 3: An example
ISIC
Rev.3
code
SITC
Rev.3
code
Weight for
Exports (%)
Weights for
Imports (%)
Sign
(+/-)
Description of SITC
1 1511 011 100 100 + Meat of bovine animals, fresh, chilled or frozen
2 1511 012.1 100 100 + Meat of sheep or goats, fresh, chilled or frozen
3 1511 012.2 100 100 + Meat of swine, fresh, chilled or frozen
4 1511 012.3 100 100 + Meat and edible offal of the poultry of
subgroup 001.4, fresh, chilled or frozen
5 1511 012.36 100 100 - Poultry livers, frozen
6 1511 012.4 100 100 + Meat of horses, asses, mules or hinnies, fresh,
chilled or frozen
7 1511 012.5 100 100 + Edible offal of bovine animals, swine, sheep,
goats, horses, asses, mules or hinnies, fresh,
chilled or frozen
8 1511 012.91 100 100 + Meat and edible meat offal of rabbits or hares
9 1511 012.99 100 100 + Other meat and edible meat offal, fresh, chilled
or frozen
10 1511 016 100 100 + Meat and edible meat offal, salted, in brine,
dried or smoked; edible flours and meals of
meat or meat offal
11 1511 017 100 100 + Meat and edible meat offal, prepared or
preserved, n.e.s.
12 1511 081.41 100 100 + Flours, meals and pellets, of meat or meat offal
(including tankage), unfit for human
consumption; greaves
13 1511 211 100 100 + Hides and skins (except furskins), raw
14 1511 211.9 100 100 - Hides and skins, n.e.s.; waste and used leather
15 1511 268.19 100 100 + ....other
16 1511 411.2 100 100 + Lard; other pig fat and poultry fat, rendered,
whether or not pressed or solvent-extracted
17 1511 411.31 100 100 + Pig fat free of lean meat and poultry fat (not
rendered), fresh, chilled, frozen, salted, in
brine, dried or smoked
18 1511 411.32 100 100 + Fats of bovine animals, sheep or goats, raw or
rendered, whether or not pressed or solvent-
extracted
Source: UNIDO Statistics, IDSB
6
2 Patterns of growth and structure of agro-industrial sector
Agro-industrial sectors in today’s world carry a different meaning than they did in the
traditional perception where a gradual shift took place from agriculture to industry in the course
of economic development. Modern technology, available resources for agricultural production
and access to the global market have increasingly facilitated the vertical integration of
agriculture with industry. In industrialized countries, where agro-industrial sectors emerged as a
result of the industrialization of agriculture, the distinction between these two sectors is
disappearing. In industrialized countries, the impact of R&D and innovations in production
machinery is also visible in agricultural activities, while consumer demand has changed with
regard to health and nutrition. However, the scenario is quite different in developing countries,
especially in Africa where the agro-industrial sector is still in the early stages of mechanization
in which intermediate inputs are transformed into manufactured products.
2.1 Agro-industrial production
The share of agro-industrial sectors in total manufacturing for any major variables, such as
employment, production, exports and imports, indicate the extent of the agro-industrial sector’s
dependence on or departure from traditional sectors. Due to the fact that the majority of agro-
industrial sectors are resource-based, they are generally characterized by low levels of
technological innovation. As industrialization advances towards diversified and technology
intensive activities, the share of the agro-industrial sector in an economy decreases. This is also
evident in the significant change of distribution of value added in the manufacturing sectors of
many countries. Recent decades have seen industries shift from low technology, labour and
natural resource intensive industries to high and medium technology industries. Consequently,
the share of resource based sectors in total production has gradually declined. However,
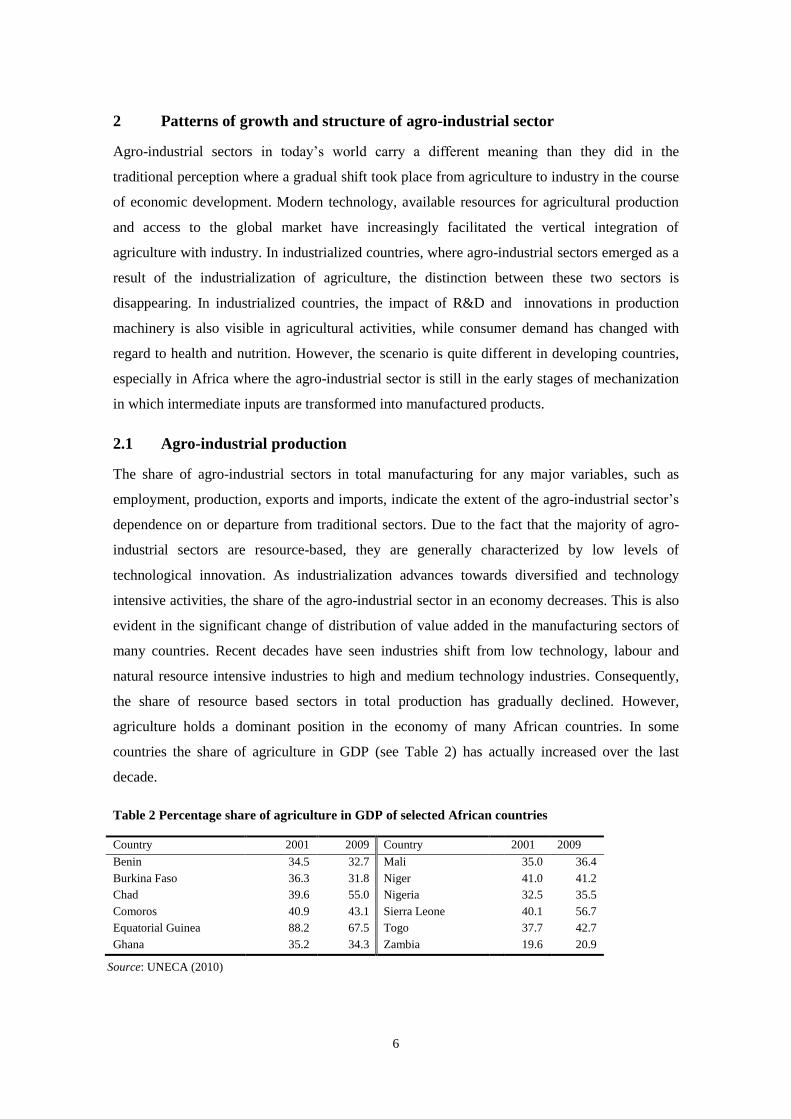
agriculture holds a dominant position in the economy of many African countries. In some
countries the share of agriculture in GDP (see Table 2) has actually increased over the last
decade.
Table 2 Percentage share of agriculture in GDP of selected African countries
Country 2001 2009 Country 2001 2009
Benin 34.5 32.7 Mali 35.0 36.4
Burkina Faso 36.3 31.8 Niger 41.0 41.2
Chad 39.6 55.0 Nigeria 32.5 35.5
Comoros 40.9 43.1 Sierra Leone 40.1 56.7
Equatorial Guinea 88.2 67.5 Togo 37.7 42.7
Ghana 35.2 34.3 Zambia 19.6 20.9
Source: UNECA (2010)
7
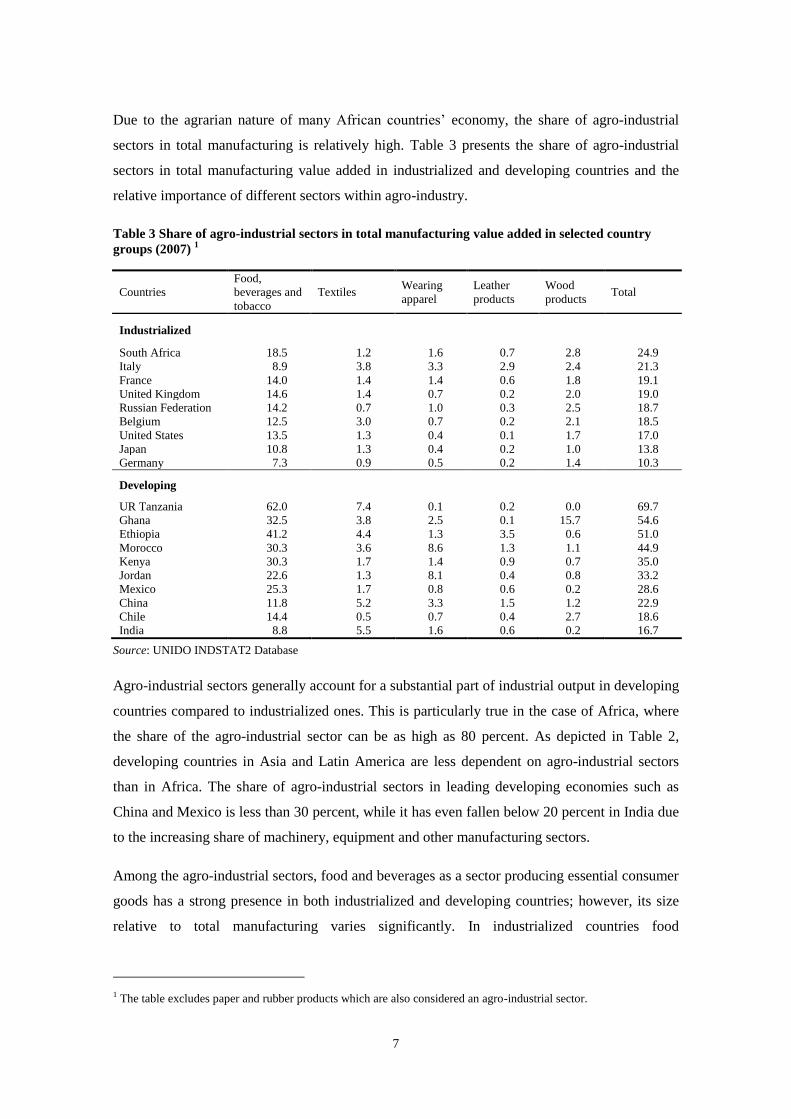
Due to the agrarian nature of many African countries’ economy, the share of agro-industrial
sectors in total manufacturing is relatively high. Table 3 presents the share of agro-industrial
sectors in total manufacturing value added in industrialized and developing countries and the
relative importance of different sectors within agro-industry.
Table 3 Share of agro-industrial sectors in total manufacturing value added in selected country
groups (2007) 1
Countries
Food,
beverages and
tobacco
Textiles Wearing
apparel
Leather
products
Wood
products Total
Industrialized
South Africa 18.5 1.2 1.6 0.7 2.8 24.9
Italy 8.9 3.8 3.3 2.9 2.4 21.3
France 14.0 1.4 1.4 0.6 1.8 19.1
United Kingdom 14.6 1.4 0.7 0.2 2.0 19.0
Russian Federation 14.2 0.7 1.0 0.3 2.5 18.7
Belgium 12.5 3.0 0.7 0.2 2.1 18.5
United States 13.5 1.3 0.4 0.1 1.7 17.0
Japan 10.8 1.3 0.4 0.2 1.0 13.8
Germany 7.3 0.9 0.5 0.2 1.4 10.3
Developing
UR Tanzania 62.0 7.4 0.1 0.2 0.0 69.7
Ghana 32.5 3.8 2.5 0.1 15.7 54.6
Ethiopia 41.2 4.4 1.3 3.5 0.6 51.0
Morocco 30.3 3.6 8.6 1.3 1.1 44.9
Kenya 30.3 1.7 1.4 0.9 0.7 35.0
Jordan 22.6 1.3 8.1 0.4 0.8 33.2
Mexico 25.3 1.7 0.8 0.6 0.2 28.6
China 11.8 5.2 3.3 1.5 1.2 22.9
Chile 14.4 0.5 0.7 0.4 2.7 18.6
India 8.8 5.5 1.6 0.6 0.2 16.7
Source: UNIDO INDSTAT2 Database
Agro-industrial sectors generally account for a substantial part of industrial output in developing
countries compared to industrialized ones. This is particularly true in the case of Africa, where
the share of the agro-industrial sector can be as high as 80 percent. As depicted in Table 2,
developing countries in Asia and Latin America are less dependent on agro-industrial sectors
than in Africa. The share of agro-industrial sectors in leading developing economies such as
China and Mexico is less than 30 percent, while it has even fallen below 20 percent in India due
to the increasing share of machinery, equipment and other manufacturing sectors.
Among the agro-industrial sectors, food and beverages as a sector producing essential consumer
goods has a strong presence in both industrialized and developing countries; however, its size
relative to total manufacturing varies significantly. In industrialized countries food
1 The table excludes paper and rubber products which are also considered an agro-industrial sector.
8
manufacturing contributes well below 20 percent of the total value added of the manufacturing
industry, however, its share is more than half in some African developing countries. In
Tanzania, food manufacturing represents more than 60 percent of the total value added of
manufacturing. Similarly, the share of food manufacturing is quite high in Ghana, Ethiopia,
Morocco and Kenya. Food manufacturing has a much smaller share in the developing countries
of Asia and Latin America.
2.2 Structure of agro-industrial sectors in Africa
Despite the significant difference in structure of the agro-industrial sectors by country, one
apparent feature common to all African countries is the dominance of food manufacturing in
agro-industry. The agro-industrial sectors in the African region are further analysed using six
countries as an example, namely Egypt, Ethiopia, Madagascar, Morocco, Kenya and South
Africa. The share of food and beverages ranges from 15 to 40 percent of total value added. The
share of food manufacture is more than 40 percent in Ethiopia. In Kenya, the dominant role of
the food and beverages industry is evident, while the other industries have a share of less than 5
percent. The agro-industrial sector in Ethiopia is characterized by the strong presence of the
food and beverages industry which accounts for more than 40 percent of the value added of total
manufacture. The shares of the other agro-industries comprise less than 10 percent of the value
added of total manufacture.
Countries with a higher level of industrial diversification are less dependent on food
manufacturing which accounts for less than 20per cent in relatively industrialized African
economies such as Morocco, South Africa and Egypt, which substantiates earlier arguments that
the share of food manufacturing and other low technology sectors falls as industry becomes
more diversified to include other modern high-tech sectors.

9
Figure 1 Structure of the agro-industrial sector in total manufacturing value added, 2006
Source: UNIDO INDSTAT2, 2011, at current prices (in US$)
To take a look at productivity in African countries’ agro-industrial sectors, Table 4 presents the
average value added per employee for selected African countries. The table compares the
average value added per employee in agro-industrial sectors with the rest of the manufacturing
sectors and the value for overall manufacturing.
Table 4 Average value added per employee by sector in US$, 2007
Source: UNIDO, INDSTAT2 Database, current prices (in US$)
0.0% 10.0% 20.0% 30.0% 40.0% 50.0%
Ethiopia
Madagascar
Kenya
Morocco
South Africa
Egypt
Food and beverages
Tobacco products
Textiles
Wearing apparel, fur
Leather, leather products and footwear
Country Agro-industrial sectors Other sectors of
manufacturing Overall manufacturing
Ethiopia 4794 5554 5514
Kenya 1395 4266 4264
Madagascar 103 696 646
Morocco 9407 19476 19146
South Africa 14849 24118 22395
Egypt 2739 6190 6065

10
Generally, value added per employee is considered a concrete measure of the relation of output
to labour input, indicating the average amount of value added produced by an employee.
However, it should be noted that a high level of value added per employee reflects a high level
of capital and technology utilization within an industry. The figures presented in Table 3 vary
widely between the six selected countries. South Africa has the highest level of productivity in
all sectors. Similar to earlier observations in Table 2, economies with a relatively high degree of
diversification such as Egypt, Morocco and South Africa has gained higher level of labour
productivity in all sectors.
Another important observation one could draw is the low level of labour productivity in agro-
industrial sectors compared to other sectors. The value added per employee in agro-industrial
sectors in Kenya is three times lower than in other sectors, for example, and seven times lower
in Madagascar. The relatively advanced north and south of Africa have achieved higher levels
of labour productivity across the sectors, which significantly reduced their relative difference to
other manufacturing sectors.
The difference in labour productivity and growth across African countries is evident. Although
there was insufficient data to carry out longer time series analyses of labour productivity, the
growth pattern was clearly more robust in Morocco and South Africa than in Ethiopia and other
sub-Saharan economies, which could not be adequately depicted due to lack of data. Despite
some decline in 2001-02, the value added per employee in South Africa doubled in 2007
compared to the 1995 level. Morocco’s value added per employee grew by a factor of 1.5 during
the same period compared to 1.2 in Ethiopia. Figure 2 presents the index of labour productivity
in three selected countries.
Figure 2 Value added of the agro-industrial sector per employee (1995=100)
Source: UNIDO Statistics, INDSTAT2, 2011 (in US$)
75.0
100.0
125.0
150.0
175.0
200.0
19
95
20
00
20
05
20
07
Ethiopia
Morocco
South Africa
11
The number of employees has significantly decreased in South Africa in recent years, especially
in the textile and garment industry, however, the value of production has increased resulting in
higher labour productivity. A similar tendency has also been observed in Morocco. However,
the growth of labour productivity in Ethiopia’s agro-industrial sectors was not significant.
Some conclusions can be drawn from the statistics presented above. First, agro-industrial sectors
play a dominant role in the industrialization of Africa; however, the manufacturing activities of
large parts of the continent are limited to the processing of some primary products. The
countries of northern and southern Africa have already made some important achievements in
diversification and productivity. However, for other sub-Saharan African countries, dependence
on limited agro-industrial sectors remains a major challenge for achieving a more efficient and
productive manufacturing industry. One of the key elements of change could be the
mechanization of agriculture through the introduction of new technology. African countries
have to rely on other countries for agricultural machinery. The following chapter provides some
insights on these issues.
3 International trade of agro-industrial products
African countries have a tremendous potential for expand the merchandise export of agro-
industrial products, for which there is growing demand in the international market. Exporting
agro-industrial products carries two major benefits: first, such exports can be instrumental in the
acquisition of modern technology in return for the mechanization of agriculture; second,
sustained growth of agro-industrial exports can help African countries reduce poverty.
However, the manufacturing industry in African countries has primarily targeted the domestic
market and the regional market to some extent only. Africa’s export in global trade remains
rather limited. According to UNIDO’s most recent estimates, Africa accounts for less than 1
percent of global exports. One of the reasons frequently cited is that many African countries
cannot meet the market’s demands and requirements, neither in terms of quantity due to the lack
of technology and know-how nor in terms of quality due to supply-side constraints and non-
tariff barriers for trade. Agricultural goods and other primary products are Africa’s main export
products, however, food insecurity and falling prices of agro-industrial goods have hampered
the sustained growth of agricultural goods and other primary product exports. This chapter
presents exports statistics of agro-industrial products as well as import statistics of agricultural
machinery in African countries.

12
3.1 Export of agro-industrial products
As mentioned earlier, agro-industrial sectors account for a significant share of the
manufacturing output of African countries. Subsequently, these sectors also play a dominant
role in manufactured exports. The analysis of their export performance is based on data for 41
African countries, excluding those listed in Annex 1 and South Africa. Of these, Morocco,
Tunisia, Côte d'Ivoire, Mauritius, Madagascar, Nigeria, Kenya, Namibia, Burkina Faso and
Egypt are major exporters of agro-industrial products2. These countries accounted for 77.9
percent of total exports of agro-industrial products from the region in 2008. Morocco and
Tunisia, which have benefited from proximity to the European market, have quite a large share
of 46 percent of total exports from the region. By contrast, the remaining 12 countries have a
total share of about 32 percent of agro-industrial exports, with each country’s share being less
than 10 percent.
While the relatively advanced countries of northern and southern Africa mostly dominate
Africa’s exports, their position has changed in recent years. The share of exports from Egypt,
Mauritius, Morocco and Zimbabwe has decreased, while that of a number of sub-Saharan
African countries such as Côte d'Ivoire, Kenya, Nigeria and Burkina Faso has increased. Figure
3 ranks the countries by their share of agro-industrial exports, with Morocco and Tunisia
representing the largest share.
Many industrialized countries have witnessed the decline of agro-industrial sectors in their
domestic production. However, consumption of high quality agro-industrial goods is rising. This
creates an opportunity for developing countries to boost their production and stimulate export
growth to meet the increasing demand for agro-industrial commodities in industrialized
countries. North African countries have seized this opportunity in a similar way as their Asian
partners. However, large parts of Africa have not been able to benefit from these trends. So far,
the export of agro-industrial products from sub-Saharan Africa has been concentrated in a few
low price commodities rather than in high value added products.
In sub-Saharan Africa, agro-industrial sectors account for a substantial share of manufactured
exports. Countries which have an industry for processing mineral resources may be an
exception. Owing to the production and export of petroleum products, the share of agro-
industrial products in manufactured exports is smaller in countries like Ghana, Nigeria and
Sudan. Although some countries have managed to increase the share of other industrial products
2 South Africa is excluded from this analysis.

13
in their total exports, such as Namibia and Uganda, agro-industrial products account for most of
the manufactured exports in other sub-Saharan countries. For example, the share of agro-
industrial products exceeds 80 percent in Madagascar, 75 percent in Malawi and 60 percent in
Gambia.
Figure 3 Share of top exporters of agro-industrial products in Africa in 2008
Source: UN Comtrade
In relative terms, agro-industrial exports will drop with the further diversification of the
economy as other sectors increase their share in the country’s total exports. Consequently, a
diminishing trend of the share of agro-industrial exports is inevitable in Africa. This is also
evident in However, the absolute value of agro-industrial products can grow considering that
Africa has the potential to enhance the export of agro-industrial commodities in order to meet
the global market’s growing demand. However, countries must enhance not only their
production capacity but also their trade capacity. Recent trends suggest that Africa’s share in the
market of industrialized countries is decreasing.
Figure 4, which indicates a decreasing share of agro-industrial products in the manufactured
exports of the majority of African countries since 2000.
However, the absolute value of agro-industrial products can grow considering that Africa has
the potential to enhance the export of agro-industrial commodities in order to meet the global
0% 10% 20% 30%
Zimbabwe
Uganda
Botswana
Ghana
Egypt
Burkina Faso
Namibia
Kenya
Nigeria
Madagascar
Mauritius
Côte d'Ivoire
Tunisia
Morocco
In percent to total exports of countries in observation
2008
2000

14
market’s growing demand. However, countries must enhance not only their production capacity
but also their trade capacity. Recent trends suggest that Africa’s share in the market of
industrialized countries is decreasing.
Figure 4Share of agro-industrial exports in total manufacturing: 2000-2008
Data source: UN Comtrade, author’s calculations (US$)
3.2 Export destinations
Traditionally, Europe, together with Japan and the United States, has been the major export
destination of African agro-industrial products. However, their share in Africa’s total exports
has decreased in recent years. Africa’s total exports are dominated by primary products and
mineral resources, which are increasingly being exported to the rapidly industrializing
economies of Asia and Latin America. As the processing industries shift their production sites
from North America and Europe to Asia, the export destinations and trading partners for
primary products have changed. Agro-industrial products have not belonged to the major
commodities African countries export to Asia, because Asian countries themselves are
competing for a higher share of exports to industrialized countries’ markets. Industrialized
countries are major importers of African agro-industrial products. Table 5 shows that the ten
0.0 25.0 50.0 75.0 100.0
Sudan
Ghana
Nigeria
Botswana
Zimbabwe
Namibia
Niger
Côte d'Ivoire
Kenya
Uganda
Cameroon
Gambia
Malawi
Madagascar
2008
2000

15
leading importers accounted for 80 percent of total exports of African agro-industrial products.
Among the ten leading importers are seven countries from European Union. However, their
share as well as that of other countries is decreasing in total. The share of agro-industrial exports
from Africa to France and the United Kingdom, which have maintained strong trade relations
with Africa since colonial time, has decreased.
Table 5 Leading importers of African agro-industrial products in 2000 and 2008
Data source: UN Comtrade, author’s calculations
African countries are facing a dilemma: on the one hand, they need to maintain their market
share in industrialized countries to benefit from the growing demand for agro-industrial
products; on the other, they must also diversify the market to reduce dependence on limited
export destinations. An expansion of exports within the region does not seem feasible due to
high intra-African tariffs as well as non-tariff barriers, weak transport links and other obstacles
of cross-border trade. In any case, it is more beneficial in terms of economic growth for African
countries to export agro-industrial goods rather than primary commodities. There is statistical
evidence that the export surge of primary commodities to Asia has had adverse effects on
industrialization and there is a clear indication of deindustrialization in a number of sub-Saharan
African countries.
The export of high-value manufactured products instead of primary goods would also contribute
to the countries’ capacity to import technology. They could mobilize revenue from the export of
agro-industrial products for investment in agricultural machinery. The next chapter presents
some statistics on the import of agricultural machinery by African countries.
Importing country 2000 2008
1 France 22.5 18.5
2 Italy 11.7 13.1
3 United Kingdom 10.1 6.8
4 United States 8.6 5.5
5 Spain 7.7 11.2
6 Germany 6.7 4.6
7 South Africa 4.5 2.8
8 Netherlands 3.2 3.4
9 Belgium 3.1 2.3
10 Japan 2.5 1.0
Sum of above 80.6 69.3

16
4 Import of agricultural machinery to Africa
As the domestic production of agricultural machinery is extremely limited in most African
countries, their import is considered an indicator of a country’s readiness to invest in the
mechanization of agricultural production. Agricultural mechanization introduces technology and
increased power in agriculture to enhance labour productivity and to achieve results that may
often be well beyond the capacity of human labour. This includes the use of tractors as well as
animal and human-powered implements and tools. Mechanization also includes irrigation
systems, food processing and related technologies and equipment. The data analysis in this
paper includes cultivating machinery, harvesting machines, dairy machinery and parts,
agricultural, horticultural, forestry, poultry-keeping or bee-keeping machinery and track-laying
and wheeled tractors.
Agricultural activities in Africa are largely dominated by subsistence farming which yields just
enough produce to feed the families and workers involved. A shift to more productive
commercial farming would require mechanization. The number of tractors per hundred square
kilometres of arable land, which is a widely recognized indicator of agricultural mechanization,
is only 13 for Africa compared to 129 for South Asia, which is the least developed region in
Asia. The world average is 200. Sub-Saharan Africa also lags behind other developing regions
of Asia and Latin America with regard to other indicators. Some progress has, however, been
made in recent years. There is a clear understanding that the continent’s potential for
commercial farming must be tapped to raise the level of living of millions of rural population.
There is also some evidence that Africa is investing a significant amount for imported
agriculture machinery.
4.1 Patterns of import of agricultural machinery
Despite the year-to-year variation, the import of agricultural machinery to Africa has grown
consistently in recent years and reached US$ 3.7 billion in 2008. Recent estimates show that the
total import of agricultural machinery has increased by more than 2.5 times compared to 2000.
When looking at individual countries, the situation varies. As Table 6 shows, all of the countries
selected for analysis reveal significantly increased imports of agricultural machinery with the
exception of Gabon, Gambia and Swaziland. Table 6 further indicates that agro-industrial
imports to countries such as Kenya, Morocco, Sudan and Egypt significantly increased in 2006.
This is more clearly depicted in Figure 5.
17
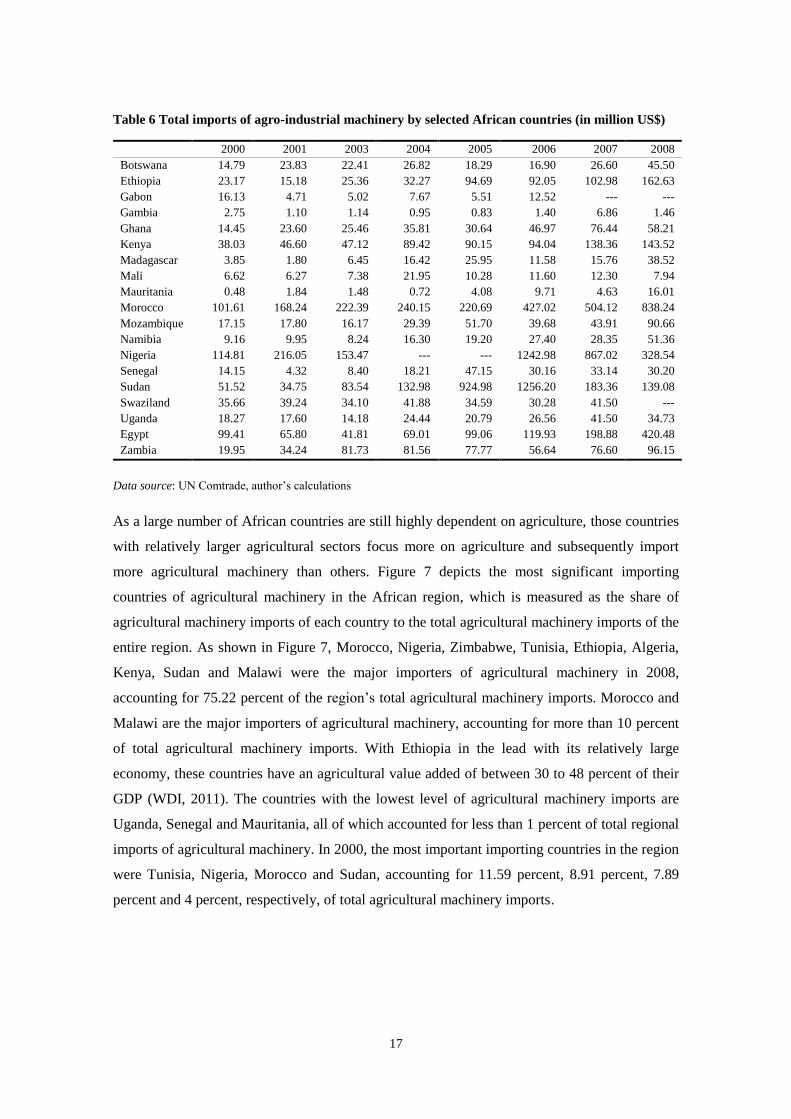
Table 6 Total imports of agro-industrial machinery by selected African countries (in million US$)
2000 2001 2003 2004 2005 2006 2007 2008
Botswana 14.79 23.83 22.41 26.82 18.29 16.90 26.60 45.50
Ethiopia 23.17 15.18 25.36 32.27 94.69 92.05 102.98 162.63
Gabon 16.13 4.71 5.02 7.67 5.51 12.52 --- ---
Gambia 2.75 1.10 1.14 0.95 0.83 1.40 6.86 1.46
Ghana 14.45 23.60 25.46 35.81 30.64 46.97 76.44 58.21
Kenya 38.03 46.60 47.12 89.42 90.15 94.04 138.36 143.52
Madagascar 3.85 1.80 6.45 16.42 25.95 11.58 15.76 38.52
Mali 6.62 6.27 7.38 21.95 10.28 11.60 12.30 7.94
Mauritania 0.48 1.84 1.48 0.72 4.08 9.71 4.63 16.01
Morocco 101.61 168.24 222.39 240.15 220.69 427.02 504.12 838.24
Mozambique 17.15 17.80 16.17 29.39 51.70 39.68 43.91 90.66
Namibia 9.16 9.95 8.24 16.30 19.20 27.40 28.35 51.36
Nigeria 114.81 216.05 153.47 --- --- 1242.98 867.02 328.54
Senegal 14.15 4.32 8.40 18.21 47.15 30.16 33.14 30.20
Sudan 51.52 34.75 83.54 132.98 924.98 1256.20 183.36 139.08
Swaziland 35.66 39.24 34.10 41.88 34.59 30.28 41.50 ---
Uganda 18.27 17.60 14.18 24.44 20.79 26.56 41.50 34.73
Egypt 99.41 65.80 41.81 69.01 99.06 119.93 198.88 420.48
Zambia 19.95 34.24 81.73 81.56 77.77 56.64 76.60 96.15
Data source: UN Comtrade, author’s calculations
As a large number of African countries are still highly dependent on agriculture, those countries
with relatively larger agricultural sectors focus more on agriculture and subsequently import
more agricultural machinery than others. Figure 7 depicts the most significant importing
countries of agricultural machinery in the African region, which is measured as the share of
agricultural machinery imports of each country to the total agricultural machinery imports of the
entire region. As shown in Figure 7, Morocco, Nigeria, Zimbabwe, Tunisia, Ethiopia, Algeria,
Kenya, Sudan and Malawi were the major importers of agricultural machinery in 2008,
accounting for 75.22 percent of the region’s total agricultural machinery imports. Morocco and
Malawi are the major importers of agricultural machinery, accounting for more than 10 percent
of total agricultural machinery imports. With Ethiopia in the lead with its relatively large
economy, these countries have an agricultural value added of between 30 to 48 percent of their
GDP (WDI, 2011). The countries with the lowest level of agricultural machinery imports are
Uganda, Senegal and Mauritania, all of which accounted for less than 1 percent of total regional
imports of agricultural machinery. In 2000, the most important importing countries in the region
were Tunisia, Nigeria, Morocco and Sudan, accounting for 11.59 percent, 8.91 percent, 7.89
percent and 4 percent, respectively, of total agricultural machinery imports.

18
Figure 5 Most important importing countries of agricultural machinery in the African region
Data source: UN Comtrade, author’s calculations
Agricultural mechanization is a means to improve the productivity of agriculture. It includes the
use of different tractor types such as wheeled tractors, cultivation machinery and harvesting
machinery. The structure of agricultural machinery imports varies between countries due to
each country’s distinct agricultural situation. Table 7 depicts the structure of agricultural
machinery imports of selected African countries. In 2008, wheeled tractors represented the
largest group of total agricultural machinery imports in each of the selected African countries
except for Mali. For some countries such as Mozambique, Sudan, Kenya, Morocco, Mauritania
and Botswana, the percentage of imports of wheeled tractors is higher than 50 percent of their
total agricultural machinery imports. The case of Mali should not be neglected, as it is the only
of these selected countries in which cultivation machinery has the highest percentage followed
by the wheeled tractors category. Harvesting machinery is the second most imported machinery
group at over 20 percent in most countries, except for Namibia, Mozambique and Gambia,
where cultivation machinery represents the second largest import commodity accounting for
26.97 percent, 16.12 percent and 30.59 percent, respectively, of total agricultural machinery
0.0 2.5 5.0 7.5 10.0
Morocco
Nigeria
Algeria
Sudan
Ethiopia
Kenya
Zambia
Zimbabwe
Mozambique
Senegal
Ghana
Madagascar
Uganda
Namibia
Botswana
Gabon
Gambia
2000
2008

19
imports. The least imported agricultural machinery category for all selected countries is track-
laying tractors with the imports not exceeding 7 percent in all countries except Ethiopia, where
track-laying tractors represent the second largest import commodity at 20.40 percent.
Table 7 Structure of agro-industrial machinery imports for selected countries in 2008 (%)
Cultivation
machinery
Harvesting
machinery,
etc.
Dairy
machinery,
parts, etc.
Agric. hort.
etc.
machn.nes
Track-laying
tractors
Wheeled
tractors nes
Mozambique 16.12 7.51 0.35 8.80 1.91 65.31
Sudan 5.65 18.17 2.97 8.89 0.00 64.33
Kenya 15.23 10.03 3.84 7.47 1.06 62.37
Morocco 6.64 17.95 8.01 7.80 0.00 59.59
Mauritania 0.62 23.16 1.03 0.32 20.13 54.74
Botswana 12.25 11.64 4.98 14.96 2.14 54.04
Madagascar 3.80 2.80 31.26 2.39 10.04 49.72
Uganda 9.47 19.97 14.18 7.58 0.00 48.80
Egypt 3.02 21.90 9.05 18.45 0.01 47.57
Zambia 15.64 19.01 4.54 13.16 2.76 44.89
Namibia 26.97 15.84 4.13 9.67 0.70 42.69
Gambia 30.59 18.81 2.86 7.27 0.00 40.48
Senegal 14.68 18.77 2.74 18.61 4.74 40.46
Ghana 8.20 7.64 0.19 10.21 1.29 39.68
Nigeria 10.14 18.17 11.43 14.65 6.16 39.45
Ethiopia 14.36 24.05 1.36 10.08 20.40 29.74
Mali 34.04 17.36 13.41 10.99 0.00 24.20
Source: UN Comtrade, author’s calculations
Even though the amount of agricultural machinery imported by African countries is relatively
large compared to the size of their economy, it is expected that this does not account for a
significant share of total global imports of agricultural machinery import. Figure 6 illustrates the
share of African imports of agricultural machinery to that of the world, which is measured as the
proportion of total imports of agricultural machinery in the African region to total world imports
of agricultural machinery. According to the graph, Africa’s share of agricultural machinery
imports to that of the world remained as low as or less than 3 percent. Despite the sharp
decrease during 2002–2004, the share has been rising since 2005, reaching a maximum of
around 3 percent in 2009, which is about US$ 3266 million. This low share also indicates a
reduced need for farm machinery manufactures, which have traditionally been supplied to
Africa, which is attributable to two main reasons: first, the machinery is becoming increasingly
more sophisticated, larger and more expensive, and secondly, the African market is perceived as
declining compared to two decades ago, hence, it is not considered worthy of investing marking
resources (FAO/UNIDO 2008).

20
Figure 6 Contribution of the African region to world imports of agricultural machinery
Data source: UN Comtrade, author’s calculations
To determine which countries export agricultural machinery to African countries, Table 8
presents a list of imports to African countries from 2000 to 2008. The majority of industrialized
countries are agricultural machinery exporters, as are South Africa, Egypt, Nigeria and, most
recently, China. As the table below indicates, Botswana, Mozambique and Namibia’s major
importing partner was South Africa in 2000 and 2008, accounting for between 40 percent and
90 percent of their total imports. In 2000, Gabon, Mali, Mauritania and Senegal had less
diversified imports which were primarily concentrated in a single partner such as USA (34.16
percent), United Kingdom (47.98 percent), Germany (65.69 percent) and France (40.63
percent); by 2008, they diversified their imports to include more trading partners, including
Germany, France, Italy and Egypt, which accounted for 16.85 percent, 31.81 percent, 38.67
percent and 14.58 percent, respectively, of their total imports. Moreover, for Ethiopia, Gabon,
Morocco, Nigeria, Uganda, Egypt and Zambia, whose imports were more diversified, United
Kingdom, Germany, USA, Italy, Spain and France were the top import partners in 2000. China,
India and Egypt were the top import partners for Ethiopia, Gambia, Ghana and Uganda in 2008,
replacing Italy and United Kingdom. It is interesting to note that United Kingdom was no longer
a top import partner for those countries in 2008, but was in 2000.
The fact that South Africa and Egypt were the top import partners for some countries in 2008
signifies that industrial activities in South Africa, Egypt and Nigeria began focusing on
agricultural machinery production. Such industrial activities constitute a potential to develop a
dynamic capital goods sector for agriculture in the medium and long term. They also represent a
potential for industrial expansion in Africa, provided that these industrial activities can be viably
developed to serve the national, sub-regional and regional African market. In view of the long
lead times for imported machinery equipment and spare parts Africa is currently experiencing,
0.00%
0.50%
1.00%
1.50%
2.00%
2.50%
3.00%
2000 2001 2002 2003 2004 2005 2006 2007 2008 2009

21
including the high maintenance costs, the effective utilization and production of agro-processing
machinery is being promoted (Yumkella et al., 2011).
Table 8 Import flows of agricultural machinery for the years 2000, 2008
Importer
2000 2008
Exporter in % of the country's
total imports
Exporter in % of the
country's total
imports
Botswana South Africa 91.64 South Africa 89.55
Ethiopia Italy 23.66 China 19.94
Gabon USA 34.16 Germany 16.85
Gambia United Kingdom 28.63 India 30.20
Ghana Italy 24.67 Italy 54.18
Mali United Kingdom 47.98 France 31.81
Mauritania Germany 65.69 Italy 38.67
Morocco Spain 19.20 South Africa 42.21
Mozambique South Africa 57.91 South Africa 85.56
Namibia South Africa 68.38 China 18.28
Nigeria Germany 25.85 France 19.17
Senegal France 40.63 Egypt 14.58
Uganda United Kingdom 22.47 India 17.84
Egypt Italy 16.18 South Africa 13.01
Zambia United Kingdom 20.23 South Africa 56.90
Source: UN Comtrade, author’s calculations
However, as shown in Table 9, the 10 leading export partners of agricultural machinery to the
African region in 2008 were Italy, Mozambique, China, South Africa, France, India, Brazil,
Turkey, Germany and USA, all of which accounted for 73 percent of Africa’s total agricultural
machinery imports in 2008, while the remaining partners only represented 27 percent. Among
the top ten export partners to Africa were three countries from Europe: Italy, France and
Germany. China and India accounted for 13.31 percent of total imports of agricultural
machinery.
Table 9 The leading exporters of agricultural machinery to the African region, 2008
Country %
Italy 14.36
Mozambique 13.77
China 7.99
South Africa 7.96
France 6.10
India 5.32
Brazil 5.11
Turkey 4.70
Germany 4.16
United States of America 3.55
Total 73.00
Source: UN Comtrade, author’s calculations

22
Table 10 presents the 10 leading export countries of agricultural machinery, which account for
73.92 percent of total global exports of agricultural. Among the 10 leading exporters of
agricultural machinery is Germany in first place with 21.35 percent, followed by USA with
15.23 percent. Among these top 10 leading exporters of agricultural machinery are six European
countries: Germany, Italy, France, United Kingdom, Belgium and Austria, which account for
more than half of total global exports.
Table 10 Leading global exporters of agricultural machinery, 2008
Country %
Germany 21.35
USA 15.23
Italy 9.85
France 6.40
Japan 5.00
United Kingdom 3.97
Netherlands 3.25
China 3.14
Belgium 2.92
Austria 2.79
Total 73.0
Source: UN Comtrade, author’s calculations
Despite the fact that agricultural machinery imports account for a minor share of global
agricultural machinery imports, it is worth comparing the growth rate of such imports between
Africa and the world. This is because the African continent has been the second fastest growing
region after East Asia over the last ten years. While agriculture is the main sector in most
African countries, agricultural machinery imports have definitely had a positive effect on
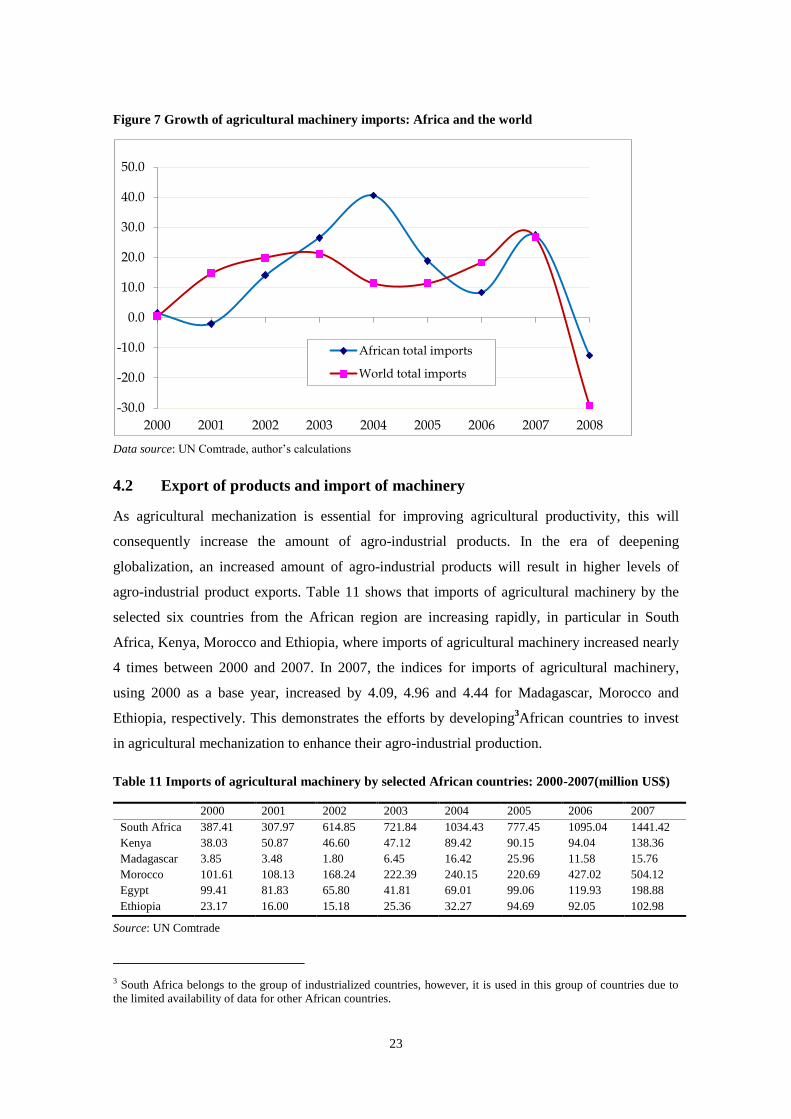
economic growth. Figure 7 illustrates the growth rate of total imports of agricultural machinery
in the world and the African region. The growth for global imports of agricultural machinery
was particularly high in 2007 (26.76 percent). The average growth rate during the period 2000
to 2008 was only 10.61 percent due to the sharp decrease in growth in 2008, with a negative
growth rate of -29 percent. The African region had a higher average growth rate during the same
period (12.72 percent), however, compared to the global growth rate, the import of agricultural
machinery to the African region has fluctuated. The region had a negative growth rate (-20.22
percent) in 2001, and reached its highest value at 50.59 percent in 2004, and then dropped to the
lowest level in 2008, with a negative growth rate of -12.52 percent. The figure shows that the
African region’s growth rate was higher than the world’s.
23
Figure 7 Growth of agricultural machinery imports: Africa and the world
Data source: UN Comtrade, author’s calculations
4.2 Export of products and import of machinery
As agricultural mechanization is essential for improving agricultural productivity, this will
consequently increase the amount of agro-industrial products. In the era of deepening
globalization, an increased amount of agro-industrial products will result in higher levels of
agro-industrial product exports. Table 11 shows that imports of agricultural machinery by the
selected six countries from the African region are increasing rapidly, in particular in South
Africa, Kenya, Morocco and Ethiopia, where imports of agricultural machinery increased nearly
4 times between 2000 and 2007. In 2007, the indices for imports of agricultural machinery,
using 2000 as a base year, increased by 4.09, 4.96 and 4.44 for Madagascar, Morocco and
Ethiopia, respectively. This demonstrates the efforts by developing3African countries to invest
in agricultural mechanization to enhance their agro-industrial production.
Table 11 Imports of agricultural machinery by selected African countries: 2000-2007(million US$)
2000 2001 2002 2003 2004 2005 2006 2007
South Africa 387.41 307.97 614.85 721.84 1034.43 777.45 1095.04 1441.42
Kenya 38.03 50.87 46.60 47.12 89.42 90.15 94.04 138.36
Madagascar 3.85 3.48 1.80 6.45 16.42 25.96 11.58 15.76
Morocco 101.61 108.13 168.24 222.39 240.15 220.69 427.02 504.12
Egypt 99.41 81.83 65.80 41.81 69.01 99.06 119.93 198.88
Ethiopia 23.17 16.00 15.18 25.36 32.27 94.69 92.05 102.98
Source: UN Comtrade
3 South Africa belongs to the group of industrialized countries, however, it is used in this group of countries due to
the limited availability of data for other African countries.
-30.0
-20.0
-10.0
0.0
10.0
20.0
30.0
40.0
50.0
2000 2001 2002 2003 2004 2005 2006 2007 2008
African total imports
World total imports

24
The low level of engineering technology input in agriculture in Africa has been cited as one of
the major constraints preventing the modernization of agriculture in Africa and an increase in
the sector’s productivity. Therefore, increasing imports of agricultural machinery have
definitely had a positive impact on agricultural productivity in Africa, resulting in increased
agro-industrial production in those countries as indicated in Table 12. Accordingly, the selected
countries’ output of agro-industrial production is increasing for all the selected countries4except
for Madagascar. In 2006, the indices for output of agro-industrial products for South Africa,
Kenya, Morocco and Ethiopia was 1.98, 1.64, 1.40 and 1.48, respectively, implying that these
countries’ value of output increased by nearly twice the 2001 value.
Table 12 Output of agro-industrial products for selected African countries: 2000-2007 (million
US$)
2001 2002 2003 2004 2005 2006
South Africa 22649.43 22341.15 33461.25 41286.04 44171.79 44910.25
Kenya 2265.03 2224.34 2574.90 2665.82 3212.52 3723.23
Madagascar 744.04 527.27 737.68 500.82 464.83 470.57
Morocco 7818.85 8439.62 9773.25 10344.85 10612.66 10997.46
Ethiopia 634.26 599.20 656.65 751.85 804.63 940.72
Source: UNIDO statistics, INDSTAT2, 2011
Since African countries have increased their agricultural machinery imports in the last ten years,
their output of agro-industrial products has consequently increased as the earlier analysis shows,
therefore, we would expect exports of agro-industrial products to increase as well, as agriculture
contributes more than 80 percent of trade in value in African countries.
Figure 8 presents the index of total exports of agro-industrial products and total imports of
agricultural machinery in the African region. Recent years have witnessed an increase in both
imports and exports. The graph indicates a correlation of imports and exports, since they both
increase and decrease in the same periods. However, it is evident that more agricultural
machinery has been imported than agro-industrial products exported. Moreover, imports of
agricultural machinery are increasing faster than exports of agro-industrial products. This might
be attributable to the lag in production of imported machines which impacts agricultural output.
4 Egypt is excluded due to limited data availability on output production.

25
Figure 8 Index of total exports of agro-industrial products and total imports of agricultural
machinery in the African region
Source: UN Comtrade, author’s calculations (index 2001=100)
The economy in African countries is strongly dominated by agriculture, which generally
generates 50 percent of their GDP. Increased agricultural output results in the increase of
exports of agro-industrial products. The reason for this is that agricultural products usually
account for 80 percent of total exports in developing countries. As shown in Table 13, the
export of agricultural products5 of the selected countries increased in the period between 2000
and 2007. In 2007, the indices of agricultural product exports using 2000 as a base year
increased 1.84 percent, 1.72 percent, 1.39 percent, 1.71 percent, 3.68 percent and 2.13 percent
for South Africa, Kenya, Morocco, Egypt and Ethiopia, respectively. Africa is the only region in
the world where agricultural productivity is largely stagnant. This situation has triggered
profound demand to improve agricultural productivity. Our earlier analysis indicates that
African countries’ had undertaken efforts to attain agricultural mechanization by importing
agricultural machinery to boost production. However, their production performance has not
been as high as expected.
Table 13 Agricultural products exports: 2000 to 2007 for selected countries (million US$)
2000 2001 2002 2003 2004 2005 2006 2007
South
Africa
1735.96 1807.65 1896.21 2389.44 2674.13 3074.81 2882.31 3196.75
Kenya 879.56 845.50 388.90 987.09 983.23 1173.02 1313.92 1517.10
Madagascar 270.46 417.43 393.16 479.87 353.61 242.11 326.31 376.75
Morocco 1580.74 1479.33 1652.37 1841.89 1768.48 2199.10 2281.09 2707.54
Egypt 338.77 392.26 382.08 487.54 705.74 888.96 861.07 1245.64
Ethiopia 290.96 203.08 244.17 255.31 320.90 481.80 561.95 620.26
Source: UN Comtrade
5 Products included in SITC : Section: 0 - Food and live animals
50
100
150
200
250
300
2001 2002 2003 2004 2005 2006 2007 2008 2009
Total exports of agorindustrial products
Total imports of agricultural machineries

26
5 Summary
This analysis has outlined the development of African countries’ agro-industrial sector.
Exploring the different factors of the agro-industrial sectors in developing countries, especially
in African countries, our analysis presents the structure, growth pattern and international trade
of agro-industry. The situation of agricultural machinery imports in Africa is also addressed, as
agro-industry productivity is very much related to the degree of industrialization of the country.
The findings suggest that developing countries have a larger share of agro-industrial
manufacturing value added than industrialized countries, underlining the commonly held view
that the significance of the agro-industrial sector decreases in industrialized countries.
Moreover, at national level the share of agro-industry in total manufacturing value added
decreased in the period 1995–2006 for selected countries in Asia, Latin America and Africa.
Agro-industry covers eight manufacturing sectors, of which the food and beverages industry has
a relatively strong presence in the agro-industrial sector.
With regard to international trade of agro-industrial products in African countries, agro-
industrial exports in total exports at national level are significant for many countries of the
region. This is attributable to the fact that agro-industrial products exports contribute more than
30 percent in total exports at national level. As far as the main target exports of agro-industrial
products in African countries are concerned, Europe is the region’s principal exporting market.
The low level of investment in agricultural machinery in African countries has been quoted as
one of the main reasons for low agricultural productivity. Our analysis of agricultural machinery
imports in African countries indicates an increasing trend in the last ten years. Although the
average growth of African agricultural machinery imports is higher than 10 percent on average,
the total still accounts for less than 3 percent of total agricultural machinery imports in the
world. The region’s agricultural machinery imports were more diversified in 2008 than in 2000,
including the top ten trade partners from Asia, Europe, Africa, Latin and North America. Europe
is the major exporter of agricultural machinery with a share of more than 50 percent of total
global agricultural machinery exports. With regard to agricultural machinery imports in the
African region, wheeled tractors are the most important agricultural machinery group being
imported, dominating more than 50 percent of total agricultural machinery imports for most of
the African countries at national level.
The analysis also shows that even though total agro-industrial exports are positively correlated
with total imports of agricultural machinery in the African region, the leading importers of
agricultural machinery at regional level are not the top exporters of agro-industrial products. Of

27
the top ten exporters of agro-industrial products, only Morocco, Nigeria, Tunisia and Kenya
belong to the group of top ten countries in terms of agricultural machineries imports at regional
level. Moreover, taking the indices trends from a sample of countries into consideration, which
reveal a higher growth rate of agricultural machinery imports than of agro-industrial products
output and of exports of agricultural products, we can conclude that in spite of the significant
efforts undertaken by developing countries thus far to attain agricultural mechanization, they
still have a long way to go until they reach a level at which this technology is being used as
efficiently as possible. To some extent, all African countries have undergone agricultural
modernization, which involves a very important component of industrialized inputs to introduce
technical changes.
28
Annex: List of countries included in export import data analysis
1. Algeria
2. Benin
3. Botswana
4. Burkina Faso
5. Burundi
6. Cameroon
7. Cape Verde
8. Central African Republic
9. Comoros
10. Côte d'Ivoire
11. Egypt
12. Eritrea
13. Ethiopia
14. Gabon
15. Gambia
16. Ghana
17. Guinea
18. Kenya
19. Lesotho
20. Madagascar
21. Malawi
22. Mali
23. Mauritania
24. Mauritius
25. Morocco
26. Mozambique
27. Namibia
28. Niger
29. Nigeria
30. Sao Tome and Principe
31. Senegal
32. Seychelles
33. Sierra Leone
34. Sudan
35. Swaziland
36. Togo
37. Tunisia
38. Uganda
39. United Republic of Tanzania
40. Zambia
41. Zimbabwe

29
References
FAO/UNIDO (2008), “Agricultural mechanization in Africa... Time for action”, Report of an
Expert Group Meeting, FAO/UNIDO, Vienna, January 2008
Helpman E. (1997), “R&D and Productivity: The International Connection”, NBER Working
Papers No. 6101, National Bureau of Economic Research, Cambridge, July 1997
Keller W. (1999), “How Trade Patterns and Technology Flows Affect Productivity Growth”,
NBER Working Paper No. 6990,National Bureau of Economic Research, Cambridge, March
1999
UNECA (2010), African Statistical Yearbook, African Development Bank
WDI (2011), “World Development Indicators”, World Bank
Wilkinson J., Rocha R. (2008), “Agro industries trends, patterns and developmental impacts”,
FAO, UNIDO
Yumkella K.K., Kormawa P.M., Roepstorff T.M., Hawkins A.M (2011), “Agribusiness for
Africa’s prosperity”, UNIDO, Vienna


UNITED NATIONS INDUSTRIAL DEVELOPMENT ORGANIZATIONVienna International Centre, P.O. Box 300, 1400 Vienna, AustriaTelephone: (+43-1) 26026-0, Fax: (+43-1) 26926-69E-mail: [email protected], Internet: www.unido.org
Printed in AustriaV.13-80934—April 2013—260