the structural relationships between amorphous ices
TRANSCRIPT
The structural relationships between amorphous ices
J.S.Loveday, R.J.Nelmes,M.Guthrie and C.L.Bull SUPa, School of Physics and centre for science at extreme conditions,
University of EdinburghS.Klotz , T.Strassle and G.Hamel
IMPMC CNRS 7590, Universite P et M Curie, Paris, France
The structural relationships between amorphous ices
J.S.Loveday, R.J.Nelmes,M.Guthrie and C.L.Bull SUPa, School of Physics and centre for science at extreme conditions,
University of EdinburghS.Klotz , T.Strassle and G.Hamel
IMPMC CNRS 7590, Universite P et M Curie, Paris, France
IntroductionThe idea that a second critical point in the liquid water phase diagram at 220 K and 0.1 GPa could explain the anomalous properties of water is a major current issue in water science. Below this temperature it is proposed that a line of first order phase transitions separates low and high density liquid water [1]. Unfortunately this behaviour occurs at temperatures where non-crystalline water (either amorphous or supercooled liquid) crystallises (Fig 1.). Hence, the principal experimental tests of this model involve studies of the two forms of amorphous ice — low density amorphous ice (LDA) and high density amorphous ice (HDA) — based on the assumption that these amorphs are representative the glassy forms of the respective liquids.
The two amorphs can be reversibly interconverted by pressure at 130 K and the character of this transformation is a crucial test of the two-liquids model. Early volumetric studies show a discontinuous volume change at 0.3 GPa on upstroke and 0.05 GPa on downstroke [2]. More recent detailed microscopic investigations have explored the thermal decomposition of metastable HDA recovered to ambient pressure and the various studies have reached diametrically opposed conclusions. Visual observation and Raman [3], and neutron diffraction studies [4] concluded that the transition was a simple first-order transition, while neutron and x-ray diffraction studies [5] found evidence for intermediate states between LDA and HDA and hence concluded that the transition was continuous.
The situation was further complicated by the proposal that the densified state produced by warming HDA at pressures above (~1 GPa) is a third distinct amorphous state — very-high density amorphous ice (VHDA) [6]. Recent molecular dynamics studies have concluded that VHDA and not HDA is the representative glassy form of the high density liquid [7].
Since almost all of the microscopic investigations of amorphous ices have been performed at ambient pressure , the effect of pressure and the relationships between the various forms remain unclear. We have now completed a detail investigation of the P-T behaviour using the Paris-Edinburgh cell and neutron diffraction.
P-T behaviour of HDA
To examine the in-situ behaviour of HDA we followed the position of the first diffraction peak as a function of pressure and temperature to monitor the state of the sample. We first explored the behaviour of HDA produced by slow compression at temperatures below 85K. Under these conditions provided the sample is kept below 85 K then the ambient pressure peak position is 2.98(2) Å (the generally accepted value for HDA) and the peak has an upstroke pressure dependence shown as a black dotted line in Figure 3. We call this unrelaxed form u-HDA
When warmed at pressures in the range 1.4-2.0 GPa the peak moves to shorter d-spacing and sharpens as the sample anneals to form VHDA (light blue triangles) and these annealed samples when recovered to ambient pressure at 85 K had a peak position of 2.75 Å characteristic of VHDA. It is interesting to note that the difference between u-HDA and VHDA at the pressures at which VHDA is formed are much smaller than when recovered to ambient pressure.
We next explored the behaviour on warming at pressures comparable to that of the LDA to HDA transformation. The filled red circles in Figure 3 show the behaviour of a sample of u-HDA on warming at ~0.1 GPa. As can be seen there is a strong expansion of the position of the first peak to a position well beyond that of u-HDA at ambient pressure to a form which we denote expanded or e-HDA. On pressure increase the peak moves rapidly and becomes coincident with the u-HDA line at about 0.6 GPa. Samples of VHDA also expand when warmed at low pressure (solid and open blue squares) to form e-HDA and LDA transforms under pressure to form this same e-HDA (open red circles).
On recovery to ambient pressure e-HDA shows very different behaviour to u-HDA . Instead of moving strongly to longer d-spacings when warmed and then transforming to LDA in the range 105-110 K as Tulk et al [5] and Koza et al found [4] (open symbols), the first peak shows almost no movement (particularly for the sample produced at the lowest pressure shown as red squares) and transforms at a much higher temperature of ~128 K. Furthermore, the transformation to LDA appears to be a simple discontinuous transition.
IceVII
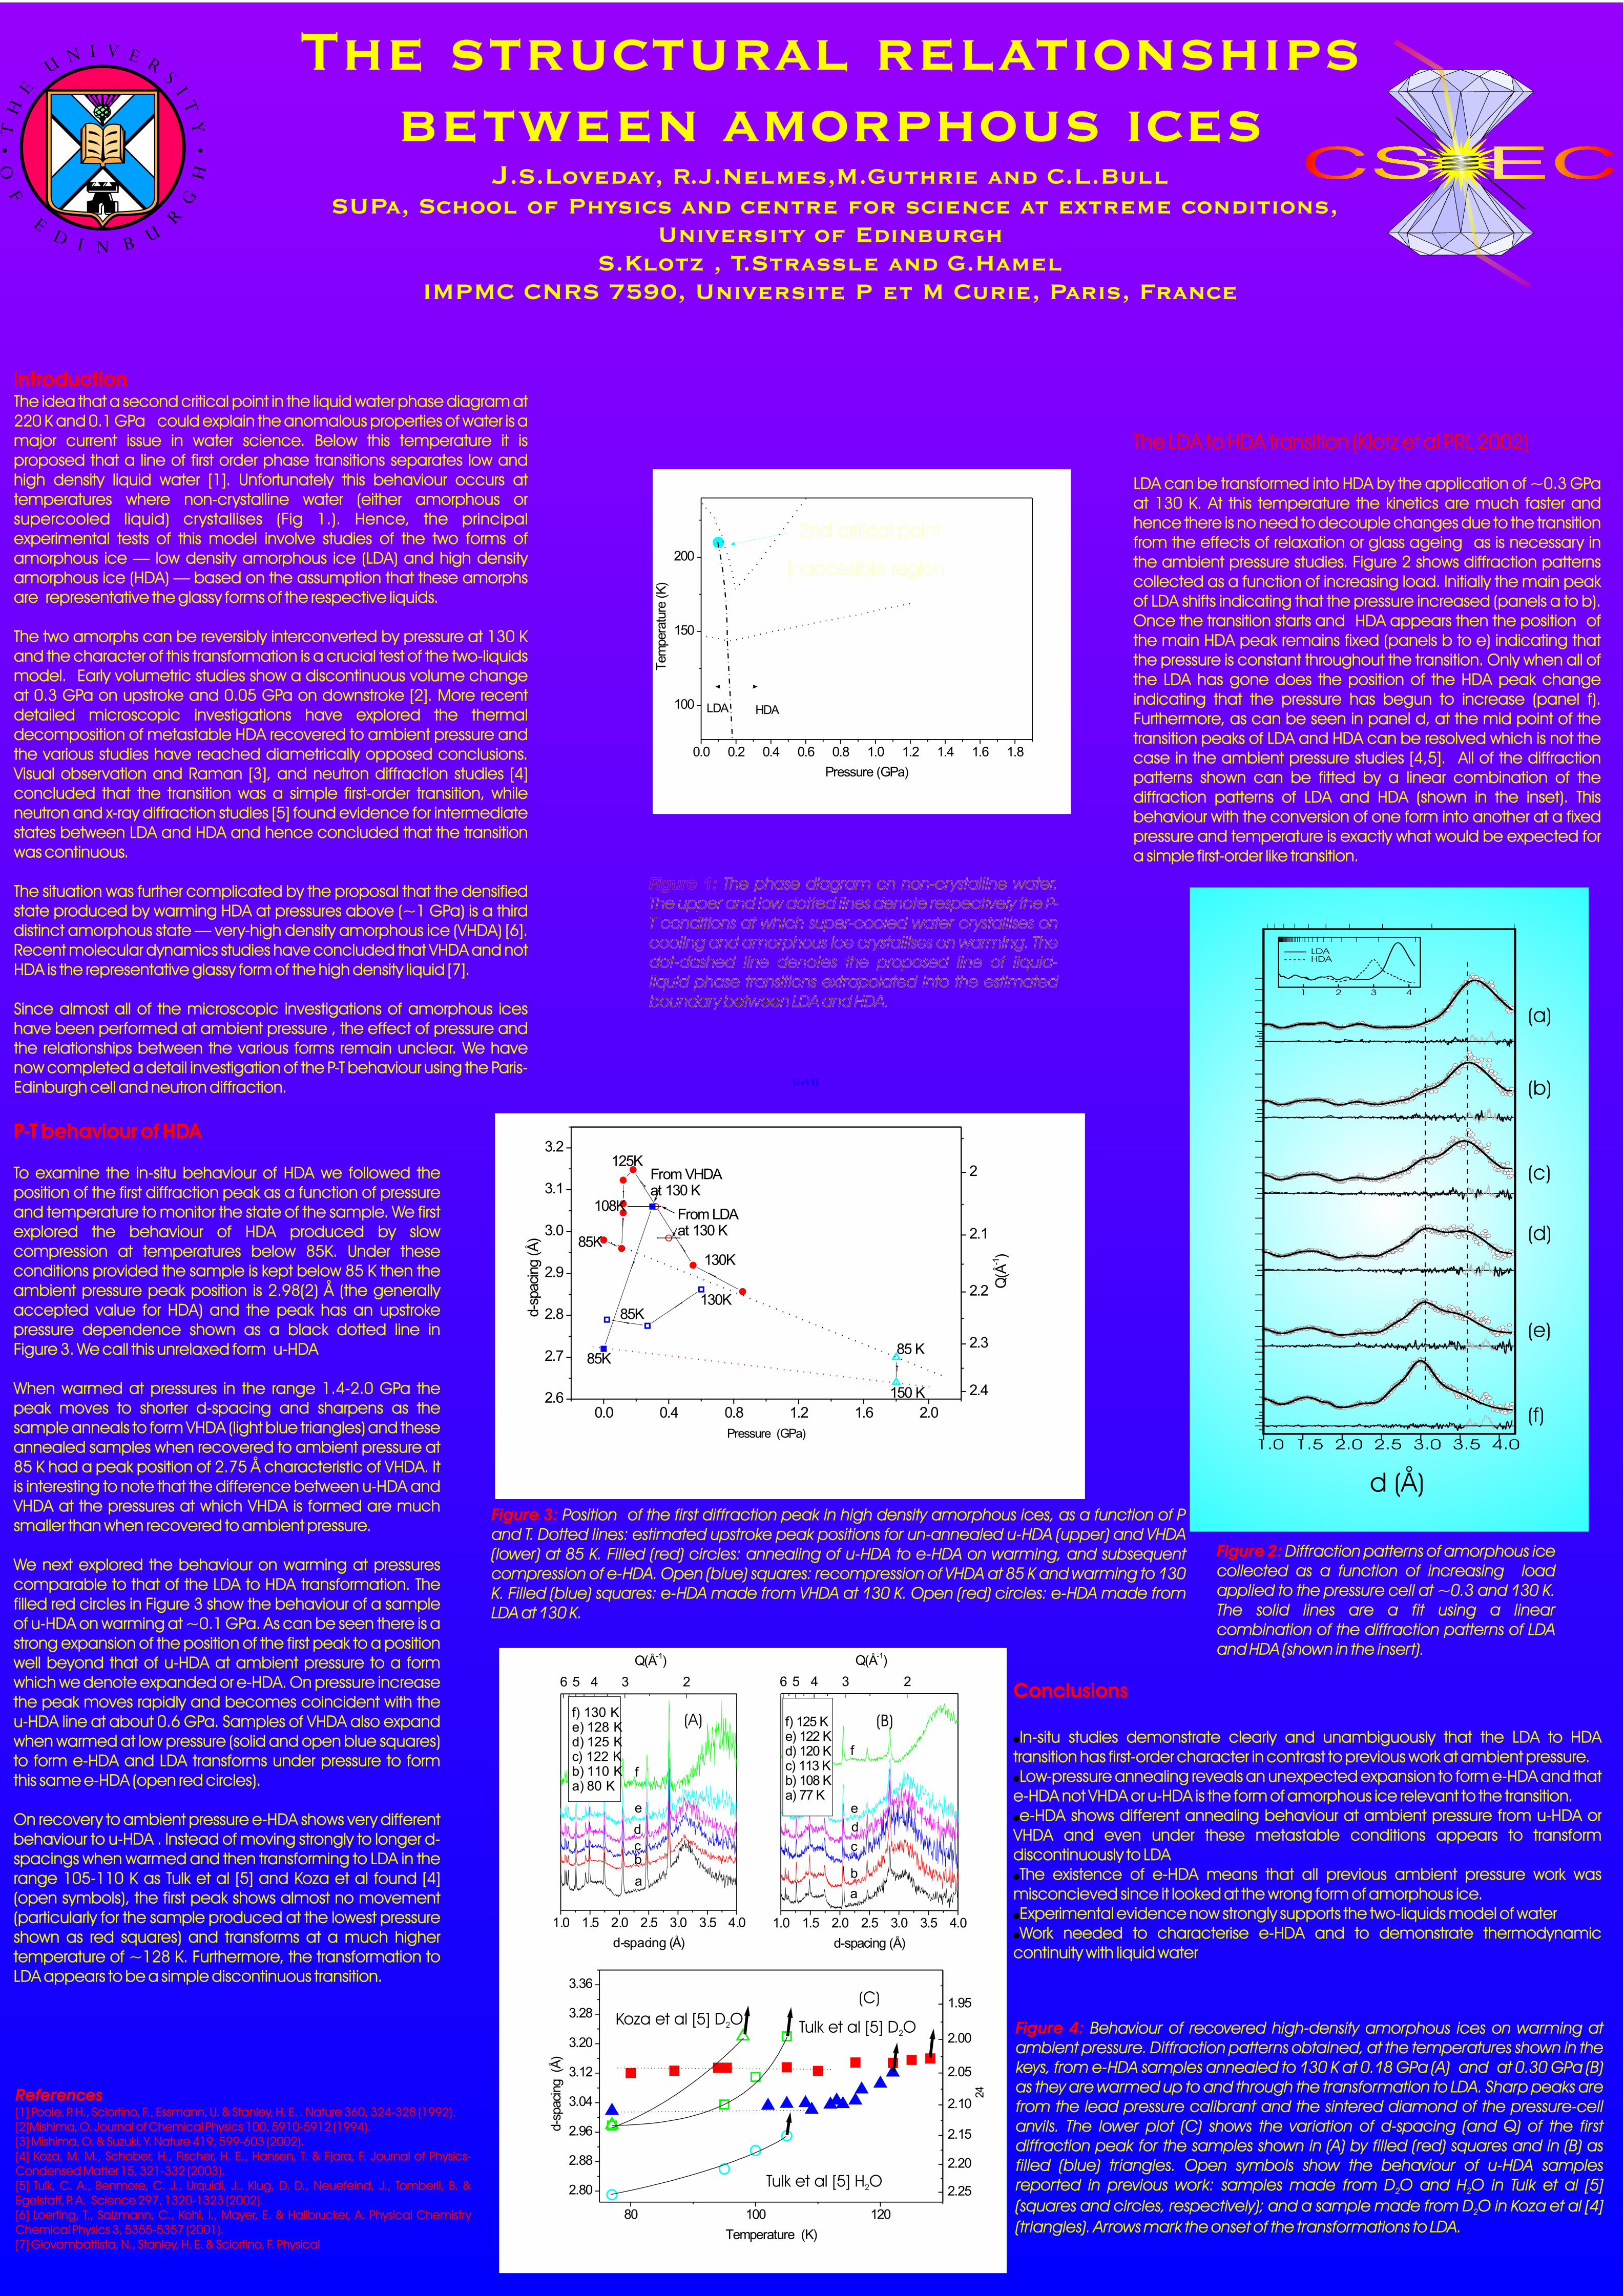
The LDA to HDA transition (Klotz et al PRL 2002)
LDA can be transformed into HDA by the application of ~0.3 GPa at 130 K. At this temperature the kinetics are much faster and hence there is no need to decouple changes due to the transition from the effects of relaxation or glass ageing as is necessary in the ambient pressure studies. Figure 2 shows diffraction patterns collected as a function of increasing load. Initially the main peak of LDA shifts indicating that the pressure increased (panels a to b). Once the transition starts and HDA appears then the position of the main HDA peak remains fixed (panels b to e) indicating that the pressure is constant throughout the transition. Only when all of the LDA has gone does the position of the HDA peak change indicating that the pressure has begun to increase (panel f). Furthermore, as can be seen in panel d, at the mid point of the transition peaks of LDA and HDA can be resolved which is not the case in the ambient pressure studies [4,5]. All of the diffraction patterns shown can be fitted by a linear combination of the diffraction patterns of LDA and HDA (shown in the inset). This behaviour with the conversion of one form into another at a fixed pressure and temperature is exactly what would be expected for a simple first-order like transition.
Conclusions
!
!
!
!
!
!
In-situ studies demonstrate clearly and unambiguously that the LDA to HDA transition has first-order character in contrast to previous work at ambient pressure.Low-pressure annealing reveals an unexpected expansion to form e-HDA and that
e-HDA not VHDA or u-HDA is the form of amorphous ice relevant to the transition.e-HDA shows different annealing behaviour at ambient pressure from u-HDA or
VHDA and even under these metastable conditions appears to transform discontinuously to LDA The existence of e-HDA means that all previous ambient pressure work was
misconcieved since it looked at the wrong form of amorphous ice.Experimental evidence now strongly supports the two-liquids model of water Work needed to characterise e-HDA and to demonstrate thermodynamic
continuity with liquid water
Conclusions
In-situ studies demonstrate clearly and unambiguously that the LDA to HDA transition has first-order character in contrast to previous work at ambient pressure.Low-pressure annealing reveals an unexpected expansion to form e-HDA and that
e-HDA not VHDA or u-HDA is the form of amorphous ice relevant to the transition.e-HDA shows different annealing behaviour at ambient pressure from u-HDA or
VHDA and even under these metastable conditions appears to transform discontinuously to LDA The existence of e-HDA means that all previous ambient pressure work was
misconcieved since it looked at the wrong form of amorphous ice.Experimental evidence now strongly supports the two-liquids model of water Work needed to characterise e-HDA and to demonstrate thermodynamic
continuity with liquid water
0.0 0.2 0.4 0.6 0.8 1.0 1.2 1.4 1.6 1.8
100
150
200
HDALDA
Tem
pera
ture
(K)
Pressure (GPa)
Inaccesible region
2nd critical point
Figure 1: The phase diagram on non-crystalline water. The upper and low dotted lines denote respectively the P-T conditions at which super-cooled water crystallises on cooling and amorphous ice crystallises on warming. The dot-dashed line denotes the proposed line of liquid-liquid phase transitions extrapolated into the estimated boundary between LDA and HDA.
Figure 1: The phase diagram on non-crystalline water. The upper and low dotted lines denote respectively the P-T conditions at which super-cooled water crystallises on cooling and amorphous ice crystallises on warming. The dot-dashed line denotes the proposed line of liquid-liquid phase transitions extrapolated into the estimated boundary between LDA and HDA.
Figure 2: Diffraction patterns of amorphous ice collected as a function of increasing load applied to the pressure cell at ~0.3 and 130 K. The solid lines are a fit using a linear combination of the diffraction patterns of LDA and HDA (shown in the insert).
Figure 2: Diffraction patterns of amorphous ice collected as a function of increasing load applied to the pressure cell at ~0.3 and 130 K. The solid lines are a fit using a linear combination of the diffraction patterns of LDA and HDA (shown in the insert).
4.03.53.02.52.01.51.0
4321
LDA HDA
d (Å)
(a)
(b)
(c)
(d)
(e)
(f)0.0 0.4 0.8 1.2 1.6 2.02.6
2.7
2.8
2.9
3.0
3.1
3.2
2.4
2.3
2.2
2.1
2
85 K
150 K
85K
130K
From VHDAat 130 K
From LDAat 130 K
130K
125K
85K
85K
108K
d-sp
acin
g(Å
)
Pressure (GPa)
Q(Å
-1)
1.0 1.5 2.0 2.5 3.0 3.5 4.0
6 5 4 3 2
f
a
c
d
e
b
d-spacing (Å)
f) 125 Ke) 122 Kd) 120 Kc) 113 Kb) 108 Ka) 77 K
Q(Å-1)
2.25
2.20
2.15
2.10
2.05
2.00
1.95
80 100 120
2.80
2.88
2.96
3.04
3.12
3.20
3.28
3.36
d-sp
acin
g(Å
)
Temperature (K)
24
1.0 1.5 2.0 2.5 3.0 3.5 4.0
6 5 4 3 2
f
bcd
e
a
d-spacing (Å)
f) 130 Ke) 128 Kd) 125 Kc) 122 Kb) 110 Ka) 80 K
Q(Å-1)
Figure 4: Behaviour of recovered high-density amorphous ices on warming at ambient pressure. Diffraction patterns obtained, at the temperatures shown in the keys, from e-HDA samples annealed to 130 K at 0.18 GPa (A) and at 0.30 GPa (B) as they are warmed up to and through the transformation to LDA. Sharp peaks are from the lead pressure calibrant and the sintered diamond of the pressure-cell anvils. The lower plot (C) shows the variation of d-spacing (and Q) of the first diffraction peak for the samples shown in (A) by filled (red) squares and in (B) as filled (blue) triangles. Open symbols show the behaviour of u-HDA samples reported in previous work: samples made from D O and H O in Tulk et al [5] 2 2
(squares and circles, respectively); and a sample made from D O in Koza et al [4] 2
(triangles). Arrows mark the onset of the transformations to LDA.
Figure 4: Behaviour of recovered high-density amorphous ices on warming at ambient pressure. Diffraction patterns obtained, at the temperatures shown in the keys, from e-HDA samples annealed to 130 K at 0.18 GPa (A) and at 0.30 GPa (B) as they are warmed up to and through the transformation to LDA. Sharp peaks are from the lead pressure calibrant and the sintered diamond of the pressure-cell anvils. The lower plot (C) shows the variation of d-spacing (and Q) of the first diffraction peak for the samples shown in (A) by filled (red) squares and in (B) as filled (blue) triangles. Open symbols show the behaviour of u-HDA samples reported in previous work: samples made from D O and H O in Tulk et al [5]
(squares and circles, respectively); and a sample made from D O in Koza et al [4]
(triangles). Arrows mark the onset of the transformations to LDA.
2 2
2
References[1] Poole, P. H., Sciortino, F., Essmann, U. & Stanley, H. E. . Nature 360, 324-328 (1992).[2]Mishima, O. Journal of Chemical Physics 100, 5910-5912 (1994).[3] Mishima, O. & Suzuki, Y. Nature 419, 599-603 (2002).[4] Koza, M. M., Schober, H., Fischer, H. E., Hansen, T. & Fjara, F. Journal of Physics-Condensed Matter 15, 321-332 (2003).[5] Tulk, C. A., Benmore, C. J., Urquidi, J., Klug, D. D., Neuefeind, J., Tomberli, B. & Egelstaff, P. A. Science 297, 1320-1323 (2002).[6] Loerting, T., Salzmann, C., Kohl, I., Mayer, E. & Hallbrucker, A. Physical Chemistry Chemical Physics 3, 5355-5357 (2001).[7] Giovambattista, N., Stanley, H. E. & Sciortino, F. Physical
References[1] Poole, P. H., Sciortino, F., Essmann, U. & Stanley, H. E. . Nature 360, 324-328 (1992).[2]Mishima, O. Journal of Chemical Physics 100, 5910-5912 (1994).[3] Mishima, O. & Suzuki, Y. Nature 419, 599-603 (2002).[4] Koza, M. M., Schober, H., Fischer, H. E., Hansen, T. & Fjara, F. Journal of Physics-Condensed Matter 15, 321-332 (2003).[5] Tulk, C. A., Benmore, C. J., Urquidi, J., Klug, D. D., Neuefeind, J., Tomberli, B. & Egelstaff, P. A. Science 297, 1320-1323 (2002).[6] Loerting, T., Salzmann, C., Kohl, I., Mayer, E. & Hallbrucker, A. Physical Chemistry Chemical Physics 3, 5355-5357 (2001).[7] Giovambattista, N., Stanley, H. E. & Sciortino, F. Physical
CS ECCS EC
(A) (B)
(C)
Tulk et al [5] H O2
Tulk et al [5] D O2
Figure 3: Position of the first diffraction peak in high density amorphous ices, as a function of P and T. Dotted lines: estimated upstroke peak positions for un-annealed u-HDA (upper) and VHDA (lower) at 85 K. Filled (red) circles: annealing of u-HDA to e-HDA on warming, and subsequent compression of e-HDA. Open (blue) squares: recompression of VHDA at 85 K and warming to 130 K. Filled (blue) squares: e-HDA made from VHDA at 130 K. Open (red) circles: e-HDA made from LDA at 130 K.
Figure 3: Position of the first diffraction peak in high density amorphous ices, as a function of P and T. Dotted lines: estimated upstroke peak positions for un-annealed u-HDA (upper) and VHDA (lower) at 85 K. Filled (red) circles: annealing of u-HDA to e-HDA on warming, and subsequent compression of e-HDA. Open (blue) squares: recompression of VHDA at 85 K and warming to 130 K. Filled (blue) squares: e-HDA made from VHDA at 130 K. Open (red) circles: e-HDA made from LDA at 130 K.
Koza et al [5] D O2