the strategic use of corporate cash holdings in collective
TRANSCRIPT
The strategic use of corporate cash holdings in collective bargaining with labor unions*
* We thank an anonymous referee, Amr Addas, Tom Bates, Edith Ginglinger, Jarrad Harford, David Haushalter, Jean Helwege, Marcin Kacperczyk, Kathy Kahle, Kai Li, Sattar Mansi, Josh Rosett, Bill Schwert, Husayn Shahrur, Janet Smith, Mike Stegemoller, Marc Weidenmier, and seminar participants at the University of Arizona, the 2007 Northern Finance Association Conference, and the 2008 French Finance Association conference for helpful suggestions. Hernan Ortiz-Molina acknowledges the financial support provided by the Social Sciences and Humanities Research Council of Canada. We are grateful to Barry Hirsch for providing us with his firm-level estimates of collective bargaining coverage. Tyler Brough and Aseem Vyas provided excellent research assistance.
Sandy Klasa Eller College of Management
University of Arizona Tucson, AZ 85721
520.621.8761 [email protected]
William F. Maxwell
Eller College of Management University of Arizona
Tucson, AZ 85721 520.621.1716
Hernan Ortiz-Molina Sauder School of Business
University of British Columbia Vancouver, BC V6T 1Z2
604.822.6095 [email protected]
July 2008
Abstract
We provide evidence that firms in more unionized industries strategically hold less cash to gain bargaining advantages over labor unions and shelter corporate income from their demands. Specifically, we show that corporate cash holdings are negatively related with unionization. We also find that this relation is stronger for firms that are likely to place a higher value on gaining a bargaining advantage over unions and weaker for those firms in which lower cash holdings provide less credible evidence that a firm is unable to concede to union demands. Additionally, we document that for unionized firms increases in cash holdings raise the probability of a strike. Finally, we show that unionization decreases the market value of a dollar of cash holdings. Overall, our findings indicate that firms trade-off the benefits of corporate cash holdings with the costs resulting from a weaker bargaining position with labor. JEL Classifications: G31; G32 Key Words: cash holdings; corporate liquidity policy; labor unions
The strategic use of corporate cash holdings in collective bargaining with labor unions
Abstract: We provide evidence that firms in more unionized industries strategically hold less cash to gain
bargaining advantages over labor unions and shelter corporate income from their demands. Specifically,
we show that corporate cash holdings are negatively related with unionization. We also find that this
relation is stronger for firms that are likely to place a higher value on gaining a bargaining advantage over
unions and weaker for those firms in which lower cash holdings provide less credible evidence that a
firm is unable to concede to union demands. Additionally, we document that for unionized firms
increases in cash holdings raise the probability of a strike. Finally, we show that unionization decreases
the market value of a dollar of cash holdings. Overall, our findings indicate that firms trade-off the
benefits of corporate cash holdings with the costs resulting from a weaker bargaining position with labor.
1. Introduction
Firms often take strategic actions to improve their bargaining position with input suppliers. For
instance, horizontal mergers can be used to improve the buying power of the merged firm vis-à-vis
suppliers of input goods (e.g., Robinson (1933), Snyder (1996), and Shahrur (2005)). Firms also strive to
improve their bargaining position against labor, since labor costs usually represent a large fraction of a
firm’s total costs. Bronars and Deere (1991) show that firms can strategically use financial leverage to
shelter income from labor unions’ demands. Further, DeAngelo and DeAngelo (1991) find that unionized
firms manage their earnings downward prior to labor negotiations. They contend that this allows managers
to gain concessions from unions by creating the perception that the firm’s competitive viability is
threatened by current economic conditions.
In this paper, we investigate whether firms’ cash holding policies are affected by strategic
considerations that arise in the bargaining between the firm and its unionized workers. We hypothesize
that lower reported cash holdings improve firms’ bargaining positions against unions. By implementing a
policy of holding less liquid assets in the presence of a union, a firm can make a more credible case that
the risk of liquidity shortages threatens its competitive viability, a situation that would be exacerbated by
granting additional concessions to the union. Thus, we predict that firms facing stronger unions
strategically hold smaller cash reserves to improve their bargaining position and shelter corporate income
from union demands. Also, we predict that because a larger cash balance weakens a firm’s bargaining
position and allows unionized workers to capture a larger fraction of firm profits, the contribution of cash
holdings to firm value is lower in firms that face a strong union.
The anecdotal evidence suggests that corporate cash holdings indeed play an important role in
collective bargaining with unions. For instance, in 2006 General Motors was faced with a strike by workers
at Delphi, the auto-parts supplier which it owns. The Economist reported that because Delphi’s workers
knew that General Motors had a cash balance of approximately 20 billion dollars “they hope the threat of
a strike will prompt GM’s management to dip into its cash reserves to compensate them for accepting

2
lower pay and benefits.”1 Similarly, at the end of 1995 the United Auto Workers pointed out that Chrysler
was sitting on a cash balance of 7.5 billion dollars and demanded that it was time “the company repay its
73,000 hourly and salaried workers for the concessions they made to help keep the automaker afloat
through the 1980s.”2 Finally, in 2005 Delta was able to use its falling cash balances to trigger a provision in
the contract with its pilots’ union which would allow Delta to seek pay cuts from the pilots.3
In our empirical tests we use a firm’s industry unionization rate, defined as the percentage of workers
in the firm’s industry that belong to a union, as our primary proxy for whether the firm is likely to bargain
with a powerful union that represents a large fraction of the firm’s workers. Over the 1983-2005 period we
find strong support for the hypothesis that firms facing more powerful unions strategically hold smaller
cash reserves to improve their bargaining position and shelter income from unions’ demands. Specifically,
we document that firm-level cash holdings are negatively associated with industry unionization rates and
also show that changes in cash holdings are negatively related with changes in unionization rates. Further,
in industry-level analyses we find that average industry cash holdings are negatively associated with
industry unionization. These results hold after controlling for profitability, the ease with which firms can
access external capital markets, growth opportunities, leverage, capital intensity, import penetration levels,
whether a firm recently had an initial public offering, and a number of other control variables.
For a smaller sample for which we have estimates of firm-level unionization rates, we confirm the
finding of a negative association between cash holdings and unionization. We also study the effect of
unionization on cash holdings using two industry case studies. These case studies provide further evidence
that unionized firms hold less cash than do their non-unionized rivals, and additionally show that firms
reduce their cash holdings after they become unionized.
To better understand the nature of the negative relation between unionization and corporate cash
holdings, we examine how this relation is affected by the importance that firms are likely to attach to
1 See, “Last Tango In Detroit,” The Economist, April 8, 2006. 2 See Nichole M. Christian, “UAW Gets Tough With Cash-Rich Chrysler,” The Wall Street Journal, January 11, 1996. 3 See Evan Perez, “Delta Tells Pilots Union It May Seek Concessions as Cash Dwindles,” The Wall Street Journal, August 22, 2005.
3
gaining a bargaining advantage over unions. If this relation is driven by firms that face strong unions
strategically maintaining low cash balances to improve their bargaining position, then it should be more
pronounced when a strong bargaining position against unions is more valuable. Prior work indicates that
labor demands are larger in more concentrated industries due to a higher persistence of economic profits,
and that unions capture a greater proportion of the available economic rents in these industries (e.g.,
Salinger (1984) and Karier (1985)). Also, extant work shows that in states that have right-to-work laws,
which prohibit unions from making membership or payment of union dues a condition of employment,
union bargaining power is reduced (e.g., Ellwood and Fine (1987) and Holmes (1998)). As well, the
importance of gaining a bargaining advantage against unions and minimizing labor costs should be greatest
for firms in industries in which labor costs represent a large fraction of total costs. Consistent with
expectations, we find that the negative effect of industry unionization rates on cash holdings is more
pronounced for firms in more concentrated industries, for firms principally located in states with no right-
to-work laws, and for firms in industries in which labor costs represent a larger fraction of total costs.
To further determine if the negative relation between cash holdings and industry unionization rates is
the result of collective bargaining issues, we examine the effects of factors that impact the bargaining
advantage provided by a small cash balance. If this negative relation arises because firms that face strong
unions hold less cash to gain a bargaining advantage, then this relation should be less pronounced for
firms in which smaller cash reserves are less credible evidence that the firm cannot concede to unions’
demands. DeAngelo and DeAngelo (1991) show that dividend cuts enable firms to obtain concessions
from unions by convincing rank-and-file union members that shareholders themselves are forced to make
sacrifices to alleviate the firm’s financial difficulties. Along the same lines, if a firm is a dividend-paying
firm that disburses free cash flows to shareholders, it can less credibly use a small cash balance to induce
the union to accept a labor contract favorable to the firm. Likewise, a small cash balance provides less of a
bargaining advantage for firms that can easily raise external capital to alleviate cash shortfalls. Also, firms
that are closer to financial distress can more credibly argue that because of their low cash reserves they are
unable to provide concessions to unions. Consistent with these ideas, we find that the negative relation
4
between cash holdings and unionization rates is less pronounced for dividend-paying firms and for firms
with higher bond ratings. We also show that this negative association is more pronounced for firms that
that face greater bankruptcy risk, such as those that are less profitable, have lower Altman-Z scores, or
have higher debt levels.
Additionally, we find some evidence of a small decrease in the cash holdings of unionized firms the
year prior to labor contract expirations. While this is additional evidence that unionized firms manage their
cash holdings downward to gain bargaining advantages over labor, this finding also suggests that these
firms obtain bargaining advantages over unions primarily by holding less cash at all times rather than
managing cash levels downward prior to negotiations.
Next, we investigate whether increases in cash holdings weaken a firm’s bargaining position.
Specifically, since unions are more likely to seek concessions when they perceive that a firm is more able
to concede to their demands, we examine whether increases in cash holdings are associated with the
likelihood of strikes. Consistent with higher cash holdings weakening firms’ bargaining positions, we find
that recent increases in cash holdings raise the probability of a strike.
Finally, we examine whether the contribution of cash holdings to firm value is lower in firms facing a
stronger union. We predict that this should be the case because a large cash balance is costly for a firm
that faces a strong union as it weakens the firm’s bargaining position and allows labor to capture a larger
fraction of firm profits. Using the Faulkender and Wang (2006) methodology to determine the market
value of a firm’ cash holdings, we find consistent with expectations that the value of a dollar of corporate
cash reserves is lower in more unionized industries.
Our study makes two main contributions. First, we provide evidence that firms facing stronger
unions strategically maintain low cash balances to gain bargaining advantages over organized labor. In
doing so, we add to the literature on how strategic considerations that arise in the bargaining between
firms and unions affect corporate decisions (e.g., DeAngelo and DeAngelo (1991), Bronars and Deere
(1991), and D’Souza, Jacob, and Ramesh (2001)). More broadly, our study contributes to the literature on
how firms’ financial decisions are affected by the strategic interaction between firms and input suppliers

5
(e.g., Robinson (1933), Snyder (1996), Fee and Thomas (2004), Shahrur (2005), and Kale and Shahrur
(2007)).
Second, our study sheds additional light on what determines corporate cash holdings and the
contribution of cash holdings to firm value. In particular, we provide new evidence on the costs associated
with holding more liquid assets. Prior work, such as Jensen (1986), Harford (1999), and Harford, Mansi,
and Maxwell (2008) generally focuses on the agency costs that arise in firms in which CEOs use excess
cash holdings to invest in negative net-present-value projects. Pinkowitz, Stulz, and Williamson (2006) and
Dittmar and Mahrt-Smith (2007) show that in such firms these costs significantly reduce the value of a
dollar of cash holdings. Our analysis identifies another important cost of large cash reserves: they weaken
firms’ positions in collective bargaining with unions, and thus allow labor to capture a larger portion of
profits. Given that Kim, Mauer, and Sherman (1998), Opler, Pinkowitz, Stulz, and Williamson (1999), and
Mikkelson and Partch (2003) show that larger corporate cash holdings benefit firms by providing them
with the ability to fully invest in their growth prospects, our results suggest that unionized firms trade-off
these benefits with the costs resulting from a less favorable bargaining position with organized labor.
The remainder of the paper is organized as follows. Section 2 reviews prior work, develops
hypotheses, and discusses our empirical approach to measure union bargaining power. Section 3 describes
our sample and variables. Section 4 presents our empirical findings. Finally, Section 5 concludes.
2. Related literature, hypothesis development, and empirical approach
2.1. Bargaining betweens firms and unions: Theory
Most strategic models on collective bargaining between firms and unions consider a general two-party
situation (bilateral monopoly) in which a union tries to maximize the utility of its members, while the firm
attempts to maximize its value. The desire of a particular party to concede or hold out depends on
objective factors, such as the state of product demand and capital-labor substitution, and on subjective
factors, such as the assessment of the bargaining strategy of the other party. The wide variety of existing
models differ in their views of labor unions’ objectives, the information sets of each of the parties,

6
whether firms and unions negotiate over wages, employment, or both, whether the bargaining is static or
dynamic, and on how disagreements are resolved in practice. For example, in traditional static models,
such as those in Leontief (1946) and McDonald and Solow (1981) unions have control over wages but
firms choose employment levels. Earle and Pencavel (1990) model the bargaining over hours of work and
both Clark (1990) and Johnson (1990) model the bargaining over work rules. Other models rely on the
Nash (1950) bargaining solution where each party receives its payoff in case of disagreement plus a
fraction of the joint surplus that is increasing in the party’s bargaining power. Sequential bargaining models
based on Rubinstein (1982) incorporate the cost of delays in reaching agreements. For instance, in war of
attrition models (e.g., Fundenberg and Tirole (1986)) a party’s ability to endure strikes endows it with a
strong bargaining position.
Since the failure to agree on a settlement prior to a contract’s expiration is costly to the firm (loss of
profits) and workers (loss of wages), most collective bargaining models embed a tendency for the parties
to come to an agreement in time to avert a strike. Moreover, regardless of specific modeling details, in
these models a party’s ability to increase its share of the firm’s surplus is directly related to its bargaining
power. We hypothesize that firms can strategically use their cash holdings to increase their bargaining
power vis-à-vis the union, and thus obtain a larger share of firm surplus.
2.2. Bargaining betweens firms and unions: Empirical evidence
Prior empirical work shows that unionized firms place important emphasis on increasing their
bargaining power with unions. For instance, DeAngelo and DeAngelo (1991) provide evidence from the
restructuring of the steel industry during the 1980s showing that to gain concessions from unions firms
often try to make the case that the firm’s competitive viability is threatened by current economic
conditions. Their findings suggest that prior to negotiations with unions firms manage their earnings
downward in order to help their case for union concessions. Specifically, they show that unionized firms
report lower net income during negotiation than non-negotiation years. This difference is driven by
managers using their discretion to report one-time special charges during negotiation years. D’Souza,
7
Jacob, and Ramesh (2001) also report findings indicating that firms engage in earnings management to
gain bargaining advantages with unions. They document that prior to reducing retirement benefits
unionized firms are likely to adopt new accounting standards that allow them to reduce current net
income. Finally, DeAngelo and DeAngelo (1991) also find that during negotiations with unions
stakeholders other than union members agree to make sacrifices to bolster managerial requests for labor
concessions. For instance, they show that dividend reductions and cuts to managerial compensation are
more likely to occur during negotiations.
Bronars and Deere (1991), Hanka (1998), and Matsa (2006) suggest that firms can also improve their
bargaining power with unions by issuing more debt. By committing itself to repaying a larger portion of
future cash flows to creditors the firm puts a ceiling on the revenues that labor can extract from the firm
without driving it into bankruptcy. Consistent with these propositions, Bronars and Deere (1991) and
Matsa (2006) show that more unionized firms hold more debt than do less unionized firms. Also, Hanka
(1998) reports that higher debt results in decreased labor costs.
2.3. Corporate cash holdings
Because firms presumably choose their cash holding policies by trading-off benefits and costs of
holding cash reserves, recent research focuses on identifying these benefits and costs. Corporate cash
holdings are beneficial to firms because they reduce underinvestment problems in firms with high external
financing costs and large growth opportunity sets (e.g., Kim, Mauer, and Sherman (1998), Opler,
Pinkowitz, Stulz, and Williamson (1999), and Mikkelson and Partch (2003)). Supporting this view,
Faulkender and Wang (2006) document that the contribution of cash holdings to firm value is larger in
more financially constrained firms. Also, Harford, Mikkelson, and Partch (2003) show that a large cash
balance enables firms to continue investing in their growth opportunities both during and immediately
after an industry downturn. Further, Haushalter, Klasa, and Maxwell (2007) find that the ability to fully
invest in growth opportunities provided by cash holdings enables firms to compete more successfully in
the product markets.
8
On the other hand, large cash reserves can also be costly to the firm. In addition to the lower return
earned by cash holdings relative to other investments of the same risk, in firms with important agency
problems large cash holdings can allow managers to invest in value-decreasing projects (e.g., Jensen (1986),
Harford (1999), and Harford, Mansi, and Maxwell (2008)). Consistent with the idea that in such firms cash
holdings are costly, Pinkowitz, Stulz, and Williamson (2006) and Dittmar and Mahrt-Smith (2007) show
that market participants value a dollar of cash holdings less highly when a firm has more severe agency
problems.
2.4. Hypothesis development
Our main hypothesis is that firms’ cash holding policies are determined, at least in part, by strategic
considerations that arise in the collective bargaining between firms and unionized workers. In particular,
we argue that a policy of holding less liquid assets improves firms’ bargaining positions against labor
unions, and that firms choose their cash holding policies taking this into account. Our intuition is simple.
By holding small cash reserves, a firm can make a more credible case that the risk of liquidity shortages
threatens its competitive viability, a situation that would be exacerbated by granting additional concessions
to unionized workers. As a result, a policy of holding smaller cash reserves is beneficial to the firm because
it allows it to moderate the demands of its labor force. Thus, our first hypothesis is:
Hypothesis 1. Firms facing unions with greater bargaining power strategically hold smaller cash reserves to improve their bargaining position and shelter corporate income from union demands.
Our main hypothesis also suggests the following three sub-hypotheses.
Hypothesis 1a. The negative relation between corporate cash holdings and the union’s bargaining power is stronger (weaker) for firms that attach more (less) importance to gaining a bargaining advantage over unions.
Hypothesis 1b. The negative relation between corporate cash holdings and the union’s bargaining power is stronger (weaker) for firms in which a small cash balance is likely to provide a larger (smaller) bargaining advantage.
Hypothesis 1c. Firms that experience increases in their cash holdings lose bargaining strength relative to unions and this raises the likelihood that a union decides to strike to obtain concessions from the firm.

9
Finally, previous work shows that the market value of firms’ cash holdings depends on the costs and
benefits of holding more liquid assets. Since large cash holdings are more costly for firms facing a strong
union because they weaken the firm’s bargaining position and allow labor to capture a larger fraction of
profits, this should be reflected in the market’s valuation of cash reserves. This leads to our second
hypothesis.
Hypothesis 2. The contribution of cash holdings to firm value is lower in firms that face stronger unions.
2.5. Empirical approach to measure union bargaining power
The labor economics literature typically uses unionization rates to measure union bargaining power.
The underlying logic is that a union’s bargaining power is increasing in the fraction of the firm’s workers
that are unionized, because unions’ actions in firms that have a large fraction of unionized workers carry
more important consequences for the firm. It is difficult to reliably collect firm-level unionization data
from the filings of publicly traded firms because such firms are not required to provide union membership
information about their workers. However, the Bureau of Labor Statistics collects detailed and accurate
industry-level data on union membership. As a result, previous studies on labor unions assume that
industry unionization rates are a reasonable proxy for the expected unionization rates of firms within an
industry and use them as a proxy for union bargaining power (e.g., Rosen (1969), Karier (1985), Connolly,
Hirsch, and Hirschey (1986), and Bronars and Deere (1991)). The empirical evidence supports the use of
industry unionization rates as a proxy for union bargaining power. For example, early work by Rosen
(1969) shows that in industries with higher unionization rates production workers earn higher salaries.
In our main tests we follow most of the previous literature and use industry unionization rates to
proxy for whether firms in a given industry are likely to bargain with a powerful union. An important
advantage of this approach is that it allows us to conduct a large-scale study of the effect of unionization
on corporate cash holdings. This gives us confidence about the general validity of the findings we
document across an important spectrum of firms and industries. Of course, the disadvantage of our
10
approach is that industry unionization rates may be a noisy proxy for firm-level unionization rates and this
may decrease the power of tests that use these rates.4
After using industry unionization rates to study the association between union bargaining power and
cash holdings, we conduct additional tests in which we refine our empirical measure of union bargaining
power. For this purpose, we supplement the use of industry unionization rates as a measure of union
bargaining power with the use of additional firm-level variables that affect this power. In particular, we
interact industry unionization rates with two sets of variables. The first set of variables proxies for the
importance that firms attach to obtaining a bargaining advantage over unions. The second set of variables
is designed to measure the extent to which having a small cash balance is likely to provide firms with a
bargaining advantage vis-à-vis unions.
Finally, for a small sample of observations we obtain firm-level estimates of unionization collected
from survey data and examine whether for this sample we find a similar association between unionization
and cash holdings as we do in our large-scale tests that use industry unionization rates. To further study
the effect of union bargaining power on corporate cash holdings, we also present evidence from two short
case studies in which we compare unionized firms with non-unionized firms within the same industry and
study a firm around the time when it first became unionized.5
3. Data
3.1. Sample
We study the population of Compustat firms that operate in the manufacturing sector (six-digit
North American Industry Classification System (NAICS) codes between 311111 and 339999) over the
1983-2005 period. Specifically, we have a sample of 34,042 firm-years during this period for which data on
industry unionization rates are available and there is no missing data for the main variables used in our
4 The evidence in Bronars and Deere (1991) and Matsa (2006) suggests using firm- or industry-level data in tests that examine how unionization affects firm-level corporate policy choices yields similar qualitative results. 5 We note that another approach to identify firms that bargain with a powerful union is to focus on one industry in which workers are represented by a powerful multi-employer bargaining group. For instance, DeAngelo and DeAngelo (1991) focus their analyses on U.S. steel firms in the 1980s that were represented by the United Steelworkers of America.
11
analyses. We focus on manufacturing firms because many of our tests require data on industry
concentration or industry cost structures which we obtain from the Census of Manufactures and Annual Survey
of Manufactures publications.
3.2. Industry unionization data
We obtain data on annual industry unionization rates for the 1983-2005 period from the Union
Membership and Coverage Database maintained by Barry Hirsch and David Macpherson, which is publicly
available at www.unionstats.com.6 This database reports industry unionization rates for 3-digit Census
Industry Classification (CIC) industries. These rates represent the percentage of total workers in a CIC
industry that are covered by unions in collecting bargaining agreements. Our unionization data span 77 3-
digit CIC industries in the manufacturing sector with CIC codes between 100 and 392. We are able to
determine which 4-digit SIC codes correspond to 3-digit CIC codes and hence are able to assign industry
unionization rates to our sample firms.
Table 1 provides a list of the 77 3-digit CIC manufacturing industries we study and the corresponding
means and standard deviations of the unionization rates within an industry over the 1983-2005 period.
The industries are sorted by unionization rates. The table shows that there is a large cross-sectional
variation in the unionization rates across industries. Pulp, paper, and paperboard mills, blast furnaces and
steelworks, leather tanning, motor vehicles, tires, primary aluminum, and engines and turbines are the
most unionized industries, with mean unionization rates above 40%. On the other hand, drugs, knitting
mills, wood buildings and mobile homes, medical, dental, and optical instruments, and computer and
related equipment are among the least unionized industries with mean unionization rates below 7%. The
standard deviations reported in the table show that there is also some time-series variation in unionization
rates. The times-series variation is similar across industries, as evidenced by the small differences across
industries in the standard deviation relative to the mean. To inspect the sources of the variation in industry
unionization rates more carefully, we run a regression of unionization rates on 3-digit CIC dummies and
6 See Hirsch and Macpherson (2003) for details on the construction of this unique and comprehensive dataset.
12
obtain an r-squared of 84 percent. This suggests that approximately 84 percent of the total variation in
industry unionization rates is cross-sectional variation while only 16 percent is time-series variation. Since
the cross-sectional variation is the primary source of independent variation in unionization rates, most of
our empirical tests rely on this variation to identify our coefficient estimates.
3.3. Estimate of the fraction of an industry’s blue-collar workers that are unionized
From the division of Occupational Employment Statistics of the Bureau of Labor Statistics (BLS), we
obtained data for 3-digit SIC manufacturing industries (we converted NAICS codes to SIC codes after
2001) on the number of workers employed in approximately 800 different occupations. For each industry,
we examined the title of each occupation and following the definition used by the BLS we classified all
non-office occupations as blue-collar occupations. With the data available we are able to determine the
number of blue collar workers in each industry for 1989, 1992, 1995, and for each of the years 1997-2001.
We assume that the 1989, 1992, 1995, and 2001 estimates are valid for the 1983-1990, 1991-1993, 1994-
1996, and 2001-2005 periods, respectively. To estimate the number of unionized workers in a firm’s
industry, we multiply the number of workers in the firm’s 3-digit SIC industry by the fraction of the
workers in the firm’s 3-digit CIC industry that are unionized. Next, we estimate the fraction of the blue-
collar workers in a firm’s industry that are unionized by dividing the number of unionized workers by the
total number of blue-collar workers in the firm’s 3-digit SIC industry. This measure is admittedly coarse
given that 3-digit CIC and SIC industries are only roughly comparable, that it assumes than only blue-
collar workers belong to a union, and that due to data unavailability we are forced to fill in gaps in the data
for a number of years.
3.4. Firm-level unionization estimates
We obtained from Barry Hirsch firm-level unionization estimates constructed from survey data for a
small sample of observations for 1972, 1977, and 1987. The 1977 data and 1987 data were derived from
his 1987 survey of manufacturing firms and the 1972 data was collected in an independent 1972
Conference Board Survey. We refer the reader to Hirsch (1991) for details on this dataset.
13
3.5. Contract expirations
We obtain data on labor contract expiration dates from the BNA Labor Plus database maintained by
the Bureau of National Affairs. These data are compiled from 1993 onwards and are based on notices that
parties to a collective bargaining agreement, when up for renewal, are required to file with the Federal
Mediation & Conciliation Service.
3.6. Strike data
We also obtain data on strikes from the BNA Labor Plus database. This database has information on
strike beginning and ending dates as well as on the parties involved in strikes from 1990 onwards. The data
draws on published accounts in BNA publications, newspapers, government reports, and union
publications.
3.7. Industry concentration measures
We collect the Herfindahl-Hirschman Index of industry concentration from Census of Manufactures
publications, which were published as part of the 1982, 1987, 1992, 1997 and 2002 U.S. Censuses. We
note that the Census of Manufactures begins classifying industries with 6-digit NAICS codes in 1997. Prior to
this year industries were classified using 4-digit SIC codes. We assume that the 1982, 1987, 1992, 1997, and
2002 Herfindahl-Hirschman Index values are valid for the 1983-1984, 1985-1989, 1990-1994, 1995-1999,
and 2000-2005 periods. We use the Herfindahl-Hirschman Index values to create an indicator variable for
whether a firm has a high industry Herfindahl-Hirschman Index value, as defined by whether the index
value is greater than the sample median. Given that the Herfindahl-Hirschman index values for 6-digit
NAICS and 4-digit SIC industries are not comparable we create this indicator variable separately for the
1983-1994 and 1995-2005 sample periods.

14
3.8. Industry-level import penetration data
Following the international trade literature (e.g., Trefler (1996) and Bernard, Jensen, and Schott
(2006)), we construct an industry-level import penetration variable that is defined as the value of imports
divided by domestic absorption (value of shipments minus value of exports plus value of imports). This
variable is calculated at the 3-digit NAICS industry level for manufacturing industries over the 1983-2005
period. Data on the value of shipments for 3-digit NAICS manufacturing industries are obtained from the
U.S. Census Bureau. Data on imports and exports comes from two different sources. For the period 1983-
1991 we use data on the value of imports and exports which are available online from the Center for
International Data at the University of California, Davis, and described in Feenstra (1996). For the period
1992-2005 we use data on imports and exports available online from TradeStats Express, which is
maintained by the International Trade Administration of the U.S. Department of Commerce.
3.9. Industry-level data on total materials costs and labor costs
Information necessary to calculate the ratio of materials costs to labor costs in a firm’s industry is
gathered from the 1997 and 2001 Annual Survey of Manufactures publications which are published by the
U.S. Census. From these publications we collect data for 6-digit NAICS industries on total industry
materials costs and total payroll expenses. Like the Census of Manufactures publications, the Annual Survey of
Manufactures publications begin classifying industries with 6-digit NAICS codes in 1997. We assume that
the 1997 data on industry cost structures are valid for the 1995-1999 period and that those for 2001 are
valid for the 2000-2005 period.
3.10. Right-to-work legislation data
We obtain information regarding whether the state in which a firm has the majority of its operations
has right-to-work laws from the U.S. Department of Labor’s web page on state right-to-work laws. We
collect this information on an annual basis over our sample period. Right-to-work laws are statutes
currently enforced in twenty-two states, allowed under provisions of the Taft-Hartley Act, which prohibit
unions from making membership or payment of union dues or fees a condition of employment, either
15
before or after an employee is hired. To determine in which state a firm has the majority of its operations,
we use the Compustat variable ‘STATE’, which Compustat defines as the state in which the firm has most
of its operations. To decide on the state in which a firm has most of its operations, Compustat uses the
address that appears on firms’ annual reports, which can be different from the state of incorporation.
While most firms’ principal addresses may typically be in the state in which they have most of their
operations, the ‘STATE’ variable is clearly measured with noise. The noise in the data resulting from this
coding error may reduce the power of our tests based on the right-to-work law variable.
4. Empirical analysis
4.1. The relation between unionization and cash holdings
To test our hypothesis that firms facing stronger labor unions strategically choose a policy of holding
less cash, we first examine in univariate and multivariate analyses whether firms in more unionized
industries hold smaller cash reserves than do firms in less unionized industries.
4.1.1. Univariate findings
Table 2 reports summary statistics and results of univariate tests of the relation between industry
unionization and cash holdings. Cash holdings are defined as cash and short-term investments/book
assets. Panel A shows that over our sample period mean and median cash holdings are 0.205 and 0.106,
respectively. Panel B examines the univariate relation between industry unionization rates and cash
holdings. For this purpose, in each year we sort firms into quartiles according to their industry
unionization rates and report the mean and median for cash holdings in each quartile. Both the mean and
median values of cash holdings systematically decrease in each quartile from the first to the fourth
unionization quartiles. The differences in cash holdings between the bottom and top quartiles are striking
and economically significant. Mean and median cash holdings/book assets for firms with an industry
unionization rate in the first quartile are 0.314 and 0.235, respectively. In contrast, these statistics for the
fourth quartile are 0.082 and 0.035, respectively. Thus, the univariate results support the proposition that
firms in more unionized industries strategically maintain small cash reserves to gain bargaining advantages

16
over unions. However, since differences in industry unionization rates are likely to be associated with
differences in firm characteristics we next turn to our multivariate tests.
4.1.2. Multivariate evidence on the relation between industry unionization and cash holdings
Given the problems of heteroskedasticity and serial correlation, we adjust the standard errors in our
reported results. Specifically, in all the firm-level pooled cross-sectional tests the standard errors are
clustered at the firm-level. In regression models that use the Fama-MacBeth approach and in models that
use only industry-level variables we correct for serial-correlation with a lag of one. In models that use
time-series averages of firm-level variables we use White (1980) standard errors.
Table 3 provides the results of regressions of firms’ cash holdings on industry unionization rates and
control variables. Cash holdings are measured as the natural logarithm of cash and short-term investments
deflated by book assets less cash and short-term investments, as in Opler, Pinkowitz, Stulz, and
Williamson (1999). The main independent variable of interest is the unionization rate in a firm’s 3-digit
CIC industry. We control for other potential determinants of a firm’s cash holdings suggested by Opler,
Pinkowitz, Stulz, and Williamson (1999). Also, as in their paper, all right-hand-side variables that are
deflated by book assets are deflated by book assets net of cash so that the effect of cash is removed from
these variables.
To decrease the likelihood that an omitted variable that may impact both cash and unionization could
drive our results, we also control for four additional variables. Haushalter, Klasa, and Maxwell (2007) show
that firms in more concentrated industries hold greater cash reserves. The extant literature also shows that
unions in more concentrated industries are likely to have more bargaining power (e.g., Salinger (1984) and
Karier (1985)). Consequently, we control for industry concentration by including a dummy variable equal
to one if the firm’s industry Herfindahl-Hirschman index is greater than the median value for the entire
sample, and zero otherwise. Second, because unionization tends to be related with firms’ capital intensity
levels and the tangibility of a firm’s assets is a determinant of its cash holdings, we control for net
property, plant, and equipment/book assets. Third, global competition increases the need for firms to

17
carry cash for preventive purposes and also reduces union bargaining power. Thus, we include a firm’s
industry import penetration ratio as an additional control variable. Finally, Bates, Kahle, and Stulz (2007)
show that firms that have undergone an initial public offering during the last five years hold markedly
more cash than do other firms. Because industries with more firms that have recently gone public tend to
be younger industries in which unions may not have formed yet, this could result in industries that have
experienced significant recent IPO activity having both low industry unionization rates and a larger
number of firms with high cash holding levels. Consequently, we include in our regressions a dummy
variable for whether a firm had its IPO during the prior five years.
The first model in Table 3 is a pooled regression, which includes year dummies to control for time-
specific factors. The second model is a Fama-MacBeth regression. The third model uses firm-specific
time-series means for each variable. The results from all three models show that there is a negative
relation between cash holdings and industry unionization rates. This relation is not only statistically
significant, but also economically significant. We multiply the standard deviation of the industry
unionization rate variable by the coefficient on this variable from the first model. Next, taking the anti-log
of the resulting value we find that a one-standard deviation increase in unionization leads to a 32.3%
decrease in a firm’s cash holdings. For comparison we calculate the impact on cash holdings of one-
standard deviation increases in operating income/book assets and total leverage as well as the impact of
having a bond rating that is investment grade. We find that these changes in firm characteristics would
lead to decreases in cash holdings of 43.6%, 17.2%, and 42.9%, respectively. Thus, the economic impact
of unionization on cash holdings seems comparable to that of several well known determinants of these
holdings. The majority of the coefficients on the control variables are statistically significant with the
expected signs, suggesting that the effect of industry unionization rates on cash holdings is not driven by
its correlation with other firm characteristics. For instance, this relation is not due to industry unionization
rates being correlated with firm leverage, investment opportunities, capital intensity, or import penetration.
Overall, the results for the first three models in Table 3 support the prediction that firms in more
unionized industries hold smaller cash reserves to improve their bargaining position with unions.
18
In the fourth model in Table 3 we run an industry-level regression of cash holdings on unionization
that gives each industry an equal weight in our analysis. For this regression, each year we convert all firm-
level variables into 3-digit CIC industry means. Year dummies are included in this regression model. This
specification allows us to address two issues, namely that industries with a greater number of firms receive
a larger weight in the first three models of Table 3 and that industry unionization rates may be a noisy
proxy for firm-level unionization. The results for this model continue to show a negative and statistically
significant relation between cash holdings and industry unionization rates.7,8
Finally, in the fifth model in Table 3 we examine whether the negative association between industry
unionization rates and cash holdings is robust to measuring a firm’s industry unionization rate as the
fraction of its industry blue-collar work force that is unionized. We investigate this issue because
unionized workers are largely blue-collar workers, and thus in some industries a lower industry
unionization rate may be due to a lower fraction of blue collar workers and not necessarily due to less
union bargaining power. As noted in Section 3.3 our measure for the fraction of the blue-collar workers in
an industry that are unionized is coarse. Nevertheless, the results for the fifth model in Table 3 show that
there is a statistically significant negative relation between firms’ cash holdings and our estimate of the
fraction of the blue-collar work force in a firm’s industry that is unionized.
A potential concern with the Table 3 results is that because unionization is measured at the industry
level it is possible that unobserved factors that are correlated with both industry unionization rates and
firm-level cash holdings could drive the negative association between these rates and firm-level cash
holdings. As noted previously, the time-series variation of industry unionization rates is limited. However,
in the first two models in Table 4 we attempt to exploit this variation be using differenced models. In the
first model all variables are converted into one-year changes. In the second model they are converted into
7 To further ensure that the negative association between cash holdings and industry unionization rates is not driven by differences in the number of firms across different industries, we also tried controlling in the first model in Table 3 for the number of firms per year in a firm’s 3-digit CIC industry. This does not affect our results. 8 Since the equal-weighted analysis ignores the relative importance of each industry in the manufacturing sector, we reran the industry-level model using weighted-least squares and weighting each industry-year observation by the inflation-adjusted assets of the industry. The negative association between cash holdings and industry unionization rates is also robust to using this specification.

19
two-year changes. The results for both models show that there is a negative association between changes
in industry unionization rates and changes in cash holdings. Thus, even after removing the effect of
potential unobserved factors correlated with industry unionization rates and cash holdings, we still find a
negative association between firm-level cash holdings and industry unionization rates. This is further
evidence that firms facing more powerful unions adopt a policy of holding smaller cash reserves.
In the third model of Table 4 we re-estimate our benchmark model using firm-level estimates of
unionization rates based on survey data. In these tests we restrict attention to the manufacturing sector
during the years 1972, 1977, and 1987 and to the small number of firms and industries for which this
survey data was compiled. We further impose the availability of data to construct the required control
variables.9 After imposing these data restrictions we are left with 533 observations. Consistent with the
results obtained using industry-level unionization rates, we find a negative association between
unionization and cash holdings. Further, this result is economically significant. We determine that a one-
standard deviation increase in unionization at the firm-level leads to a 10.1% decrease in a firm’s cash
holdings. Also, as in Table 2 in each year we divide the sample used for the tests with firm-level
unionization data into quartiles based on firm-level unionization and compare the mean and median values
for cash holdings between the different quartiles. We find that, as one moves from the lowest to the
highest unionization quartiles, each subsequent quartile has a lower mean and median value for cash
holdings. Overall, these results suggest that the industry-level unionization rates we use in our large-sample
analyses are a reasonable proxy for union bargaining power at the firm level and reduce the concern that
omitted variables correlated with industry unionization rates could spuriously drive our results.
Finally, we note that when interpreting the Table 3 and 4 results, it is important to consider the
possibility that the relation between cash holdings and industry unionization rates could run from cash
9 Information for the Herfindahl-Hirschmann index from the Census of Manufactures first became available in 1982. In our analysis using the firm level unionization estimates the High industry Herfindahl-Hirschmann Index dummy is created using data from the 1987 U.S. Census for 1987 and from the 1982 U.S. Census for 1972 and 1977. Also, because with the available data it is difficult to reliably calculate import penetration ratios for NAICS industries during the 1970s, import penetration ratios are calculated for 4-digit SIC industries.
20
holdings to these rates. However, we note that if this were the case one would expect that unions would
be more likely to form when cash holdings are larger and there are greater potential rents for unions to
capture. This would lead to a positive relation between cash holdings and industry unionization rates.
Given that we document a negative relation between cash holdings and industry unionization rates, it
seems unlikely that reverse causality could explain our results.
4.2. The determinants of the relation between industry unionization rates and cash holdings
4.2.1. The importance of gaining a bargaining advantage
We now study how the negative relation between cash holdings and industry unionization rates
depends on the importance that firms are likely to attach to gaining a bargaining advantage over unions. If
this relation is driven by firms in more unionized industries strategically maintaining low cash balances to
improve their bargaining position, then this relation should be more pronounced when a strong bargaining
position against unions is more valuable to firms. We examine this issue in Table 5 using an empirical
model identical to that in column 1 of Table 3, but augmented to include an additional explanatory
variable and its interaction with a firm’s industry unionization rate. We consider three different factors that
affect the importance firms are likely to place on gaining a bargaining advantage relative to labor unions.
We first examine how industry concentration modifies the relation between cash holdings and
industry unionization rates. Economic theory predicts that the higher persistence of economic profits in
more concentrated industries lead to higher wage demands from workers. Furthermore, prior work shows
that unions indeed demand and capture a larger fraction of the available economic rents in more
concentrated industries (e.g., Salinger (1984) and Karier (1985)). As a result, firms in more concentrated
industries are more likely to place a higher value on having a strong bargaining position against unions
than would firms in less concentrated industries. The results for the first model in Table 5 show a
statistically significant and negative coefficient on the variable that interacts a firm’s industry unionization
rate with a dummy variable for whether the firm operates in a more concentrated industry (the Herfindahl-
Hirschman Index in the firm’s industry is above the value corresponding to the sample median). Thus, the

21
negative relation between cash holdings and industry unionization rates is more pronounced for firms in
more concentrated industries that are likely to attach a high value to improving their bargaining position
against unions.
Next, we investigate how the existence of right-to-work laws in the state in which a firm has most of
its operations affects the relation between cash holdings and industry unionization rates. Right-to-work
laws, which prohibit unions from making membership or payment of dues a condition of employment,
reduce unions’ bargaining power due to the resulting free-rider problem among union members (e.g.,
Ellwood and Fine (1987) and Holmes (1998)). The results for the second model in Table 5 show that there
is a significant positive coefficient on an interaction variable of a firm’ industry unionization rate with a
dummy variable for whether the state in which a firm has most of its operations has right-to-work laws.
This is consistent with the idea that when unions already have limited bargaining power due to the
existence of right-to-work laws, firms are less likely to attempt to improve their bargaining position with
unions by holding a small cash balance.10
It is also likely that gaining a bargaining advantage over unions to minimize labor costs is more
important for firms in industries in which labor costs represent a larger fraction of total costs. We
investigate this issue over the 1995-2005 period. To do so, we use data from 1997 and 2001 Annual Survey
of Manufactures publications to calculate the ratio of total materials costs to total payroll costs in a firm’s 6-
digit NAICS industry. In the third model in Table 5 we interact this ratio with a firm’s industry
unionization rate. The coefficient on this interaction variable is statistically significant and positive,
suggesting that when labor costs are a larger fraction of firms’ total costs the negative effect of
unionization on cash holdings is stronger.
10 As previously noted, since Compustat’s record of the state in which a firm is principally located may be sometimes inaccurate, the dummy variable for whether a firm is principally located in a state with right-to-work laws could be measured with error. This measurement error is likely to be larger for more diversified firms that have business segments located in different states. However, our evidence based on the right-to-work laws dummy variable is robust to excluding from the analysis firms in the highest diversification decile, quintile, quartile, or tercile, where diversification is measured inversely using the Hefindahl index of a firm’s sales across its different business segments.

22
To summarize, the Table 5 results show that the negative association between cash holdings and
industry unionization rates is more pronounced for firms in more concentrated industries, firms
principally located in states with no right-to-work legislation, and firms for which labor costs represent a
larger fraction of total costs. These results provide strong support to the proposition that the negative
relation between cash holdings and industry unionization rates is the result of attempts by firms facing
strong unions to gain bargaining advantages over their unionized workers.
4.2.2. The bargaining advantage provided by a small cash balance
We also examine how variables that impact the bargaining advantage provided by a small cash balance
affect the negative relation between unionization and cash holdings. This allows us to further determine if
the negative relation between cash holdings and industry unionization rates is the result of collective
bargaining issues. We anticipate that if this relation arises because firms choose the level of their cash
reserves taking into account their effect on the bargaining with unions, then this relation should be weaker
in situations where lower cash reserves are less credible evidence that firms cannot concede to unions’
demands. Table 6 explores this issue using five models that are similar to the Table 5 models except that
different interaction variables are used.
DeAngelo and DeAngelo (1991) show that dividend cuts enable firms to obtain concessions from
unions by signaling that shareholders themselves are forced to make sacrifices to alleviate the firm’s
financial difficulties. We expect that because a dividend-paying firm disburses free cash flows to
shareholders, it can make a less credible case that a low cash balance indicates that it is unable to comply
with union demands. Consistent with this view, the first model in Table 6 shows a statistically significant
positive coefficient on the interaction between a firm’s industry unionization rate and a dummy variable
for whether the firm pays dividends. Thus, the negative relation between unionization rates and cash
holdings is weaker for dividend-paying firms.
Also, a small cash balance should provide less of a bargaining advantage for firms that can easily raise
external capital to alleviate cash shortfalls, such as those with high bond ratings. To examine whether

23
easier access to external capital diminishes the bargaining advantage provided by having a small cash
balance, in the second model in Table 6 we interact a firm’s industry unionization rate with a dummy
variable for whether the firm has an investment grade bond rating. We find a positive and statistically
significant coefficient on this interaction term, suggesting that firms with higher bond ratings rely less on
small cash balances to gain bargaining advantages over unions.
It is also likely that for firms that are closer to financial distress low cash reserves provide more
credible evidence that the firm is unable to comply with union demands. To examine this issue we first
interact a firm’s industry unionization rate with the firm’s Altman-Z score. A higher value for this measure
indicates that a firm faces less bankruptcy risk. The results for the third model in Table 6 show that the
coefficient on the interaction of a firm’s industry unionization rate with its Altman-Z score is significantly
positive. This suggests that a small cash balance provides more of a bargaining advantage for firms that are
closer to financial distress.
In the fourth model in Table 6 we proxy for whether a firm is likely to be financially distressed by
examining the firm’s industry-adjusted profitability, defined as operating income/book assets for the firm
minus the median value for this ratio in the firm’s 3-digit CIC industry. We find a significant positive
coefficient on the interaction of a firm’s industry-adjusted profitability with its industry unionization rate.
Given that firms with higher industry-adjusted profitability are less likely to be financially distressed this
finding indicates that the bargaining advantage provided by a small cash balance is lower for firms that are
further away from financial distress.
Finally, in the fifth model in Table 6 we use a firm’s leverage ratio as the proxy for whether the firm is
likely to be financially distressed. The coefficient on the interaction of a firm’s industry unionization rate
with it leverage ratio is significantly negative. This further indicates that firms that are more likely to be
financially distressed gain more of a bargaining advantage over unions by holding low cash reserves. This
result also suggests that low cash holdings and high debt levels are complementary mechanisms that allow
firms to gain bargaining advantages over unions. That is, it may be possible for firms to gain important
bargaining advantages over unions if they both reduce their cash holdings which provide a buffer against

24
future negative cash flow shocks and also issue debt to limit the firm’s future excess cash flow. To
determine the economic importance of debt on the relationship between unionization and cash holdings,
we examine how a one-standard deviation increase in debt impacts the effect of changes in unionization
on cash holdings. We find that as a result of such an increase in debt, a one-standard deviation increase in
unionization would lead to a 12.8% greater decrease in a firm’s cash holdings.
Overall, the Table 6 results show that the negative relation between unionization rates and cash
holdings is less (more) pronounced in situations where lower cash holdings are less (more) credible
evidence that the firm cannot concede to union demands. This additional evidence reinforces the idea that
the negative relation between cash holdings and industry unionization rates is driven by firms’ strategic
decisions in the context of their bargaining with unions.
4.2.3. Do unionized firms manage their cash holdings downward prior to negotiations?
Since DeAngelo and DeAngelo (1991) find that firms manage their earnings downward prior to labor
negotiations, we investigated whether unionized firms attempt to obtain bargaining advantages by
lowering their cash holdings prior to labor negotiations. For this purpose, we examined changes in firms’
cash holdings in the years surrounding collective bargaining negotiations that involved at least 1000
workers and were not preceded by other major negotiations during the previous two years.
Though not tabulated, for a sample of 96 contract-expiration events in the manufacturing sector from
1993-2005, we find that median annual changes in cash holdings/book assets are not significantly different
from zero in either of the two years preceding labor contract expirations. Since this result could be
contaminated by contemporaneous industry factors, we also examined median changes in industry-
adjusted cash holdings, where industry-adjusted cash holdings are defined as a firm’s cash holdings minus
the median cash holdings of firms in the same four-digit SIC industry. We find that in the year prior to
labor contract expirations unionized firms decrease their industry-adjusted cash holdings by about four-
25
tenths of a cent per dollar of assets.11,12 Although consistent with our principal hypothesis that unionized
firms manage their cash holdings downward to gain bargaining advantages over labor, this result is only
statistically significant at the 10 percent level. Taken together with the other results reported in Sections
4.1 and 4.2, this evidence suggests unionized firms obtain bargaining advantages over labor primarily by
holding smaller cash reserves at all times, rather than by managing cash levels downward prior to
negotiations.
4.3. Evidence from strikes
We also examine if increases in cash holdings lead to a greater likelihood that a union decides to
strike. If higher cash holdings convey to unions that a firm is more able to raise workers’ salaries and this
reduces the firm’s bargaining power, then we expect that increases in cash reserves will raise the
probability of a strike. To construct our strike sample, we start with the data from the BNA Labor Plus
database and require: (i) Firms to be manufacturing firms included in the Compustat database; (ii) Strikes
that involve at least 1000 workers; (iii) That we can calculate annual changes in cash holdings for years -2
to 0 relative to the fiscal year when a strike takes place. Our final sample of strikes has 59 observations
over the 1990-2006 period.
Panel A in Table 7 reports median annual changes in cash holdings, defined as cash and short-term
investments/book assets for years -2 to 0 relative to the fiscal year when a firm experiences a strike. Also,
this panel provides evidence on median changes in industry-adjusted cash holdings, where industry-
adjusted cash holdings are defined as a firm’s cash holdings minus the median value of cash holdings for
the other firms in the same 4-digit SIC code industry that do not contemporaneously experience a strike.
11 If firms manage their cash holdings downward prior to labor negotiations then it is possible that in the fiscal year subsequent to the year when a labor contract expires cash holdings significantly increase. We examined this issue but did not find that raw or industry-adjusted cash holdings significantly increase during this year. 12 The evidence in Bronars and Deere (1991) suggests that firms can use higher debt to improve their bargaining position against unions. We thus examined whether firms increase their raw or industry-adjusted debt levels prior to labor negotiations. However, we did not find any evidence that this is the case. This suggests that although firms can use both permanently higher debt levels and lower cash balances to improve their bargaining position, the strategic use of cash is potentially different from that of debt in that firms can more easily manage cash holdings prior to a negotiation.
26
We find that during the fiscal year prior to the year when a firm’s union goes on strike raw cash
holdings significantly increase by approximately three-tenths of a cent per dollar of assets. Also, during
this year cash holdings significantly increase relative to industry cash holdings by four-tenths of a cent per
dollar of assets. These results are consistent with increases in cash holdings resulting in a higher probability
that a union decides to strike, which suggests that increases in cash holdings weaken firms’ bargaining
positions relative to unions. We also document a small (one-tenth of a cent per dollar of assets), but
significant increase in raw cash holdings at the end of the fiscal year when a strike begins. However, it is
difficult to make inferences from this finding as a strike may lead to subsequent changes to a firm’s cash
holdings.13
Panel B in Table 7 reports evidence from two probit models that predict the likelihood that a firm
experiences a strike. In this analysis we match our sample firms that experience strikes with Compustat
firms that share the same primary 4-digit SIC code as a sample firm but do not experience a strike during
the same year. In the probit models the dependent variable takes a value of one if a firm experiences a
strike and takes a value of zero otherwise. The main independent variable of interest is the change in a
firm’s cash holdings during the previous fiscal year. We control for whether a firm is principally located in
a state with right-to-work laws, since if this is the case the union is likely to be weaker and less likely to go
on strike. We also control for other changes in the financial strength of the firm during the pre-strike year.
These variables come from Tables 3-6 and are total leverage, operating income/book assets, net-working
capital/book assets, whether a firm has a bond rating that is investment grade, whether a firm pays
dividends, and the firm’s Altman-Z score. Finally, we control for firm size, and for the changes during the
pre-strike year in market-to-book assets, and industry cash flow risk.
The results for the first model show that after controlling for other effects there is still a significant
positive association between the prior year change in cash holdings and the likelihood that a firm
subsequently experiences a strike. A number of the control variables are also significantly associated with
13 For instance, costs resulting from the strike might cause cash holding levels to decrease. Alternatively, as a precautionary measure a firm could take actions to try and increase its cash reserves subsequent to a work stoppage.

27
the likelihood of a strike. Notably, the prior year change in operating income/book assets is positively
associated with the likelihood of a strike. This is supportive of the DeAngelo and DeAngelo (1991)
evidence that increases (decreases) in a firm’s profitability may weaken (improve) a firm’s bargaining
position relative to a union. Moreover, we find that if a firm’s bond rating improves to investment grade
during the prior year this increases the likelihood of a strike. This evidence further suggests that firms that
appear to be financially stronger have weaker bargaining positions vis-à-vis unions. Finally, in the second
model we control for the level of market-to-book assets and cash flow risk rather than the changes in
these variables. This does not affect the results documented in the first model.14
4.4. The impact of unionization on the contribution of cash holdings to firm value
Our results thus far suggest that large cash reserves are costly for firms in more unionized industries
because they weaken the firm’s bargaining position and permit unionized workers to capture a larger
fraction of the firm’s profits. It follows that the contribution of cash holdings to firm value should be
smaller in more unionized industries than in less unionized industries. We estimate how a change in cash
holdings leads to a change in the market value of a firm using the approach developed by Faulkender and
Wang (2006). For this purpose, we use a sample of 26,073 firm-year observations during the 1983-2005
period for which we are able to construct the variables required for the analysis.
Table 8 provides the results of our analysis. Other than the unionization related variables the
dependent and independent variables are calculated exactly as in Faulkender and Wang (2006). The
dependent variable in both of the Table 8 models is a firm’s current fiscal year excess stock return, defined
as the firm’s annual stock return minus the firm’s matched Fama and French 5 × 5 portfolio return. The
independent variables in the first model in Table 8 are the change in current year cash holdings defined as
cash and short term investments, the firm’s industry unionization rate, the interaction of the firm’s
industry unionization rate with the change in current year cash holdings, the change in current year
14 It could also be expected that because higher cash holdings weakens firms’ bargaining positions with unions, higher cash holdings prior to a strike might lead to a longer strike. We examined this issue, but did not find that the change in cash holdings during the pre-strike year or the level of pre-strike year cash holdings are associated with the length of a strike.

28
earnings defined as earnings before extraordinary items plus interest, deferred tax credits, and investment
tax credits, the change in current year net assets defined as total book assets minus cash holdings, the
change in current year research and development expenses, the change in current year interest, the change
in current year common dividends paid, prior year cash holdings, current year market leverage, current
year net financing defined as total equity issuance minus repurchases plus debt issuance minus debt
redemption, the interaction of prior year cash holdings with the current year change in cash holdings, and
the interaction of current year market leverage with the current year change in cash holdings. Except for
market leverage and a firm’s industry unionization rate, all the independent variables are scaled by the
lagged market value of equity.
The results for the first model in Table 8 show that the coefficient on the change in current year cash
holdings is significant and positive, which indicates that the marginal value of an extra dollar of cash is
positive. Interestingly, we find that the coefficient on the interaction of a firm’s industry unionization rate
with the change in current year cash holdings is significantly negative. This indicates that the marginal
value of an extra dollar of cash is decreasing in a firm’s industry unionization rate and suggests that cash
holdings are less valuable in more unionized industries. Presumably, this occurs because in such industries
larger cash holdings make it more difficult for firms to gain concessions from unions. Consequently, in
these industries higher cash holdings lead to labor capturing a greater portion of firms’ profits and to a
reduction in shareholder value. The second model in Table 8, in which a firm’s industry unionization rate
is replaced with a dummy variable for whether in a given year the firm’s industry unionization rate is
greater than the sample median, provides further support for this proposition. We find a significant
negative coefficient on the interaction of the dummy variable for whether a firm has a high industry
unionization rate with the change in current year cash holdings.
We calculate the marginal value of a dollar of cash for the average firm in our sample using regression
coefficients from the first model of Table 8 and mean values of several independent variables. Specifically,
we use the coefficients on the interactions of prior year cash holdings with the change in current year cash
holdings, with current year market leverage, and with a firm’s industry unionization rate, as well as the

29
mean values of cash holdings as a percentage of market value of equity, market leverage, and industry
unionization of 16.9%, 22.6%, and 16.2%. We find that this marginal value is $0.87 (=1.332 + (-0.263 *
0.169) + (-0.666 * 0.226) + (-1.656 * 0.162)). This value is close to the marginal value of a dollar of cash
for the average firm in the Faulkender and Wang (2006) sample of $0.94.
Using a similar approach and focusing on the coefficients in the second model of Table 8, we
estimate the marginal value of a dollar of cash to be $1.15 for firm-years in which a firm’s industry
unionization rate is over the annual sample median and $0.59 for firm-years in which a firm’s industry
unionization rate is below the annual sample median. Thus, the negative effect of unionization on the
market value of a dollar of cash holdings is both statistically and economically significant.15
4.5. Robustness tests
We perform several robustness tests. First, a potential concern with our results is that they may be
affected by the increasing trend in cash holdings and decreasing trend in unionization rates during our
sample period.16 To alleviate this concern we run year-by-year cross-sectional regressions using the same
specification as in the first model in Table 3. We find a significant negative association between cash
holdings and industry unionization rates during each of the twenty-three years from 1983-2005. This
suggests that our results are not due to the aforementioned trends in unionization rates and cash holdings.
Moreover, it indicates that they are not driven by a particular subset of years or by industry-specific events,
such as major restructurings of particular industries.
Second, the negative relation between cash holdings and unionization could be driven by the
inclusion in our sample of firms from high-technology industries. This is because firms in such industries
simultaneously tend to have low unionization rates and to hold high cash balances as a result of their large
growth opportunity sets. To address this concern, we calculate mean values for R&D expenses/sales in
15 To examine the market value of cash holdings, Dittmar and Mahrt-Smith (2007) also utilize a methodology that uses market-to-book ratios as a proxy for firm value. We follow this approach to determine the value of cash holdings and find results consistent with those in Table 9 that the market value of cash holdings is decreasing in industry unionization. 16 The decreasing trend in unionization rates is due to both a decline in unionization rates within industries and due to a shift in national employment shares from industries with high unionization rates to those with low unionization rates (see, for example, Farber and Western (2001)).
30
each 3-digit CIC industry and exclude from our analysis firms from industries in the top decile, quintile,
quartile, or tercile in terms of the R&D intensity of their industry. This does not affect our results.
Finally, since Dittmar and Mahrt-Smith (2007) show that the value of cash holdings is related to
corporate governance, we examined whether our evidence on the effect of unionization on the value of
cash holdings is robust to controlling for the Gompers, Ishii, and Metrick (2003) index of corporate
governance. We found that controlling for corporate governance does not affect our results. In addition,
Faulkender and Wang (2006) show that the value of cash holdings is higher for financially constrained
firms than it is for unconstrained firms. Using their approach to classify constrained and unconstrained
firms, we found that cash holdings are less valuable for firms in highly unionized industries for both
constrained and unconstrained firms. Overall, these results alleviate concerns that our findings that the
value of cash holdings is lower in more unionized industries is somehow driven by unionization being
correlated with corporate governance or financial constraints.
4.6. Evidence from two case histories
To provide further evidence on whether unionized firms hold less cash to gain bargaining advantages,
we conduct intra-industry analyses in which we examine two specific case histories. First, we compare the
cash holdings of Nucor, a non-unionized steel firm, with those of its unionized competitors. Second, we
examine the cash holdings of FedEx before and after its pilots voted to unionize.
The U.S. steel industry (SIC = 3312: Steel Works & Blast Furnaces) over the 2002-2006 period
provides a setting to examine differences in cash holdings based on union representation. The industry
has one major non-unionized firm, Nucor, the second largest U.S. based steel firm over this period. We
compare Nucor’s cash holdings with those of its major unionized industry rivals (defined as U.S. based
steel manufacturers with annual sales of at least $1 billion) and those of its closest rival, U.S. Steel, which is
the largest U.S. based steel manufacturer. During the early 2000s, the steel industry was going through a
31
significant restructuring as numerous firms filed for bankruptcy.17 However, beginning in 2004 there was
a significant increase in the profitability of the industry. Median industry operating profit was at its lowest
in 2003, 2.7%, but this rose to 20.2% by 2006. The marked increase in the profitability of the industry is
related to the introduction of a tariff in 2002, industry-wide restructurings, and a rising demand and price
of manufactured steel.18 We study both the steel industry’s unprofitable period (2002-2003) and profitable
period (2004-2006) to help ensure that differences in cash holdings between Nucor and its unionized rivals
are not a function of the industry’s economic health.
Panel A of Table 9 in the Appendix shows that Nucor’s cash holdings scaled by book assets each year
from 2002-2006 are larger than both the median cash holdings of its rivals and those of its closest
competitor, U.S. Steel. Though not tabulated, we also note that Nucor had larger cash holdings than any
of its industry rivals during each year from 2002-2006. Panel A also documents a clear upward trend in the
cash holdings of Nucor, U.S. Steel, and its other competitors over the 2002-2006 time period. However,
the upward trend is more pronounced for the non-unionized Nucor as the differences in cash holdings
between Nucor and its competitors increased from 2002-2006. This mitigates concerns that the
differences in cash holdings in 2002 and 2003 between Nucor and its unionized rivals are merely an
artifact of the financial distress experienced by the steel industry during these years. Because the steel
industry is included in the sample of manufacturing firms examined in this study we also examined for
Nucor and its rivals the residuals from model 1 in Table 3 after excluding the industry unionization rate
variable. The residuals represent cash holdings unaccounted for by other firm characteristics (size, growth
options, profitability, etc). Although we do not tabulate these results, we find that in each year from 2002-
2006 Nucor had a higher residual than each of its major unionized competitors. This further suggests that
Nucor holds more cash than its competitors and this difference is neither due to economic conditions nor
17 For example, Bethlehem Steel and LTV the second and third largest domestic producer based on sales in 2000 filed for bankruptcy in 2001 and 2000, respectively. 18 In March of 2002, tariffs of 8 to 30% were placed on imported steel. These tariffs were originally scheduled to expire in 2005, but were revoked in December of 2003.

32
firm specific factors, other than unionization. This is additional evidence supportive of the hypothesis that
due to bargaining considerations more unionized firms hold less cash.
A second empirical prediction that follows from the study’s main hypothesis is that if a non-
unionized firm becomes unionized, we should observe a subsequent decrease in its cash holdings. To
provide evidence on this issue, we study the Air Express industry and examine FedEx’s cash holdings
around the time it first became unionized. In 1993, pilots at FedEx voted to be represented by the Air
Line Pilots Association.19 Given the unilateral ability of FedEx’s pilots to shut down the firm’s operations,
unionization provided the pilots with substantial bargaining power vis-à-vis FedEx.
We study the cash holdings of FedEx and as a benchmark the cash holdings of its only significant
publicly traded competitor in the U.S. at that time, Airborne Express, which was unionized. We examine
the 1992-1996 period to study cash holdings before unionization (1992-1993) and after unionization
(1994-1996). FedEx and Airborne are similar firms in terms of product mix. While FedEx is larger, this
should work against finding that FedEx holds more cash given that larger firms typically hold less cash.
Panel B in Table 9 shows that consistent with the evidence for Nucor, before unionization FedEx had
larger cash holdings scaled by book assets than did unionized Airborne. However, after the unionization
vote, we see a decrease in FedEx’s cash holdings. The drop is very large from 1994 to 1995 (0.056 to
0.014). Over this same period, Airborne’s cash holdings increase. In fact by 1995, Airborne has larger
cash reserves than does FedEx. These differences are not driven by differences in operating income
(average operating income for FedEx and Airborne from 1992-1996 was 18.1% and 18.3% and from
1994-1996 was 19.5% and 19.1%). Overall, the finding that while it was non-unionized FedEx held more
cash than its unionized rival and that after unionization it markedly decreased its cash holdings are further
evidence that to gain bargaining advantages over labor more unionized firms hold less cash.
19 In 1996, the FedEx pilots voted to be represented by their own independent FedEx Pilots Association rather than the Air Line Pilots Association. See “Fedex Pilots Union Announces A Tentative Pact With Company,” New York Times, December 18, 1998.
33
5. Conclusion
We provide evidence that firms’ cash holding policies are affected by strategic considerations that
arise in the bargaining between the firm and its unionized workers. Specifically, we find a negative
association between unionization and corporate cash holdings. This result suggests that firms facing
stronger unions strategically choose to hold less liquid assets to improve their bargaining position against
organized labor. By holding smaller cash reserves, a firm is able to make a more credible case that the risk
of liquidity shortages threatens its competitive viability and that as a result it is unable to concede to union
demands.
Supporting the notion that the negative relation between cash holdings and unionization occurs in the
context of collective bargaining, we show that this relation is more pronounced for firms that are likely to
place greater importance on gaining a bargaining advantage over unions. Specifically, we find that the
negative effect of unionization on cash holdings is more pronounced for firms in more concentrated
industries, firms principally located in states with no right-to-work legislation, and firms in industries in
which labor costs represent a larger fraction of total costs. In addition, we document that this relation is
less pronounced for those firms in which a small cash balance provides less credible evidence of the firm’s
inability to concede to union demands, such as, dividend-paying firms and firms with easier access to
external capital. Also, the negative relation between cash and unionization is more pronounced for firms
that are closer to financial distress.
We also find that increases in cash holdings raise the likelihood of a subsequent strike. This suggests
that larger cash reserves weaken a firm’s bargaining position because these reserves convey to unions that
the firm is able to meet their demands. Finally, we document that the value of cash holdings is lower for
firms that operate in more unionized industries. Overall, our results imply that unionized firms trade-off
the benefits of corporate cash reserves, such as the ability to fully invest in growth opportunities, with the
costs resulting from a weakened ability to obtain union concessions.
References
Altman, E.I., 1968. Financial ratios, discriminant analysis and the prediction of corporate bankruptcy. Journal of Finance 23, 589-609.
Bates, T.W., K.M. Kahle, and R.M. Stulz, 2007. Why do U.S. firms hold so much more cash than they
used to? Working Paper: University of Arizona. Bernard, A.B., J.B. Jensen, and P.K. Schott, 2006. Survival of the best fit: Exposure to low-wage
countries and the (uneven) growth of U.S. manufacturing plants. Journal of International Economics 68, 219-237.
Bronars, S.G., and D.R. Deere, 1991. The threat of unionization, the use of debt, and the preservation of
shareholder wealth. Quarterly Journal of Economics 106, 231-254. Clark, A., 1990. Efficient bargains and the McDonald-Solow conjecture. Journal of Labor Economics 8,
502-528. Connolly, R.A., B.T. Hirsch, and M. Hirschey, 1986. Union rent seeking, intangible capital, and market
value of the firm. Review of Economics and Statistics 68, 567-577. DeAngelo, H., and L. DeAngelo, 1991. Union negotiations and corporate policy: A study of labor
concessions in the domestic steel industry during the 1980s. Journal of Financial Economics 30, 3-43.
Dittmar, A., and J. Mahrt-Smith, 2007. Corporate governance and the value of cash holdings. Journal of
Financial Economics 83, 599-634. D’Souza, J., J. Jacob, and K. Ramesh, 2001. The use of accounting flexibility to reduce labor
renegotiation costs and manage earnings. Journal of Accounting and Economics 30, 187-208. Earle, J.S., and J. Pencavel, 1990. Hours of work and trade unionism. Journal of Labor Economics 8,
150-174. Ellwood, D.T., and G. Fine, 1987. The impact of right-to-work laws on union organizing. Journal of
Political Economy 95, 250-273. Farber, H.S., and B. Western, 2001. Accounting for the decline of unions in the private sector, 1973-
1998. Journal of Labor Research 22, 459-485. Faulkender, M., and R. Wang, 2006. Corporate financial policy and the value of cash. Journal of Finance
61, 1957-1990. Fee, C.E., and S. Thomas, 2004. Sources of gains in horizontal mergers: Evidence from customer,
supplier, and rival firms. Journal of Financial Economics 74, 423-460. Feenstra, R.C., 1996, NBER trade database: U.S. imports, 1972-1994: Data and Concordances. NBER
Working Paper no. 5515. Fundenberg, D., and J. Tirole, 1986. A theory of exit in duopoly. Econometrica 54, 943-960. Gompers, P., J. Ishii, and A. Metrick, 2003. Corporate governance and equity prices. Quarterly Journal of
Economics 118, 107-155.

Hanka, G., 1998. Debt and the terms of employment. Journal of Financial Economics 48, 245-282. Harford, J., 1999. Corporate cash reserves and acquisitions. Journal of Finance 54, 1969-1997. Harford, J., S.A. Mansi, and W.F. Maxwell, 2008. Corporate governance and firm cash holdings in the
US. Journal of Financial Economics 87, 535-555. Harford, J., W.H. Mikkelson, and M.M. Partch, 2003. The effect of cash reserves on corporate
investment and performance in industry downturns. Working paper: University of Washington. Haushalter, G.D., S. Klasa, and W.F. Maxwell, 2007. The influence of product market dynamics on a
firm’s cash holdings and hedging behavior. Journal of Financial Economics 84, 797-825. Hirsch, B.T., 1991. Labor Unions and the economic performance of firms. Kalamazoo, Michigan: W. E.
Upjohn Institute for Employment Research. Hirsch, B.T., and D.A. Macpherson, 2003. Union membership and coverage database from the current
population survey: Note. Industrial and Labor Relations Review 56, 349-354. Holmes, T.J., 1998. The effect of state policies on the location of manufacturing: Evidence from state
borders. Journal of Political Economy 106, 667-705. Jensen, M.C., 1986. Agency costs of free cash flow, corporate finance, and takeovers. American
Economic Review 76, 323-329. Johnson, G.E., 1990. Work rules, featherbedding, and Pareto-optimal union-management bargaining.
Journal of Labor Economics 8, 237-259. Kale, J.R., and H. Shahrur, 2007. Corporate capital structure and the characteristics of suppliers and
customers. Journal of Financial Economics 83, 321-365. Karier, T., 1985. Unions and monopoly profits. Review of Economics and Statistics 67, 34-42. Kim, C., D. Mauer, and A. Sherman, 1998. The determinants of corporate liquidity: Theory and
evidence. Journal of Financial and Quantitative Analysis 33, 335-359. Leontief, W., 1946. The pure theory of the guaranteed annual wage contract. Journal of Political
Economy 54, 76-79 Matsa, D.A., 2006. Capital structure as a strategic variable: Evidence from collective bargaining. Working
Paper: Northwestern University. McDonald, I.M., and R.M. Solow, 1981. Wage bargaining and employment. American Economic Review
71, 896-908. Mikkelson, W., and M. Partch, 2003. Do persistent large cash reserves hinder performance? Journal of
Financial and Quantitative Analysis 38, 275-294. Nash, J., 1950. The bargaining problem. Econometrica 55, 923-934. Newey, W., and K. West, 1987. A simple positive-definite heteroscedasticity and autocorrelation
consistent covariance matrix. Econometrica 55, 703-708.
Opler, T., L. Pinkowitz, R.M. Stulz, and R. Williamson, 1999. The determinants and implications of
corporate cash holdings. Journal of Financial Economics 52, 3-46. Pinkowitz, L., R. Stulz, and R. Williamson, 2006. Does the contribution of corporate cash holdings and
dividends to firm value depend on governance? A cross-country analysis. Journal of Finance 61, 2725-2751.
Robinson, J., 1933. The economics of imperfect competition. Macmillan and Co., London. Rosen, S., 1969. Trade union power, threat effects and the extent of organization. The Review of
Economic Studies 36, 185-196. Rubinstein, A., 1982. Perfect equilibrium in a bargaining model. Econometrica 50, 97-109. Salinger, M.A., 1984. Tobin’s Q, unionization and the concentration-profits relationship. Rand Journal of
Economics 15, 159-170. Shahrur, H., 2005. Industry structure and horizontal takeovers: An analysis of wealth effects on rivals,
suppliers, and corporate customers. Journal of Financial Economics 76, 61-98. Snyder, C.M., 1996. A dynamic theory of countervailing power. Rand Journal of Economics 27, 747-769. Trefler, D. 1996. Trade liberalization and the theory of endogenous protection: An Econometric study
of U.S. import policy. Journal of Political Economy 101, 138-160. White, H., 1980. Nonlinear regression on cross-section data. Econometrica 48, 721-746.
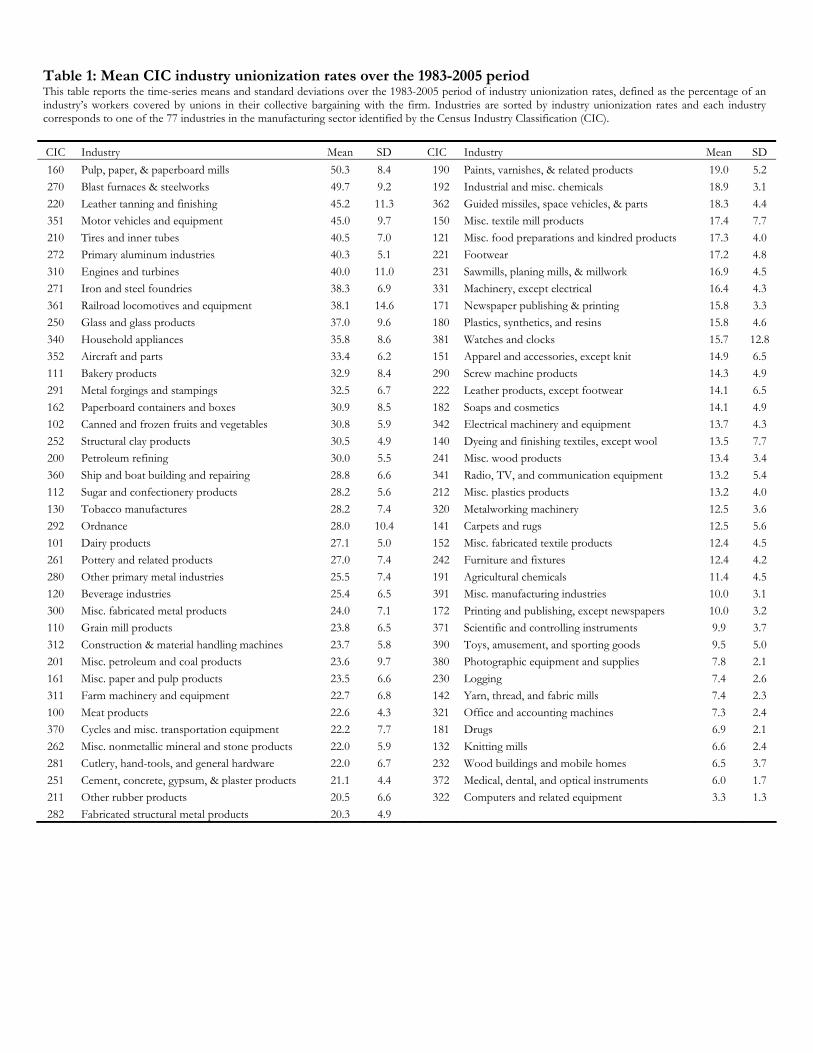
Table 1: Mean CIC industry unionization rates over the 1983-2005 period This table reports the time-series means and standard deviations over the 1983-2005 period of industry unionization rates, defined as the percentage of an industry’s workers covered by unions in their collective bargaining with the firm. Industries are sorted by industry unionization rates and each industry corresponds to one of the 77 industries in the manufacturing sector identified by the Census Industry Classification (CIC).
CIC Industry Mean SD CIC Industry Mean SD 160 Pulp, paper, & paperboard mills 50.3 8.4 190 Paints, varnishes, & related products 19.0 5.2 270 Blast furnaces & steelworks 49.7 9.2 192 Industrial and misc. chemicals 18.9 3.1 220 Leather tanning and finishing 45.2 11.3 362 Guided missiles, space vehicles, & parts 18.3 4.4 351 Motor vehicles and equipment 45.0 9.7 150 Misc. textile mill products 17.4 7.7 210 Tires and inner tubes 40.5 7.0 121 Misc. food preparations and kindred products 17.3 4.0 272 Primary aluminum industries 40.3 5.1 221 Footwear 17.2 4.8 310 Engines and turbines 40.0 11.0 231 Sawmills, planing mills, & millwork 16.9 4.5 271 Iron and steel foundries 38.3 6.9 331 Machinery, except electrical 16.4 4.3 361 Railroad locomotives and equipment 38.1 14.6 171 Newspaper publishing & printing 15.8 3.3 250 Glass and glass products 37.0 9.6 180 Plastics, synthetics, and resins 15.8 4.6 340 Household appliances 35.8 8.6 381 Watches and clocks 15.7 12.8352 Aircraft and parts 33.4 6.2 151 Apparel and accessories, except knit 14.9 6.5 111 Bakery products 32.9 8.4 290 Screw machine products 14.3 4.9 291 Metal forgings and stampings 32.5 6.7 222 Leather products, except footwear 14.1 6.5 162 Paperboard containers and boxes 30.9 8.5 182 Soaps and cosmetics 14.1 4.9 102 Canned and frozen fruits and vegetables 30.8 5.9 342 Electrical machinery and equipment 13.7 4.3 252 Structural clay products 30.5 4.9 140 Dyeing and finishing textiles, except wool 13.5 7.7 200 Petroleum refining 30.0 5.5 241 Misc. wood products 13.4 3.4 360 Ship and boat building and repairing 28.8 6.6 341 Radio, TV, and communication equipment 13.2 5.4 112 Sugar and confectionery products 28.2 5.6 212 Misc. plastics products 13.2 4.0 130 Tobacco manufactures 28.2 7.4 320 Metalworking machinery 12.5 3.6 292 Ordnance 28.0 10.4 141 Carpets and rugs 12.5 5.6 101 Dairy products 27.1 5.0 152 Misc. fabricated textile products 12.4 4.5 261 Pottery and related products 27.0 7.4 242 Furniture and fixtures 12.4 4.2 280 Other primary metal industries 25.5 7.4 191 Agricultural chemicals 11.4 4.5 120 Beverage industries 25.4 6.5 391 Misc. manufacturing industries 10.0 3.1 300 Misc. fabricated metal products 24.0 7.1 172 Printing and publishing, except newspapers 10.0 3.2 110 Grain mill products 23.8 6.5 371 Scientific and controlling instruments 9.9 3.7 312 Construction & material handling machines 23.7 5.8 390 Toys, amusement, and sporting goods 9.5 5.0 201 Misc. petroleum and coal products 23.6 9.7 380 Photographic equipment and supplies 7.8 2.1 161 Misc. paper and pulp products 23.5 6.6 230 Logging 7.4 2.6 311 Farm machinery and equipment 22.7 6.8 142 Yarn, thread, and fabric mills 7.4 2.3 100 Meat products 22.6 4.3 321 Office and accounting machines 7.3 2.4 370 Cycles and misc. transportation equipment 22.2 7.7 181 Drugs 6.9 2.1 262 Misc. nonmetallic mineral and stone products 22.0 5.9 132 Knitting mills 6.6 2.4 281 Cutlery, hand-tools, and general hardware 22.0 6.7 232 Wood buildings and mobile homes 6.5 3.7 251 Cement, concrete, gypsum, & plaster products 21.1 4.4 372 Medical, dental, and optical instruments 6.0 1.7 211 Other rubber products 20.5 6.6 322 Computers and related equipment 3.3 1.3 282 Fabricated structural metal products 20.3 4.9

Table 2: Descriptive statistics of cash holdings and univariate tests The sample consists of 34,042 firm-year observations during the 1983-2005 period corresponding to all manufacturing firms in the Compustat database with non-missing data for unionization and the main control variables used in the Table 3-5 models. Industry unionization rates are the percentage of an industry’s workers that are represented by labor unions in the collective bargaining with the firm, where each industry corresponds to a 3-digit Census Industry Classification (CIC) industry. Our data span 77 different CIC industries. Cash holdings are defined as cash and short-term investments divided by book assets. Panel A reports summary statistics for cash holdings. In Panel B during each year we sort firms into quartiles according to their industry’s unionization rates, and then compute the mean and median values of cash holdings for each quartile. The last column of the panel reports the p-value for the significance of the difference in the means and medians for cash holdings between quartiles 1 and 4. The p-values correspond to a two-tailed test for the difference in means and to a two-tailed Wilcoxon rank-sum test for the difference in medians, respectively. Panel A: Summary statistics for cash holdings
Mean Stdev Pctile 25 Median Pctile 75
0.205 0.234 0.026 0.106 0.305
Panel B: Cash holdings for industry unionization quartiles.
Unionization Quartiles Q1 Q2 Q3 Q4 Q4 – Q1 p-value Mean 0.314 0.201 0.182 0.082 -0.232 0.000 Median 0.235 0.119 0.101 0.035 -0.200 0.000

Table 3: The effect of unionization on cash holdings The table reports OLS regressions of cash holdings on industry unionization rates and control variables. The sample consists of 34,042 firm-year observations in the manufacturing sector during the 1983-2005 period. The first model is a pooled OLS regression model. The second model is a Fama-MacBeth model. The third model uses firm-level time-series means of each variable. The fourth model uses annual mean values of variables for 3-digit CIC industries. The fifth model is a pooled model in which unionization is estimated as the fraction of the blue collar workers in an industry that are unionized. The dependent variable is the natural logarithm of the sum of cash and short term investments divided by book assets minus cash and short-term investments. Industry unionization rates in the first four models are for 3-digit CIC industries and are the fraction of total workers in an industry that are represented by unions in the collective bargaining with the firm. High industry Herfindahl-Hirschman Index dummy equals one if the value for this index is greater than its sample median and equals zero otherwise. Real market value of assets is in 2005 dollars. Coefficient of variation of median industry operating income/book value of assets is calculated as the absolute value of the coefficient of variation of median industry operating income/book value of assets during the five years prior to a particular firm-year and is then scaled by 1000. A firm’s 4-digit SIC code is used to calculate this statistic if there are at least five firms in the firm’s 4-digit SIC code for all five of the years. If this criterion is not met the firm’s 3-digit SIC code is used. If this criterion is not met when using a firm’s 3-digit SIC code the 2-digit SIC code is used. Import penetration is the penetration of imports in a firm’s industry. Capital expenditures, debt, operating income, net working capital, and net property, plant, and equipment are scaled by book assets net of cash and each of these variables are winsorized at the 1 percent level. Year dummies are included in the first, fourth, and fifth, models. Model 1 2 3 4 5 Pooled
OLS Fama-
MacBeth Firm Time-
Series Means Industry
Level Blue-Collar
Unionization Intercept
-2.470 (0.000)
-2.291 (0.000)
-2.425 (0.000)
-1.085 (0.002)
-2.583 (0.000)
Industry unionization rate
-3.563 (0.000)
-3.668 (0.000)
-3.500 (0.000)
-0.552 (0.038)
-1.388 (0.000)
High industry Herfindahl-Hirschman Index dummy
0.208 (0.000)
0.196 (0.002)
0.205 (0.000)
-0.121 (0.162)
0.212 (0.000)
Natural logarithm of real market value of assets 0.077 (0.000)
0.047 (0.000)
0.127 (0.000)
-0.020 (0.666)
0.074 (0.000)
Market-to-book assets 0.047 (0.001)
0.071 (0.000)
0.005 (0.773)
0.115 (0.002)
0.051 (0.001)
R&D/sales 0.000 (0.715)
0.030 (0.132)
0.000 (0.920)
0.049 (0.004)
0.000 (0.654)
Capital expenditures/book assets 5.583 (0.000)
5.235 (0.000)
8.079 (0.000)
6.773 (0.000)
5.972 (0.000)
Total leverage -0.347 (0.000)
-0.452 (0.000)
-0.652 (0.000)
-1.413 (0.000)
-0.392 (0.000)
Bond rating is investment grade dummy -0.560 (0.000)
-0.396 (0.000)
-0.849 (0.000)
-0.593 (0.013)
-0.551 (0.000)
Dividend paying dummy -0.280 (0.000)
-0.232 (0.000)
-0.221 (0.004)
0.215 (0.144)
-0.345 (0.000)
Operating income/book assets -0.630 (0.000)
-0.522 (0.000)
-0.780 (0.000)
-0.766 (0.000)
-0.656 (0.000)
Net working capital/book assets
-0.499 (0.000)
-0.463 (0.001)
-0.723 (0.000)
-1.893 (0.000)
-0.561 (0.000)
Coefficient of variation of median industry operating income/book assets
0.005 (0.719)
0.527 (0.003)
0.052 (0.414)
0.253 (0.028)
0.009 (0.552)
Net property, plant, and equipment/book assets
-0.982 (0.000)
-0.926 (0.000)
-1.808 (0.000)
-2.559 (0.000)
-1.258 (0.000)
Import penetration 1.172 (0.000)
0.650 (0.001)
1.347 (0.000)
0.648 (0.035)
1.524 (0.000)
Firm had its IPO during the last five years dummy
0.173 (0.000)
0.183 (0.000)
-0.068 (0.270)
-0.225 (0.160)
0.166 (0.000)
R2-adjusted N
0.305 34,042
0.284 23
0.459 4,286
0.376 1,559
0.289 33,740
Significance levels for whether coefficient estimates are different from zero are in parentheses. In the first and fifth models the standard errors of the coefficients are adjusted for the clustering of observations at the firm level. The second and fourth models use Newey and West (1987) corrected standard errors. In the third model, the standard errors of the coefficients are adjusted using White’s (1980) correction.
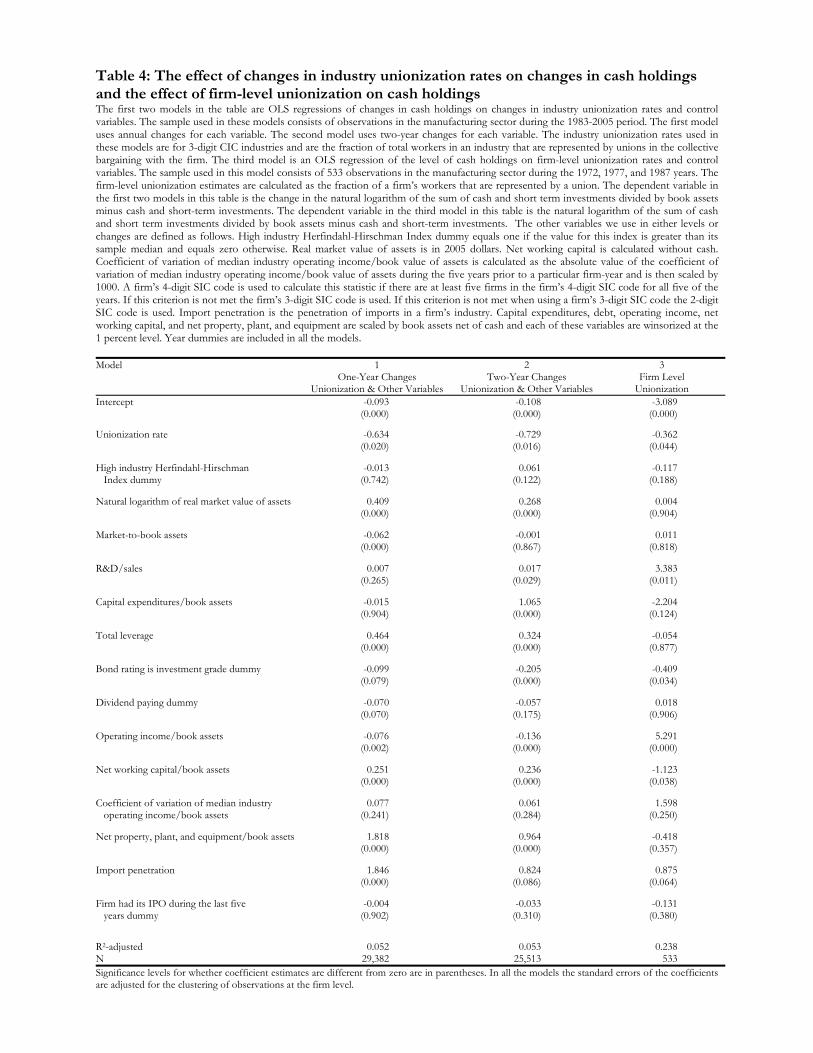
Table 4: The effect of changes in industry unionization rates on changes in cash holdings and the effect of firm-level unionization on cash holdings The first two models in the table are OLS regressions of changes in cash holdings on changes in industry unionization rates and control variables. The sample used in these models consists of observations in the manufacturing sector during the 1983-2005 period. The first model uses annual changes for each variable. The second model uses two-year changes for each variable. The industry unionization rates used in these models are for 3-digit CIC industries and are the fraction of total workers in an industry that are represented by unions in the collective bargaining with the firm. The third model is an OLS regression of the level of cash holdings on firm-level unionization rates and control variables. The sample used in this model consists of 533 observations in the manufacturing sector during the 1972, 1977, and 1987 years. The firm-level unionization estimates are calculated as the fraction of a firm’s workers that are represented by a union. The dependent variable in the first two models in this table is the change in the natural logarithm of the sum of cash and short term investments divided by book assets minus cash and short-term investments. The dependent variable in the third model in this table is the natural logarithm of the sum of cash and short term investments divided by book assets minus cash and short-term investments. The other variables we use in either levels or changes are defined as follows. High industry Herfindahl-Hirschman Index dummy equals one if the value for this index is greater than its sample median and equals zero otherwise. Real market value of assets is in 2005 dollars. Net working capital is calculated without cash. Coefficient of variation of median industry operating income/book value of assets is calculated as the absolute value of the coefficient of variation of median industry operating income/book value of assets during the five years prior to a particular firm-year and is then scaled by 1000. A firm’s 4-digit SIC code is used to calculate this statistic if there are at least five firms in the firm’s 4-digit SIC code for all five of the years. If this criterion is not met the firm’s 3-digit SIC code is used. If this criterion is not met when using a firm’s 3-digit SIC code the 2-digit SIC code is used. Import penetration is the penetration of imports in a firm’s industry. Capital expenditures, debt, operating income, net working capital, and net property, plant, and equipment are scaled by book assets net of cash and each of these variables are winsorized at the 1 percent level. Year dummies are included in all the models. Model 1 2 3 One-Year Changes
Unionization & Other Variables Two-Year Changes
Unionization & Other Variables Firm Level
Unionization Intercept
-0.093 (0.000)
-0.108 (0.000)
-3.089 (0.000)
Unionization rate
-0.634 (0.020)
-0.729 (0.016)
-0.362 (0.044)
High industry Herfindahl-Hirschman Index dummy
-0.013 (0.742)
0.061 (0.122)
-0.117 (0.188)
Natural logarithm of real market value of assets 0.409 (0.000)
0.268 (0.000)
0.004 (0.904)
Market-to-book assets -0.062 (0.000)
-0.001 (0.867)
0.011 (0.818)
R&D/sales 0.007 (0.265)
0.017 (0.029)
3.383 (0.011)
Capital expenditures/book assets -0.015 (0.904)
1.065 (0.000)
-2.204 (0.124)
Total leverage 0.464 (0.000)
0.324 (0.000)
-0.054 (0.877)
Bond rating is investment grade dummy -0.099 (0.079)
-0.205 (0.000)
-0.409 (0.034)
Dividend paying dummy -0.070 (0.070)
-0.057 (0.175)
0.018 (0.906)
Operating income/book assets -0.076 (0.002)
-0.136 (0.000)
5.291 (0.000)
Net working capital/book assets
0.251 (0.000)
0.236 (0.000)
-1.123 (0.038)
Coefficient of variation of median industry operating income/book assets
0.077 (0.241)
0.061 (0.284)
1.598 (0.250)
Net property, plant, and equipment/book assets
1.818 (0.000)
0.964 (0.000)
-0.418 (0.357)
Import penetration 1.846 (0.000)
0.824 (0.086)
0.875 (0.064)
Firm had its IPO during the last five years dummy
-0.004 (0.902)
-0.033 (0.310)
-0.131 (0.380)
R2-adjusted N
0.052 29,382
0.053 25,513
0.238 533
Significance levels for whether coefficient estimates are different from zero are in parentheses. In all the models the standard errors of the coefficients are adjusted for the clustering of observations at the firm level.

Table 5: The relation between unionization and cash holdings and the importance of obtaining a bargaining advantage The table reports OLS regressions of cash holdings on industry unionization rates, interaction terms, and control variables. The sample consists of 34,042 firm-year observations in the manufacturing sector during the 1983-2005 period. The dependent variable is the natural logarithm of the sum of cash and short term investments divided by book assets minus cash and short-term investments. Industry unionization rates are for 3-digit CIC industries and are the fraction of total workers in an industry that are represented by unions in the collective bargaining with the firm. High industry Herfindahl-Hirschman Index dummy equals one if the value for this index is greater than its sample median and equals zero otherwise. The industry’s materials costs/labor costs represents total materials costs/total payroll expenses in a firm’s 6-digit NAICS industry and the analysis that uses this variable is for the 1995-2005 period. Real market value of assets is in 2005 dollars. Net working capital is calculated without cash. Coefficient of variation of median industry operating income/book value of assets is calculated as the absolute value of the coefficient of variation of median industry operating income/book value of assets during the five years prior to a particular firm-year and is then scaled by 1000. A firm’s 4-digit SIC code is used to calculate this statistic if there are at least five firms in the firm’s 4-digit SIC code for all five of the years. If this criterion is not met the firm’s 3-digit SIC code is used. If this criterion is not met when using a firm’s 3-digit SIC code the 2-digit SIC code is used. Import penetration is the penetration of imports in a firm’s industry. Capital expenditures, debt, operating income, net working capital, and net property, plant, and equipment are scaled by book assets net of cash and each of these variables are winsorized at the 1 percent level. Year dummies are included in all the models.
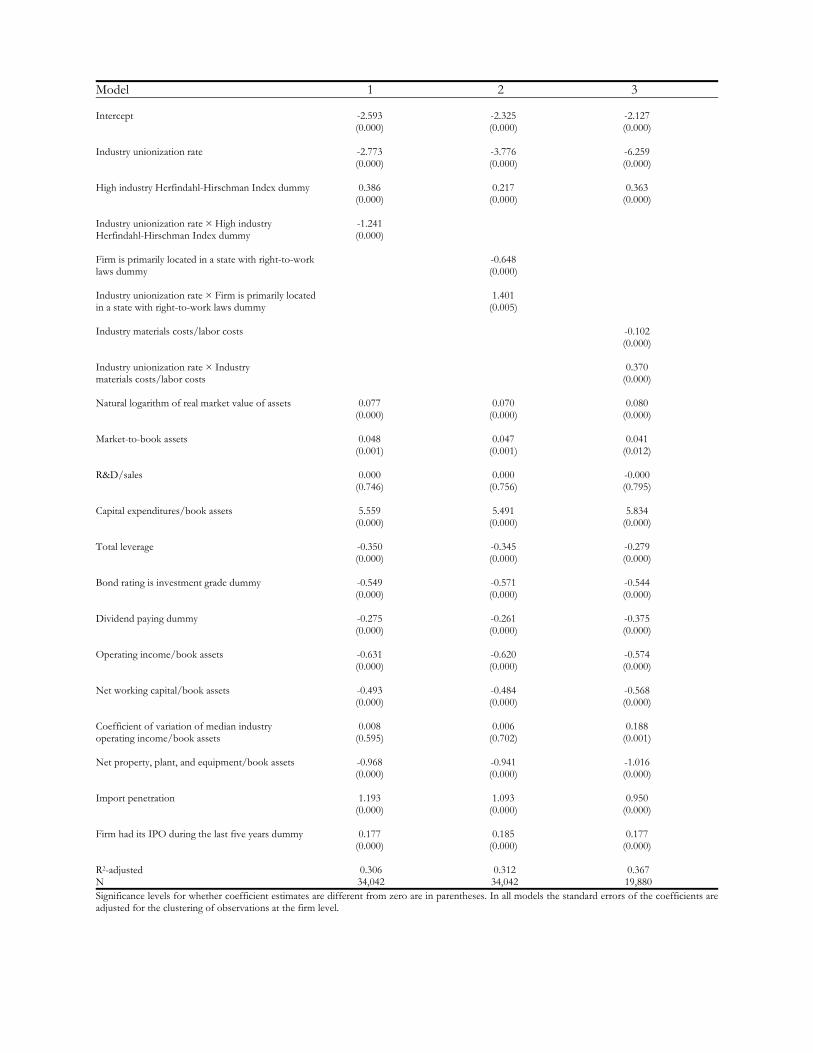
Model 1 2 3 Intercept
-2.593 (0.000)
-2.325 (0.000)
-2.127 (0.000)
Industry unionization rate
-2.773 (0.000)
-3.776 (0.000)
-6.259 (0.000)
High industry Herfindahl-Hirschman Index dummy
0.386 (0.000)
0.217 (0.000)
0.363 (0.000)
Industry unionization rate × High industry Herfindahl-Hirschman Index dummy
-1.241 (0.000)
Firm is primarily located in a state with right-to-work laws dummy
-0.648 (0.000)
Industry unionization rate × Firm is primarily located in a state with right-to-work laws dummy
1.401 (0.005)
Industry materials costs/labor costs -0.102 (0.000)
Industry unionization rate × Industry materials costs/labor costs
0.370 (0.000)
Natural logarithm of real market value of assets 0.077
(0.000)
0.070 (0.000)
0.080 (0.000)
Market-to-book assets 0.048
(0.001)
0.047 (0.001)
0.041 (0.012)
R&D/sales 0.000
(0.746)
0.000 (0.756)
-0.000 (0.795)
Capital expenditures/book assets 5.559
(0.000)
5.491 (0.000)
5.834 (0.000)
Total leverage -0.350
(0.000)
-0.345 (0.000)
-0.279 (0.000)
Bond rating is investment grade dummy -0.549
(0.000)
-0.571 (0.000)
-0.544 (0.000)
Dividend paying dummy -0.275
(0.000)
-0.261 (0.000)
-0.375 (0.000)
Operating income/book assets -0.631
(0.000)
-0.620 (0.000)
-0.574 (0.000)
Net working capital/book assets -0.493
(0.000)
-0.484 (0.000)
-0.568 (0.000)
Coefficient of variation of median industry operating income/book assets
0.008 (0.595)
0.006 (0.702)
0.188 (0.001)
Net property, plant, and equipment/book assets -0.968
(0.000) -0.941 (0.000)
-1.016 (0.000)
Import penetration 1.193
(0.000) 1.093
(0.000) 0.950
(0.000)
Firm had its IPO during the last five years dummy 0.177 (0.000)
0.185 (0.000)
0.177 (0.000)
R2-adjusted N
0.306 34,042
0.312 34,042
0.367 19,880
Significance levels for whether coefficient estimates are different from zero are in parentheses. In all models the standard errors of the coefficients are adjusted for the clustering of observations at the firm level.
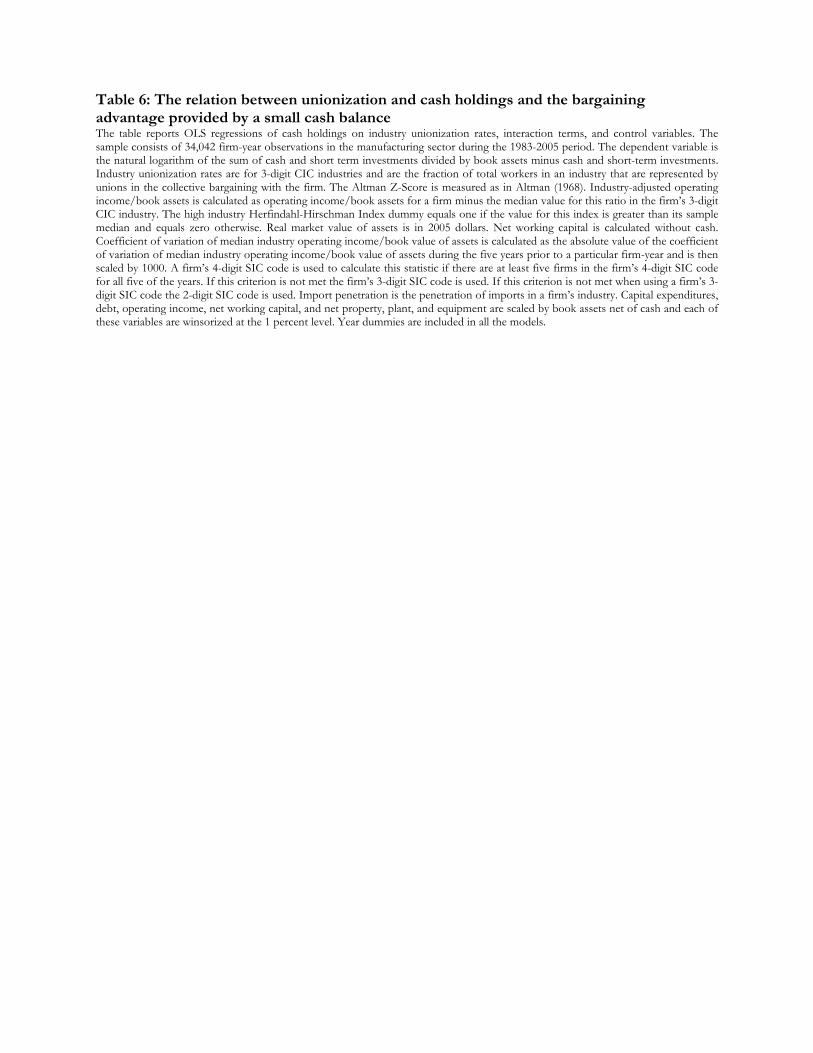
Table 6: The relation between unionization and cash holdings and the bargaining advantage provided by a small cash balance The table reports OLS regressions of cash holdings on industry unionization rates, interaction terms, and control variables. The sample consists of 34,042 firm-year observations in the manufacturing sector during the 1983-2005 period. The dependent variable is the natural logarithm of the sum of cash and short term investments divided by book assets minus cash and short-term investments. Industry unionization rates are for 3-digit CIC industries and are the fraction of total workers in an industry that are represented by unions in the collective bargaining with the firm. The Altman Z-Score is measured as in Altman (1968). Industry-adjusted operating income/book assets is calculated as operating income/book assets for a firm minus the median value for this ratio in the firm’s 3-digit CIC industry. The high industry Herfindahl-Hirschman Index dummy equals one if the value for this index is greater than its sample median and equals zero otherwise. Real market value of assets is in 2005 dollars. Net working capital is calculated without cash. Coefficient of variation of median industry operating income/book value of assets is calculated as the absolute value of the coefficient of variation of median industry operating income/book value of assets during the five years prior to a particular firm-year and is then scaled by 1000. A firm’s 4-digit SIC code is used to calculate this statistic if there are at least five firms in the firm’s 4-digit SIC code for all five of the years. If this criterion is not met the firm’s 3-digit SIC code is used. If this criterion is not met when using a firm’s 3-digit SIC code the 2-digit SIC code is used. Import penetration is the penetration of imports in a firm’s industry. Capital expenditures, debt, operating income, net working capital, and net property, plant, and equipment are scaled by book assets net of cash and each of these variables are winsorized at the 1 percent level. Year dummies are included in all the models.
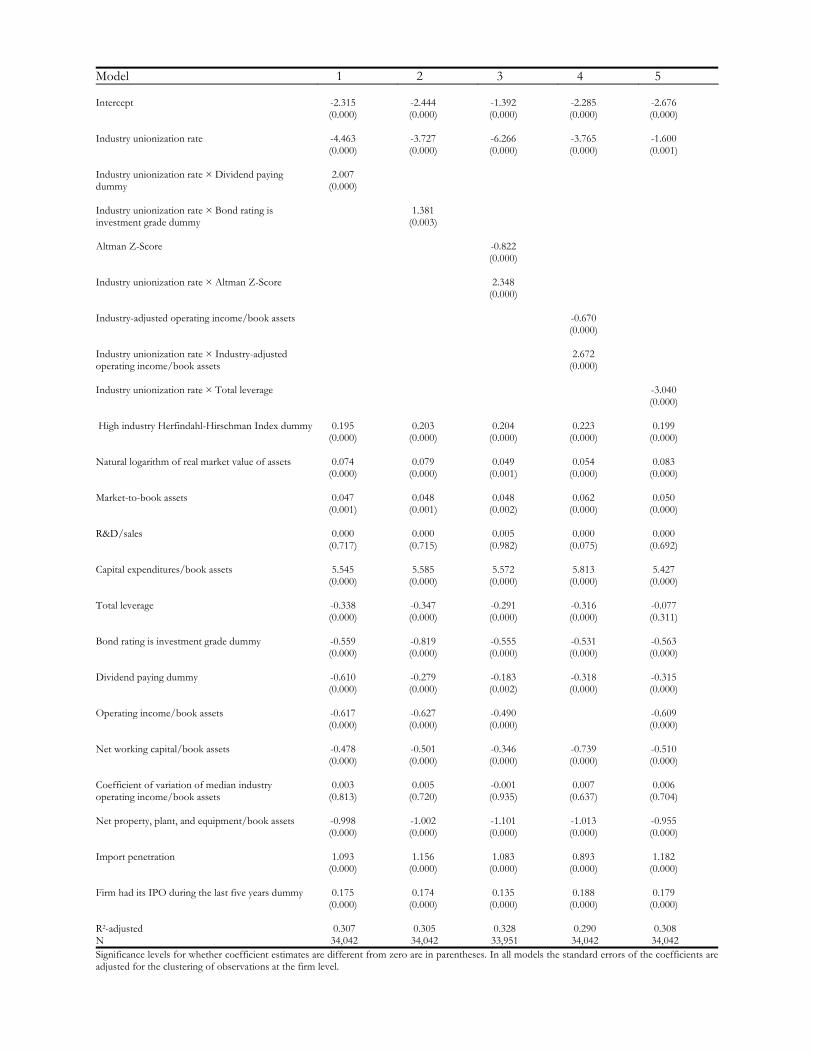
Model 1 2 3 4 5 Intercept
-2.315 (0.000)
-2.444 (0.000)
-1.392 (0.000)
-2.285 (0.000)
-2.676 (0.000)
Industry unionization rate
-4.463 (0.000)
-3.727 (0.000)
-6.266 (0.000)
-3.765 (0.000)
-1.600 (0.001)
Industry unionization rate × Dividend paying dummy
2.007 (0.000)
Industry unionization rate × Bond rating is investment grade dummy
1.381 (0.003)
Altman Z-Score
-0.822 (0.000)
Industry unionization rate × Altman Z-Score
2.348 (0.000)
Industry-adjusted operating income/book assets
-0.670 (0.000)
Industry unionization rate × Industry-adjusted operating income/book assets
2.672 (0.000)
Industry unionization rate × Total leverage
-3.040 (0.000)
High industry Herfindahl-Hirschman Index dummy
0.195 (0.000)
0.203 (0.000)
0.204 (0.000)
0.223 (0.000)
0.199 (0.000)
Natural logarithm of real market value of assets 0.074
(0.000)
0.079 (0.000)
0.049 (0.001)
0.054 (0.000)
0.083 (0.000)
Market-to-book assets 0.047
(0.001)
0.048 (0.001)
0.048 (0.002)
0.062 (0.000)
0.050 (0.000)
R&D/sales 0.000
(0.717)
0.000 (0.715)
0.005 (0.982)
0.000 (0.075)
0.000 (0.692)
Capital expenditures/book assets 5.545
(0.000)
5.585 (0.000)
5.572 (0.000)
5.813 (0.000)
5.427 (0.000)
Total leverage -0.338
(0.000)
-0.347 (0.000)
-0.291 (0.000)
-0.316 (0.000)
-0.077 (0.311)
Bond rating is investment grade dummy -0.559
(0.000)
-0.819 (0.000)
-0.555 (0.000)
-0.531 (0.000)
-0.563 (0.000)
Dividend paying dummy -0.610
(0.000)
-0.279 (0.000)
-0.183 (0.002)
-0.318 (0.000)
-0.315 (0.000)
Operating income/book assets -0.617
(0.000)
-0.627 (0.000)
-0.490 (0.000)
-0.609 (0.000)
Net working capital/book assets
-0.478 (0.000)
-0.501 (0.000)
-0.346 (0.000)
-0.739 (0.000)
-0.510 (0.000)
Coefficient of variation of median industry operating income/book assets
0.003 (0.813)
0.005 (0.720)
-0.001 (0.935)
0.007 (0.637)
0.006 (0.704)
Net property, plant, and equipment/book assets
-0.998 (0.000)
-1.002 (0.000)
-1.101 (0.000)
-1.013 (0.000)
-0.955 (0.000)
Import penetration
1.093
(0.000)
1.156
(0.000)
1.083
(0.000)
0.893
(0.000)
1.182
(0.000) Firm had its IPO during the last five years dummy
0.175
(0.000)
0.174
(0.000)
0.135
(0.000)
0.188
(0.000)
0.179
(0.000) R2-adjusted N
0.307 34,042
0.305 34,042
0.328 33,951
0.290 34,042
0.308 34,042
Significance levels for whether coefficient estimates are different from zero are in parentheses. In all models the standard errors of the coefficients are adjusted for the clustering of observations at the firm level.

Table 7: Changes in cash holdings and the likelihood of strikes Data on strikes are collected from BNA Labor Plus database maintained by the Bureau of National Affairs and are for manufacturing firms. Panel A reports median annual changes in cash holdings from fiscal years -2 to 0 relative to the year when a strike occurs for 59 observations over the 1990-2006 period. Cash holdings are defined as cash and short-term investments/book assets. Industry-adjusted cash holdings are a firm’s cash holdings minus median industry cash holdings where industry cash holdings are defined as the cash holdings of the other Compustat firms that share the same primary four-digit SIC code as a sample firm, but that do not experience a strike during the fiscal year when a sample firm experiences a strike. Panel B provides multivariate evidence on whether the likelihood that a firm experiences a strike is related to the firm’s change in cash holdings during the prior year. The sample used for models 1 and 2 in Panel B, which are Probit models, consists of 40 firms that experience a strike over the 1990-2006 period and 394 matched firms that do not experience a strike for which we are able to collect necessary data for all variables that appear in the regression models. The dependent variable in models 1 and 2 equals one if a firm experiences a strike and equals zero if a firm is a control firm that does not experience a strike. Cash holdings are defined as cash and short-term investments/book assets. Real market value of assets is in 2005 dollars. Net working capital is calculated without cash. The Altman Z-Score is measured as in Altman (1968). Coefficient of variation of median industry operating income/book value of assets is calculated as the absolute value of the coefficient of variation of median industry operating income/book value of assets during the five years prior to a particular firm-year and is then scaled by 1000. A firm’s 4-digit SIC code is used to calculate this statistic if there are at least five firms in the firm’s 4-digit SIC code for all five of the years. If this criterion is not met the firm’s 3-digit SIC code is used. If this criterion is not met when using a firm’s 3-digit SIC code the 2-digit SIC code is used. Year dummies are included in all the models.

Panel A: Univariate evidence on changes in cash holdings surrounding strikes Year relative to strike -2 -1 0 Median annual change in cash holdings
-0.0036 (0.320)
0.0028 (0.027)
0.0010 (0.072)
Median annual change in industry-adjusted cash holdings
-0.0017 (0.864)
0.0040 (0.088)
-0.0016 (0.508)
Significance levels are for the Signed-ranks test statistic. Panel B: Probit models predicting the likelihood of a strike Model 1 2 Intercept
-0.042 (0.000)
-0.036 (0.000)
Pre-strike year change in cash holdings
0.026 (0.012)
0.023 (0.013)
Firm is primarily located in a state with right-to-work laws dummy
-0.003 (0.101)
-0.002 (0.137)
Natural logarithm of real market value of assets 0.004
(0.000)
0.004 (0.000)
Pre-strike year change in total leverage 0.004
(0.231)
0.003 (0.438)
Pre-strike year change in whether a firm’s bond rating is investment grade as compared to the prior year
0.005 (0.045)
0.005 (0.053)
Pre-strike year change for whether a firm pays dividends as compared to the prior year
-0.002 (0.587)
-0.001 (0.683)
Pre-strike year change in operating income/book assets 0.016
(0.006)
0.011 (0.088)
Pre-strike year change in net working capital/book assets
0.010 (0.072)
0.006 (0.302)
Pre-strike year change in Altman Z-Score
-0.002 (0.640)
0.001 (0.648)
Pre-strike year change in market-to-book assets 0.001
(0.002)
Pre-strike year change in the coefficient of variation of median industry operating income/book assets as compared to the prior year
-0.092 (0.324)
Market-to-book assets -0.000 (0.586)
Coefficient of variation of median industry operating income/book assets
-0.009 (0.782)
Pseudo-R2
N
0.509 434
0.497 434
Marginal effects estimates are presented. Significance levels for whether coefficient estimates are different from zero are in parentheses. Standard errors of coefficients are adjusted for clustering of observations at the firm level.
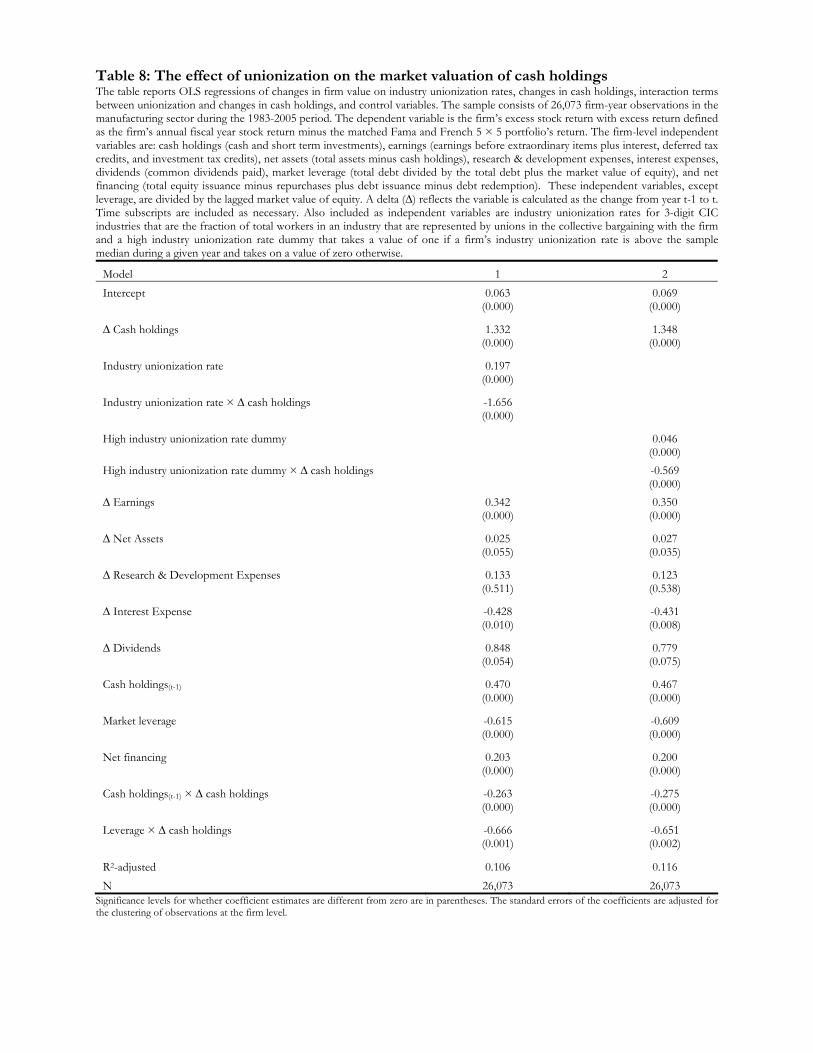
Table 8: The effect of unionization on the market valuation of cash holdings The table reports OLS regressions of changes in firm value on industry unionization rates, changes in cash holdings, interaction terms between unionization and changes in cash holdings, and control variables. The sample consists of 26,073 firm-year observations in the manufacturing sector during the 1983-2005 period. The dependent variable is the firm’s excess stock return with excess return defined as the firm’s annual fiscal year stock return minus the matched Fama and French 5 × 5 portfolio’s return. The firm-level independent variables are: cash holdings (cash and short term investments), earnings (earnings before extraordinary items plus interest, deferred tax credits, and investment tax credits), net assets (total assets minus cash holdings), research & development expenses, interest expenses, dividends (common dividends paid), market leverage (total debt divided by the total debt plus the market value of equity), and net financing (total equity issuance minus repurchases plus debt issuance minus debt redemption). These independent variables, except leverage, are divided by the lagged market value of equity. A delta (∆) reflects the variable is calculated as the change from year t-1 to t. Time subscripts are included as necessary. Also included as independent variables are industry unionization rates for 3-digit CIC industries that are the fraction of total workers in an industry that are represented by unions in the collective bargaining with the firm and a high industry unionization rate dummy that takes a value of one if a firm’s industry unionization rate is above the sample median during a given year and takes on a value of zero otherwise.
Model 1 2 Intercept 0.063 0.069 (0.000) (0.000)
∆ Cash holdings 1.332 1.348 (0.000) (0.000)
Industry unionization rate 0.197 (0.000)
Industry unionization rate × ∆ cash holdings -1.656 (0.000)
High industry unionization rate dummy 0.046 (0.000) High industry unionization rate dummy × ∆ cash holdings -0.569
(0.000) ∆ Earnings 0.342 0.350 (0.000) (0.000)
∆ Net Assets 0.025 0.027 (0.055) (0.035)
∆ Research & Development Expenses 0.133 0.123 (0.511) (0.538)
∆ Interest Expense -0.428 -0.431 (0.010) (0.008)
∆ Dividends 0.848 0.779 (0.054) (0.075)
Cash holdings(t-1) 0.470 0.467 (0.000) (0.000)
Market leverage -0.615 -0.609 (0.000) (0.000)
Net financing 0.203 0.200 (0.000) (0.000)
Cash holdings(t-1) × ∆ cash holdings -0.263 -0.275 (0.000) (0.000)
Leverage × ∆ cash holdings -0.666 -0.651 (0.001) (0.002)
R2-adjusted 0.106 0.116 N 26,073 26,073
Significance levels for whether coefficient estimates are different from zero are in parentheses. The standard errors of the coefficients are adjusted for the clustering of observations at the firm level.

Appendix Table 9: Steel and air express industry analysis The table compares cash holdings and changes in cash holdings within the steel and air express industries. Panel A focuses on the steel industry and compares Nucor’s cash holdings with those of U.S. Steel and the median U.S. incorporated firm in the steel industry (SIC =3312) with at least $1 billion in sales during the years 2002-2006 (a total of eight firms). The last row shows the change in the cash position for Nucor, U.S. Steel, and the industry median from 2002 to 2006 and also reports differences between Nucor and U.S. Steel and between Nucor and the industry median with respect to changes in cash positions over this period. Panel B focuses on the Air express industry and compares FedEx to Airborne Express during the period 1992-1996. The last row shows the change in the cash position for both firms from 1993, the last year that FedEx was a non-unionized firm, to 1996, and also reports differences between the two firms with respect to changes in cash positions over this period.
Panel A: Steel industry Cash/book assets Differences in cash/book assets Year Nucor U.S. Steel Industry Nucor – U.S. Steel Nucor - Industry 2002 0.050 0.030 0.018 0.020 0.032 2003 0.078 0.040 0.038 0.038 0.040 2004 0.127 0.095 0.071 0.032 0.056 2005 0.257 0.151 0.133 0.106 0.124 2006 0.279 0.134 0.094 0.145 0.185 ∆Cash/book assets (2002-2006) 0.229 0.104 0.076 0.125 0.153 Panel B: Air express industry
Cash/book
assets ∆Cash/book
assets Cash/book
assets ∆Cash/book
assets Differences in
cash/book assets FedEx Airborne Express FedEx - Airborne1992 0.027 0.013 0.011 0.001 0.016 1993 0.066 0.039 0.007 -0.004 0.059 1994 0.056 -0.010 0.010 0.003 0.046 1995 0.014 -0.042 0.015 0.005 -0.001 1996 0.016 0.002 0.027 0.012 -0.011 ∆Cash/book assets (1993-1996) -0.050 0.020 -0.070