the strategic development of third party logistics … lex miechels.docx · web viewerasmus school...
TRANSCRIPT

Erasmus school of economics
The strategic development of third party logistics providers in the Netherlands
Master Thesis
Lex Miechels
August 2011

The strategic development of third party logistics providers
2

The strategic development of third party logistics providers
The strategic development of third party logistics providers in the Netherlands
Master Thesis
Presented to:
Erasmus School of Economics
Department of Urban, Port and Transport Economics
Burgemeester Oudlaan 50
3062 PA Rotterdam
Supervisor:
dr. M. H. Nijdam
Second Reader:
drs. L.M. van der Lugt
By:
Lex Miechels
August 2011
Arnhem
3

The strategic development of third party logistics providers
TABLE OF CONTENTS
ACKNOWLEDGEMENTS.......................................................................................................................................6
SUMMARY.............................................................................................................................................................7
LIST OF FIGURES AND TABLES...........................................................................................................................8
LIST OF ABBREVIATIONS....................................................................................................................................9
1 INTRODUCTION.........................................................................................................................................10
2 THEORETICAL FRAMEWORK...................................................................................................................14
2.1 Defining logistics services providers...............................................................................................16
2.1.1 Third party logistics providers.....................................................................................................16
2.1.2 Fourth party logistics providers...................................................................................................19
2.1.3 Carriers & transport Operators....................................................................................................20
2.2 The historical development of the TPL business.............................................................................21
2.3 Outsourcing logistics.........................................................................................................................23
2.4 TPL buyer-supplier relationships.....................................................................................................26
2.4.1 Applying the agency theory on TPL relationships......................................................................26
2.4.2 Applying the network perspective on TPL relationships...........................................................27
2.4.3 Current status of TPL relationships.............................................................................................28
2.5 The geographic service area of TPL providers................................................................................29
2.6 TPL providers’ capabilities and the role of path dependency........................................................31
2.7 Client specific investments...............................................................................................................33
2.8 Customer adaption versus offering general services......................................................................35
2.9 Environmental awareness in the TPL industry...............................................................................38
2.10 Value added logistics.........................................................................................................................39
2.11 Capturing the supply chain...............................................................................................................40
3 METHODOLOGY.........................................................................................................................................44
3.1 Setting and framework of the research............................................................................................44
3.2 Method of data collection..................................................................................................................45
3.3 Method of data analyses....................................................................................................................47
4

The strategic development of third party logistics providers
4 RESULTS AND ANALYSIS...........................................................................................................................49
4.1 Characterizing Dutch TPL relationships..........................................................................................49
4.2 The georgraphic service area of Dutch TPL providers....................................................................51
4.3 Dutch TPL providers’ capabilities and the role of path dependency..............................................53
4.4 Client specific investments made by Dutch TPL providers.............................................................54
4.5 The strategic positioning of Dutch TPL providers...........................................................................56
4.6 Environmental awareness in the Dutch TPL industry....................................................................59
4.7 Value added logistics offered by Dutch TPL providers...................................................................60
4.8 Dutch TPL providers capturing the supply chain............................................................................61
5 DISCUSSION AND CONCLUSIONS..............................................................................................................63
5.1 Main findings.....................................................................................................................................63
5.2 Limitations.........................................................................................................................................65
5.3 future research..................................................................................................................................66
REFERENCES......................................................................................................................................................67
APPENDICES.......................................................................................................................................................72
Appendix 1: The questionnaire (in Dutch)........................................................................................................72
5

The strategic development of third party logistics providers
ACKNOWLEDGEMENTS
Numerous people have assisted me during the writing of this thesis. I would like to thank my
supervisor, Michiel Nijdam, for helping me to write a thesis on this subject, bringing me in contact
with TLN and supporting me along the way.
Secondly, I want to thank my parents Hans and Jacqueline Miechels for their support during my
whole school career. You always motivated me to develop myself without too much pushing (your
math lessons aside) and always let me make my own choices. Thanks again for funding my education.
Without you, I never would have become an MSc in Economics and Business.
Thirdly, I would like to thank my girlfriend Femmy Hesseling for acting as a sounding board. It must
have been boring for you to listen to my endless talking about a subject you aren't that much familiar
with. I would also like to thank you for your active support in elaborating the survey results. But most
of all I just like to thank you for your presence and the positive distraction you caused during the
writing process.
Fourthly, I am indebted to all of the respondents for their cooperation. They have provided me with
new and original insights and made this research dynamic. I also thank Babiche van de Loo of TLN for
bringing this study to the attention of potential respondents.
Last but not least, I would like to thank Marc Levinson (2006) for writing his book The Box. His book
about how the Shipping Container made the world smaller and the world economy bigger inspired
me to write the thesis I wrote because of the following phrases:
Sea-land and its competitors were not all like Polaroid or Xerox, companies whose proprietary
technology and constant stream of innovations provided inordinately high profits for decades.
Ship lines’ end product was basically a commodity. Just like farmers and steelmakers, they
would always be hostage to external forces, their prices and profit margins depending mainly
on economic growth and on their competitors’ decisions to build new ships. (p. 230)
6

The strategic development of third party logistics providers
SUMMARY
The transport- and logistics sector faces low margins and continuing price pressure. As was evident from the
surveys conducted by TLN (2011), there is a difference in profitability between logistics service providers and
transportation companies. This difference in profitability is presumably explained by the fact that logistics
services providers offer a more differentiated service. This insight led to the following research question: ‘’How
do third part logistics providers in the Netherlands develop their business?’’
The purpose of this research was to study how TPL providers in the Netherlands differentiate their business to
be more than a commodity service for their customers. Because becoming of more strategic importance for
your customer presumably entails a higher profitability for the TPL provider, it is expected that TPL providers
search for multiple ways to do so. In essence, this study is about TPL providers’ relationship with their
customers and the development and strengthening of these relationships. Following from this, this research is
about Dutch TPL providers expanding their services into less traditional logistics activities and further
diversifying the services offered: TPL providers creating new (international) business for themselves.
After studying business logistics and supply chain management literature, various sub questions arose. These
sub questions gave answer to the research question, all from a different angle. To give answer to the various
sub-questions discussed within the theoretical framework, an online survey was conducted. A questionnaire
was developed, consisting of fifteen statements and twenty-eight closed questions. TLN was very helpful in
bringing this research under the attention of the appropriate (potential) respondents. Besides through TLN, I
also raised awareness about this research by LinkedIn. All these efforts finally resulted in twenty-seven
responses from Dutch TPL providers.
It can be concluded that TPL providers are starting to become of more strategic importance for their
customers, but there is still much to be gained in this area. Another possibility to develop business is by further
internationalizing and Dutch TPL providers are planning to do so within Europe. It was also found that an
acknowledged way of diversifying services, attracting and retaining (stronger) customer relationships and thus
making your service less commoditized is by being an environmentally aware TPL provider. Another way of
becoming of more strategic importance is by making client specific investments: as is done by three-quarter of
Dutch TPL providers. The value added services offered by Dutch TPL providers contain a large spectrum of
services, of which some services are not related to traditional logistics. On average, one fifth of all turnover is
derived from value added logistics; thereby TPL providers prove they can develop new business for themselves.
But there is more proof of this: focusing more on supply chain management is another way of getting hold of a
larger part of the supply chain, thereby diversifying the providers’ service offerings. Although the majority of
TPL providers see offering supply chain management as a major opportunity for them, most notice that
customers are too focused on short term price levels and lowering costs of logistics. Finishing with strategic
positioning, although in the current situation most TPL providers are focused on their general problem solving
7

The strategic development of third party logistics providers
capabilities, it is the trend to wanting to become a more dedicated service provider: thereby again aiming at
becoming of more strategic importance for the customer and taking benefit from this situation.
8
The strategic development of third party logistics providers
LIST OF FIGURES AND TABLES
FIGURE 1 THESIS FRAMEWORK
FIGURE 2 THEORETICAL FRAMEWORK
FIGURE 3 TRIADIC RELATIONSHIPS AMONG SELLER, BUYER AND THIRD PARTY LOGISTICS PROVIDER (SOURCE: BASK, 2001)
FIGURE 4 THE POSITIONING OF 4PL PROVIDERS IN THE SUPPLY CHAIN (SOURCE: VAN HOEK, 2001)
FIGURE 5 BREAKDOWNS OF LOGISTICS SERVICES PROVIDERS TO THE DEGREE OF ADVANCED SERVICES PROVIDED (SOURCE: SIZ, 2011)
FIGURE 6 GLOBAL TPL REVENUES FOR 2009 (SOURCE: LANGLEY & CAPGEMINI, 2010
TABLE 7 TOP 5 MOTIVATIONS FOR OUTSOURCING LOGISTICS (SOURCE: RAHMAN, 2011)
FIGURE 8 RELATIONSHIPS BETWEEN SHIPPER AND TPL PROVIDER (SOURCE: BOWERSOX, DAUGHERTY, DROEGE, ROGERS, & WARDLOW, 1989)
FIGURE 9 EFFICIENT TPL SERVICES (SOURCE: MAKELIN & VEPSALAINEN, 1990)
FIGURE 10 CUSTOMER ORIENTATION AND SYSTEM EFFICIENCY: A TRADE OFF? (SOURCE: NIJDAM, 2011)
FIGURE 11 TPL PROVIDERS CLASSIFIED ACCORDING TO ABILITIES OF GENERAL PROBLEM SOLVING AND CUSTOMER ADAPTION (SOURCE: HERTZ & ALFREDSSON, 2003)
FIGURE 12 RANGE OF VALUE ADDED SERVICES OFFERED BY TPL PROVIDERS (SOURCE: NIJDAM, 2010)
FIGURE 13 CHANGING SUPPLY CHAINS (SOURCE: NIJDAM, 2011)
FIGURE 14 TPL PROVIDERS’ SHIFTING TASKS IN THE SUPPLY CHAIN (SOURCE: NIJDAM, 2011)
FIGURE 15 SCHEMATIC REPRESENTATION OF THE SURVEY FRAMEWORK
TABLE 16 STATISTICAL ANALYSES USING CROSS TABLES
TABLE 17 STRENGTH OF RELATIONSHIPS BETWEEN VARIABLES
FIGURE 18 SIZE OF THE PARTIES INVOLVED
TABLE 19 REASONS FOR OUTSOURCING
TABLE 20 SELECTING CUSTOMERS
FIGURE 21 ORIGIN OF THE MAJORITY OF TURNOVER
FIGURE 22 THE MAJORITY OF INVESTMENTS MADE BY TPL PROVIDERS
FIGURE 23 FINANCING CLIENT SPECIFIC INVESTMENTS
TABLE 24 REASONS FOR MAKING CLIENT SPECIFIC INVESTMENTS
FIGURE 25 STRATEGIC POSITIONING OF DUTCH TPL PROVIDERS
TABLE 26 THE PATH TO FOLLOW IN TERMS OF STRATEGIC POSITIONING
FIGURE 27 VALUE ADDED LOGISTICS OFFERED BY DUTCH TPL PROVIDERS
9

The strategic development of third party logistics providers
10

The strategic development of third party logistics providers
LIST OF ABBREVIATIONS
4PL FOURTH PARTY LOGISTICS
TCE TRANSACTION COST ECONOMICS
TLN TRANSPORT LOGISTIEK NEDERLAND
TPL THIRD PARTY LOGISTICS
11

The strategic development of third party logistics providers
1 INTRODUCTION
After the economic crisis of 2009, 2010 was all about recovery. But transportation companies and
logistics service providers could not speak of a good year for them since, despite increased costs,
price levels were still below 2009 prices and profit figures were not rosy. Almost 45% of all
companies in the industry expected no profit for 2010 (against 56% for 2009). The sectors profit
indicator declined during 2010. All of this resulted in an average profitability rate for the sector as a
whole of 3, 3 %. The logistics service providers, which are described by Transport en Logistiek
Nederland [hereinafter TLN] (2011) as companies which get over 40% of their revenues from logistics
services other than transportation, did better. For 2010, they achieved an average profitability rate of
4, 6%. The first quarter of 2011 looked better and gave hope for the future. Despite low profit
margins, the highest position of the cost level indicator in 3 years and lagging prices not fully
offsetting the costs involved, the sectors entrepreneurs voted the quarter the best since long. This
could be explained by a clear recovery in activity, turnover and increasing confidence amongst
logisticians. Nevertheless, the profit indicators were lagging. On a zero to eleven (maximum profit
satisfaction) scale, the profit indicator scored a 4, 1 over the first quarter of 2011 (against a 4, 4 over
the fourth quarter of 2010). In contrast, logistics service providers profit indicator scored a 6, 6 over
the first quarter of 2011: an increase over the 5, 5 scored over the fourth quarter of 2010.
Notwithstanding, 75% of all entrepreneurs was dissatisfied with the level of profits in the first quarter
of 2011 (TLN, 2010; TLN, 2011).
The surveys conducted by TLN (2010) give some quotes by transport companies that show how fierce
competition amongst the industry is, like “the Market is broken by strong competition and everyone
is moving his rate below that of others” (p. 4). In addition, a large number of entrepreneurs surveyed
by TLN (2010) are worried about increasing competition from companies in Eastern Europe: “we
currently have enough work, but will that stay this way? The prices are not good. We can’t compete
with the Poles, Bulgarians, etc. “(p. 4). The above information shows that the transport- and logistics
sector faces low margins and a continuing price pressure. This mainly has to do with their customers
looking at transportation and logistics as being like commodity services.
A typical characteristic for a commodity good or service is a service which is supplied without
qualitative differentiation on a market. In other words: the market treats it as a service for which it is
irrelevant who provides it (O’Sullivan & Sheffrin, 2003). As mentioned before, Marc Levinson (2006)
wrote the book The Box about how the Shipping container made the world smaller and the world
economy bigger, which inspired me to write this thesis because of the following phrases:
12

The strategic development of third party logistics providers
Sea-land and its competitors were not all like Polaroid or Xerox, companies whose proprietary
technology and constant stream of innovations provided inordinately high profits for decades.
Ship lines’ end product was basically a commodity. Just like farmers and steelmakers, they
would always be hostage to external forces, their prices and profit margins depending mainly
on economic growth and on their competitors’ decisions to build new ships. (p. 230)
This quote shows the characteristics of, and problems related to, a commodity. The book is mainly
focused on Malcolm McLean, the ‘inventor’ of the container, and his shipping line Sea-land. After
container shipping was well established in maritime transport and all shipping lines build many
containerships causing an oversupply of capacity and dramatically declining tariffs, the nature of the
service of container shipping became clear to banks and investors. They learned the hard way that
their investments wouldn’t provide tremendous yields, since the characteristics of the service
eventually made it a commodity.
A commodity good its price is determined as a function of its market: physical commodities like iron
ore, gold, coal and crude oil are traded on spot and derived markets (O’Sullivan & Sheffrin, 2003)
with buyers looking solely at quantity and thus without them worrying about the quality of the
goods. Rushkoff (2005) uses the term commoditization to refer to goods or services that used to be
different in terms of quality or attributes, but end up becoming commodities in the eyes of the
market. The example Rushkoff (2005) gives, is about the collapse of Marlboro’s brand value, thereby
convincing cigarette manufacturers that their products had been commoditized. According to
Rushkoff (2005) commoditization, a good or service becoming a commodity, is a market problem for
the producers of branded goods. As Rushkoff (2005) states, the problem with commoditization is that
only prices are left to make a distinction between products, thereby causing profit margins to shrink.
Commoditization can explain why the transport- and logistics sector faces low margins and
continuing price pressure, although transport- and logistic services can’t be seen as a completely
non-differential. Apparently, the sectors clientele is mainly focused on prices, thereby crushing the
sector’s premium margins. Low service differentiation amongst competitors caused low switching
costs for customers, low involvement of customers and thus a low stability of customer relationships.
On top, many existing competitors and many new suppliers of transportation and logistical services
entering from new EU-member states provide heavy competition in the market. As is evident from
the surveys conducted by TLN (2011), there is a difference in profitability between the logistics
service providers and transportation companies focusing on the more traditional task of transporting
goods from (international) location A to B. This difference in profitability is presumably explained by
the fact that logistics services providers offer a more differentiated service than just (road) haulage: a
service that seems to be commoditized.
13

The strategic development of third party logistics providers
The purpose of this thesis is to study how logistics service providers in the Netherlands (try to)
differentiate their business to be more than a commodity service for their customers. The objective
of this thesis is to find out how, and to what extent, this is successfully done. To define the term
logistics service providers, from now on this group will be defined as third party logistics (hereinafter
TPL) providers. TPL is a shared internationally used term of which the exact definition will be
described in the following chapter. Because of this, the following research question was formulated:
“How do third party logistics providers in the Netherlands develop their business?”
In recent years there has been much academic attention, interest and publications concerning third
party logistics, although literature on the subject is typified by Selviaridis & Spring (2007) as being
disjointed. The TPL definition seems overlapping and ambiguous. An analyses on literature published
between 1990 and 2005 shows that most TPL studies (about 60%) are empirical-descriptive in nature
(Marasco, 2007; Selviaridis & Spring, 2007). The most used methods employed for researching the
subject are surveys (51%) and case studies (15%). TPL studies are weakly theorized: 69% of the
papers are describing trends in the industry without paying attention to a theoretical framework.
Concluding with the level of analysis of TPL studies, 67% of the studies was focused on the firm level,
either from the shipper’s or logistics service provider’s viewpoint (Selviaridis & Spring, 2007).
Marasco (2007) reviewed 152 articles on TPL published between 1989-2006. She found out that early
studies focused on the user of third party logistics services, but this is gradually changing. More
recent studies have turned their attention towards TPL providers. A possible explanation for this
might be the fast expansion and transformation of the industry. Much of the research in this area has
been focusing on the strategic development of third party logistics provides, the services being
offered and developed, current status and their future prospects (Marasco, 2007). Besides that,
Marasco (2007) states that most recent studies are focusing more on the IT adaption of the industry
since this is determined as key success factor for TPL providers. Still, Rahman (2011) quotes that “ the
vast majority of the 3PL studies have been conducted from the users’ perspective” (p. 5). Relatively
little attention has been paid to the TPL service providers’ perspective, although even less attention
has been paid to studies simultaneously examining users’ and providers’ perspectives (Rahman,
2011).
This study contributes to the research field by focusing on the providers’ perspective. The level of
analysis will be that of the Dutch TPL sector. The focus will be on describing trends in the industry
and trying to link these trends with a firm theoretical foundation. In general, the study will be
descriptive in nature: describing how third party logistics providers in the Netherlands develop their
14

The strategic development of third party logistics providers
business. Empirically, surveys will be used to obtain data. Although third party logistics conceived
much attention during recent years, fewer studies have been performed from a TPL providers’
perspective. Studies on TPL providers identified some issues of importance such as providers’
strategic development and positioning, customer relationships, value added logistics, postponed
manufacturing, competency development and TPL providers’ position in the supply chain. By
combining these issues, this research will be about differentiating services and developing the TPL
business to overcome the problems related to commodity goods, thereby becoming of strategic
importance for their clients. Concluding, figure 1 schematically shows the thesis framework.
Figure 1 Thesis framework
15
1 Introduction2 Theoretical framework Logistics services providers The historical development of the TPL business Outsourcing logistics
Introductory
2 Theoretical framework TPL buyer-supplier relationships The geographic service area of TPL providers TPL providers' capabilities and the role of path dependency Client specific investments Customer adaption versus offering general services Environmental awareness in the TPL industry Value added logistics Capturing the supply chain
Analyzing & scientifically declaring
3 Methodology4 Results and analysis5 Discussion and conclusions
Presentation of the research

The strategic development of third party logistics providers
2 THEORETICAL FRAMEWORK
For understanding the development of TPL providers in the indentified issues of importance, such as
TPL providers’ strategic development and positioning, customer relationships, value added logistics,
postponed manufacturing, competency development and TPL providers’ position in the supply chain,
business logistics and supply chain management literature will be used.
The theoretical framework is divided into eleven parts. The first part is a debate on the definition of
TPL providers, in which the most relevant logistics service providers are discussed. It is important to
distinguish between these ‘types’ of logistics services providers since they are often used
interchangeably. After explaining why this thesis focuses on TPL providers, the second part describes
the historical development of this TPL business, since this gives a better understanding of the
features of the business. Moreover, describing past developments in the business will ensure that
future developments in the industry are better understood. The reason for the existence of the
industry lies in the fact that companies outsource their logistics. Thus, the third part explains the
reasons and rationale companies have for outsourcing their logistics. How can the inter-
organizational relationship between buyers and suppliers of TPL services be explained? The first
three parts are more or less introductory to the subject, while from the fourth part on the strategic
development of third party logistics providers is examined on a number of key areas.
The fourth part analyzes TPL buyer-supplier relationships. Besides describing the current status of
these relationships, a prelude to the question how TPL relationships can be characterized, the agency
theory and the network approach are applied on buyer-supplier links. These theories have a totally
different angle on establishing win-win relationships with mutual trust between the buyer and
supplier of TPL services. In part five, the geographic service area of TPL providers is analyzed. These
parts gives insights in the (absent) geographical expansionist drive of TPL providers. Part six is about
TPL providers’ capabilities and the role of path dependency. To what extent do TPL providers learn
from existing and former client relationships? This is interesting because of the possible relevance of
path dependency for TPL providers and their organizations’ capabilities and future strategic
orientation. The seventh part is about client specific investments, since investment decisions have a
huge influence on future strategic development. Part eight focuses on the tradeoff between offering
general services versus the ability for customer adaption. The depth of the customer relationship and
the degree of customer adaption has a negative impact on the general capabilities of the TPL
provider and vice versa. This situation causes a strategic frontier. When having a deeper customer
relationship, this will decline the actual number of clients you serve. From a strategic perspective,
positioning along this strategic frontier involves how and where the TPL providers want to target a
16

The strategic development of third party logistics providers
market and compete (Hooley & Saunders, 1993). Part nine describes the environmental awareness in
the TPL industry. Being environmental sustainable could be seen as a way to attract (certain) clients.
The tenth part is about which value added logistics TPL providers offer. Offering a wider variety of
services is seen as a way to develop the TPL providers’ business. Part eleven expands on part ten by
describing how TPL providers try to achieve their ambition of capturing a larger part of the supply
chain. External developments such as the wish to shorten supply chains (reducing costs), mass
customization and related postponed manufacturing made TPL providers see the potential of these
developments for their strategic development. Their interest for providing postponement driven
services is clear. According to van Hoek (2000), TPL providers started offering customization services,
since this part of the supply chain has higher value-added activities and thus yields higher margins in
comparison to distribution and storage. Concluding, after studying business logistics and supply chain
management literature I think the mentioned topics give a good coverage of the different ways TPL
providers’ business developments and strategic decision making take place. While developing the
theoretical framework, various sub-questions arose. These sub-questions give answer to the
research-question, all from a different angle. When combining all these answers to the different sub-
questions, the research-question can be answered. Summarizing, this theoretical framework, which
is schematically shown in figure 2, will form the basis for understanding the strategic development of
TPL providers in the Netherlands.
Figure 2 Theoretical framework
17
2.1 Defining logistics services providers2.2 The historical development of the TPL business2.3 Outsourcing logistics
Introducing the subject
2.4 TPL buyer-supplier relationships2.5 The geographic service area of TPL providers2.6 TPL providers' capabilities and the role of path dependency2.7 Client specific investments 2.8 Customer adaption versus offering general services 2.9 Environmental awareness in the TPL industry2.10 Value added logistics2.11 Capturing the supply chain
Approaching the research question from multiple angles

The strategic development of third party logistics providers
2.1 DEFINING LOGISTICS SERVICES PROVIDERS
The most relevant logistics services providers related to this research are discussed below. It is
important to distinguish between third party logistics providers, fourth party logistics providers and
carriers & transport operators, since these ‘types’ of logistics services providers are often used
interchangeably although there are substantial differences in the set of services is that they offer.
2.1.1 THIRD PARTY LOGISTICS PROVIDERS
Before we can answer the research question, it is important to define a TPL provider. As stated
before, the TPL definition seems overlapping and ambiguous. As the name third party logistics
suggest, there also exist first and second parties. The first party is the shipper or supplier, so the
origin of the goods that need to be transported. The second party is the buyer and thus the
destination of the transported goods (Hertz & Alfredsson, 2003). The term ‘third party logistics’ has
its origin in a triadic relationship between seller, buyer and TPL provider. Although the term TPL
suggests that the relationship consists between three parties, in general, these relationships are
mostly limited to relationships between seller and TPL provider or between buyer and TPL provider
(Bask, 2001).
Figure 3 Triadic relationships among seller, buyer and third party logistics provider (source: Bask, 2001)
TPL providers have been classified according to their type and duration of relationships with clients,
degree of customization, material flow characteristics, knowledge level of the provider and
performed activities. Besides that, TPL providers can be characterized by to what extent TPL
providers themselves are outsourcing (parts) of their logistics services and to what extent the TPL
business is more than just a side business to transport and/or warehousing (Hertz & Alfredsson,
18

The strategic development of third party logistics providers
2003). So, TPL has many definitions, which can be divided into a number of broad and narrower
definitions/interpretations. An example of a broad definition is given by Lieb (1992). According to
Lieb (1992), TPL involves ‘’the use of external companies to perform logistics functions that have
traditionally been performed within an organization. The functions performed by the third party can
encompass the entire logistics process or selected activities within that process’’ (p. 29).
An example of a more narrow definition is given by Berglund et al. (1999): ‘‘Third-party logistics are
activities carried out by a logistics service provider on behalf of a shipper and consisting of at least
management and execution of transportation and warehousing. In addition, other activities can be
included, for example inventory management, information related activities, such as tracking and
tracing, value added activities, such as secondary assembly and installation of products, or even
supply chain management. Also, the contract is required to contain some management, analytical or
design activities, and the length of the co-operation between shipper and provider to be at least one
year, to distinguish third party logistics from traditional ‘‘arm’s length’’ sourcing of transportation
and/or warehousing’’(p. 59). While Berglund et al. (1999) stress a broad range of logistics services
and the duration of the contract, Murphy and Poist (1998) also stress the win-win nature of the
involved relationship. They state that TPL involves ‘‘a relationship between a shipper and third party,
which, compared with basic services, has more customized offerings, encompasses a broader number
of service functions and is characterized by a longer term, more mutually beneficial relationship’’ (p.
26) .
Although the above mentioned broader and narrower definitions give a good idea about how to
interpret TPL, another definition is applied in this study. This can be justified by the fact that the
broad definition is just that (or even too broad) and the narrow definitions putting, in my opinion, too
much emphasize on the long duration of the contract, the broad range of services and the level of
customization. An intermediate between the broader and narrower views of TPL is found in the
definition given by Bask (2001). He describes TPL as ‘‘relationships between interfaces in the supply
chains and third-party logistics providers, where logistics services are offered, from basic to
customized ones, in a shorter or longer term relationship, with the aim of effectiveness and
efficiency’’(p. 474). This definition is applied during this thesis, since it really grabs the essence of TPL
without being too narrow and thereby needless excluding genuine members of the TPL sector.
Terms such as “logistics outsourcing”, “logistics alliances”, “third party logistics”, “contract logistics”
and “contract distribution” have been used to describe the contracting-out part of or all logistics
activities that were previously performed in-house (Lieb, 1992; Selviaridis & Spring, 2007). Different
definitions emphasize on different aspects of the outsourcing arrangements. To avoid confusion
19

The strategic development of third party logistics providers
amongst the most important and often used terminology, the terms carrier or transport operator
and fourth party logistics provider will be defined. There is much confusion about carriers, TPL
providers and fourth party logistics providers (hereinafter 4PL) since the mutual differences that
divide them are a bit vague. Besides that, many logistic services providers try to market themselves
as more than they actually are: carriers self are proclaiming to be TPL providers and, on the other
hand, TPL providers using the fashionably term 4PL provider.
20

The strategic development of third party logistics providers
2.1.2 FOURTH PARTY LOGISTICS PROVIDERS
The term 4PL, a trademark of Andersen Consulting/Accenture (Rushton & Walker, 2007), describes
more advanced arrangements compared to TPL arrangements. The 4PL provider task or service is to
acts as a single point of contact within the client’s supply chain (van Hoek and Chong, 2001). A 4PL
provider is defined by van Hoek & Chong (2001) as ‘’a supply chain service provider that participates
rather in supply chain co-ordination than operational services. It is highly information based and co-
ordinates multiple asset-based players on behalf of its clients’’ (p. 463). Skjott-Larsen (2000) states
that 4PL providers are non asset-based companies which make use of their planning capabilities and
IT solutions and act as a single interface between the client and multiple asset-based logistics
services providers, such as carriers and TPL providers. About 25% of the TPL providers’ CEOs
interviewed by Lieb & Lieb (2009) said that they increased company focus on consulting services such
as network modeling and development of 4PL service offerings. Expansion of consulting services was
ranked 4th in the identified industry opportunities. The fact
that asset-based TPL providers profile themselves as being
4PL providers is raising questions about whether or not to
have the right incentives for acting as 4PL provider. It is
not that difficult to see the conflicting interest of these
parties: being a supply chain coordinator optimizing
customers’ supply chain management thereby looking at
all the options available on the market and, at the same
time, having the task to maximize the companies’ capacity
utilization. Concluding, the most striking and important
difference between TPL (3PL) and 4PL providers is whether
or not they are asset or non-asset based, because this
largely influences the role they play within the supply
chain.
21
Figure 4 The positioning of 4PL providers in the supply chain (source: van Hoek, 2001)

The strategic development of third party logistics providers
2.1.3 CARRIERS & TRANSPORT OPERATORS
Carriers or transport operators carry out the haulage from one point to another. Common services
provided by carriers are inbound and outbound transportation, door-to-door transportation service,
contract delivery, transportation administration, document handling, scheduling and sometimes also
track and tracing services are provided. These typical services are provided as basic services with low
levels of customization. The scope of carriers is at performing physical transport, although the large
(st) carriers sometimes run warehouses and transshipment terminals (Stefansson, 2005). Companies
that hold assets, such as trucks, ships, warehouse and other physical property, were hit the hardest
during the economic downturn. The decreases in demand ensured that the companies concerned
needed to idle assets and reduce tariffs. Because of the improving economic situation, asset-owning
companies are recovering again (Langley & Capgemini, 2010). Just like TPL operators, carriers are
commonly owning or leasing their resources and thus are asset-based operators. Compared to
carriers, TPL providers perform more diverse and advanced services in addition to the basic
transportation and warehouse services. As mentioned before, TPL providers’ scope is much wider
than just transportation and warehousing: services which could be outsourced to carriers/transport
operators.
22
4PL
TPL
Carriers & Transport operators
Figure 5 Breakdown of logistics services providers to the degree of advanced services provided (source: Siz, 2011)
The strategic development of third party logistics providers
2.2 THE HISTORICAL DEVELOPMENT OF THE TPL BUSINESS
Nowadays, typical services outsourced to TPL providers are warehousing and inventory, transport,
value-added services, information services and reengineering the supply chain (Andersson, Third
party logistics- outsourcing logistics in partnership, 1997). Other commonly performed activities are
forwarding, packaging, distribution and logistics postponement (Bask, 2001). These services have
been developed over time, both in knowledge and in technology/IT. This had its effect on the way
the business evolved itself (Hertz & Alfredsson, 2003). According to Berglund et all. (1999) the TPL
business is formed by three waves of entrants into the TPL market. The first wave took place in the
1980s when traditional transport firms developed into TPL providers. Frans Maas (currently named
DSV) is a Dutch example of such a company. An important characteristic of these entrants was that
they had a strong position in either transportation or warehousing. The second wave dates from the
early 1990s and introduced global network firms such as UPS, DHL, FedEx and TNT: all massive
companies with a continental or even global postal, parcel and (air) express background. During the
last wave, which started around the late 1990s, some companies from unexpected markets entered
the TPL business. Examples are management consultants, financials, information technologists etc.
The first and second wave entrants base their skills on their competence in more traditional logistics,
such as transport, warehousing and running a scheduled distribution network. By contrast, third
wave entrants brought very different skills to the market: IT, financial and consultancy skills (Carbone
& Stone, 2005). So, in the development of TPL providers we already saw a shift from asset-based to
skill-based providers. This trend is currently expanding in the form of the rise of self-appointed 4PL
providers (4PL is a trademark of Andersen Consulting). Although these companies are named
different and thereby differentiating themselves form TPL providers, these newly formed companies
could also be characterized as the fourth wave in the development of the TPL market.
The described waves of entrants do provide information on the participants of the TPL market, but
don’t explain the reasons for participating. According to Andersson (1997) the opportunity to
participate in TPL activities was made possible by deregulations in the market(s) involved. Heavy
competition in the providers’ original service and/or market led to decreasing margins and made
entering the TPL market a necessity. Combined with the positive attitude of shippers towards
outsourcing and the shippers wish to focus on its core business, these factors explain why the TPL
industry emerged.
In a more recent paper, Lieb (2005) describes North American TPL industry dynamics. The study
conducted among North American TPL providers CEOs pointed out that the most important dynamics
indentified are a continuing downward price pressure, large-scale mergers among TPL providers and
23

The strategic development of third party logistics providers
an increasing interest of shippers in outsourcing non-core activities such as their logistic activities.
The most important market opportunities are related to expanding supply chain integration
activities, increasing international scope and further expansion of the usage of IT in their services.
Besides the downward price pressure, the most important market threats are the low returns on IT
investments and finding and keeping talent. In their 2010 survey Lieb & Lieb describe main industry
dynamics. The continuing downward price pressure on pricing is still the most important problem
faced by TPL providers. Provider CEOs expected continuing resistance against tariff raisings. As it was
in 2005, attracting professional talent in 2010 was the second most important problem for the
industry: this situation was worsened because after laying people off during the recession, the
workforce had to be rebuild (Lieb & Lieb, 2010).
The demand for TPL services can be analyzed further. On a global scale, there are several main
factors behind the increasing role of TPL providers. Firstly, globalization caused a global network of
manufacturing activities, thereby separating producers and consumers. This caused the demand for
complicated transportation services, since segments of the transport chain take place in countries
which are unfamiliar to the outsourcing company (Rodrique, Comtois, & Slack, 2009). Second, an
increasing focus on their core business and core competencies made retailers and manufacturers
decide to sub-contract activities where they have less knowledge (van Damme & van Amstel, 1996;
Hertz & Alfredsson, 2003). Because of the expertise of the subcontractor in these sub-contracted
fields, productivity gains such as less costs and more reliability can be achieved. Third, TPL providers
can make better utilization of their transportation equipment by employing their assets for multiple
clients, thereby lowering the costs involved (van Damme & van Amstel, 1996). Fourth, deregulation
made a higher level of interaction between different transportation modes possible. Intermodal
transport is a complex transport service: users of such services need TPL providers. Last but not least,
TPL providers are innovative in implementing new supply chain solutions, thereby further lowering
costs and improving service and reliability (Rodrique, Comtois, & Slack, 2009).
These factors above explain how the TPL industry emerged and expanded into its current magnitude.
As can be seen in table 6, global TPL revenues for 2009 were estimated to be 507 billion US$. But can
we speak of a mature market yet? According to Berglund at all. (1998) there are several arguments
which underpin that the TPL industry has not yet reached its maturity stage. First of all, there are still
a large number of TPL providers in the US and Europe, although Lieb (2005) states that TPL providers
CEOs describe large-scale mergers among TPL providers. Most of the CEOs interviewed in 2010 think
that the TPL industry has not fully stabilized and are predicting further consolidation (Lieb & Lieb,
2010).
24

The strategic development of third party logistics providers
Table 6 Global TPL Revenues for 2009 (source: Langley & Capgemini, 2010)
Region 2009 Global TPL revenues (US$ billions)
North America 128.1
Europe 162.3
Asia- Pacific 136.7
Latin America 27.6
Other Regions 52.4
Total 507.1
Judging from these facts and seen the year of publication of the papers mentioned, the industry is on
its way to maturity. But there are still other factors that prove that this process of maturing isn’t
finished yet. As mentioned before, the absence of ambiguous terminology is still existing and thus an
indicator for relative immatureness. The same can be said about the lack of companies completely
focusing on TPL services: Berglund et all. (1998) state that most TPL activities are being conducted by
large transport operators. In my opinion, large transportation companies operating TPL services
should be recognized as fully fledged TPL operators. Summarizing, it can be said that the TPL industry
is arrived at the last stage of the maturing process.
2.3 OUTSOURCING LOGISTICS
Outsource or in-house service: that’s the question. There can be regulatory or economic reasons for
organizing certain activities. Rules can prevent management and operations to split if, for example,
otherwise an unfair competitive position would be obtained. There are three major economic
approaches generally discussed with regard to logistics outsourcing or in-house decisions: transaction
cost view, resource-based view and the supply chain management theory (Hsiao, Kemp, van der
Vorst, & Omta, 2011). Transaction costs economics explains why economic activities are organized
as they are: on a market, within the firm or in a hybrid form (networks etc.) In selecting the right
governance model for transaction, the transaction cost should be minimized. Transaction difficulties
are caused by bounded rationality and opportunism. Bounded rationality means that people intend
to behave rationally, but often are not rational because of incomplete information. Opportunism is a
term to describe the fact that people are led by self-interest. Determinant for the choice of
governance are: asset specificity, complexity, uncertainty and frequency. If a transaction involves
high determinants, so high frequency of the transaction etc., transaction costs will also be high
(Williamson, Transaction cost economics: the governance of contractual relations, 1979). The
25

The strategic development of third party logistics providers
resource based view of the firm studies a firm’s internal strengths and weaknesses. This view
suggests that each company has unique competencies which they make leverage with. These unique
competencies form the basis of their core business and thus will their core business not be
outsourced. (Insigna & Werle, 2000; Leiblein & Miller, 2003) The third economic outsourcing
approach is supply chain management theory. This theory suggests that firms consider outsourcing
their logistics when logistics complexity is high. Outsourcing the problem of complexity can easily be
done be relying on TPL providers (Rao & Young, 1994; van Damme & van Amstel, 1996).
TPL providers can be seen as supportive supply chain members (Lambert, Cooper, & Pagh, 1998) and
can thus be defined as companies that provide knowledge or assets for the primary supply chain
members. Supply chains can benefit from provided TPL services by being able to enhance total
company performance through added-value created by outsourcing logistics (Bask, 2001). The main
benefits one should think of are bargaining power, improvement of economies of scale and scope,
efficient operations, faster implementation of IT systems, knowledge base, reduced investment base
and the re-organization of the supply chain (Andersson, 1995). These benefits associated with TPL
can lead to the creation of added value for the outsourcer, thereby enhancing its total company
performance.
The benefits and risks of outsourcing activities to TPL operators can be classified into three
categories: strategic-, financial- and operational-related (Selviaridis & Spring, 2007). Focusing on core
competencies, thereby outsourcing logistics can be classified as a strategically motivated (van
Damme & van Amstel, 1996). TPL providers can also improve customer satisfaction and give access
to international distribution networks. Users of TPL providers enlarge their flexibility by having more
flexibility in responding to demand volatility (Bask, 2001). Strategic risks are losing control over the
logistics function and loss of in-house capability and customer contact (Ellram & Cooper, 1990; van
Damme & van Amstel, 1996). Financial benefits of outsourcing include reductions in asset
investment, labour and equipment maintenance costs (Bardy & Tracy, 1991; van Damme & van
Amstel, 1996). Another reason for outsourcing logistics is to benchmark in-house costs and efficiency
of logistics (van Damme & van Amstel, 1996; van Laarhoven, Berglund, & Peters, 2000). As
mentioned before, TPL providers can make better utilization of their transportation equipment by
employing their assets for multiple clients, thereby lowering the costs involved (Rodrique, Comtois, &
Slack, 2009). But these cost reductions could off course be offset by the provider’s margin (Wilding &
Juriado, 2004). Research conducted by Solakivi, Toyli, Engblom, & Ojala (2011) under 223 Finnish
companies showed that there seemed to be no direct significant relationship between logistics costs
and logistics outsopurcing. In other words, these emperical results didn’t show lower logistics costs
due to outsourcing. Operational benefits involved with outsourcing are, for example, improvements
26

The strategic development of third party logistics providers
in customer service, lower inventory levels, lower order cycle- and lead times (Bhatnager &
Viswanathan, 2000). Off course, service performance can also be negatively influenced by
outsourcing logistics to a particular company, but in general this is not the case since this would
mean the sector would lose its (strategic) importance for its customers. Van Damme & van Amstel
(1996) state that there is a risk of losing expertise and innovation capabilities associated with
outsourcing. Having said this all, Solakivi, Toyli, Engblom, & Ojala (2011) conducted research under
223 firms operating in Finland. An observation they made was that there seemed to be no gain in
logistics performance due to outsourcing. Logistics was being handled equally efficient: it didn’t seem
to matter whether logistics remained in-house or had been outsourced. Rahman (2011) recently
carried out a study in Australia in which he examined motivating factors for outsourcing logistics.
Respondents were asked to rank the top three factors that had motivated them to outsource to TPL
providers. His top five can be seen in table 7. Similar results have been reported by many previous
studies (Larson and Gammelgaard, 2001; Lieb and Randall, 1996; Sahay and Mohan, 2006; van
Laarhoven et al., 2000).
Table
7
Motivations for outsourcing
(source: Rahman, 2011)
Votes
%
1 Logistics cost reductions 78
2 Reduce capital investments 70
3 Enhance flexibility 60
4 Access to new markets 48
5 Concentrate on core competencies 46
The future prospects for outsourcing logistics seem good. In general, the trend is to outsource
logistics ever more (Frost & Sullivan, 2005; Hsiao, Kemp, van der Vorst, & Omta, 2011). With logistics
service providers improving their productivity and efficiency through technological improvements,
TPL providers can develop superior information management systems thereby optimizing solutions
for their clients (Frost & Sullivan, 2005). Although the global economic crisis in 2008-2010 slowed
down the pace, as companies had to deal with more urgent issues than the outsourcing decision, an
improving economic future may revive these plans quickly (Lieb & Lieb, 2010). Since the economic
downturn made it clear to focus on reducing costs and enhance services, companies will see
outsourcing as means to achieve these goals.
2.4 TPL BUYER-SUPPLIER RELATIONSHIPS
27

The strategic development of third party logistics providers
How can the inter-organizational relationship between buyers and suppliers of TPL services be
explained? As mentioned before, the most known theories explaining the outsourcing decision are
transaction cost economics (hereinafter TCE) and the resource-based view. The existence of TPL can
be explained by TCE, combined with the resource-based perspective focusing on the ‘core
competence’ logic of outsourcing (Halldorsson, Herbert, & Skott-Larsen, 2003). But these theories
can be supplemented by the emerge of the evolving relationship governance and/or the network
perspective (Halldorsson & Skjott-Larsen, 2006; Skjott-Larsen, 2000 ). The network perspective and
the agency theory can be used, not (only) for explaining the outsourcing decision, but also for
describing TPL buyer-supplier relationships and characteristics.
2.4.1 APPLYING THE AGENCY THEORY ON TPL RELATIONSHIPS
The agency theory isn’t discussed in previous sections yet. The agency theory focuses on contracts
and incentives as a mean to reduce goal divergence among different parties. The principal (the buyer
of TPL services) and the agent (the provider of TPL services) have conflicting goals because of
asymmetric information and their different attitudes towards risk. The agency theory has been
applied in logistics and in particular in the buyer-supplier relationship (Stock, 1997). For the principal
there are numerous risks related to a TPL relationship, such as the loss of control over logistics
activities, the inability in assessing the cost performance of the TPL provider and the uncertainty
about the continuity of services. From the agents’ perspective there are risks involved with making
specific investments necessary for the principals operations which can’t be transferred to other
clients of the agent (LaLonde & Cooper, 1989). There are four aspects of the agency problem that are
identified within the TPL buyer-supplier relationship (Logan, 2000). Outsourcers fear that they won’t
get the same high level of service that their in-house operators provide. Second, the principal might
fear that the agent will try to protect its margins. Third, there is an obstacle in establishing the
relationship since besides the principle, the agent also has the possibility to select its partner in
forming customer relationships. Fourth, if both the agent and principle wish to be guided by TCE and
the resource-based view this will lead to suboptimal relationships causing problems. But these
problems can be solved by ‘diagnosing‘the relationship (know of each other why you want this
relationship) and by designing contracts promoting an environment of trust. These contracts should
aim to overcome problems related to the loss of control, goal conflicts, the continuity issue and
specific investments since these problems all limit the scope of TPL principal-agent relationships
(Logan, 2000). The paper of Halldorsson & Skjott-Larsen (2006) is a case study of a new established
TPL relationship. In studying this relationship, much agency theory related problems, opportunities
and other related issues became visible. The letter of intent, which was replaced by a contract later
28

The strategic development of third party logistics providers
on, served as a safeguard for the agents specific investments made. The agent was trying to enter an
important business segment while the principal searched for cost reductions and a more efficient
supply chain. As a result of the fact that logistics services were outsourced, the principal gained a
better insight in the costs of logistics thereby better able to compare the costs with other TPL
providers. This particular relationship decided not to operate an open-book contract, the principal
tried to control the providers' service charges and this search of both players for optimizing their own
operations led to a sub-optimal relationship that was aborted after the contractual period. This
example, based on agency theory related difficulties, makes clear how difficult it is to establish a
relationship based on mutual trust thereby creating a win-win relationship for both parties.
2.4.2 APPLYING THE NETWORK PERSPECTIVE ON TPL RELATIONSHIPS
As the agency theory shows how difficult it is to establish a win-win relationship in the TPL industry,
the network perspective emphasizes and explains how successful and long-term TPL relationships
can be developed and evolve. The assumption underlying the network perspective is that individual
firms are dependent on resources controlled by other firms. Access to these resources can be
achieved by interacting with other firms: this is how and why networks develop over time. Firms
invest in relationships, thereby developing knowledge of their partners over time (Skjott-Larsen,
Third party logistics - from an interorganisational point of view, 2000). It’s the tendency of networks
that these relations become stronger over time. According to Johansson & Mattsson (1986) the
relationships between firms in a network develop through exchange processes and adaption
processes. Exchange processes include the exchange of information, goods, services and a wide
range of social processes/interpersonal communication. Through this exchange process the parties
develop mutual trust. Adaption processes include modifications of processes, systems and products
to achieve a more efficient allocation of resources in the network. This adapation process is
important because it strenghtens the bonds between the parties by specifing the relationship,
thereby giving their relationship a long-term character. A network is a dynamic entity, changing over
time by efforts to creater a better competitive postion (Skjott-Larsen, 2000). A network never just
exist between a TPL provider and a TPL buyer: their partner also has other partners it works with.
European TPL firms often act as a mediator between their client and various haulage and
warehousing companies, which implement the fysical part of transport and warehousing. The
network theory states that the firms relationships with other companies are its most valuable asset.
The invisible assets, such as tacit knowledge, are hard to copy and thus are of strategic importance
(Nelson & Winter, 1982). If the network stops existing, these invisible assets also dissapear (Skjott-
29

The strategic development of third party logistics providers
Larsen, Third party logistics - from an interorganisational point of view, 2000) and this is why network
relations can remain stable over time.
2.4.3 CURRENT STATUS OF TPL RELATIONSHIPS
In the year 2000, van Laarhoven et al. (2000) stated ‘’logistics still does not seem to be on the agenda
of top management’’ (p. 7). As previously stated, logistics activities are often subject to ‘outsource or
in-house’ decisions. In 2000, the most important reason for outsourcing logistics was cost reduction,
at a distance followed by service improvement (van Laarhoven et al., 2000). But this situation is
maybe changing; logistics is increasingly seen as a factor influencing a firm’s competitive position.
The focus is shifting from simple make-or-buy decisions, motivated by the opportunity for cost
reduction, to more strategic considerations such as service improvements and efficient transactions
(Skjott-Larsen, 2000). According to Skjott-Larsen (2000) the development of third party logistics must
be seen in this light. Langley and Capgemini (2010) found out that 65% of the shippers surveyed were
increasing their use of TPL services. According to Rahman (2011), more Australian firms are starting
to use TPL services. Besides that, the scope and depth of the relationships are increasing. Rahman
(2011) states that the ‘’decisions to use outsourced logistics functions are becoming the realm of the
corporate decision making, rather than the divisional or local level.’’ (p. 18). As evidence for the
increasing scope of TPL relationships, van Laarhoven et al. (2000) found that the number of activities
included in a partnership gradually increases as the partnership progresses over time. That there is
no agreement on this point is clarified by the 2010 15 th annual third-party logistics study by Langley &
Capgemini (2010). According to this study ‘’shippers continue their tendency to outsource
transactional, operational, and repetitive activities and less so those that are strategic, customer-
facing, and IT-intensive’’ (p 4).
In 1998, the most common contracts in Europe were three years in length and included specific
review periods which could extend the contract period (Peters, Cooper, Lieb, & Randall, 1998).
Fifteen out of sixteen companies reported one-third of their contracts including performance based
elements (Lieb & Lieb, 2010). Rahman (2011) reports an increasing trend towards using shorter
contract, which is supported by surveys in Australia (Sohal, Millen, & Moss, 2002) and the US, which
link this phenomena to the economic volatility of global markets (Langley & Capgemini, 2009). About
75% of the surveyed companies use more than one TPL provider. Explanations for this fact might be
that buyers like the possibility of a safety net or the possibility that most TPL providers used only
provide some specialized services like warehousing, or value added logistics etc. instead of the whole
range of TPL services (Rahman, 2011). According to Bowersox et al. (1989), entering closer and more
efficient relationships has led to the reduction of the number of TPL providers used by shippers. 46%
30

The strategic development of third party logistics providers
of all shippers surveyed in 2010 were consolidating or reducing the number of TPL providers they use
(Langley & Capgemini, 2010). According to Peters et al. (1998) the client base of European TPL
providers is quite varied, both in firm size and revenue related. The client base was mostly biased
towards either smaller or larger clients.
Are TPL providers becoming increasingly more customer selective? If they do so, their most
important reason for doing so would be the search for higher margins. The economic slowdown and
lower profitability made a number of large TPL providers to focus on the quality of existing accounts.
This raises questions about the characteristics of high-quality customers. By far the most frequently
cited attribute was willingness to establish a collaborative working relationship with the provider.
Keywords mentioned in relationship with this characteristic were partnership, fair and equitable,
win-win, long-term, and willingness to allow you to make a reasonable return. The next most
important attribute was having global logistics requirements. Other characteristics mentioned were
financial strength, significant growth prospects, and a good fit with the provider’s industry focus.
(Lieb R. C., 2005) According to Peters et al. (1998), reference from existing customers is the most
important method of finding new clients. About 80% of TPL providers use existing customers to get in
contact with their customers’ supply chain partners. This is successfully done since this generates in
excess of 37% of their logistics revenues (Lieb & Lieb, 2010). According to this subchapter on TPL
buyer-supplier relationships, the following sub-question is formulated:
“How can TPL relationships be characterized?”
2.5 THE GEOGRAPHIC SERVICE AREA OF TPL PROVIDERS
How important is geography and the location of the country of origin for TPL providers markets,
focus and growth potential? A few years ago companies massively off shored some of their
(manufacturing) activities to lower wage countries. But in response to rising labor and material costs
in these countries and the volatility of oil prices (influencing transportation costs) some
manufacturing activities of American companies are being brought back to either North or Central
America (Lieb & Lieb, 2009). This phenomenon is called near shoring and 88% of the providers CEOs
surveyed in 2010 witnessed this development: an average of 13% of their major clients was
participating in this movement (Lieb & Lieb, 2010). Another possible explanation for the rise of near
shoring, besides cost related arguments, could be that customer fulfillment is increasingly seen as
more important over low-cost sourcing (Burnson, 2010). This development could have several
implications for TPL providers’ business development and the academic discussion on global logistics.
31

The strategic development of third party logistics providers
According to some, the base of globally operating third parties is now rapidly growing (Boyson, Corsi,
Dresner, & Harrington, 1999). In 2008, the CEO’s responding once again selected further expansion
of international services as the most significant opportunity for TPL providers in North America (Lieb
& Lieb, 2008). Surprisingly, in 2009 and 2010 this expansion of international services wasn’t among
his top 5 of mentioned opportunities for the TPL industry. Peters et al. (1998) found empirical data
on the development of European operations by American TPL providers clarifying that there are just
a few of those companies present in Europe. A survey conducted under 137 TPL providers in The
Netherlands and Belgium revealed that about 80% of turnover is realized within Northwestern-
Europe and thus in de direct proximity of the respondents (van Hoek R. I., 2000). This seems to
indicate that TPL providers don’t have an actual global focus. Given the nature of the service
provided and the fact that buyers of TPL services want access to new markets through TPL providers’
network, TPL firms would expected to internationalize through their customers. Peters et al. (1998)
argues that:
the global expansion of the European TPL industry is not surprising. Providers in this industry
are often urged by their larger customers to expand into foreign markets to support the
customers' international sourcing and distribution activities. The reward for doing so is
generally contracts in those countries; the penalty for not expanding into those countries is
often the loss of the domestic account. (p. 5)
In this way both parties involved could contribute to each others’ international development. But in
practice, this isn’t happening. Most studies conducted show that firms use different providers in
different regions since no firm can really operate and cover the whole world with high quality. The
extent in which TPL providers can use their international partners for providing worldwide services
also influences the degree of internationalization TPL providers (Hertz & Alfredsson, 2003).
Summarizing, geographical limitations still seem to play a vital role in developing business. Maybe
regional awareness is just an important asset as knowledge/experience of a TPL provider servicing a
certain industry. TPL providers sometimes agree certain buyer-supplier relationships for other
reasons than the highest margin. Providers could wish to acquire a position in a certain segment or
industries’ supply chain for obtaining specific knowledge and experience about that market, which
can be marketed later on thereby developing their business. The same could be true for entering
certain regions. Following the literature related to the geographic service area of TPL providers, the
sub-questing listed below is formulated:
‘’What is the geographic service area of TPL providers?’’
32

The strategic development of third party logistics providers
2.6 TPL PROVIDERS’ CAPABILITIES AND THE ROLE OF PATH DEPENDENCY
Capability is a bit of a vague term. According to Dosi, Nelson & Winter (2000) to be capable of some
thing is to have “a generally reliable capacity to bring that thing about as a result of intended action.
Capabilities fill the gap between intention and outcome’’ (p. 17). Research on capabilities is an area
mostly studied from the ‘buyer side’ of TPL services. The network model states that through a firm’s
persistent interaction with other actors, valuable new resources and skills for the firm can be
developed (Skjott-Larsen, Third party logistics - from an interorganisational point of view, 2000).
There are three different ways of learning described for TPL providers. First, a company can learn
through experimentation: learning by doing. A company can also use the knowledge and experience
of the counterparty. Besides that, joint learning is a possibility: learning based on several players’
knowledge and experimentation (Haakansson, 1993). As learning by doing is obvious and doesn’t
need any further explanation, the other two ways of learning will be briefly illustrated. Using the
knowledge and experience of the counterparty (the buyer of TPL services) can be very worthwhile.
The sharing of knowledge between buyers and providers can result in ‘copying’ of the buyer’s
competencies by the provider which can also be used for other clients of the TPL provider.
Competence development through joint learning is somewhat different since neither party already
possessed the experience and knowledge obtained by working together. After completing the
learning process through working extensively together, since the knowledge and experience of both
parties is needed to fulfill their common goal and develop capabilities, the new obtained capabilities
can be used on other clients of the provider thereby enlarging their possible sales areas. So external
alliances can be an addition to internal learning instead of solely being a mean to reduce transaction
costs (Dosi et al., 2000).
Competences can only generate rents if they are based on a collection of knowledge, experience,
skills and assets that are difficult to imitate. Firms wanting to achieve and sustain competitive
advantage can do so by developing strong ‘dynamic’ capabilities. The term dynamic refers to the
ability to renew competences, thereby making this congruence with a changing customer demand
(Teece, Pisano, & Shuen, 2000). According to Teece et al. (2000) the term ‘capabilities’ ‘’emphasizes
the key role of strategic management in appropriately adapting, integrating, and reconfiguring
internal and external organizational skills, resources, and functional competences to match the
requirements of a changing environment’’ (p. 337). Competences and capabilities are common used
interchangeably (also in this thesis) because of the difficulties to distinguish these terms, but given
the above quote capabilities have a slightly larger coverage than competencies. However, fields of
competence are influenced by choices made in the past. A firm’s history matters, since its previous
33

The strategic development of third party logistics providers
investments made in their capabilities ‘as a firm’ also constrains its future. Firms make long term and
quasi-irreversible commitments to certain fields of competence. The path they followed in the past is
also limiting future paths: this phenomena/theory is called path dependency (Teece et al., 2000).
Following the literature reviewed concerning organizations’ capabilities and how these are
influenced by path dependency, I am curious in how and to what extent TPL providers learn from
existing client relationships. According to Hertz & Alfredsson (2003) references from existing clients
are extremely important, besides the fact that existing clients develop the knowledge and capabilities
of the TPL provider. How do they use the capabilities earned by serving past and current clients for
achieving competitive advantages in the future? Are TPL providers largely shaped by their first client?
According to Herz & Alfredsson (2003) ‘’ the importance of the first customer led many of the TPL
firms to develop in many directions without a clear focus’’ (p. 147). I wonder to what extent
opportunistic behavior that possibly took place in the past influences current and future business
developments. To what extent are lock in effects and switching costs relevant concepts for TPL
providers? Summarizing, I am interested in the relevance of path dependency for TPL providers and
their organizations’ capabilities and future strategic orientation. The following sub-question is
formulated:
‘’ To what extent are TPL providers’ capabilities influenced by path dependency?’’
34

The strategic development of third party logistics providers
2.7 CLIENT SPECIFIC INVESTMENTS
By making client specific investments TPL providers’ services can become of greater strategic
importance for their clients. According to Skjott-Larsen (2000), TPL arrangements are more than a
means to cost efficiency: it is also a way to create competitive advantage through increased flexibility
and service. Van Laarhoven et al. (2000) found that the assets of the surveyed European TPL
providers were dedicated to a large extent to the shipper. On a scale from 1 (‘’virtually all assets
shared’’) to 5 (‘’virtually all assets dedicated’’) the average ‘score’ for personnel was 3, 3. They also
found a relation between the level of ‘dedication’ of assets and the importance of cost reduction as a
driver for the outsourcing decision. Not surprisingly, ‘the dedication score’ of assets was higher in
relationships in which other reasons than cost reduction (like service improvement) were being the
driver of the relationship (3, 5 versus 3, 1). Skjott-Larsen (2000) conducted a case-study among three
companies starting to largely outsource their logistics activities to different TPL providers. In these
cases, the TPL providers made no physical asset-specific investments. On the contrary, large
investments in human specific assets were made by the involved TPL providers. The study concluded
that investing in human resources is very important in making third party arrangements successful.
On the contrary, only 30% of the questioned TPL providers’ CEOs reported offering joint
implementation training programs involving employees of both companies (Lieb R. C., 2005).
Figure 8 Relationship between shipper and TPL provider (source: Bowersox, Daugherty, DroEge, Rogers, & Wardlow, 1989)
The relationship between buyer and seller of logistics functions can be placed on a continuous scale,
going from single transaction to integrated service agreements, as shown in figure 8 (Bowersox,
Daugherty, DroEge, Rogers, & Wardlow, 1989). Starting from the left, single transactions corresponds
to the traditional relationship on the transport market. The agreement is short term and carries no
35

The strategic development of third party logistics providers
commitment apart from the specific investment. The degree of commitment and integration
increases when moving to the right. In the partnership agreement, the provider gives standard
solutions to the clients demand. Third party agreements are more tailored to the request of a client:
these contracts require specific investments by the TPL provider in equipment or skills (training
employees). Integrated service agreements include the taking over of the whole management of
logistics processes of the shipper by the TPL provider. The TPL provider makes specific investments,
like inter-organizational teams of employees and often integrates the parties’ IT systems. These joint
teams spent about 80% of their time on solving problems (van Laarhoven et al., 2000). Besides that,
they will provide some value-adding services (Bowersox et al., 1989).
As stated by Skjott-Larsen (2000), ‘’transaction cost analysis (TCA) explains the conditions under
which third party agreements become preferable to the classical choice between market and
hierarchy’’ (p. 16). According to Williamson (1979) asset specificity is a main feature of the
transaction. A specific investment has limited value when used in alternative applications. There can
be various specific physical assets but also specific human assets are included (Williamson, 1985).
Making transaction specific investments creates mutual dependency, since the TPL buyer is also
bound to use the providers’ equipment. That is why the market is to be preferred when assets are
nonspecific: price is the only adjustment mechanism between supply and demand thereby
preventing excessive rents. But if performance is difficult to measure, the shipper could choose to
internalize its logistics thereby lowering the possibility of a TPL provider to perform opportunistic
behavior (extract excessive rents compared to the service level). Investing in medium-specific assets,
assets that can be used by various companies and thus provide scale economies, is interesting for TPL
providers. This is because economies of scale are combined with a specific asset/service thus
ensuring higher margins (Williamson, 1985). As mentioned before, the transaction cost theory is
based on two behavioral assumptions, namely bounded rationality and opportunism. Transaction
costs can be characterized by four dimensions: frequency, uncertainty, complexity and (asset)
specificity. If transaction costs are low, the transaction should be purchased in the market. But with
the rise of transaction cost, the demand for specific investments is rising. In the end, activities will be
internalized. I am curious to what level of asset specificity it is profitable for TPL providers to make
transaction/client specific investments. What kind of (and to what extent are) client specific
investments do TPL providers make? Are they focusing on physical investments, IT systems, or
employees/human skill related investment? The following sub-question is formulated:
‘’ What client specific investments do TPL providers make?’’
36

The strategic development of third party logistics providers
2.8 CUSTOMER ADAPTION VERSUS OFFERING GENERAL SERVICES
Already in 1999, a reasonably clear segmentation in terms of strategic differentiation was emerging
(Berglund et al., 1999). The TPL providers could be segmented into two dimensions. The first
dimension is formed by service providers. Service providers focus on a few standard services thereby
aiming at economies of scale. The second dimension consists of solution providers. Solution
providers focus on a few industries, taking over the whole logistics process and thus have to
customise their services. Berglund et al. (1999) compared both segments with eachother on multiple
key figures. They found that the average revenues per contract and per employee were substantial
lower for service providers compared to solution providers.
In the beginning of the 1990, some European TPL providers failed to properly brand their services
despite their efforts to please all (potential) customers with all types of services in all logistics
operations (Cooper, Lambert, & Pagh, 1997). This led to fast increasing costs and diffused and
dissatisfied customers. Inefficiencies, as described in the grey triangles of figure 9, occurred in two
situations: by providing complex services in a loose customer relationship or by providing simple
services to a customer with who the TPL provider has a close relationship (Bask, 2001). To make the
TPL buyer-supplier relationship efficient, three different efficient services can be distinguished:
routine services, standard services and customized services (Makelin & Vepsalainen, 1990). Routine
TPL services are volume-based, founded on scale economies, and include services like transportation
and warehousing. Standard TPL services contain relatively easy customized services, like air-
conditioned transport combined with
scheduled order picking in the warehouse
thereby preventing the ‘melting’ of the
goods during transition. Customized TPL
services include services which hold high
transaction costs and thus are often
performed in long time contracts.
Customized services are founded on scope
economies. These services typically consist
of different forms of postponement services, like final assembly, repair services or after-sales (Bask,
2001).
37
Figure 9 Efficient TPL services (source: Makelin & Vepsalainen, 1990)

The strategic development of third party logistics providers
38

The strategic development of third party logistics providers
There appears to exist a
strategic frontier, as shown
in figure 10. The depth of
the customer relationship
and the degree of customer
adaption has a negative
impact on the general
capabilities of the TPL
provider and vice versa.
This situation causes a strategic frontier. The meaning of this strategic frontier is that a TPL provider
can’t have high axis values on both. When having a deeper customer relationship, this will decline
the actual number of clients you serve. But, such as the arrow indicates, TPL providers try to become
better in both fields. From a strategic perspective, positioning along this strategic frontier involves
how and where the TPL providers want to target a market and compete (Hooley & Saunders, 1993).
Hertz and Alfredsson (2003) describe the strategy of logistics service providers in terms of their
problem-solving ability compared to customer adaption. According to Halldorsson and Skjott-Larsen
(2004) outsourcing relationships represent a process in which competencies are developed according
to the requirements of the relationship. These views are based on a competence-based strategy:
focused on intangible assets and capabilities which can provide solutions for creating value to
customers (Juga, Pekkarinen, & Kilpala, 2008). Continuing with Hertz and Alfredsson (2003), in figure
11 they classified TPL providers according to abilities of general problem solving and customer
adaption. The division of TPL providers based on the previously mentioned dimension gives the
following classification: standard TPL provider, service developer, customer adapter and customer
developer. At first the standard TPL provider is discussed. This type of TPL provider has a relatively
high problem solving ability and customer adaption. This is a supplier of standardized services like
warehousing, distribution and order picking: their customers are offered their own relatively simple
combination of standardized services. The service developer also has a relatively high score in
customer adaption, but scores high in problem solving general ability. The service developer focuses
on developing a large variety of services which their customers can combine according to their
demands. A advanced IT system facilities these complex (combined) service offerings, thereby aiming
at servicing as many clients as possible thus creating economies of scale and scope. The customer
adapter, scoring high in the customer adaption dimension and relatively high in its general problem
solving ability, doesn’t actually makes much development in services. They take over the customers’
existing logistics activities and try to improve total efficiency. These TPL providers rely on a few very
39
Figure 10 Customer orientation and system efficiency: a trade off? (Source: Nijdam, 2011)

Figure 11 TPL providers classified according to abilities of general problem solving and customer adaption (source: Hertz & Alfredsson, 20003)
The strategic development of third party logistics providers
close customers. The same can be said about Customer developers, although their problem solving
ability and customer adaption scores are both high. The customer developer is the most advanced
form of the classification: these TPL providers develop advanced customer solutions for each
customer. Because of their knowledge
bases activities and tight relationships
with each customer, the number of
customers is limited. The customer
developer is also known as fourth party
logistics provider (Hertz & Alfredsson,
2003).
The division made by Hertz & Alfredsson
(2003) further stresses the relevance of
the strategic frontier: the existence of a certain tradeoff between general capabilities/services and
customer adaption. It becomes more relevant to balance between the two dimensions once the TPL
business and the number of clients is growing. According to Lieb & Lieb (2008), the TPL industry is
increasingly merging, in the end leaving just a few large providers and many small specialized en
niche providers. Developing niches seems a way to increase customer adaption (Hertz & Alfredsson,
2003). Following the rise of the 4PL providers, it seems that TPL providers should adapt more and
more to their customers, which would mean they industry making a shift towards the category of
customer developer. Juga, Pekkarinen, & Kilpala (2008) did research during 2003/2004 on the
strategic positioning of logistics services providers in Finland. They found that most companies were
positioned in the mid-zone. They balanced their approach by aiming at competence development
instead of focusing exclusively on either service-oriented or customer-oriented competencies. This
generalist strategy may be caused by the fact that in a small country such as Finland there is limited
demand for specialized services (Juga, Pekkarinen, & Kilpala, 2008). Relating to the above literature,
the following sub-question was formulated:
‘’ How do TPL providers balance between offering general services and their ability for
customer adaption?’’
2.9 ENVIRONMENTAL AWARENESS IN THE TPL INDUSTRY
40

The strategic development of third party logistics providers
‘Being green’ and ‘sustainable’ are hot topics recent years. The car industry marks their cars with all
kinds of labels, promoting their cars as if they are actually helping the environment. Other companies
are involved with ‘green operations’, like shortening their supply chain, for which help of TPL
providers is usually requested (Lieb & Lieb, 2010), or keeping sustainability and social responsiveness
in mind when taking their sourcing decisions. In that context, it seems obvious that the transport
and logistics industry is also engaged in environmental entrepreneurship. Some examples that they
are actually engaging in this movement are the development of carbon footprints, showing the
environmental impact of the transportation of the shippers’ goods. Or the fact that truck fleets are
renewed and become ‘greener’. Good examples of such initiatives are electronic city freight trains
servicing customer’s downtown and the Longer and Heavier Vehicle Combination (LHV), also known
as Ecocombi. The Ecocombi is a truck that can carry more cargo than a conventional truck
combination. Because the fuel usage of an Ecocombi barely increases compared to a conventional
truck, transporting goods by Ecocombi can save up to 30% on fuel, helping the TPL provider and the
environment at once. Last but not least, the government is promoting sustainable operating as can
be seen from the fact that the Dutch government legalized the Ecocombi after an extensive testing
period. Besides that, the European unions’ white paper 2011 roadmap for a competitive and
resource efficient transport system most important goals are promoting intermodal transportation
and to reduce emissions by 60% by the middle of the century (European Commision, 2011).
The literature on the TPL industry is not discussing the environmental awareness within the industry,
except for the surveys Lieb & Lieb conducted during 2008-2010, surveying among the North
American third party logistics industry. According to Lieb & Lieb (2010), their research on
environmental sustainability clearly show TPL providers made significant commitments to ‘green
goals’, both for themselves as by helping their client’s reach similar goals. 50% of the surveyed CEOs
believe that their companies’ sustainability differentiate it from their competitors. An often used tool
to become ‘green’ is the establishment of formal company sustainability groups, to ensure the item is
on the agenda (Lieb & Lieb, 2010). How do Dutch TPL providers look at this trend? Is it a way to
develop their business, and if so, how do they give shape to this policy? Relating to the above
literature, the following sub-question was formulated:
‘’ Is being environmental sustainable a way to develop business?’’
2.10 VALUE ADDED LOGISTICS
41

Figure 12 Range of value added services offered by TPL providers (source: Nijdam, 2010)
The strategic development of third party logistics providers
According to Berglund et al. (1999), ‘’the challenge that providers face is to provide their customers
with services that add more value to their customers’ business than that the customers would be able
to achieve themselves’’ (p. 65). As can be seen from this citation, value adding logistics is a wide term
and probably entails a large variety of value adding services. The most obvious form of services
seems to be the most valued. According to Rahman (2011), the increase in the extent of the use of
TPL services in Australia could reflect the expansion of warehouse-related services offered in addition
to classical warehousing functions. Another explanation for this increase could be that the costs of in-
house warehouse operations are rising: there is evidence that out of all TPL services, outsourcing
warehouse activities provides the greatest cost-benefits (add the most value) for TPL buyers (Lieb &
Bentz, 2005). But how do TPL providers achieve in creating value? TPL providers have to achieve
higher operational efficiency then their customers. By sharing resources between customers, such as
operating a warehouse for multiple customers, economies of scale can be achieved. By vertical- or
horizontal integration, the TPL provider outsourcing some of its activities, more scale and scope
economies can be found. That’s why some TPL providers’ prefer to be non-asset based, hiring
transport, warehousing and manufacturing companies to operate some activities for them. The
fourth way to develop extra value is by improving their customers’ supply chain. Supply chain
optimization, integration or supply chain management or often used terms which describe the TPL
providers efforts, based on excellent logistics knowledge, for creating value (Berglund et al., 1999).
It is interesting to see the range of value adding services provided by TPL firms, of which a few
examples are listed in figure 12. The services portfolio of TPL providers becomes wider, as mentioned
TPL providers increasingly try to act as logistics consultants for their clients. Besides that, chapter
2.11 is about TPL providers efforts to capture a larger part of the supply chain. All these
developments and industry dynamics explain
TPL providers expand their service to include
sophisticated IT driven supply chain
management, consulting, manufacturing and
financial services (factoring etc.). Nevertheless,
there seems to be weak demand for such
services, since most clients perceive such
activities are too important to outsource (van
Hoek & Dierdonck, 2000; Langley & Capgemini,
2010; Lieb & Bentz, 2005; Lieb & Kendrick,
2003). Hard data in this regard are convincing:
on average, 54% of shippers’ total expenditures on logistics was spend on transportation.
42

The strategic development of third party logistics providers
Warehousing costs represented 40%, leaving just 6% for other value added logistics (Langley &
Capgemini, 2010). The apparantly present mismatch between demand and supply of value adding
services can be explained by the fact that, over the last nine years, several studies documented a gap
between the importance shippers place on the IT capabilities of the TPL provider and their
satisfaction with those capabilities; the IT capability gap. Although continuous investments are still
needed, the IT capabilty gap narrowed for the first in ten years (Langley & Capgemini, 2010).
Following the literature related to the value added services of TPL providers, the sub-questing listed
below is formulated:
‘’Which value adding services are offered and what is their role in developing business?’’
2.11 CAPTURING THE SUPPLY CHAIN
Supply chain management strategies are vary varied in method, but their intentions are all the same:
satisfying customer needs by reducing cost and uncertainty (Boone, Craighead, & Hanna, 2007).
Companies can create value by sharing knowledge, placed orders and resources, thereby lowering
costs and increasing efficiency (Doz & Hamel, 1998; Skjott-Larsen & Thernu, 2003). This reasoning
also explains the strategic alliances between manufacturing firms and global LSPs hence aiming at
enhancing their competitive position by utilizing each other’s competences (Bhatnager &
Viswanathan, 2000). This initiative is called ‘’advanced third party alignment’’, TPL providers
bypassing their weaknesses in manufacturing by partnering with industrial subcontractors, is another
characteristic development (van Hoek R. I., 2000). The first national supply chain monitor showed the
Netherlands still has a significant step to take to achieve such advanced supply chain management.
Although supply chain optimization isn’t a new phenomenon, the sub-optimization ‘ghost’ is still
present, each part of the chain trying to optimize its own operations thereby losing the big picture,
and numerous advantages, out of sight (BLMC, 2011). According to BLMC (2011), the obsessive focus
of shippers on costs hinders its relationship with TPL providers; there is no money reserved for
supply chain optimizing since the only numbers looked at are the rates of isolated services. According
to Jayaram & Keah (2010) this isn’t so strange, since they found that appropriate actions must be
taken to ensure the effectiveness and involvement of TPL providers in supply chain management;
including TPL providers into supply chain integration efforts is no guarantee for success.
These observations contradict the findings of several other students. According to Bask (2011), there
has been a movement of growing importance for TPL providers to provide logistics strategy solutions
for their customers in a more efficient way. Lieb & Lieb (2010) found that expansion of integrated
43

The strategic development of third party logistics providers
supply chain management services was identified as the second most important opportunity for
company growth in 2008 and 2009; in 2010 this opportunity was ranked third. Over the past years
many companies have tried to shorten their supply chains, aiming at service level improvement and
reducing costs. An average of 23% of all major customers of American TPL providers shortened their
supply chain in recent years. The implications of this development for TPL providers can be both
positive and negative: surveyed CEOs identified implications such as the reduction of company
revenues related to freight forwarding and customs clearance and the increased demand for
handling smaller shipments at higher velocity (Lieb & Lieb, 2009). A much discussed issue in relation
to the TPL providers changing role in the supply chain is postponed manufacturing; this is seen as a
opportunity to develop business (Chiou, Wu, & Hsu, 2002; van Hoek, 2000; Yang, Burns, &
Backhouse, 2004; Rabinovich & Evers, 2003; Su, Chang, & Ferguson, 2005).
According to van Hoek (2000) ‘’it can then be expected that manufacturing will increasingly involve
the contribution of TPLs for specific customizing initiatives, assuming that the supply chain is
integrated further and further, across functions and companies’’ (p. 386). Several studies performed
in the nineties found that TPL providers’ were involved in relatively simple customizing activities, like
packaging. But according to van Hoek (2000), supplementary services were already considered a
future development area back in 2000. Mass customization is coming to the forefront of
international supply chains and postponing product finalization is a method for achieving
customization (van Hoek, 2000). Many organizations are changing their supply chains to
accommodate mass customization processes thereby improving product offerings (Su, Chang, &
Ferguson, 2005). Despite TPL providers’ traditional role in the supply chain, TPL providers are
targeting postponement as an extension of the services. A huge advantage of applying postponed
manufacturing in the supply chain is the fact that the customer is close by and can be served rapidly
(van Hoek R. I., 2000). The wish to lower inventory risks and logistics costs made organizations use
the different postponement methods (Chiou, Wu, & Hsu, 2002). The most known methods are
described by Bowersox and Closs (1996). According to them, postponed manufacturing is a
combination of form, time and place postponement. Form postponement is postponing final
manufacturing; by applying form postponement manufacturers hope to lower the amount of
obsolete goods (Rabinovich & Evers, 2003). Time postponement refers to the delaying of the forward
movement of goods till customer orders have been received; place postponement is the positioning
of inventories upstream thus in centralized manufacturing or distribution sites before continuing its
downstream voyage to the final customer. This system of postponed manufacturing and mass
customization is 100% opposed to push systems in which goods are manufactured in expectation of
future orders and are stored downstream the supply chain (van Hoek, 1997). Postponed
44
The strategic development of third party logistics providers
manufacturing does hold advantages over push systems since higher service levels and lower
operating and inventory costs can be achieved (Bowersox & Closs, 1996). Summarizing, the ‘typical’
supply chain format is changing. As figure 13 shows, manufacturing doesn’t just take place at the
manufacturer, but also further downstream the supply chain, enabling the TPL provider to try and
capture this business
Figure 13 Changing supply chains (source: Nijdam, 2011)
45

The strategic development of third party logistics providers
Figure 14 TPL providers’ shifting tasks in the supply chain (source: Nijdam, 2011)
But what is the exact reason for the increased interest in postponement? Some believe the rise of e-
business is a key driver (Yang, Burns, & Backhouse, 2004). But most like this evolution is caused by
many factors, such as growth in competition, more product varieties, a shorter product life cycle and
more demanding customers (Boone, Craighead, & Hanna, 2007). The interest of TPL providers for
providing postponement driven services is clear. According to van Hoek (2000), TPL providers started
offering customization services, since this part of the supply chain has higher value-added activities
and thus yields higher margins in comparison to distribution and storage. This argumentation is
graphically shown in figure 14. According to this subchapter on TPL providers’ greater influence on
the supply chain, the following sub-question is formulated:
‘’How do TPL providers try to get hold of a larger part of the supply chain?’’
46

The strategic development of third party logistics providers
3 METHODOLOGY
After explaining the setting and framework of this research, this chapter describes the method of
data collection and data analysis. In this way, the results of this research can be correctly interpreted.
3.1 SETTING AND FRAMEWORK OF THE RESEARCH
As mentioned before, after studying business logistics and supply chain management literature,
various sub-questions arose. These sub-questions give answer to the research-question, all from a
different angle. This part consists of the survey framework, which is schematically shown in figure 15.
By answering the various sub-questions, discussed within the theoretical framework, the answer to
the question how Dutch TPL providers develop their business will be found. To summarize, this
survey framework forms the basis for understanding the development of TPL providers.
Figure 15 Schematic representation of the survey framework
47
“How do third party logistics
providers in the Netherlands develop their business ?”
‘’Which value adding services are offered and
what is their role in developing business?’’
‘’How do TPL providers try to get hold of a larger
part of the supply chain?’’
‘’ How do TPL providers balance between offering general services and their
ability for customer adaption?’’
‘’ To what extent are TPL providers’
capabilities influenced by path dependency?’’
‘’What is the geographic service area of TPL
providers?’’
“ How can TPL relationships be characterized?”
‘’ Is being environmental
sustainable a way to develop business?’’
‘’ What client specific investments do TPL providers make?’’
The strategic development of third party logistics providers
3.2 METHOD OF DATA COLLECTION
To give answer to the various sub-questions discussed within the theoretical framework, a survey
was conducted. A questionnaire was developed, consisting of fifteen statements and twenty-eight
closed questions. The questionnaire is designed so that each sub-question can be answered using the
questionnaire responses. Because the main goal of this research is to describe how Dutch TPL
providers develop their business, the aim was to collect as much responses from Dutch TPL providers
as possible. Because of the wide scope of the research, the most appropriate research method
seemed to be an (online) questionnaire. Obtaining data through an online questionnaire holds many
advantages. It is, for example, fast, cheap, user friendly (for both the respondents as for the
researcher), it’s possible to establish relatively long questionnaires and the responses are fast
processed and analyzed. Besides that, the anonymity of the respondent is safeguarded: sensitive
commercial information concerning business strategy will remain confidential. These advantages
outweigh the disadvantage of not having the possibility to ask for more in-depth information.
Conducting in depth interviews was considered, but put aside since no general conclusions can be
drawn about the entire target group by applying this research method. This way of data collection
would also have cost too much time. Conducting telephonic research was also considered, but this
method was rejected since this method is more suitable for relatively easy questions and short
questionnaires and because of the causation of irritation by the target respondents about this
research method. Summarizing, obtaining data through an online questionnaire seemed the most
suitable for this research. A disadvantage of the chosen research method is the relatively low
response rate, but this was partially offset by sending a part of the respondents, which will be
discussed later on, a paper version of the questionnaire accompanied by a covering letter and reply
envelope. The paper version of the Dutch questionnaire including the covering letter can be found in
appendix 1.
The goal was to maximize the number of respondents, since the more respondents, the more value
can be attached to the research results. To obtain as much response as possible, the appropriate
companies should be noticed. I thought the best way to get some attention for the research was by
trying to get help from Transport and Logistics Netherlands (hereinafter TLN). TLN is the largest and
leading advocate/interest group in the freight and logistics services. TLN represents more than 6.000
of its members interests (TLN, 2011). TLN was very helpful in bringing this research under the
attention of the appropriate (potential) respondents. They did this through several ways. First of all, I
wrote a promotional text including a link to the online questionnaire which was included in the
biweekly newsletter of TLN. This newsletter (logistics club no. 27) was sent to all TLN members. The
promotional text including the link to the questionnaire was also placed on the TLN website, under
48

The strategic development of third party logistics providers
the headers logistics and technique > strategy. Besides that, an email was sent to a distinct group of
TLN members: the Physical Distribution Group. The physical distribution group consists of fifty-three
members engaged in logistic activities and operating at least fifty transport units. Two weeks after
sending the email calling for corporation with the research, the members received a paper version of
the questionnaire accompanied by a covering letter and reply envelope. This was sent by TLN on TLN
marked paper because this was thought to be raising the response rate. This way one could choose
how to complete the questionnaire: on paper or online. Because of the risk of overkill, no reminder
email was sent. Two weeks after sending the paper version of the questionnaire, the submission
period was closed.
Besides through TLN, I also raised awareness and asked for respondents participating in this research
by LinkedIn. I posted promotional texts including a link to the online questionnaire in several groups
pages related to the subject. I did this for about a month and made sure my contribution stayed on
top of those group pages, clearly visible for all group members. By posting several times, members
were also notified by LinkedIn through an email about new ‘discussions’ taking place on the group
page. The groups used are Supply Chain Magazine, Jong Logistiek Nederland, EVO Supply Chain
Management Network, Managed Innovative Logistics, Transito, delaatstemeter.nl, logistieke
vactures, Nieuwsblad Transport and Transport & Warehousing Zuid-Nederland.
All these efforts finally resulted in twenty-seven responses from Dutch TPL providers. Two
questionnaires were incompletely filled, but because of the total number of responses and the fact
that both respondents answered at least 75% of all the questions asked, both responses are included
in the results. Responses other than from TPL providers or responses with an entry rate of less than
75% were removed. The total number of reached potential respondents is (off course) unknown.
Only the response rate of the members of the Physical Distribution Group on the paper
questionnaire can be measured, out of fifty-three companies approached nine companies returned
the questionnaire, therefore the response rate is 17%. The responses collected online couldn’t be
traced to a certain way of data collecting (through TLN website, email, newsletter or LinkedIn).
49

The strategic development of third party logistics providers
3.3 METHOD OF DATA ANALYSES
The results of the twenty-seven responses on the questionnaire were imported into SPSS (Statistical
Package for Social Sciences) to be further analyzed. The questionnaire contains several questions on
different statistical measurement levels. The measurement levels used for the questions are nominal,
ordinal and ratio (Field, 2009). Nominal means that the value that a variable can take only has a
‘name’, there’s no order in these ‘names’. An example of such a question is the question in which the
TPL provider is asked which of the four descriptions fits best to his company profile. Ordinal means
that there is order in the variables, but the difference between variables is not equal. This is the case
for the statements that can be answered on a 1 to 5 scale, ranging from totally disagree to totally
agree (on which 2 is not the double value of 1). Ratio means that the variables obtained always have
a zero value (like miles per hour etc.). A good example of such variable is the question about which
percentage of all TPL contracts contains environmental agreements/targets.
Due to the form and method of questioning applied, statistical analysis is performed using cross
tables. Relationships between variables will be tested by cross tables at the lowest measurement
level of the two variables involved. This will be further explained below. Isolated variables will be
analyzed by interpreting the percentage breakdown and by the use of measures of central tendency.
These measures of central tendency are better known as the median, mean and mode (Field, 2009).
The mode is the observation with the highest frequency. The Median is the middle observation after
ranking the observations. The median can thus not be found on a nominal measurement level, since
the nominal variables are not ranked. The mean can only be used for calculating the average value on
a ratio (or interval) measurement level.
Relationships between variables can be symmetric or asymmetric (Field, 2009). Within symmetric
relationships between variables there’s no clear difference between a dependent and an
independent variable. It’s about the relationship between two ‘equal’ variables. Within asymmetric
relationships between variables there is a difference between the dependent and the independent
variable. It’s about the influence the independent variable has on the dependent variable. When
putting all this together, table 16 can be drawn.
Table 16 Statistical analyses using cross
tables
Nominal Ordinal Ratio
Symmetric Cramer’s V Gamma R
Asymmetric Goodman & Kruskal’s tau Somer’s d R^2
50
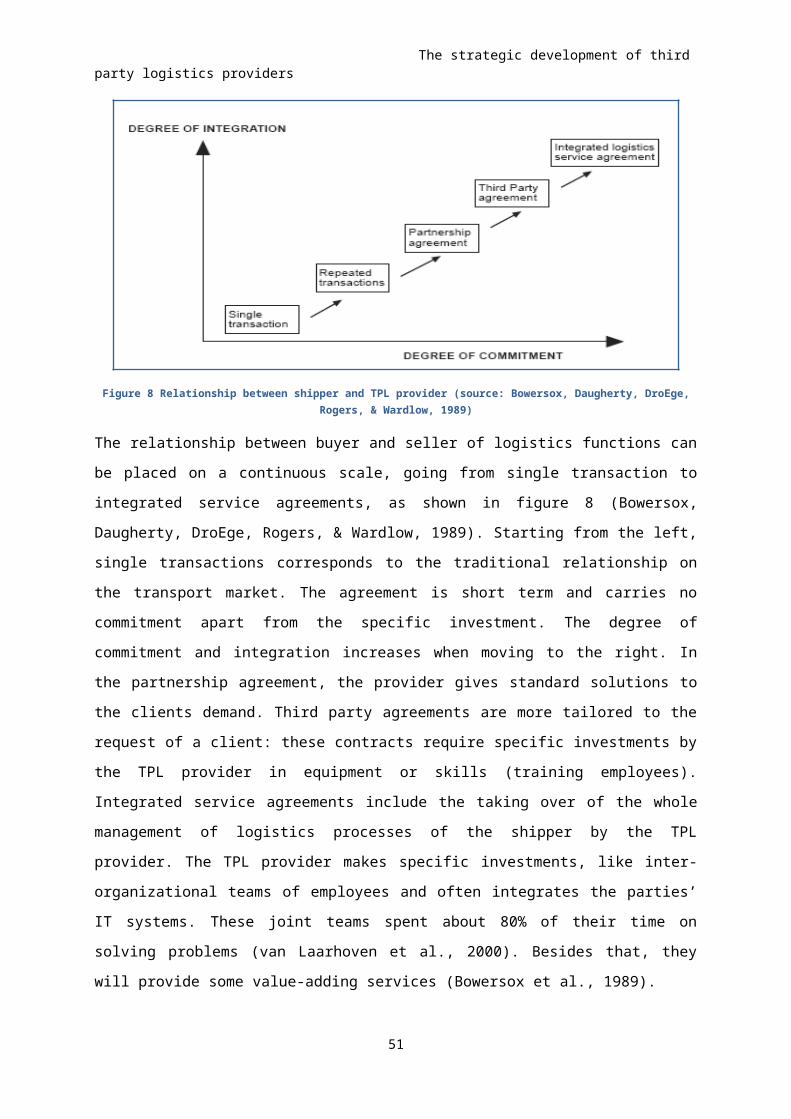
The strategic development of third party logistics providers
In table 16 can be seen which statistical association measurements can be used at a certain
measurement level and suspected relationship between two variables. As mentioned before, you
always have to assume the lowest measurement level of the two variables involved when analyzing
the relationships between those variables. The association measurements Cramer’s V and Goodman
& Kruskal’s tau test the difference between two variables: they give an indication of the relationship
between two variables on a 0-1 scale, but don’t say anything about the direction of the relationship
(positive or negative direction). The association measurements Gamma and Somer’s d, R and R^2
test the coherence/linear relationship between two variables (Field, 2009): they give an indication of
the relationship between two variables on a -1 + 1 scale, and thus also say something about the
direction of the relationship. This relationship can be negative and thus < 0, or positive and thus >0.
Table 17 indicates the strength of a relationship between to variables. Off course, if these
relationships are negative, it has to be said say so.
Table 17 Strength of relationships between variables
0-.10 Very weak/ not related
.11-.30 Weakly related
.31-.50 Reasonable relationship
.51-.80 Strongly related
.81-.99 Very strong related
1.00 Perfect relationship
51

The strategic development of third party logistics providers
4 RESULTS AND ANALYSIS
The results obtained from the questionnaire will be presented in this chapter. For the elaboration of
these results I used the same display as used in the literature review section. In this way, the
research results can be compared more quickly with the related literature.
4.1 CHARACTERIZING DUTCH TPL RELATIONSHIPS
Before something meaningful can be said about customer/provider relationships, we have to know
something about who these companies are. Respondents to this survey where asked about their size
in number of personnel and the average size of their customers (in number of personnel). As can be
drawn from figure 18, the median and mode of both parties involved are in the category of 50 to 200
employees. It was found that the size of the customer is reasonably positively related to the size of
the TPL provider (and vice versa) since the relationships scored a .362 (Gamma).
<50
50-200
201-500
501-10001000>
Unknown/h
ighly d
iverse
0%10%20%30%40%50%
Size of the parties involved
TPL ProviderCustomer
Number of personnel
% o
f res
pond
ents
When asked about the average duration of contracts (in years) and how this duration developed in
recent years, it was found that the average duration of contracts is 2 years (mean = 2, 06). It was
found that contract duration is only weakly related with whether or not doing client specific
investments (Cramers’ V = .190). Although I expected contract duration and the management level of
the customer by who decisions are made about outsourcing to be related, this was not the case
(Cramer’s V = .228).
52% of the respondents answered that the average contract duration declined during recent years,
33% answered duration remained constant. The development of contract durations over the past
years is not related to whether or not client specific investments are made (Goodman and Kruskal
Tau = .034). Although 44% of the respondents agreed with the statement that contracts always
52
Figure 18

The strategic development of third party logistics providers
contain moments of evaluation, bonus and penalty arrangements and the ability to prematurely
terminate contracts with poor functioning, there is no clear agreement on this: the median is at 3
(neutral).
Decisions regarding outsourcing are mostly discussed with the clients’ strategic management (in 78%
of cases). This is a surprising result since 63% of the respondents agreed with the statement that
customers mainly outsource operational and repetitive activities and to a lesser extend services that
are of strategic importance to them. It doesn’t make any difference for the level of outsourced
activities whether or not the TPL providers is asset based or non asset based (Goodman and Kruskal’s
Tau = .036). Cross tabulation made clear that 67% of the respondents who stated that decisions
regarding outsourcing are mostly discussed with the clients’ strategic management, agreed on the
statement mentioned above which shows strategic activities are outsourced less. This makes no
sense: why should a customer’s strategic management be involved with a matter not of strategic
importance?
I expected the decision level on which outsourcing is discussed to be strongly related with the
customers’ size in number of personnel, but this wasn’t the case (Goodman and Kruskal’s Tau = .300).
The reasons customers management give for outsourcing their logistics are displayed in table 19,
which shows the median on a 1 to 5 scale (totally disagree – totally agree).
Table 19 Reason for outsourcing Mean
Overall cost reductions 4
Reduce capital investments in assets and personnel 4
Increase business flexibility 4
Want to focus on core activities 4
Improving customer satisfaction by improving the service provided 4
Benchmarking in-house logistics costs and effectiveness 3,5
Access to other markets (through an international distribution network) 3
The average number of TPL providers used by a single customer is 3, 25 (mean), although most
respondents (about 32%) answered that, on average, 2 TPL providers were used by their customers.
Another 27% of all respondents said they were the only TPL provider for their customers. It’s
interesting to see that the average number of TPL providers used by a single customer is reasonably
negatively related to the average size of the customers in number of personnel (Somers’d = -.444):
the bigger the client, the less TPL providers they will use. No relationship was found between the
53

The strategic development of third party logistics providers
number of TPL providers used by the client and the size of the TPL provider in number of personnel
(Somers’s = -.098)
Before customers can use the service of TPL providers, they have to be accepted as customer by the
TPL provider. 96% of all respondents assesses and/or selects potential customers before accepting.
The most important issues in selecting customers are displayed in table 20, which shows the median
on a 1 to 5 scale (totally disagree – totally agree). References from existing customers seem to be an
important way of acquiring new customers. 63% of all respondents agreed with this statement,
another 26% of all respondents totally agreed with this.
Table 20 Selecting customers Mean
A good match with our industry focus 4
The desire the build a relationship that revolves around cooperation 4
The intention to establish a long term relationship 4
The willingness of the customer to let us achieve a reasonable return 4
The size of the customer and its logistics network 4
The financial stability of the customer 4
The growth potential of the customer 3
4.2 THE GEORGRAPHIC SERVICE AREA OF DUTCH TPL PROVIDERS
When asked about where they earned the largest part of their turnover, respondents answered
according to figure 21. The origin of the majority of turnover is reasonably related with the size of the
TPL provider in number of personnel (Cramers’ V= .484). For example, 60% of the providers in the
201-500 workforce class get their turnover for the majority from the Benelux and 50% of TPL
providers with a workforce >1000 get the majority of their turnover from outside Europe.
Although it’s clear that the Netherlands is an important origin of turnover and given only 11% of all
respondents get the largest part of their revenue from outside Europe, I wondered whether Dutch
TPL providers have a global service area. 44% of the respondents don’t have a global service area. Of
the respondents who do have global coverage, 62% achieves this by having strategic alliances with
several other TPL companies abroad. 11% of all respondents have its own international distribution
network and 7% uses the networks of companies like DHL, TNT, FEDEX and UPS.
54

The strategic development of third party logistics providers
The Nether-lands37%
Benelux15%
Germany11%
Northern Europe11%
Europe15%
Outside Europe11%
Origin of the majority of turnover
But this situation is likely to change in the upcoming years, since most companies have set
themselves the target to further internationalize in the future (median and mode are in the ‘agree’
class). 41% agreed with this statement, even 22% of all respondents totally agreed with the
statement about further internationalization. The wish to further internationalize is weakly related
to the size of the TPL provider (Somers’d = .275).
Taking into account the answers on the above mentioned question about further internalization and
having a global network, it’s not surprising that almost 82% of all respondents sees the development
of near shoring as an opportunity. Although I expected that the opinion on near shoring to be
dependent on the origin of turnover, this was not the case (Goodman and Kruskal’s Tau = .081). I
expected the operators working outside Europe to see near shoring as a threat, but 67% actually sees
near shoring as an opportunity. 75% of the respondents who see near shoring as a threat get the
majority of their turnover from the Netherlands. However, the origin of the majority of turnover and
the wish to further internationalize in the future are strongly related (Cramers’ V =.534): Holland and
Benelux covering providers are being les in favor of internationalizing opposed to TPL providers
already servicing total Europe. Concluding, carefully interpreting results, I think it is safe to conclude
that most Dutch TPL providers are aiming at further internationalization inside Europe.
55
Figure 21
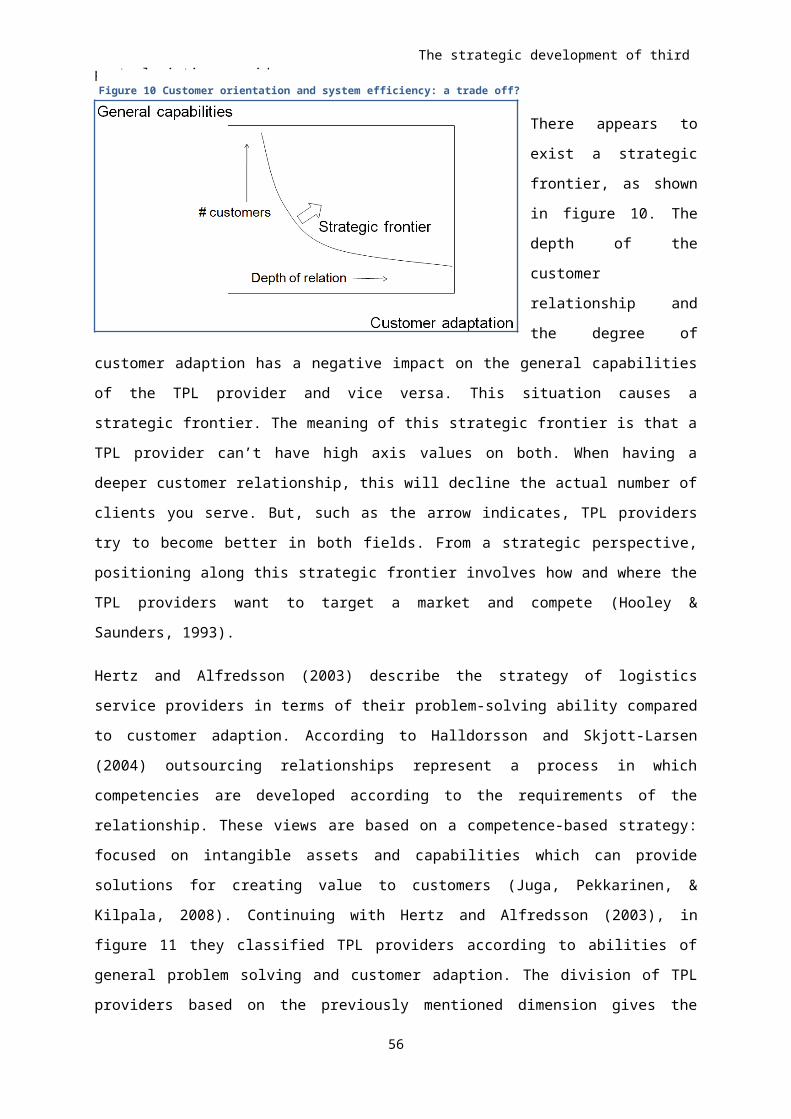
The strategic development of third party logistics providers
4.3 DUTCH TPL PROVIDERS’ CAPABILITIES AND THE ROLE OF PATH DEPENDENCY
Path dependency. The history of a company is important, given that investment made in the past
may limit or shape its future. The path followed in the past will thus be followed in the future. Says
theory. The statement ‘our first customer has determined our current business and customer focus’
yielded a mixed response (median = 3). Scale 1 to 4 all got around 25% of the votes, so nothing
considerable can be said about this. However, respondents agreed with the statement that their
capabilities and competencies are mainly shaped by customer relationships from the past (median =
4). Almost 75% of all respondents disagree, of which 26% even totally disagreed, with the statement
that their current customer base limits them in selection and development of future customer
relationships. Although TPL providers are not limited by their current customer base, the extent to
which a potential customer is a good match with their current customer base and industry focus is
important. This match and TPL providers goals for strategic positioning and capacity development
was found important by 70% of the respondents (of which 22% even totally agreed with the
statement involved). To come up with a concluding answer on the question whether or not path
dependency is being recognized by Dutch TPL providers as an important phenomenon, factor analysis
was performed. But no relationship between the variables was found. Summarizing, current business
is not shaped by a first customer, and current business is definitely not limiting future customer
relationships. However, capabilities and competencies are shaped by customer relationships from
the past and TPL providers do take into account how a potential new client is expected to fit in their
industry focus and how such a customer helps in developing the providers’ capacities. Dutch TPL
providers’ only see the path dependency phenomenon as an asset that helps them in further
expanding their business successfully. The other side of the coin is not being observed or taking
seriously. In my opinion, the only way in which path dependency can be seen as an asset for the
future is by acknowledging that path dependency can also hold limitations for the further
development of the company involved.
56

The strategic development of third party logistics providers
4.4 CLIENT SPECIFIC INVESTMENTS MADE BY DUTCH TPL PROVIDERS
Before talking about client specific investments, it should be clear how the majority of TPL providers’
investments are done. Figure 22 points out that the majority of investments made by TPL providers
are suitable for serving multiple clients.
Client specific
Suitable for serving a few clients
Suitable for serving multiple clients
Suitable for serving all our clients
4%
4%
67%
26%
The majority of investments made by TPL providers
It was expected that the amount of client specific investments made would be negatively related
with the size of the customer: the bigger the customer, the more client specific to be made. This
turned out to be true, although the variables are weakly negatively related (Somers’d = -.158).
Although figure 22 might insinuate that almost no client specific investments are made, this is not
the case. This figure just shows that most investments that are made are suitable for serving multiple
clients. As a matter of fact, 74% of all respondents answered that they do make client specific
investments: investments to serve only one customer. Whether client specific investments are made
isn’t depending on the size of the TPL provider (Goodman and Kruskal’s Tau =.134). Doing client
specific investments is also not depending on the base (asset or non asset based) of the TPL provider
(Goodman and Kruskal’s Tau = .079). Besides that, the answer on the statement about the depth of a
TPL provider - customer relationships and the fact that this will lower the number of customers
which can be served has no explanatory power on the decision to do client specific investments
(Goodman and Kruskal’s Tau = .047). Apparently, being able to serve less clients isn’t scarring
providers which intend to do client specific investments.
The average percentage of client specific investments made (relative to total investments) over the
last five years is 27% (mean = 27, 26). When asked the question which client specific investments
they made, 67% answered investment were made in assets such as rolling stock, real estate, storage
57
Figure 22

The strategic development of third party logistics providers
facility etc. 63% of all respondents also invested in IT system and/or IT links. 41% of all respondents
making client specific investments did this by investing in staff and their training. However, the
biggest client specific investments are being made in assets and IT systems and/or IT links: both
mentioned by 45% of the respondents as being the category they invested the biggest amount of
money in.
Talking about financing investments, figure 23 makes clear that client specific investments are mainly
financed by the TPL provider: > 50% of the total investment.
10%
15%
50%
25%
Financing client specific investments
These investments are mainly financed by the client> 50%These investments are 50% financed by bothThese investments are mainly financed by the 3PL provider> 50%These investments are fully (100%) funded by the 3PL provider.
When we look at the reasons for making client specific investments, it’s striking to see how
important it is for TPL providers to be of more strategic importance for their customers. Also the wish
to distinguish themselves from competition is an important reason for making client specific
investments. From these two reasons it’s very obvious that TPL providers really try and want to be
more than a commodity service.
Table 24 Reasons for making client specific investments Mean
To be of more strategic importance to the customer 4,5
The wish to distinguish themselves from their competitors 4
They are being forced by their competitors 3
The higher profit margins 3
The economic crisis resulted in fewer financing options for customers 3
58
Figure 23

The strategic development of third party logistics providers
4.5 THE STRATEGIC POSITIONING OF DUTCH TPL PROVIDERS
Much has been written about the strategic positioning of TPL providers. Important aspects in these
classifications are whether or not providers aim at serving as many clients as possible or that they
aim at close and stronger customer relationships serving less customers a much more dedicated
service. Closely related to this subject is the question what is the foundation under Dutch TPL
providers. The questionnaire made very clear that Dutch TPL providers are mainly asset based. 80%
of all respondents consider themselves as being asset based: TPL providers owning and operating
their own transport fleet, storage etc. Just 20% of the respondents consider themselves to be a non-
asset based TPL provider: firms which foundation consists of knowledge and skills, outsourcing
physical activities like transport and storage. This breakdown might be explained by the fact that
most non-asset based logistics companies are likely to consider themselves to be 4PL providers
instead of TPL providers. The foundation under TPL providers is reasonably related with their size
(Goodman and Kruskal’s Tau = .446). It was found that the larger the TPL provider the more likely it is
to be a non asset TPL provider.
Let’s go back to the strategic positioning. The position of TPL providers is often described by their
general problem solving capabilities on the one hand and their ability to adapt to the customer on
the other. Divided into two dimensions, there are service providers and solution providers. Service
providers focus on providing standard services, which can be complex, but that are equal available
for each customer. Solution providers take over the entire logistics process of its customer. This
forces the solution provider to adapt to specific customer requirements. This makes solution
providers serving fewer clients and become more dependent on the client. The percentage
breakdown shows that 78% of the respondents consider themselves to be a solution provider. This
might be explained by the fact that being solution providers enables providers to be of more
strategic importance to their customers, thereby increasing the profit margins involved. Although it
seemed obvious to me, there is no consensus among the respondents about the fact that the depth
of the customer relationship and the degree of adaption to the customer have a negative impact on
the number of customers that can be operated (and vice versa), resulting in a median of 3 (on a zero
to five scale).
In chapter 2.8 the division by Hertz & Alfredsson (2003) of TPL providers into four classes is
described. Figure 25 shows the current and future (the respondents goals) strategic positioning of
DutchTPL providers.
59
The strategic development of third party logistics providers
Standard
TPL p
rovid
er
Servic
e deve
loper
Customer
adap
ter
Customer
developer
0%
10%
20%
30%
40%
50%
Strategic positioning of Dutch TPL providers
Current situationFuture situation
As figure 25 clearly shows, although the standard TPL is currently the biggest class, respondents are
trying to become more dedicated service providers. This would also better reflect the fact that most
TPL providers already see themselves as solution providers: an image clearly not consistent with the
current classification by Hertz & Alfredsson (2003). Respondents who describe themselves as
standard TPL providers and service developers should also described themselves as service providers.
But this is not always the case, since 62% of standard TPL providers and 83% of services developers
also described themselves as solution providers. All respondents who described themselve as
customer adapter or customer developer said they were solution providers. I found a strong
relationship between the basis of the company (asset or non asset based) and the classification of
TPL providers by Hertz & Alfredsson ( Cramer’s V = .520). For example, all standard TPL providers are
asset based TPL operators. Another interesting aspect to investigate is whether or not a TPL
providers’ size in number of employees has an influence on the classification of TPL providers by
Hertz and Alfredsson (2003). It seems that the mentioned classification is not related to the size of
TPL providers (Goodman and Kruskal Tau = .062).
60
Figure 25

The strategic development of third party logistics providers
Table 26 shows how TPL providers want to develop themselves with respect to strategic positioning.
As can be seen from table 26, for example, 39% of all TPL providers who currently describe
themselves as being a standard TPL provider have to goal to stay this way in the future. A striking
and unexpected result is that 40% of current customer adapters wants to become a service
developer in the future. Another striking result is the fact that all customer developers want to
remain so. I guess being a customer developer is pretty rewarding. In general, it is the trend to
wanting to become a more dedicated service provider: thereby probably aiming at becoming of more
strategic importance for the customer and taking benefit of this situation.
Future situation
Table 26 The path to follow in
terms of strategic positioning
Standard TPL
provider
Service
developer
Customer
adapter
Customer
developer
Total
Standard TPL provider 39% 23% 15% 23% 100%
Service developer - 33% 50% 17% 100%
Customer adapter - 40% 40% 20% 100%
Customer developer - - - 100% 100%
Current situation
61

The strategic development of third party logistics providers
4.6 ENVIRONMENTAL AWARENESS IN THE DUTCH TPL INDUSTRY
While this paper is about TPL providers’ relationship with their customers, there aim to become of
more strategic importance for their customers and the diversification of offered services and thus a
changing role in the supply chain, environmental awareness in the Dutch TPL industry seems to be a
stand-alone section of the paper. At first, this was true. But while developing the questionnaire I was
noticed by my supervisor that I had to keep in mind my research question and the way this sub
question supports it. The reason for not deleting this chapter is the following: offering environmental
services is also a way of diversifying services, attracting and retaining (stronger) customer
relationships and thus making your service less commoditized.
When the respondents were asked about the importance of environmental and durable issues when
entering into new contracts or for the transfer of current contracts, 44% of all providers agreed with
this being important (median = 3). The average percentage of contracts containing environmental
friendly and durable agreements is 24% (mode = 10%). This is considerably higher than I expected.
The average percentage of contracts containing environmental friendly and durable agreements is
reasonably positively relation to the size of the customer in number of personnel (Somers’d = .313).
So it seems that bigger clients put more emphasize on doing environmental friendly business.
Besides that, the average percentage of contracts containing environmental friendly and durable
agreements is strongly positively related to statement about the importance of environmental and
durable issues when entering into new contracts or for the transfer of current contracts (Somers’ d
= .646). This statement is thus not an empty slogan, but actual reality. It can thus be concluded that
many Dutch TPL providers are environmental aware and that this attitude also is beneficial to them
from a business point of view.
62

The strategic development of third party logistics providers
4.7 VALUE ADDED LOGISTICS OFFERED BY DUTCH TPL PROVIDERS
According to Berglund et al. (1999), ‘’the challenge that providers face is to provide their customers
with services that add more value to their customers’ business than that the customers would be able
to achieve themselves’’ (p. 65). Nevertheless, there seems to be weak demand for such services,
since most clients perceive such activities as too important to outsource (van Hoek & Dierdonck,
2000; Langley & Capgemini, 2010; Lieb & Bentz, 2005; Lieb & Kendrick, 2003). On average, 54% of
shippers’ total expenditures on logistics was spend on transportation. Warehousing costs
represented 40%, leaving just 6% for other value added logistics (Langley & Capgemini, 2010).
How far are Dutch TPL providers in offering value added services? Figure 27 gives an overview of
which activities one can think of when thinking about value added services. Off course, transport and
warehousing are not meant when talking about value added logistics, but are including in figure 26
for comparison purposes.
0%
20%
40%
60%
80%
100%
Value added services offered by Dutch TPL providers
% o
f the
resp
onde
nts
offe
ring
this
serv
ice
63
Figure 27

The strategic development of third party logistics providers
When you take a look at the value added services offered by Dutch TPL providers, you will notice it’s
a large spectrum of services of which some services are not related to traditional logistics. For
example, the testing and repairing of products, quality control, product configuration and final
assembly might ask for specialist knowledge and skills. That’s why respondents were asked if they
hired industrial subcontractors for performing those services. It turned out that exactly 50% of the
TPL providers use industrial subcontractors, while the other 50% doesn’t. The decision whether or
not to make use of subcontractors has a reasonably positively relation to firm size (Goodman and
Kruskal’s Tau = .316). The smaller the TPL provider, the more industrial subcontractors are hired to
perform certain value adding logistics. The TPL providers having more than 1000 employees are the
exception since all respondents from this category use industrial subcontractors. Concluding, TPL
providers outsourcing services that were outsourced to them is well established.
But how important are these value added services for TPL providers when you look at their turnover
breakdown? The respondents were asked what percentage of their turnover was derived from
services other than transportation and storage/inventory management. On average, 19% of all
turnover is derived from value added logistics (mean = 18, 7 %, mode = 10 %).
4.8 DUTCH TPL PROVIDERS CAPTURING THE SUPPLY CHAIN
According to van Hoek (2000) ‘’it can then be expected that manufacturing will increasingly involve
the contribution of TPLs for specific customizing initiatives, assuming that the supply chain is
integrated further and further, across functions and companies’’ (p. 386). TPL providers started
offering such and other customization services, since this part of the supply chain has higher value-
added activities and thus yields higher margins in comparison to distribution and storage (van Hoek,
2000). The ‘typical’ supply chain format is changing. Manufacturing doesn’t just take place at the
manufacturer, but also further downstream the supply chain, enabling the TPL provider to try and
capture this business. But does all this holds for Dutch TPL providers? Five statements (which could
be answered on a 1 to 5 scale) concerning TPL providers’ efforts to obtain a larger part of the supply
chain should provide the answer.
TPL providers will increasingly focus on services like production and the assembly of goods, if the
supply chain further integrates and trends like mass customization and postponing product
finalization will persevere. Or so was the statement. Dutch TPL providers don’t know whether this is
true, resulting in a median score of 3. The same score holds for the statement that TPL providers
provide customized services and postponement of product finalization because in this part of the
64

The strategic development of third party logistics providers
supply chain higher profits can be obtained in comparison to the margins involved with storage,
transport and distribution (median = 3). Although 40% agreed with the statement, 44% of the
respondents answered neutral. About both statements can be said that they are not related to the
basis of the company: asset and non asset based companies have no real different ideas about it
(respectively, Goodman and Kruskal’s Tau = .075 and .027).
Having discussed the more physical side of the supply chain and the changes involved for TPL
providers to expand their business, focusing more on supply chain management is another way of
getting hold of a larger part of the supply chain, thereby diversifying the providers’ service offerings.
Expanding their services related to supply chain management is seen as one of the major growth
opportunities by the respondents. 44% of all respondents agree with the statement and even 28%
totally agrees with it. Respondents opinion on this expansion isn’t related to the basis of their
company (asset or non asset; Goodman and Kruskal’s Tau =.032).
Concluding from this that TPL providers want to develop themselves into 4PL providers would be
wrong, since this statement scored a 3 (median). Again focussing at the classification by Hertz and
Alfredsson, I wonder whether the respondents who said they want to become customer developers
in the future, also answered this statement about developping themselves into a 4PL provider
accordingly: the description of the customer developer almost matches that of the 4PL provider.
Surprisingly, this isn’t the case. Of all respondent wanting to become a customer developer in the
future, only 25% agreed and 12,5% totally agreed with the statement about 4Pl providers. The only
way this can be explained is by concluding that for most respondent the meaning of the term 4PL is
a bit vague. I expected the score on the 4Pl statement to be related to the fact that most
respondents of this survey are asset based and that there is an debate going about the impossibility
for asset based TPL providers to become 4PL providers ( due to conflicting interest etc. as mentioned
earlier on in this thesis). This expectation is actually true since the desire to develop into a 4PL
provider is reasonably related with the basis of the TPL provider. Unsurprisingly, non asset based TPL
providers have a stronger desire to become 4PL providers as their asset based counterparts
(Goodman and Kruskal’s Tau =.406).
Although the majority of the respondents sees offering supply chain management as a major
opportunity for them, most (totally) agree with the statement that customers are to focused on short
term price levels and lowering costs of logistics, thereby making it difficult to provide effective supply
chain management (a service for which should be paid for). This problem must be solved: the
mindset of the customer towards supply chain management must be changed (as concluded earlier
by BLMC, 2011).
65

The strategic development of third party logistics providers
5 DISCUSSION AND CONCLUSIONS
This chapter discusses the main findings gained from this research, before discussing the limitations
involved with the study. After that, opportunities for future research are examined.
5.1 MAIN FINDINGS
‘’How do third party logistics providers in the Netherlands develop their business?”
In essence, this study is about TPL providers’ relationship with their customers and the development
and strengthening of these relationships. Following from this, this research is about Dutch TPL
providers expanding their services into less traditional logistics activities and further diversifying the
services offered: TPL providers creating new (international) business for themselves.
Dutch TPL relationships are best characterized by highlighting a few insights. Nearly all TPL providers
select their customers on the prospect of a long-term relationship. Although current business is not
believed to limit future customer relationships, capabilities and competencies are thought to be
shaped by customer relationships from the past and TPL providers do take into account how a
potential new client is expected to fit in their industry focus and how servicing such a customer helps
in developing the providers’ capacities. It is therefore remarkable that just 15% of all respondents
state that the average contract period of two years increased in recent years. That TPL providers
become of more strategic importance for their customers is demonstrated by the fact that most
customers’ decisions regarding outsourcing activities to TPL providers are taken by strategic
management. However, most respondents agreed with the statement that customers mainly
outsource operational and repetitive activities and to a lesser extend services that are of strategic
importance to them.
Although almost 40% of all respondents get the majority of turnover from within national borders,
this situation is likely to change since the majority of TPL providers wants to further internationalize
in the upcoming years. Developments in the field of near shoring are likely to further trigger this
intention. Given the fact that the vast majority of Dutch TPL providers have no global focus, it’s safe
to say further internationalization will presumably take place inside Europe.
An acknowledged way of diversifying services, attracting and retaining (stronger) customer
relationships and thus making your service less commoditized is by being an environmentally aware
TPL provider. But becoming of more strategic importance can also be achieved by doing client
66

The strategic development of third party logistics providers
specific investments, as is done by three-quarter of the respondents. Though the majority of
investments made by TPL providers are suitable for servicing multiple clients, about a quarter of total
investments recently done by TPL providers are spent on client specific investments. Although these
investments are often funded by both customers and TPL provider, 50% of all client specific
investments are mainly funded by the TPL provider. Another 25% of all client specific investments are
completely funded by the TPL provider. This proves how important it is for TPL providers to be of
more strategic importance for their customers. Besides that, the wish to distinguish themselves from
competition is also an important reason for making client specific investments.
Dutch TPL providers have committed themselves to provide their customers with services that add
more value to their customers’ business than that the customers would be able to achieve
themselves. The value added services offered by Dutch TPL providers contain a large spectrum of
services, of which some services are not related to traditional logistics. On average, one fifth of all
turnover is derived from value added logistics, thereby TPL providers prove they can develop new
business for themselves. But there is more proof that the ‘typical’ supply chain format is changing.
From literature we found that manufacturing doesn’t just take place at the manufacturer, but also
further downstream the supply chain, enabling the TPL provider to try and capture this business.
Having said this, Dutch TPL providers are inconclusive whether this is reality for them. Having
discussed the more physical side of the supply chain and the changes involved for TPL providers to
expand their business, focusing more on supply chain management is another way of getting hold of
a larger part of the supply chain, thereby diversifying the providers’ service offerings. Although the
majority of TPL providers sees offering supply chain management as a major opportunity for them,
most notice that customers are too focused on short term price levels and lowering costs of logistics:
for further developing this business the mindset of the customer towards supply chain management
must be changed.
To end up with strategic positioning, it should be known that the strategic positioning of TPL
providers is mostly described by their general problem solving capabilities on the one hand and their
ability to adapt to the customer on the other. Although, in the current situation, most TPL providers
are focused on their general problem solving capabilities, it is the trend to wanting to become a more
dedicated service provider: thereby probably aiming at becoming of more strategic importance for
the customer and taking benefit from this situation.
67

The strategic development of third party logistics providers
5.2 LIMITATIONS
The most important limitation of this research is having limitations with respect to the generality of
the findings. This research uses the answers of twenty-seven Dutch TPL providers to analyze certain
subjects related to the main research question. But the answer I got may have been different if there
were more respondents. The research results might also be skewed by the characteristics of the
respondents. In this case, most respondents are sized between 50 and 200 employees. This could
bias the results of this study. Summarizing, the behavior of the respondents to this study might be
different from the behavior of the total Dutch TPL providers industry.
By making use of cross tabulation and corresponding statistical association measurements, suspected
relationship between two variables can be checked at a certain measurement level. By this searching
for correlation I can find a relationship between two variables with much explanatory power.
However, two variables may appear to be associated when in reality an unknown third variable could
be responsible for this apparent relation. Isolated variables were analyzed by interpreting their
percentage breakdown and by the use of measures of central tendency. These measures of central
tendency are better known as the median, mean and mode (Field, 2009). Especially the percentage
breakdowns of some variables and the mean have a bigger standard deviation when the number of
observations used is limited. This problem mostly occurred when I was interested in the score on a
certain variable for a certain group of respondents.
As mentioned in the chapter on results of this research, I found some inconsistencies when
measuring the relationship between certain variables. Sometimes I expected respondent A to totally
agree on, for example, statements 29 and 42. As I already mentioned, sometimes these inconsistent
answering of the respondents couldn’t be explained by me. It’s not true that this automatically is
explained by the way how the question and included terminology was formulated/asked/described,
but this could be the case. Another explanation might be the respondent not paying full attention to
the questionnaire, which might be explained by the fact that the questionnaire was a bit long. If I
were to this research again, I also would change the scale on which the statements could be
answered from 1-5 to 1-10. This would improve the showed opinion of the respondent about the
statements by making this opinion more accurate and ‘considered’. Besides that, a 1 to 10 scale
could be analyzed on an ordinal level which enables to say something about the direction of
relationships between two variables. Lastly, the research was limited by time due to the fact that
after starting with this research, at the beginning of may 2011, I wanted to graduate in the academic
year 2010-2011.
68

The strategic development of third party logistics providers
5.3 FUTURE RESEARCH
This thesis describes how TPL providers in the Netherlands develop their business. It is like a picture
taken on the current situation regarding this subject. This research could be conducted annually,
therefore it would be possible to closely monitor and identify certain trends in the development of
the TPL providers’ industry in the Netherlands. The here conducted study could also be applied to
different countries. The strategic development of TPL providers is described for the United States,
the European Union as a whole and the Scandinavian countries (most students on this subject are
Scandinavian), but that’s about it: enough countries are still left to study.
This study could provide more in-depth information when the subject was studied by conducting
case studies. The cases studied could be large or small TPL providers, or both, depending on which
kind of TPL providers’ business development is the most interesting for the researcher. Another way
of monitoring the development of the TPL business could be by interviewing TPL providers’
(strategic) management. For example, the survey instrument used by Mr. Lieb, interviewing the CEOs
of North America’s largest TPL providers might also be conducted in the Netherlands. As is the case
with the research of Mr. Lieb, this study could be conducted annually/periodic.
As mentioned before, according to Rahman (2011) very little attention has paid been paid to studies
simultaneously examining users’ and providers’ perspectives. It could also be interesting to compare
the self-image of the TPL providers with the perception of customers and other related groups. If
inconsistencies would be observed, qualitative interviews should aim to find out how and why these
different perceptions can exist.
When focusing more on the results of this research, I find it really interesting that 80% of all
respondents see near shoring as an opportunity for them. I would like to know why this is the case
and whether TPL providers actually respond to this development. By extension, it is interesting to
learn more about the magnitude of near shoring and the consequences for global transport. Another
interesting subject could be to further investigate how TPL providers give shape to their
commitment/intention to do environmentally friendly business. Last but not least, since I considered
doing this study myself before starting this research; it might be interesting to examine the 4PL
industry in the Netherlands and/or studying how Dutch 4PL providers develop their business.
69

The strategic development of third party logistics providers
REFERENCES
Andersson, D. (1995). Logistics alliances and structural change. Linkoping Studies in Science and Technology , Thesis no. 470.
Andersson, D. (1997). Third party logistics- outsourcing logistics in partnership. Linkoping Studies in Management and Economics (34), 191-213.
Bardy, E. J., & Tracy, M. (1991). ''Transportation outsourcing: a survey of users practices"". International journal of physical distribution & logistics management , 21 (3), 15-21.
Bask, A. H. (2001). Relationships among TPL providers and members of supply chains - A strategic perspective. Journal of business & industrial marketing , 16 (6), 470-486.
Berglund, M., van Laarhoven, P., Sharman, G., & Wandel, S. (1999). Third-party logistics: is there a future? The international journal of logistics management , 10 (1), 59-70.
Bhatnager, R., & Viswanathan, S. (2000). ''Re-engineering global supply chains: alliances between manufactoring and global logistics service providers. International journal of physical distribution & logistics management , 30 (1), 13-34.
BLMC. (2011). Nationale Supply chain monitor 2011 (in Dutch). Meppel: BLMC.
Boone, C. A., Craighead, C. W., & Hanna, J. B. (2007). Postponement: an evolving supply chain concept. International Journal of Physical Dsitribution & Logistics Management , 37 (8), 594-611.
Bowersox, D. J., & Closs, D. J. (1996). Logistics management, the integrated supply chain process. New York: Macmillan Publishing Company.
Bowersox, D. J., Daugherty, P. J., DroEge, C. L., Rogers, D. S., & Wardlow, D. L. (1989). Leading edge logistics: Competitive positioning for the 1990s. Oak Brook: Council of logistics management.
Boyson, S., Corsi, T. M., Dresner, M. E., & Harrington, L. H. (1999). Logistics and the Extended Enterprise, Benchmarks and Best Pratices for the Manufacturing Professional. New York: John Wiley and Sons inc.
Burnson, P. (2010, November 24). Near-sourcing gains traction in supply chain. Retrieved may 31, 2011, from Supplychain management review: http://www.scmr.com/article/near-sourcing_gains_traction_in_supply_chain/
Carbone, V., & Stone, M. A. (2005). Growth and relational strategies used by the european logistics service providers: rationale and outcomes. Transportation research part E , 41, 495-510.
Chiou, J. S., Wu, L. Y., & Hsu, J. (2002). The adoption of form postponement strategy in a global logistics system: the case of Taiwanese information technology industry. Journal of business logistics , 23 (1), 107-124.
Cooper, M. C., Lambert, D. M., & Pagh, J. D. (1997). Supply chain management: more than a new name for logistics. The international journal of logistics management , 8 (1), 1-14.
Dosi, G., Nelson, R. R., & Winter, S. G. (2000). Introduction: the nature and dynamics of organisational capabilities. In G. Dosi, R. R. Nelson, & S. G. Winter, The nature and Dynamics of Organisational Capabilities (pp. 1-18). Oxford: Oxford University Press.
70

The strategic development of third party logistics providers
Doz, Y. L., & Hamel, G. (1998). Alliance advantage: the art of creating value trough partnering. Boston: Harvard Business School Press.
Ellram, L. M., & Cooper, M. C. (1990). Supply chain management, partnerships and the shipper-third party relationship. International journal of logistics management , 1 (2), 1-10.
European Commision. (2011). Roadmap to a single European Transport Area - Towards a competitive and resource efficient transport system. Retrieved June 6, 2011, from europa.eu: http://ec.europa.eu/transport/strategies/2011_white_paper_en.htm
Field, A. (2009). Discovering statistics using SPSS. Chicago: SAGE.
Frost, & Sullivan. (2005). Strategic analyzes of third party logistcs (3PL) markets in Australia. Sydney: Australia.
Haakansson, H. (1993). Networks as a mechanism to develop resources. In Beije P et al., Networking in Dutch industries. Leren-Apendorn: Garant.
Halldorsson, A., & Skjott-Larsen, T. (2004). Developing logistics competencies through third party logistics relationships. International Journal of Operations and Production Management , 24 (2), 192-206.
Halldorsson, A., & Skjott-Larsen, T. (2006). Dynamics of relationship in TPL arrangement - a dyadic perspective. International journal of physical distribution & logistics management , 36 (7), 490-506.
Halldorsson, A., Herbert, K., & Skott-Larsen, T. (2003). Interorganizational theories behind supply chain management – discussion and applications. Strategy and organisation in supply chains , 31-63.
Hertz, S., & Alfredsson, M. (2003). Strategic development of third party logistics providers. Industrial marketing management , 32, 139-149.
Hooley, G. J., & Saunders, J. (1993). Competitive psotioning: the key to marketing strategy. Trowbridge: Prentice Hall.
Hsiao, H. I., Kemp, R. G., van der Vorst, J. G., & Omta, S. W. (2011). Logistics outsourcing by Taiwanese and Dutch food processing industries. Brittish food journal , 113 (4), 550-576.
Insigna, R. C., & Werle, M. J. (2000). “Linking outsourcing to business strategy”. The academy of management executive , 14 (4), 58-70.
Jayaram, J., & Keah, C. T. (2010). Supply chain integration with third-party logistics providers. interntaional journal of production economics , 125, 262-271.
Johansson, J., & Mattsson, L. G. (1986). Interorganizational relations in industrial systems - a network approach compared with the transaction cost approach. International studies of management and organisation , 1 (17), 34-48.
Juga, J., Pekkarinen, S., & Kilpala, H. (2008). Strategic positioning of logistics service providers. International journal of logistics: Research and Applications , 11 (6), 443-455.
LaLonde, B. J., & Cooper, M. C. (1989). Partnerships in providing customer service: A third-party perspective. Illinios: Oak Brook.
Lambert, D. M., Cooper, M. C., & Pagh, J. D. (1998). ''Supply chain management: implementation issues and research opportunities''. The international journal of logistics management , 9 (2), 1-19.
71

The strategic development of third party logistics providers
Langley, G., & Capgemini. (2009). The State of Logistics Outsourcing – 2009 Third-Party Logistics: Results and findings of the 14 Annual Study. US: Capgemini consulting.
Langley, J., & Capgemini. (2010). 2010 Third-party logistics. Capgemini Consulting.
Larson, P. D., & Gammelgaard, B. (2001). Logistics in Denmark: a survey of the industry. International journal of Logistics: research and applications , 4 (2), 191-206.
Leiblein, M. J., & Miller, D. J. (2003). ''An empirical examination of transaction-and firm-level influences on the vertical boundaries of the firm”. Strategic management journal , 24, 839-859.
Levinson, M. (2006). The Box. New Jersey: Princeton.
Lieb, R. C. (2005). The North American third part logistics industry in 2004_ a provider CEO perspective. International journal of physical distribution & logistics management , 35 (8), 595-611.
Lieb, R. C. (1992). The use of third-party logistics services by large American manufacturers. Journal of business logistics , 13 (2), 29-42.
Lieb, R. C., & Bentz, B. A. (2005). The North American third part logistics industry in 2004_ a provider CEO perspective. International journal of physical distribution & logistics management , 35 (8), 595-611.
Lieb, R. C., & Kendrick, S. (2003). The year 2002 survey: CEO perspectives on the current status and future prospects of the 3PL industry in the US. Transportation journal , 43 (2), 5-16.
Lieb, R. C., & Lieb, K. J. (2009). The North American Third Party Logistics industry in 2009: The provider CEO perspective. US: Penske Logistics.
Lieb, R. C., & Lieb, K. J. (2010). The North American Third Party Logistics Industry In 2010: The provider CEO perspective. Penske.
Lieb, R. C., & Lieb, K. (2008). The north american third-party logistics industry in 2008_The provider CEO perspective. Reproduced with permission of the copyright owner , 54-65.
Lieb, R., & Randall, H. L. (1996). A comparison of the use of third party logistics services by large American manufacturers, 1991, 1994, and 1995. Journal of business logistics , 17 (1), 305-320.
Logan, M. C. (2000). Using agency theory to design successful outsourcing relationships. International journal of physical distribution & logistics management , 11 (2), 21-32.
Makelin, M., & Vepsalainen, A. P. (1990). Service strategies 2 - Services, Channels and Information technology. HM&V Research , 17 (1), 7-56.
Marasco, A. (2007). Third-party logistics: a literature review. International journal of production economics (113), 127-147.
Murphy, P. R., & Poist, R. F. (2000). Third-party logistics: some users versus provider perspectives. Journal of business logistics , 21 (1), 121-133.
Nelson, R. R., & Winter, S. G. (1982). An Evolutionary Theory of Economic Change. Cambridge: Belknap Harvard.
Nijdam, M. H. (2011, February 14). ETFLS 6: Logistics services and the 3th party logistics firm. Rotterdam, Zuid Holland, the Netherlands.
O' Sullivan, A., & Sheffrin, S. M. (2003). Economics: principles in action. New Yersey: Pearson Prentice Hall.
72

The strategic development of third party logistics providers
Peters, M., Cooper, J., Lieb, R. C., & Randall, H. L. (1998). The Third-Party Logistics Industry in Europe: Provider Perspectives on the Industry's Current Status and Future Prospects. International journal of logistics: research and applications , 9-25.
Rabinovich, E., & Evers, P. (2003). Postponement effects on inventory performance and the impact of information systems. International journal of logistics management , 14 (1), 33-48.
Rahman, S. (2011). An exploratory study of outsourcing 3PL services: an Australian perspective. Benchmarking: an international journal , 18, 1-30.
Rao, K., & Young, R. R. (1994). “Global supply chains: factors influencing outsourcing of logistics functions. International journal of physical distribution & logistics management , 24 (6), 11-19.
Rodrique, J. P., Comtois, C., & Slack, B. (2009). The geography of transport systems. New York: Routledge.
Rushkoff, D. (2005, September 4). Commodified vs. Commoditized. Retrieved May 10, 2011, from www.rushkoff.com: http://rushkoff.com/2005/09/04/commodified-vs-commoditized/
Rushton, A., & Walker, S. (2007). International logistics and supply chain outsourcing: from local to global. London: Kogan Page.
Sahay, B. S., & Mohan, R. (2006). 3PL pratices: An Indian perspective. International journal of physical distribution & logistics management , 36 (9), 666-689.
Selviaridis, K., & Spring, M. (2007). Third party logistics: a literature review and reseacrh agenda. The international journal of logistics management , 18 (1), 125-150.
Siz, C. (2011, Februari 8). Fourth party logistics (4PL). Retrieved May 17, 2011, from www.twinssiz.blogspot.com: http://twinssiz.blogspot.com/2011/02/fourth-party-logistics-4pl.html
Skjott-Larsen, T. (2000). Third party logistics - from an interorganisational point of view. International journal of physical distribution & logistics management , 30 (2), 112-127.
Skjott-Larsen, T., & Thernu, C. (2003). Supply chain collaboration - theoretical perspectives and emperical evidence. International journal of physical distribution & logistics management , 33 (6), 531-549.
Sohal, A. S., Millen, R., & Moss, S. (2002). A comparison of the use of third-party logistics services by Australian firms between 1995 and 1999. Journal of physical distribution & logistics management , 32 (1), 59-68.
Solakivi, T., Toyli, J., Engblom, J., & Ojala, L. (2011). Logistics outsourcing and company performance of SMEs - evidence from 223 firms operating in Finland. Pre-print of a paper .
Stefansson, G. (2005). Collaborative logistics and the role of third-party logistics service providers. International journal of physical distribution & logistics management , 36 (2), 76-92.
Stock, J. R. (1997). Applying theories from other disciplines to logistics. International journal of physical distribution & logistics management , 27 (9/10), 515-539.
Su, J., Chang, Y., & Ferguson, M. (2005). evaluation of postponement structures to accomodate mass customization. Journal of operations management , 23, 305-318.
Teece, D. J., Pisano, G. P., & Shuen, A. (2000). Dynamic capabilities and strategic management. In G. Dosi, R. R. Nelson, & S. G. Winter, The Nature and Dynamics of Organisational Capabilities (pp. 349-377). Oxford: Oxford University Press.
73

The strategic development of third party logistics providers
TLN. (2011, 4). Conjunctuur bericht 1e kwartaal 2011. Retrieved May 10, 2011, from www.tln.nl: hhtp://www.tln.nl/media/1_tln/persberichten?conjunctuurenquete_1e_kwart_2011.pdf
TLN. (2010, 1). Conjunctuur bericht 4e kwartaal 2009. Retrieved May 10, 2011, from www.tln.nl: hhtp://www.tln.nl/media/1_tln/publicaties/conjunctuurberichten/cb4_2009.pdf
TLN. (2011, 2). Conjunctuur bericht 4e kwartaal 2010. Retrieved May 10, 2011, from www.tln.nl: hhtp://www.tln.nl/media/1_tln/publicaties/conjunctuurberichten/cb4_2010.pdf
van Damme, D. E., & van Amstel, V. J. (1996). ''Outsourcing logistics management activities''. International journal of logistics management , 7 (2), 85-95.
van Hoek, R. I. (2001). Epilogue: UPS Logistics - practical approaches to the. International journal of physical distribution & logistics management , 31 (6), 463-468.
van Hoek, R. I. (2000). Global and pan-European logistics? How it's not yet happening. International journal of physical distribution & logistics management , 30 (5), 454-460.
van Hoek, R. I. (2000). Role of third party logistic services in customization through postponement. International Journal of Service Industry Management , 11 (4), 374-387.
van Hoek, R. I., & Chong, I. (2001). ''Epilogue: UPS logistics - practival approaches to the e-supply chain''. International journal of physical distribution & logistics management , 31 (6), 463-468.
van Hoek, R. I., & Dierdonck, R. (2000). Postponed manufacturing supplementary to transportation services? Transportation research: Part E , 36, 205-217.
van Hoek, R. (1997). Postponed manufactoring: a case study in the food supply chain. Supply chain management , 2 (2), 63-75.
van Laarhoven, P., Berglund, M., & Peters, M. (2000). ''Third party logistics in Europe- five years later''. International journal of physical distribution & logistics management , 30 (5), 425-442.
Wilding, R., & Juriado, R. (2004). ''Customer perceptions on the logistics outsourcing in the European consumer goods industry''. International journal of physical distribution & logistical management , 34 (8), 628-644.
Williamson, O. E. (1985). The Economic Institutions of Capitalism: Firms, Markets, Relational Contracting. New York: Free Press.
Williamson, O. E. (1979). Transaction cost economics: the governance of contractual relations. Journal of Law and Economics , 22, 233-261.
Yang, B., Burns, N., & Backhouse, C. (2004). Postponement: a review and an integrated framework. International journal of operations & production management , 24 (5), 468-487.
74

The strategic development of third party logistics providers
APPENDICES
APPENDIX 1: THE QUESTIONNAIRE (IN DUTCH)
Geachte geadresseerde,
De Erasmus Universiteit uit Rotterdam doet momenteel onderzoek naar de strategische ontwikkeling van 3PL-
ers in Nederland. De transport- en logistieke sector wordt geconfronteerd met een aanhoudende druk op de
gehanteerde prijzen en marges. Een mogelijke manier om onder deze druk uit te komen is door het aanbieden
van meer gedifferentieerde diensten. Dit onderzoek richt zich op hoe 3PL-ers in Nederland zichzelf ontwikkelen
en onderscheiden om hierdoor van meer strategisch belang te zijn voor hun klanten. De vragen uit de enquête
hebben o.a. betrekking op de relatie tussen 3PL aanbieders en hun klanten, het doen van klantspecifieke
investeringen en de positie van 3PL aanbieders in de supply chain.
De enquête bestaat uit 15 stellingen en 27 gesloten vragen. Het beantwoorden van de vragen neemt maximaal
15 minuten in beslag. U ontvangt deze enquête per e-mail en per post zodat u deze naar eigen voorkeur kunt
invullen. Uw deelname aan dit onderzoek is zeer gewenst. Wanneer u de enquête invult zult u, indien gewenst,
volledig op de hoogte worden gebracht van de resultaten van dit onderzoek: doe er uw voordeel mee!
Alvast bedankt voor uw deelname aan dit onderzoek.
Met vriendelijke groet,
Lex Miechels
75

The strategic development of third party logistics providers
Er volgen nu eerst enkele vragen en stellingen over de huidige status van 3PL klantrelaties.
1. Wat is de gemiddelde omvang van uw klanten in aantal personeelsleden?
o <50o 50-200o 201- 500o 501-1000o 1000>o Geen idee/n.v.t.
2. Wat is de gemiddelde duur (in jaren) van contracten die u afsluit met klanten?
…………… jaar
3. Deze gemiddelde contractduur is de afgelopen jaren:
o Afgenomeno Gelijk gebleveno Toegenomen
4. Beslissingen betreffende uitbestedingen worden door de klant met u besproken op het niveau van:o Strategisch managemento Midden management ( divisie niveau)o Lager management (lokaal niveau)
5. De redenen die mijn klanten geven voor het uitbesteden van hun logistieke activiteiten zijn:
Geef aan in hoeverre u het eens bent met de genoemde redenen op een schaal van 1 tot 5.
Helemaal mee oneens Helemaal mee eens
N.v.t. /geen mening
Algehele kostenreducties 1 2 3 4 5 o
76

The strategic development of third party logistics providers
Verminderen van kapitaal investeringen in activa en personeel 1 2 3 4 5 o
Verhogen van de flexibiliteit van het bedrijf 1 2 3 4 5 o
Toegang krijgen tot andere markten (d.m.v. een internationaal distributienetwerk)
1 2 3 4 5 o
Zich willen focussen op kernactiviteiten 1 2 3 4 5 o
Verbeteren van de klanttevredenheid door het verbeteren van hun service
1 2 3 4 5 o
Benchmarken van inhouse logistieke kosten en effectiviteit 1 2 3 4 5 o
6. Wat is ongeveer het gemiddelde aantal 3PL aanbieders dat uw klanten gebruiken?
……… 3PL aanbieders
7. Hoeveel procent van uw huidige contracten met klanten bevat afspraken over milieuvriendelijk en duurzaam ondernemen?
…….. %
8. Beoordeelt en/of selecteert uw onderneming potentiële klanten alvorens deze te accepteren?
o Jao Nee (ga door naar stelling 10)
9. Bij het selecteren van klanten door uw onderneming wordt vooral gekeken naar:
Geef aan in hoeverre u het eens bent met de genoemde redenen op een schaal van 1 tot 5.
Helemaal mee oneens Helemaal mee eens
N.v.t. /geen mening
Een goede match met uw industriefocus 1 2 3 4 5 o
De wil om een relatie op te bouwen die draait om samenwerking
1 2 3 4 5 o
De wil om een lange termijn relatie aan te gaan 1 2 3 4 5 o
De bereidheid van de klant om u een redelijk rendement te laten behalen
1 2 3 4 5 o
De grote van de klant en zijn logistieke netwerk 1 2 3 4 5 o
De financiële stabiliteit van de klant 1 2 3 4 5 o
Het groeipotentieel van de klant 1 2 3 4 5 o
Geef aan in hoeverre u het eens bent met de vier volgende stellingen:
10. Stelling: referenties van bestaande klanten zijn de belangrijkste manier om nieuwe klanten te werven.
77
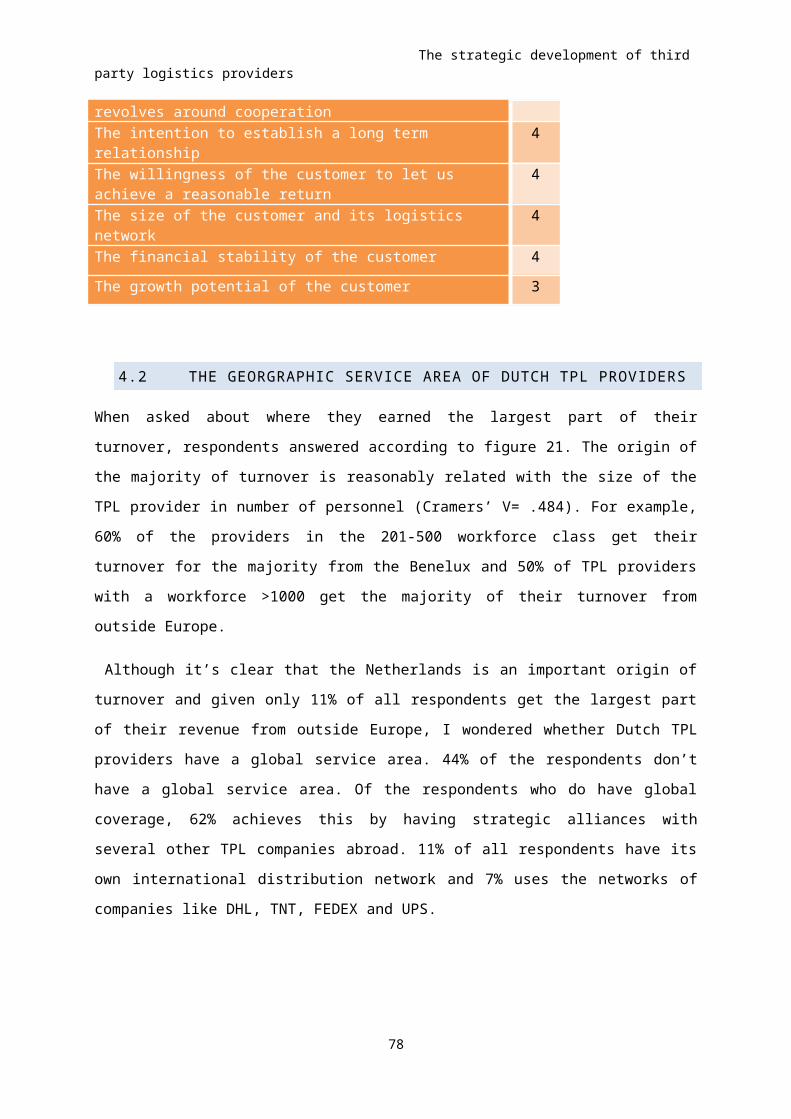
The strategic development of third party logistics providers
Helemaal mee oneens 1 2 3 4 5 Helemaal mee eens
11. Stelling: klanten besteden vooral operationele en repetitieve activiteiten uit en in mindere mate diensten die van strategisch belang zijn voor hen.
Helemaal mee oneens 1 2 3 4 5 Helemaal mee eens
12. Stelling: contracten die wij afsluiten met klanten bevatten altijd evaluatiemomenten, bonus en penalty afspraken en de mogelijkheid om contracten tussentijds te beëindigen bij slecht functioneren.
Helemaal mee oneens 1 2 3 4 5 Helemaal mee eens
13. Stelling: milieu en duurzame kwesties zijn belangrijk bij het afsluiten van nieuwe 3PL contracten of voortzetten van huidige contracten (met klanten).
Helemaal mee oneens 1 2 3 4 5 Helemaal mee eens
Er volgen nu enkele vragen over het geografisch verzorgingsgebied van 3PL aanbieders.
14. Het grootste deel van de omzet wordt door uw onderneming behaald in:
o Nederlando Beneluxo Duitslando Noord Europao Europao Buiten Europa
15. Heeft uw onderneming een wereldwijd dekkingsgebied?
o Ja, d.m.v. ons eigen internationale (distributie) netwerko Ja, d.m.v. strategische partnerschappen met verschillende andere 3PL ondernemingen in het
buitenlando Ja, d.m.v. gebruik te maken van het internationale netwerk van ondernemingen als DHL, TNT, FEDEX
en UPSo Nee, wij hebben geen wereldwijd dekkingsgebiedo Anders, namelijk:
Hier volgt een korte uitleg van het begrip near shoring. Enkele jaren geleden verhuisden ondernemingen hun productieactiviteiten massaal naar lage lonen landen aan de andere kant van de wereld, denk hierbij aan China. Maar als een reactie op stijgende loon- en materiaalkosten in deze landen en de volatiliteit van de olieprijzen brengen sommigen ondernemingen hun productieactiviteiten weer dichter naar huis. In het geval van Europese ondernemingen gaat het dan om het verplaatsen van productieactiviteiten vanuit bijvoorbeeld Azië naar Oost Europa. Dit fenomeen wordt near shoring genoemd.
16. Near shoring zie ik als een:
o Kanso Bedreiging
78

The strategic development of third party logistics providers
o Geen mening
Geef aan in hoeverre u het eens bent met de volgende stelling:
17. Stelling: onze onderneming heeft zich als doel gesteld om in de toekomst verder te internationaliseren.
Helemaal mee oneens 1 2 3 4 5 Helemaal mee eens
De volgende vier stellingen gaan over in hoeverre path dependency de capaciteiten van 3PL aanbieders beïnvloed.
Hier volgt een korte uitleg van het begrip path dependency (padafhankelijkheid). De historie van een onderneming is belangrijk, gezien het feit dat gedane investeringen in het verleden een onderneming ook kunnen beperken in de toekomst. Het pad dat in verleden gevolgd is zal dus grotendeels gevolgd worden in de toekomst. Dit fenomeen wordt path dependency genoemd.
Geef aan in hoeverre u het eens bent met de vier volgende stellingen:
18. Stelling: onze eerste klant is bepalend geweest voor onze huidige onderneming en klantfocus.
Helemaal mee oneens 1 2 3 4 5 Helemaal mee eens
19. Stelling: de capaciteiten en competenties van onze onderneming zijn vooral gevormd door klantrelaties uit het verleden.
Helemaal mee oneens 1 2 3 4 5 Helemaal mee eens
20. Stelling: ons huidige klantbestand beperkt ons in de selectie/opbouw van toekomstige klantrelaties.
Helemaal mee oneens 1 2 3 4 5 Helemaal mee eens
21. Stelling: een belangrijke overweging bij het aannemen van een nieuwe klant is in hoeverre deze klant een goede match heeft met ons huidige klantbestand/industriefocus en met onze doelen betreffende strategische positionering en capaciteitenontwikkeling van de onderneming
Helemaal mee oneens 1 2 3 4 5 Helemaal mee eens
De volgende vragen gaan over het doen van klantspecifieke investeringen.
22. De meeste investeringen die uw onderneming doet zijn:
o Klantspecifiek ( ten dienste van 1 klant)o Geschikt voor het bedienen van enkele klanteno Geschikt voor het bedienen van meerdere klanteno Geschikt voor het bedienen van al onze klanten
79

The strategic development of third party logistics providers
23. Doet uw onderneming investeringen die speciaal gedaan worden ten dienste van 1 klant?
Ja
Nee ( ga door naar vraag 29)
24. Hoeveel procent van de totaal door uw onderneming gedane investeringen in de afgelopen vijf jaar waren klantspecifiek?
…………%
25. Welke klantspecifieke investeringen worden door uw onderneming gedaan?
Meerdere antwoorden mogelijk.
o Investeringen in activa (zoals rollend materieel, vastgoed, opslagruimte, machines etc.)o Investeringen in medewerkers en/of hun opleidingeno Investeringen in IT systemen en/of IT koppelingeno Anders, namelijk:
26. Waarin worden door uw onderneming de grootste klantspecifieke investeringen gedaan?
o Activa o Medewerkers en/of hun opleidingeno IT systemen en/of IT koppelingeno Anders, namelijk:
27. Op welke manier regelen de klant en uw onderneming de financiering van klantspecifieke investeringen?
o Deze investeringen worden vooral gefinancierd door de klant > 50%o Deze investeringen worden door beiden voor 50% gefinancierd o Deze investeringen worden vooral gefinancierd door de 3PL aanbieder > 50%o Deze investeringen worden volledig (100%) gefinancierd door de 3PL aanbieder.
28. De belangrijkste redenen om klantspecifieke investeringen te doen zijn:
Geef aan in hoeverre u het eens bent met de genoemde redenen op een schaal van 1 tot 5.
Helemaal mee oneens Helemaal mee eens
N.v.t. / geen mening
Van meer strategisch belang willen zijn voor de klant
1 2 3 4 5 o
De hoge(re) winstmarges 1 2 3 4 5 o
Het zichzelf willen onderscheiden van de concurrentie
1 2 3 4 5 o
De concurrentie dwingt ons hiertoe 1 2 3 4 5 o
De economische crisis heeft gezorgd voor minder financieringsmogelijkheden bij klanten
1 2 3 4 5 o
De volgende vragen gaan over de strategische positionering van 3PL aanbieders in de markt.
80

The strategic development of third party logistics providers
29. De positie van 3PL aanbieders in de markt wordt vaak beschreven aan de hand van hun algemeen
probleemoplossend vermogen enerzijds en hun vermogen zich aan te passen aan de klant anderzijds. Welke
dimensie past het best bij uw onderneming?
o Service aanbieder: service aanbieders focussen op standaard services. Deze services kunnen complex
zijn maar zijn wel voor elke klant gelijk.
o Aanbieder van oplossingen: deze aanbieder neemt het gehele logistieke proces van zijn klant over.
Hierdoor moet de aanbieder van oplossingen zijn diensten aanpassen aan de specifieke eisen van de
klant, ookwel ‘’ service customizen’’ genoemd.
30. Welke omschrijving past het best de huidige en toekomstige staat van uw onderneming?
Kruis zowel voor de huidige als de toekomstige situatie (doel) aan welke omschrijving het beste bij uw
onderneming past
Nu Toekomst
Standard 3PL provider: Klanten wordt een combinatie van gestandaardiseerde diensten
aangeboden. Hierbij kan gedacht worden aan transport, opslag en order picking. De standard
3PL provider richt zich op het bedienen van zoveel mogelijk klanten.
Service developer: Een eigen IT system faciliteert het aanbieden van een grote
verscheidenheid aan diensten. Deze diensten kunnen door klanten gecombineerd worden
om in hun behoeften te voorzien. De service developer richt zich op het bedienen van zoveel
mogelijk klanten.
Customer adapter: De customer adapter levert diensten die totaal toegewijd zijn aan de
specifieke klant. Alle logistieke activiteiten worden overgenomen van de klant om zo de
efficiency te verbeteren. De 3PL aanbieder wordt vaak gezien als onderdeel van de
organisatie van de klant en heeft een select aantal klanten.
Customer developer: De customer developer heeft meer de rol van consultant. Vanwege de
op kennis gebaseerde basis van de onderneming en de hechte relaties met zijn klanten heeft
81

The strategic development of third party logistics providers
de customer developer maar een beperkt aantal klanten, waarvoor geavanceerde
klantoplossingen bedacht worden.
Geef aan in hoeverre u het eens bent met de volgende stelling:
31. Stelling: de diepte van de klantrelatie en de mate van aanpassing aan de klant hebben een negatieve invloed op het aantal klanten dat bediend kan worden (en omgekeerd) .
Helemaal mee oneens 1 2 3 4 5 Helemaal mee eens
De volgende drie vragen gaan over de value added services die 3PL aanbieders aanbieden en de groeikansen
die het aanbieden van value added services met zich meebrengt.
32. Welke value added services biedt uw onderneming aan?
o Binnenlands transporto Internationaal transporto Transport planning en managemento Opslag en voorraadbeheero Pick and Packo Douanebemiddelingo Inklaren en uitklareno Forwardingo Cross-dockingo Verpakken, herverpakken en labelen o Eindassemblageo Productconfiguratieo Adviseren over logistieke concepteno Kwaliteitscontroleo Orderinvoer, verwerking en vervulling (v.d. order)o Financieren van voorradeno Het factureren van de eindafnemero Testen en repareren van producteno Installeren van producten bij de eindafnemero Ontvangen en inspecteren van retourzendingeno Toevoegen van productkenmerkeno Aanbieden van IT serviceso Wagenparkbeheero Klantenserviceo Afval recycling en herconditioneringo Track and trace informatieo Verzekering gerelateerde diensteno Supply chain consultancy/diverse 4PL diensten o Anders, namelijk:
33. Hoeveel procent van de omzet van uw onderneming wordt gehaald uit andere diensten dan transport en opslag/voorraadbeheer?
……….%
34. Werkt uw onderneming samen met industriële onderaannemers om sommige value added services aan te bieden, zoals eindassemblage, productconfiguratie, kwaliteitscontrole en het testen en repareren van goederen?
o Ja
82

The strategic development of third party logistics providers
o Nee
De volgende vijf stellingen gaan over het streven van 3PL aanbieders om een groter deel van de supply chain te bedienen/bemachtigen.
35. Stelling: het uitbreiden van onze diensten gerelateerd aan supply chain management is een van de belangrijkste groeikansen voor onze onderneming.
Helemaal mee oneens 1 2 3 4 5 Helemaal mee eens
36. Stelling: onze onderneming wil zich in de toekomst ontwikkelen naar een zogenaamde 4PL aanbieder.
Helemaal mee oneens 1 2 3 4 5 Helemaal mee eens
37. Stelling: verladers zijn te gefocust op prijsniveaus en het op korte termijn verlagen van kosten en daarom is het moeilijk om als 3PL aanbieder aan effectief supply chain management te doen (een service waarvoor de verlader moet betalen)
Helemaal mee oneens 1 2 3 4 5 Helemaal mee eens
38. Stelling: 3PL aanbieders zullen zich in toenemende mate gaan toeleggen op diensten als het produceren en assembleren van goederen, mits de supply chain verder integreert en trends als mass customization en postponing product finalization doorzetten.
Helemaal mee oneens 1 2 3 4 5 Helemaal mee eens
39. Stelling: 3PL aanbieders bieden custimzation en postponement of product finalization aan omdat dit gedeelte van de supply chain hogere winstmarges oplevert dan opslag, transport en distributie.
Helemaal mee oneens 1 2 3 4 5 Helemaal mee eens
Ter afsluiting worden enkele algemene vragen gesteld over de karakteristieken van uw onderneming
40. Uw onderneming is een/ziet zichzelf vooral als:
o Transporteur o Third party logistics provider (3PL /TPL) o Fourth party logistics provider (4PL)
41. Hoeveel personeelsleden telt uw organisatie?
o <50 o 50-200o 201- 500 o 501-1000 o 1000>
42. Uw onderneming is vooral:
o Asset based: onderneming die over bepaalde activa beschikken, zoals vrachtwagens, schepen, eigen opslagcapaciteit en andere fysieke eigendommen.
83

The strategic development of third party logistics providers
o Non Asset based: beschikken niet over veel eigen activa en besteden het fysieke transport- en opslagproces dan ook uit. Het fundament onder dit soort ondernemingen is hun kennisniveau en kunde.
Einde vragenlijst
Heeft u nog op- of aanmerkingen over deze vragenlijst?
Indien u interesse heeft in de resultaten van dit onderzoek kunt u hieronder uw e-mailadres opgeven:
Bedankt voor uw medewerking!
Met vriendelijke groet,
Lex Miechels
84