the story of world history through the most … · skepticism about the efficacy of infrastructure...
TRANSCRIPT
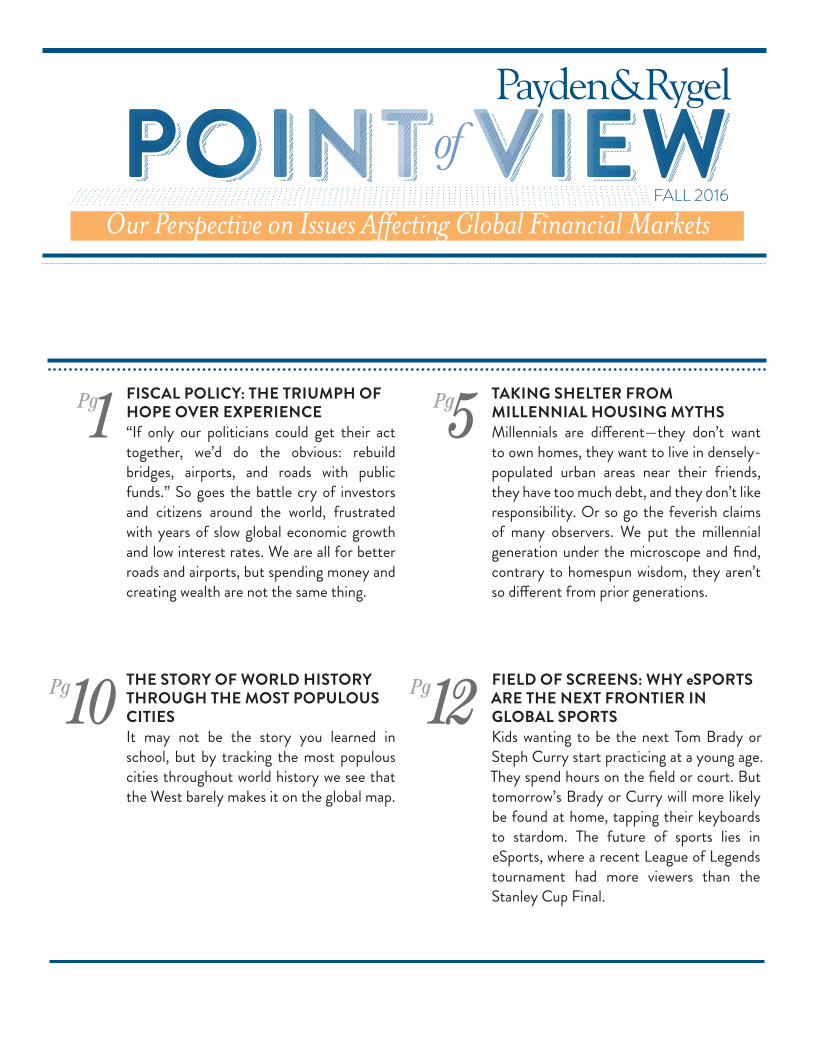
Pg1FISCAL POLICY: THE TRIUMPH OF HOPE OVER EXPERIENCE“If only our politicians could get their act together, we’d do the obvious: rebuild bridges, airports, and roads with public funds.” So goes the battle cry of investors and citizens around the world, frustrated with years of slow global economic growth and low interest rates. We are all for better roads and airports, but spending money and creating wealth are not the same thing.
Pg12FIELD OF SCREENS: WHY eSPORTS ARE THE NEXT FRONTIER IN GLOBAL SPORTS Kids wanting to be the next Tom Brady or Steph Curry start practicing at a young age. They spend hours on the field or court. But tomorrow’s Brady or Curry will more likely be found at home, tapping their keyboards to stardom. The future of sports lies in eSports, where a recent League of Legends tournament had more viewers than the Stanley Cup Final.
Pg 5TAKING SHELTER FROM MILLENNIAL HOUSING MYTHSMillennials are different—they don’t want to own homes, they want to live in densely-populated urban areas near their friends, they have too much debt, and they don’t like responsibility. Or so go the feverish claims of many observers. We put the millennial generation under the microscope and find, contrary to homespun wisdom, they aren’t so different from prior generations.
Pg10THE STORY OF WORLD HISTORY THROUGH THE MOST POPULOUS CITIESIt may not be the story you learned in school, but by tracking the most populous cities throughout world history we see that the West barely makes it on the global map.
FALL 2016

1
I f you believe President-elect Donald Trump’s infrastructure plan
is the key to revitalizing US economic growth, would you be in-
terested in a bridge we have for sale?
Ok, ok. Maybe we are too harsh. At the heart of the matter is our deep
skepticism about the efficacy of infrastructure spending as a means of
boosting economic output. It isn’t a political problem with Republi-
cans or Donald Trump. We feel the same about President Obama’s
large fiscal stimulus program during the 2007-2009 recession. It’s an
“economics” thing.
Rather than argue with the many critics who say $X trillion worth of
infrastructure spending is too much or too little, rather than get into
late-night disputes with academic colleagues about whether the fiscal
multiplier1 is 0.5x or 1.5x, we set ourselves two tasks.
The first task is to set the record straight with a little infrastructure
myth-busting.
Our second task is to detail two simple rules for policymakers to fol-
low when they conduct infrastructure spending. We will build each
rule by evidence of where current infrastructure practices fail. We
don’t pretend these rules are final, but they are a starting point. Who
knows, you might even think of them the next time you curse your
dilapidated local airport.
INFRASTRUCTURE MYTH-BUSTING
Our myth-busting exercise below demonstrates that contrary to pop-
ular opinion, the United States does not suffer from dramatic under-
investment in public infrastructure, nor does it suffer from extreme
lack of quality in the services such public capital provides.
Myth 1: “We used to build beautiful dams, roads, and highways, but the US government doesn’t spend money on infrastructure anymore.”
Reality 1: Even in the last year the federal government has dedi-
cated significant resources to improving infrastructure. In December
2015, President Obama signed a $306 billion infrastructure bill—the
Fixing America’s Surface Transportation (ahem, FAST) Act. What is
more, total public investment in water and transportation infrastruc-
ture has remained fairly constant as a share of gross domestic product
(GDP) since 1980 (see Figure 1 below). Real GDP has increased by
2.5x since 1980. Accordingly, public spending on infrastructure has
increased from roughly $165 billion in 1980 to $416 billion in 2014.
Myth 2: “Federal government spending on infrastructure is the way to boost growth.”
Reality 2: The federal government accounts for only a small share
of overall public spending on infrastructure. Since 1956, state and lo-
Fiscal Policy: The Triumph of Hope Over Experience
MARGINAL UTILITY? PUBLIC INVESTMENT IN WATER AND TRANSPORT INFRASTRUCTURE HAS BEEN FAIRLY CONSTANT AS A % OF GDP SINCE 1980
fig. 1
Source: Congressional Budget Office
% o
f Gro
ss D
omes
tic
Prod
uct
Highways
Mass Transit and Rail
Aviation
Water Utilities, Resources, and Transportation
0.0%
0.5%
1.0%
1.5%
2.0%
2.5%
3.0%
1960 1966 1972 1978 1984 1990 1996 2002 2008 2014
30-year average

2
cal government spending on public infrastructure averaged 72% of all
infrastructure investment. The only category where federal govern-
ment investment approaches state and local investment is in aviation
infrastructure, contributing $0.44 of every $1 invested. Compare that
with water utilities for which state and local governments spend $0.96
of every $1 invested. If the federal government contributes to spend-
ing, we might expect that contribution to come mostly in the form of
subsidized infrastructure borrowing packages for state and local gov-
ernments to deploy.
Myth 3: “The US has the worst infrastructure in the developed world.”
Reality 3: The World Economic Forum releases annual rankings
of the quality of infrastructure. On a scale of 1-7, with seven as the
best rating, the United States’ infrastructure in 2015 was ranked 5.8,
better than the G-7 average score of 5.5. Quit complaining about pot-
holes: the US and Germany both ranked 5.7 for their road quality,
bested only by Japan (6.0) and France (6.1). It is worth noting, how-
ever, that across the board, G-7 nations’ infrastructure quality has de-
clined overall in the last decade, falling from a ranking of 5.8 in 2006
to 5.5 in 2015.
Myth 4: “Driving over bridges becomes more dangerous for Americans each year that passes. Remember the tragedy that befell the I-35W Missis-sippi River Bridge in Minnesota?”
Reality 4: Since the 1990s, the number of structurally deficient
or functionally obsolete bridges in the United States has consistently
declined. The most recent Economic Report of the President notes
that as a group, structurally deficient and functionally obsolete bridges
“accounted for just below 24% of all bridges in 2014, the smallest an-
nual percentage on record.”2 Contrary to received wisdom, American
motorists have never been safer crossing bridges than they are today.
And the tragic bridge collapse in Minnesota in 2007 wasn’t the fault
of under-investment, but rather a design flaw.
Myth 5: “President-elect Trump’s infrastructure spending policy is text-book Keynesian stimulus: government hires those workers in those places at those times where the private sector will not.”
Reality 5: Keynes advocated for government spending during
recessions to boost otherwise lackluster private sector demand. The
grandfather of modern economics wrote, “the employment of a given
number of [people] on public works will…have a much larger effect
on aggregate employment at a time when there is severe unemploy-
ment than it will have later on when full employment is approached.”3
NEWSFLASH: We are not in a recession. The unemployment rate
(currently at 4.6%) is below official estimates of normal levels of un-
employment (4.8%). The supposed “Keynesian” benefits from Trump’s
infrastructure spending are smaller than they would have been during
2009.
Recent research analyzing the efficacy of the 2009 American Recov-
ery and Reinvestment Act shows even more clearly why infrastructure
spending in practice does not work as well as it does in Keynesian the-
ory. Economist Andrew Garin shows that highway projects “had zero
effect...on road construction employment–or other employment–in
the locale of the construction site.”4 Spending increased employment
levels in the home counties of the projects’ contractors, but not in
the home counties of the projects built. Also, with political logjam at
many levels of government, pushing through a timely stimulus bill to
help unemployment is nearly impossible.
THE RULES OF THE GAME
The record should now be straight. It is always possible to spend more
money on public infrastructure, but the United States suffers nei-
ther from dramatic underinvestment nor poor quality. That said, we
still think there is room for dramatic improvement in quality without spending unnecessary money.
RULE 1: PRICES ARE RIGHT
We invest because we seek a positive return. Because tax dollars finance
most infrastructure projects, rather than user fees, it can be difficult to
determine a project’s return. To the extent possible, we suggest public
officials fund projects with explicit user fees, or prices, which make
clear the marginal cost of use across infrastructure projects.
We can look at two examples to show how dramatic the effects of
pricing can be on infrastructure. First, think about the pavement on
the roads we drive every day. In the United States, the Highway Trust
Fund is the federal government’s primary source of funds for spending
on roads. The Highway Trust Fund depends on taxes on gasoline and
diesel fuel. The $0.184 per gallon for gasoline and $0.244 per gallon
for diesel fuel taxes generated $40.8 billion in revenue in 2015. That
compares to $51.8 billion in expenses. The shortfall is not the result of
political gridlock. Rather the problem takes root in problematic pric-
ing (see Figure 2 on next page).
Is the solution raising the gasoline tax? Probably not. First, gasoline
taxes are “basically invariant to changes in traffic volume throughout
the day.”5 That means that drivers who decide to drive at peak hours
need not pay more than those who would drive at less congested times.
Another reason the gas tax is a sub-optimal arrangement for paying
for highways is that the revenues generated from the tax are “inversely
related to a truck’s weight per axle.” Trucks with more axles exert less
strain on paved surfaces. Thus, a truck with many axles reduces the

3
cost of road maintenance. However, these kinds of trucks also “get
lower fuel economy and pay higher gasoline taxes.”7 Truck owners
have an incentive to use trucks that generate the least amount of rev-
enue (because they are fuel-efficient) and the most amount of harm to
the roads (because the trucks have fewer axles).
What might work better than a gas tax? Pricing the cost of travel dur-
ing peak periods is a start, as well as implementing pavement-wear
taxes based on trucks’ weight per axle. With real prices, better incen-
tives produce a better balance between the amount of road wear, the
amount of traffic, the impact on the environment, and the amount of
revenue available to pay for repairs to our infrastructure.
A second example shows how pricing can work to improve the quality
of infrastructure spending. London introduced a congestion charge
in 2003 to reduce incentives to drive cars in the heart of the city from
MORE FEDERAL DOLLARS WENT TOWARD EXPANDING CAPACITY ON LOW-USE, RURAL HIGHWAYS. WHY FIX THE ROADS THAT MORE PEOPLE USE?
fig. 3
Source: Congressional Budget Office based on data from the Federal Highway Administration and the Bureau of Economic Analysis
0.0
1.0
2.0
3.0
4.0
5.0
6.0
1980 1984 1988 1992 1996 2000 2004 2008 2012
Mill
ions
of A
nnua
l Veh
icle
-Mile
s Tr
avel
ed P
er L
ane-
Mile
Highway Congestion
0 0.1 0.2 0.3 0.4 0.5 0.6 0.7 0.8 0.9 1
Rural, Other Federal-Aid
Urban, Other Federal-Aid
Rural, Interstate
Urban, Interstate
2014 Dollars
Spending to Expand Capacity perVehicle-Mile Traveled in 2013
U.S. COMMUTER DELAYS DUE TO TRAFFIC HAVE STEADILY INCREASED DESPITE MORE SPENDING ON INFRASTRUCTURE. MORE SUPPLY DOES NOT EASE DEMAND!
fig. 2
0
10
20
30
40
50
60
70
1982 1986 1990 1994 1998 2002 2006 2010 2014
Ann
ual H
our
s o
f D
elay
Very Large Urban Areas Large Urban Areas Medium-Sized Urban Areas Small Urban Areas
Source: Congressional Budget Office based on data from the Texas Transportation Institute.

4
07:00 to 18:00 during the workweek (the current cost is £11.50 per
day). Recent reports suggest, “The introduction of Congestion Charg-
ing in 2003 has had a significant impact in shifting people away from
using cars, contributing to an overall reduction in vehicle kilometres
in London of 11% between 2000 and 2012.”8 What is more, the fees
generated “paid for more than $1.7 billion in walking, bicycling and
public transportation improvements.”9
RULE 2: INVEST IN HIGH GROWTH AREAS
At its best, public infrastructure invigorates private enterprise by pro-
viding goods and services upon which new firms can build. Jeff Bezos,
reflecting on the early days of Amazon.com, specifically describe pub-
lic highway and internet infrastructure as essential to the success of
his entrepreneurial experiment.10
That is the best case. The worst case for public infrastructure invest-
ments occurs when public dollars pour into exciting projects that
might not be essential for overall growth. The second rule for infra-
structure investment reminds policymakers not to fall for the fallacy
that new and shiny is always better.
Take the Detroit People Mover (DPM) as an example. Originally
conceived as a demonstration project for the United States Federal
Transit Administration, the DPM began operating on July 31, 1987.
Two decades after the DPM began operating the Federal Transit Ad-
ministration retrospectively analyzed the project’s operating efficiency.
The study found, “for the decade 1997-2006, the People Mover’s op-
erational costs exceeded $3 per passenger mile every year and topped
$5 per passenger mile for five of those years. In 1999, it spiked to
$14.64 [per passenger mile]. Consider that New York City’s famously
efficient subways regularly run at around 30 cents per passenger mile
and that most of Michigan’s largest city bus systems do the job for
around $1 or less—including the Detroit Department of Transporta-
tion buses that run within the People Mover’s route.”11
Indeed, recent estimates show that “fares from riders contributed just
7 percent of the People Mover’s operating costs.”12 Much of the ex-
planation behind the DPM’s difficulties lies not with bad intentions
or a failure to build a flashy new public transit system, but rather bad
demographics. Since the DPM was build, Detroit’s population has
shrunk nearly by half, making the economics of the project less desir-
able.
Investing in infrastructure for growing product areas or geographies
makes economic sense. Larger populations can mean lower average
and marginal costs. The trouble with directing public investment to
those areas with the most promise, of course, is that the gains from
such investments are not as widely shared as the lawmakers who enact
the policy wish.
WILL MYTHS TRUMP RULES?
The United States appears poised to make important decisions about
public infrastructure investment. President-elect Donald Trump
would do well to sort out the myths of spending and focus on simple
rules to make efficient decisions.
Donald, if you are reading, we hope that you consider attaching prices
to public investment. We hope further that you direct those public
dollars toward geographies or industries which are growing, not de-
clining. Finally, we hope that you acknowledge that while there is of-
ten market failure, there is just as often government failure. Writing
infrastructure bills that begin from myth-free premises and contem-
plate the rules we describe might help us avoid to avoid wasting pre-
cious taxpayer dollars.
SOURCES
1 The fiscal multiplier is macroeconomics lingo for the impact of fiscal stimulus on total economic output. For example, if $100 billion in new fiscal stimulus generates $150 billion in net, new gross domestic product, the fiscal multiplier is said to be 1.5. As with most things in macroeconomics, there is widespread disagreement on the size of the fiscal multiplier, with some economists arguing the multiplier is actually negative (implying fiscal spending reduces economic output).
2 Economic Report of the President, 2016. Washington: Government Printing Office, 2016. pg. 258
3 Keynes, John Maynard (1936). The General Theory of Employment, Interest and Money. London: Macmillan
4 Garin, Andrew (May 2016). “Putting America to Work, Where? The Limits of Infrastructure Construction as a Locally-Targeted Employment Policy.” Taubman Center Working Paper
5 Winston, Clifford (2006). Government Failure versus Market Failure. AEI-Brookings Joint Center for Regulatory Studies, pg 64
6 Ibid. pg 65
7 Ibid. pg 65
8 Transport for London, Impact Assessment
9 Nelson, Laura (Mar 2015). “MTA’s toll-lane project may be a victim of its own success.” LA Times
10 Jeff Bezos (Oct 2016). “Walter Isaacson sits down with Amazon CEO Jeff Bezos at the Aspen Institute.” youtube.com
11 Braun, Ken (Dec 2007). “The Detroit People Mover Still Serves as a Rich Folks’ Roller Coaster.” Michigan Capitol Confidential
12 Gantert, Tim (Feb 2011). “Pricey pensions for Detroit’s roller-coaster for rich people.” Spero News

5
Among today’s most popular certainties are the special
characteristics possessed by a single demographic group: the
millennials. Never are journalists, marketers, and analysts in short
supply of insight into 18-34 year-olds’ habits and preferences, perhaps
because so many are themselves millennials or because they want to
appeal to millennials. Anecdotal evidence often passes for analysis.
As skeptical economists who deride anecdotes, we decided to examine
these claims. Below we bust two myths about millennials and housing.
Whether or not our conclusions agree with your young cousin’s expe-
rience, we introduce data on homeownership and student debt. In do-
ing so, we hope to show that the certainty with which many opine on a
subgroup in the global economy rests on little more than convenience.
NO HOMIES
One of the most common myths we hear about millennials concerns
their unique shelter preferences. They “don’t want to own homes,” peo-
ple say. Instead, “millennials want to live in urban centers with their
friends.” Or “millennials still live with Mom and Dad because they
can’t find good jobs.” These arguments and many similar variants are
in our crosshairs.
First, though, the above claims do seem to have some grounding in
fact. Homeownership rates across the western world have reached
decadal lows. Census Bureau data show that homeownership in
America hit a high of 69% in 2004 but has since plummeted to 63%,
the lowest level since 1965.
Arm-chair demographers also point to explosive rent growth in urban
areas as more evidence that millennials don’t want to own homes and
would prefer to rent. Shock and awe headlines from the Daily Mail proclaim, “Generation Rent hit by a new surge in prices.”1 In San Fran-
cisco over the last five years, rental prices have jumped 3.9% on aver-
age, per year. Some point to such rapid price appreciation as evidence
of the insatiable millennial demand for rental housing.
MAKING HOUSES HAPPY HOMES, EVEN FOR MILLENNIALS
Now comes the skepticism. Yes, homeownership rates are low, and
yes rental prices have boomed. We think it wise to contextualize these
phenomena before pronouncing millennial homeowners down for the
count.
Taking Shelter from Millennial Housing Myths
ZERO STUDENT LOAN BALANCE OR A $50,000 STUDENT LOAN BALANCE: THE PROBABILITY OF HOMEOWNERSHIP DOESN’T CHANGE MUCH
fig. 1
Source: Zillow Research
0%
10%
20%
30%
40%
50%
60%
70%
80%
90%
No Degree Associate's Bachelor's Master's Doctorate
Prob
abili
ty o
f Hom
e O
wne
rshi
p
$0 Student Loan Balance $50,000 Student Loan BalanceAmong those with college degrees, the probability of
homeownership only decreases marginally as student debt levels rise

6
Consider that survey data disproportionately show millennials want
to own homes. In a recent poll conducted by the Urban Land In-
stitute, “Fully 70 percent of [millennials] expect to be homeowners
by 2020. The response to this question five years ago was almost as
high—[at] 67%.”2 This datum describes an important point. Millen-
nials’ preference for homeownership is strong, just like the generations
before them.
As for the many suggestions that millennials only want to live in cities?
A National Home Builders Association survey “found that 66% want
to live in the suburbs, 24% want to live in rural areas and 10% want
to live in a city center.”3 Evidence runs deeper than surveys, though.
A glance at the most recent Census Bureau data shows that 1.9 mil-
lion millennials moved out of cities into the suburbs, while only 1.3
million millennials moved out of the suburbs into cities. What is
more, Census data suggest that since 2000, older millennials are less
likely than previous generations to live in urban areas.
The myth of unique millennial shelter preferences bursts as soon as
one looks at the data. Yes, specific millennial cohorts, such as college-
educated young people, are increasingly moving to cities. But these
people are the exception and not the rule. Comprehensive survey data
and migration statistics demonstrate that millennials’ preferences for
shelter do not look much different from the generations that came
before.
DO NOT BET AGAINST STUDENT DEBT
Millennials’ balance sheets do look very different from earlier genera-
tions. Rising college tuition and graduation in the depths of a reces-
sion have meant that the liability side of many millennials’ balance
sheets has expanded rapidly.
Since 2004 most segments of household debt have increased at a mea-
sured pace, on average about 3% per year. Student loans have jumped
nearly 14% per year for more than a decade. A portion of the rise in
student loan debt is because, over the same period, the price of college
tuitions and fees has averaged annual increases of 5.2%. That coupled
with a difficult job market and the loss of household savings during
the recession, and we can cook up a high growth rate in student debt.
So far, so factual. The problem arises when would-be analysts extend
their student loan reasoning to the housing market. The dramatic ex-
pansion of student debt, they claim, is the primary reason that young
homeowners cannot access the market. Their balance sheets are al-
ready too encumbered, and banks will not extend credit.
TESTING STUDENTS’ BORROWING CAPACITY
There are two observations that invalidate the suggestion that student
debt is keeping millennials out of the housing market. The first is that
student loan debt tends to rise with future earning power. Thus, those
borrowers with the most debt are often those with the most capacity
to repay. Second, nearly all borrowers—millennial or not—have had
a harder time obtaining a mortgage.
«IN A RECENT POLL CONDUCTED BY THE URBAN LAND INSTITUTE, “FULLY 70
PERCENT OF [MILLENNIALS] EXPECT TO BE HOMEOWNERS
BY 2020.»
Source: Zillow Research, Panel Study of Income Dynamics, public use dataset. Produced and distributed by the Survey Research Center, Institute for Social Research, University of Michigan, Ann Arbor, MI (2016).
$38,383
$59,247
$82,107
$106,535
$141,774
$3,962 $9,988
$22,722
$42,014
$90,786
$0
$20,000
$40,000
$60,000
$80,000
$100,000
$120,000
$140,000
$160,000
No Degree Associate's Bachelor's Master's DoctorateHighest Household Degree
Average Income Average Student Loan Balance
AS THE LEVEL OF EDUCATION RISES, SO TOO DOES THE AVERAGE STUDENT LOAN BALANCE. DON’T WORRY TOO MUCH ABOUT THE DEBT FOR THOSE WITH YEARS OF SCHOOLING.
fig. 2

7
We should note outright that there is some evidence to suggest that
higher student debt reduces the probability of homeownership. Our
conjecture, supported by Zillow analysis, is that the effect is much
smaller than most people assume. Indeed, increases in student loan
balances for those with bachelor’s degrees only lowers the probability
of homeownership by 4% (see Figure 1). In other words, even if some
millennials are less likely to own homes because of their student debt,
the argument only applies under specific circumstances.
To deepen the conversation beyond the simple assumption that more
student debt prevents homeownership, we must acknowledge that not
all student debt is created equal. A $50,000 loan balance for a student
in medical school is meaningfully less relevant for prospective home-
ownership than a $50,000 loan balance for a student who dropped
out of a for-profit online “school.”
To see why this is true, we must think not only about the amount of debt
assumed by a student but of the kind of education to which the debt is
applied. Most important, higher levels of education correlate well with
higher lifetime earning power. Thus even if students assume more
debt as they climb higher on the educational ladder, we ought to wor-
ry less about their marginal dollar of debt impacting homeownership
(see Figure 2).
The College Board report on the distribution of student debt does not
mince words. “Graduate students and undergraduates who borrow to
attend selective colleges have the largest debts and the lowest default
rates. Students who attend for-profit and public two-year colleges
have the smallest debts and the highest default rates.”4
Figure 4 contains information on the total amount of debt outstanding
(and the five-year default rate) of student loans by the kind of institu-
tion. The borrowers with the highest default rates (2-year and for-
profit) only account for 25% of federal student loan debt outstanding.
Four-year and graduate school borrowers, while they account for 75%
of all federal student debt, have much lower five-year default rates (see
Figure 3).
Another reason loan balances alone do not contain much informa-
tion regarding the probability of homeownership is that students with
loans who graduate are much more likely to repay their debt. In 2015,
only 2.8% of those with bachelor’s degrees were unemployed, com-
pared to 5.4% of those who only possessed a high school diploma.
What is more, the median usual weekly earnings of someone with
a bachelor’s degree were nearly twice as much as someone without
($1,137 compared to $678).5
Any claims about the relationship between student loans and home-
ownership ought to be moderated by considerations not only regard-
ing the level of education achieved but also regarding the general state
of housing credit. Simply asserting that millennials cannot buy homes
Source: Looney A. and C. Yannelis (2015)."A crisis in student loans? How changes in the characteristics of borrowers and in the institutions they attended contributed to rising loan defaults."
10% 20% 30% 40% 50%$0.0
$0.2
$0.4
$0.6
$0.8
$1.0
$1.2
1986 1990 1994 1998 2002 2006 2010 2014
Trill
ions
of U
SD
Aggregate Federal Student Loan Debt by Institution Type, 1985- 2014
Graduate Only
Selective 4-year
Somewhat Selective 4-year
Nonselective 4-year
2-year
For-Profit
$115B
$260B
$270B
$175B
$117B
$189B
Graduate-Only Borrowers
Most Selective 4-Year
Selective 4-Year
Nonselective 4-Year
Public 2-Year
For-Profit
Five-Year Default Rate by Institution
0%
THE LARGEST STUDENT BORROWERS, THOSE AT-FOUR YEAR SELECTIVE INSTITUTIONS, HAVE AMONG THE LOWEST DEFAULT RATES
fig. 3
«NEARLY ALL BORROWERS—MILLENNIAL OR NOT—HAVE
HAD A HARDER TIME OBTAINING A MORTGAGE.»

8
because they have large student debt balances misses more impor-
tant causal factors that have contributed to lower post-financial crisis
homeownership rates.
IT AIN’T STUDENT DEBT; IT’S THE BANKING SYSTEM, STUPID
After a generational housing boom and bust, it shouldn’t be surprising
to learn that mortgage lending retrenched. The volume of applications
for mortgages to purchase a home doubled from 1997 to 2005, and
then dropped by nearly 70%. The first thing to note is that it isn’t only
millennials who haven’t been buying houses—Americans have been
buying fewer houses.
What is more, tighter post-crisis bank lending standards have meant
that young borrowers, without much credit history and an established
career, will have a harder time obtaining a loan. Where a run-of-the-
mill mortgagee had a FICO score of ~720 before the crisis, after 2008,
those who’ve successfully accessed mortgage loans have FICO scores
closer to ~760.
Tighter mortgage lending conditions narrow the pool of borrowers
who might qualify for a loan. Of all 130 million American mortgage
loans, 68 million (52%) would be unaffected by the change in lending
standards (see Figure 4). However, for the 21 million borrowers with
credit scores between 701 and 750, finding financing for a home pur-
chase is more difficult today.
And it isn’t the case that large student loan balances are driving mil-
lennials’ FICO scores lower. As long as a young graduate makes her
payments on time, her “credit history can benefit from having an ‘in-
stallment’ student loan on her credit report, because responsibly man-
aging it demonstrates that she has experience dealing with different
types of credit.”6 Indeed, one-fifth of all borrowers with more than
$50,000 worth of student loan debt have FICO scores higher than
750.
Tighter mortgage lending helps explain recent trends in homeowner-
ship across demographic groups. And it isn’t the case that millennials
Wei
ghte
d A
vera
ge F
anni
e M
ae C
onfo
rmin
g Lo
an B
orro
wer
Cre
dit
Scor
e
Source: Fannie Mae
700
710
720
730
740
750
760
770
780
1999 2000 2001 2002 2003 2004 2005 2006 2007 2008 2009 2010 2011 2012 2013 2014 2015
Pre-Crisis Average
NO CREDIT WHERE CREDIT IS DUE? THE AVERAGE FICO SCORE FOR HOME BUYERS HAS INCREASED BY 30+ POINTS SINCE THE CRISIS
fig. 4
«THE FIRST THING TO NOTE IS THAT IT ISN’T ONLY
MILLENNIALS WHO HAVEN’T BEEN BUYING HOUSES—AMERICANS HAVE BEEN
BUYING FEWER HOUSES.»

9
with large student loan balances are unduly impacted from a credit
score perspective.
MYTHS BUSTED
Making blanket statements about generational preferences is danger-
ous. As demonstrated above, there is little in the way of facts to sup-
port claims that millennials have radically different preferences when
it comes to homeownership.
Much of the evidence that people use to support such claims, while in-
dependently correct, isn’t helpful in explaining the behavior they wish
to understand. Homeownership has fallen, rental prices are higher,
and student loan balances are larger. These are all true. The central
myth, though, is that these features of our world are the product of
generational preference.
A larger lesson might be drawn from our millennial myth busting.
Especially in Anglo-Saxon housing markets, the first decade of the
twenty-first century saw an unusually volatile housing market cycle.
The highs and lows were historic. Reasoning from any one data point
during that period would have been useless.
We conclude by suggesting that in any market, at any time, when in
the midst of extreme cyclical movements, investors should refrain
from pronouncing massive changes in preference. It is not to say that
preference change does not occur. Suburban housing is more pre-
ferred today than it was 50 years ago. We only counsel, in the words
of Indeed.com’s chief economist Jed Kolko, “be cautious [when call-
ing] big changes in preferences in how people want to live and where
people want to live…trends should be presumed cyclical until proven
structural.”
SOURCES
1 Sculthorpe, Tim (Feb 2016). “Generation Rent hit by a new surge in prices as charges race away from wage increases and inflation.” Daily Mail
2 Lachman, M. Leanne, and Deborah L. Brett. Gen Y and Housing: What They Want and Where They Want It. Washington, D.C.: Urban Land Institute, 2015
3 Hudson, Kris ( Jan 2015). “Generation Y Prefers Suburban Home Over City Condo.” WSJ.com
4 College Board (2016). Trends in Student Aid 2016.
5 Bureau of Labor Statistics. “Earnings and Unemployment Rates by Educational Attainment, 2015.”
6 Havens, Kelsey (Dec 2015). “How Student Loans Affect Your FICO® Scores.” FICO Blog
7 Kolko, Jed (2014). “Real Estate: Housing Builds a New Foundation.” Milken Global Conference Panel

1
2
3
45
6 7
8 9
10
11
12
13
1 2 3
Anyang Nineveh Chang’an Kaifeng Beijing LondonRomeBabylonBabylon Alexandria Constantinople Hangzhou TokyoRome BeijingChang’anThebes
BCE BCE CE CE1100 500 100 100 700 1100 1500 1900 2000500 1300900 700 300 300 900 1700
4 5 6 7 8 9 10 11 12 134
800,0
00
6
750,0
00
8
650,0
00
11
City Population in Numbers*
50,00
0
50,00
0
100,0
00
150,0
00
400,0
00
1,000
,000
450,0
00
1,000
,000
1,000
,000
800,0
00
678,0
00
6,60
0,000
26,40
0,000
150,0
00

12
I t’s Friday night at Madison Square Garden—one of the most ven-
erated entertainment venues on Earth. Sponsor banners adorn
the packed arena. Inside the stadium a sellout crowd cheers, stomps,
and fist-pumps for one of the greatest players of all time.
But the legions of spectators haven’t worked themselves into a frenzy
for LeBron James. Or Serena Williams. The target of their undying
admiration? Lee “Faker” Sang-hyeok, the king of StarCraft.
Star-Wuh? Huh?
StarCraft. It’s a video game. And Faker? He is, well, the Michael Jor-
dan of StarCraft. Faker excels as an “eSports” athlete. StarCraft, a
game released in 1998 by California video game producer Blizzard
Entertainment as a follow-up to “WarCraft,” is a team-based strategy
game. And eSports, a term coined in the 1990s for competitive video
gaming, will most assuredly be the next big thing in sports.
That’s right, the next big thing in sports struggles and strives some-
where other than a tennis court, football field, basketball court, or
soccer pitch. Try a sofa. Or, more appropriately, a high-tech desk
chair. The next sporting superstar may just be positioned in front of
a computer screen, hands expertly working the gaming keyboard and
mouse, rather than behind the center on Sunday. Look for the tell-tale
signs of callouses on wrists and fingers.
Oh, sure, scoff and roll your eyes. Protest petulantly that eSports ath-
letes “are not athletes!” But do so at your peril. A closer look at the next
generation of sports provides a glimpse into the future of sports and
entertainment.
A BRIEF HISTORY OF eSPORTS
eSports is not just video games but video games played in a competitive
format, such as one-on-one (like a tennis match), team-versus-team
(like a soccer game) or against a clock or point system (like an Olym-
pic sledding or figure skating event). Gaming competitions have been
around almost as long as video games themselves. Atari organized
one of the first in 1981 (see Did You Know? box for more details).
But it was the internet that made competitive gaming possible on a
much larger scale. Before internet connections, lonely gamers pitted
themselves against home computers or invited friends over to join in
the fun. With the growth of broadband internet connections, gaming
popularity surged. The internet connection allowed players to face-
off against friends and faceless foes around the country—and the
world—in real-time.
South Korea, of all places, featured prominently in this transition.
Suffering a financial crisis in the late 1990s the government was forced
to scramble for solutions to generate growth. Deregulation in the
telecom sector led to better broadband capacity and the “multi-user
game mania” took off. Television stations sprung up to focus on gam-
ing competitions, fostering a national culture of gaming and spawning
heroes not unlike sports heroes in more traditional sports. eSports
were born.
Field of Screens: Why eSports Are the Next Frontier in Global Sports
DID YOU KNOW?
Key Milestones in the History of eSports
The 1960s: MIT computer scientists used time on the mainframe computer to play Spacewar!
1981: The Space Invaders tournament held
The mid-1980s: The Starcade TV program
1988: The Creation of IRC (Internet Relay Chat)
1994: Doom II released, includes “multiplayer option” through dial-up internet
2000: Professional gaming organizations (e.g., IEM, MLG) emerge
2007: Justin.tv debuts
2028: eSports at the Summer Olympics in Johannesburg?
«OH, SURE, SCOFF AND ROLL YOUR EYES. PROTEST
PETULANTLY THAT ESPORTS ATHLETES "ARE NOT
ATHLETES!" BUT DO SO AT YOUR PERIL.»

13
“THEY AREN’T ATHLETES!”
Let’s next tackle a common objection: eSports aren’t real sports, and
the players are not real athletes. In fact, you may be asking yourself,
what could be less athletic than a video-game-playing teenager? Im-
ages of Cheetos scattered messily across a sofa and unhealthy sleeping
and shaving habits come to mind. None other than ESPN President
John Skipper opined: “[eSports are] not a sport — it’s a competition.
Chess is a competition. Checkers is a competition. Mostly, I’m inter-
ested in doing real sports.”1
We disagree. First off, few complain that those folks ambling around
manicured lawns, chasing little plastic and rubber balls on Sunday af-
ternoon, are not athletes. Many aren’t. Still, millions tune in to watch.
It’s called golf.
Second, when Skipper says “real” sports, he seems to mean activi-
ties that require physical skills—something not obviously present in,
say, checkers. But a professional video game player requires as much
physical skill as an Olympic archer or sharpshooter. The “actions per
minute,” or APM, required in gaming rivals that of concert pianists
in its quantity and precision.2 More remarkable, unlike a concert pia-
nist who memorizes and practices exact sequences until performance-
ready, an eSport athlete remains improvisational throughout—since
a video game and a tournament by its very nature is lengthy and un-predictable.
Third, eSports operate just like many “real” athletic competitions, just
like the World Cup or the World Series. In competitive gaming, the
best eSport athletes and teams duke it out in the League of Legends
tournaments. Between 2013 and 2015 in the North American League
of Legends, tournament games lasted on average from 34 to 42 min-
utes each.3 South Korea, China, and countries in Europe have similar
organizations. The teams have agents, unions, coaches, trainers, living
quarters, recruiting, and farm leagues.
Another thing eSports have in common with real sports is physical
injuries: instead of ankle sprains or ligament tears that plague football
players, eSport players face chronic wrist, finger and hand pain. An
eSports veteran, Hai “Hai” Du Lam, recently announced his retire-
ment due to his inability to play more than a few games on the Xbox
without his “hands end[ing] up killing [him] that entire week.”4
There are even doping scandals. One player confessed to using the
stimulant Adderall to enhance performance during tournament play.
SPECTATORS, PLAYERS, AND CONSUMERS DRIVE MARKETS
Whether or not eSports players are athletes matters little to the grow-
ing legions of eSports fanatics. Spectators are showing up en masse at
events around the world. “In person” eSports event attendance already
rivals that of many “professional” sports activities. At the finals of the
StarCraft Pro League at Gwangalli Beach in Busan, South Korea, in
IN A LEAGUE OF THEIR OWN: THE LEAGUE OF LEGENDS FINAL DREW MORE VIEWERS THAN THE STANLEY CUP FINALS
fig. 1
112
4031
146
0
20
40
60
80
100
120
2016 Super Bowl
2016 World Series Game 7
2016 NBA Finals
2015 League of Legends Final
2015 Stanley Cup Game 6
Mill
ions
of V
iew
ers
Sources: Lazygamer.net, NBC Sports Group, Sports Illustrated

14
2004, more than 100,000 fans showed up.5 Not quite Woodstock, but
an impressive gathering nonetheless.
How big is the audience for eSports? The League of Legends 2015
Final drew an online audience of 15 million. In comparison, the aver-
age Monday Night Football audience is 13.3 million, while the 2015
Stanley Cup Finals garnered an audience of 6 million (see Figure 1).
How do you “view” a video game tournament? One popular eSports
“venue” is Twitch.tv (originally called Justin.tv), a streaming-video site.
Commentators, called “shoutcasters” in eSports, play a key role in the
viewing experience.6 Passionate analysis (some might call it shouting)
seems to be the key element when listening to many eSports streams.
Riding this wave, Amazon purchased Twitch.tv in 2015 for nearly $1
billion. Lest you still think eSports exist only on the fringes of society,
Twitch.tv boasts more traffic than WWE.com, MLB.com, and
ESPN.com combined.
Importantly, the potential viewership numbers are dizzying. Newzoo,
a market research firm, estimates that 93 million Americans are active
in sports, but more than twice as many—194 million—regularly play
video games. That’s more than half the US population.
Sure, a subset of the aging adult population, like my brother-in-law,
faces off in Sunday “rec leagues” of basketball, softball, and soccer, but
eSports playing and spectating attracts far more eyeballs and enthusi-
asts who may or may not have an interest in traditional sports. Just as
many gamers are over age 50 as are under 18. Among US men ages 21
to 35—a crucial advertising demographic—eSports are as popular as
baseball and ice hockey.7 Globally, 148 million people are occasional
viewers of eSports events and that audience should expand to over
200 million viewers worldwide by 2019.8
WHERE FANS GO, THE MONEY DOTH FLOW
Will popularity start translating to revenue? Time will tell. But the
“competitive gaming fan demographic . . . is a marketer’s dream: up-
per-middle-class males, ages 18 to 34, with free time and disposable
income.”9 It’s not just for boys. “Ninety-four percent of girls under the
age of 18 play computer and video games regularly.”10 What makes
them even more valuable is that most eSports fans don’t already watch
traditional sports—so advertisers may have uncovered an untapped
market.
A l -
0%
2%
4%
6%
8%
10%
12%
14%
16%
18%
Q1 1980 Q1 1983 Q1 1986 Q1 1989 Q1 1992 Q1 1995 Q1 1998 Q1 2001 Q1 2004 Q1 2007 Q1 2010 Q1 2013 Q1 2016
Source: Bureau of Economic Analysis
Shar
e o
f U
.S.C
ons
umer
s' R
ecre
atio
n Sp
end
ing
Computers, Video Games, and Software
Outdoor Sporting Equipment
How do Americans today kick back and enjoy their time off in 2016? They do it on screens. Indeed spending on computers, video games and software has jumped from 1% of total recreation spending in 1980 ($618 million) to 13% ($116 billion) in today’s escalating cyber world.
In 1980, outdoor sporting equipment commanded 17% of U.S. consumers' spending on recreation ($14 billion). Today, consumers spend only 12% of their recreation dollars on outdoor sporting equipment ($103 billion).
RECREATION NATION HAS MOVED FROM THE SANDLOT TO THE XBOXfig. 2
«SPENDING ON COMPUTERS, VIDEO GAMES, AND
SOFTWARE HAS JUMPED FROM 1% OF TOTAL
RECREATION SPENDING IN 1980 ($618 MILLION) TO 13% ($116 BILLION) IN TODAY’S
ESCALATING CYBER WORLD.»

15
ready, computers, video games, and software have surpassed outdoor
sporting equipment as a share of US consumers spending on recre-
ational activity (see Figure 2). Indeed, spending on computers, video
games, and software has jumped from 1% of total recreation spend-
ing in 1980 ($618 million) to 13% ($116 billion) in today’s escalating
cyber world. Back in 1980, outdoor sporting equipment commanded
17% of U.S. consumers’ spending on recreation ($14 billion). Today,
consumers spend only 12% of their recreation dollars on outdoor
sporting equipment ($103 billion).11
A KEY DIFFERENCE BETWEEN eSPORTS AND “REAL” SPORTS
While many critics focus on sports fields and physical challenges as
the differences between eSports and real sports, the real key difference
is far more mundane: intellectual property rights. There is no “game
developer” behind tennis who can control the rules of the game and
who must be paid—at least in some form—by a league organization
that wants to organize sporting competitions.
The owner of a video game used in an eSports tournament could
change the terms and conditions of its software licenses and end the
tournament overnight. In that way, “the game developers are in a posi-
tion of absolute power over the development of public competitions
that depend on their products.”12 Alternatively, one could argue that
current, traditional sports leagues have less incentive to refresh the
game, which is why rules change at a glacial pace. As a result, real
sports fail to keep up with 21st-century developments (see our Point of View article in the Summer 2016 edition).
So there you have it: eSports require substantial physical talent, train-
ing, grueling matches, and tournaments and have garnered fans and
spectators that rival “real” sports leagues. Advertisers are taking notice,
and the business of TV, entertainment, and recreation face disrup-
tion from digital upstarts. Even traditional sports teams are getting
in while they can. At the Closing Ceremony of the Summer Olympic
Games in Rio, Japanese Prime Minister Shinzo Abe appeared as Su-
per Mario—a video game character. Tokyo hosts the next Summer
Olympic Games in 2020. Maybe, then, everyone will realize that eS-
ports have arrived?
SOURCES
1 Dawn Chmielewski (Sept 2014). “Sorry, Twitch: ESPN’s Skipper Says ‘Esports Not A Sport.’” Recode.
2 “How does a StarCraft player’s APM compare to a pianist’s APM?” Quora
3 Stewie McRubbins (May 2015). “League of Stats: Game Lengths of Every NA LCS Match-Up.” Gamurs eSports Network
4 Natalie Shoemaker. “eSports Injuries Are On the Rise, Ignored at Gamers’ Peril.” The Big Think
5 Yoon Sung-won (Aug 2014). “StarCraft II Ignites Hope For Revival.” The Korea Times
6 Young, Henry (May 2016). “Seven-figure salaries, sold-out stadiums: Is pro video gaming a sport?” CNN
7 Newzoo eSports (Oct 2016). “Why Sports & Brands Want To Be in eSports: Featuring a Comparative Analysis of American Sports and eSports.”
8 Ibid.
9 Stephanie Apstein (Oct 2015). “E-sports nation: How competitive gaming became a flourishing sport.” Sports Illustrated.
10 The Entertainment Software Association
11 Bureau of Economic Analysis
12 The Professional eSports Association

Payden & Rygel’s Point of View reflects the firm’s current opinion and is subject to change without notice. Sources for the material contained herein are deemed reliable but cannot be guaranteed. Point of View articles may not be reprinted without permission. We welcome your comments and feedback at [email protected].
US DOMICILED MUTUAL FUNDS
DUBLIN DOMICILED UCITS FUNDS
CASH BALANCEPayden/Kravitz Cash Balance Plan Fund
EQUITYEquity Income Fund
GLOBAL FIXED INCOMEEmerging Markets Bond FundEmerging Markets Corporate Bond FundEmerging Markets Local Bond FundGlobal Fixed Income Fund Global Low Duration Fund
TAX-EXEMPT FIXED INCOMECalifornia Municipal Income Fund
US FIXED INCOMEAbsolute Return Bond FundCash Reserves Money Market FundCore Bond FundCorporate Bond FundFloating Rate FundGNMA FundHigh Income FundLimited Maturity FundLow Duration FundStrategic Income FundUS Government Fund
EQUITYWorld Equity Fund
FIXED INCOMEAbsolute Return Bond FundGlobal Emerging Markets Bond FundGlobal Emerging Markets Corporate Bond FundGlobal Government Bond Index FundGlobal High Yield Bond FundGlobal Inflation-Linked Bond Fund
Global Bond FundGlobal Short Bond FundSterling Corporate Bond Fund – Investment GradeUS Core Bond FundUSD Low Duration Credit Fund
LIQUIDITY FUNDSEuro Liquidity FundSterling Reserve FundUS Dollar Liquidity Fund
For more information about Payden & Rygel’s funds, contact us at a location listed below.
LOS ANGELES 333 South Grand Avenue Los Angeles, California 90071 213 625-1900
BOSTON 265 Franklin StreetBoston, Massachusetts 02110617 807-1990
LONDON1 Bartholmew LaneLondon EC2N 2AX United Kingdom+ 44 (0) 20-7621-3000
PARISRepresentative Office54, 56 Avenue Hoche75008 Paris, France+ 33-156-605-400
PAYDEN.COM
LOS ANGELES | BOSTON | LONDON | PARIS
OVER 30 YEARS OF INSPIRINGC O N F I D E N C E W I T H A N UNWAVERING COMMITMENT TO OUR CLIENTS’ NEEDS.
FOLLOW USwww.twitter.com/paydenrygel