the state of utah’s travel and tourism industry, 2018
TRANSCRIPT
The State of Utah’s Travel and Tourism Industry, 2018
Jennifer Leaver, Senior Research Analyst
November 2019


The State of Utah’s Travel and Tourism Industry, 2018ANALYSIS IN BRIEF
At-A-GlanceTravel and Tourism-Related Tax Revenue
Kem C. Gardner Policy Institute I 411 East South Temple Street, Salt Lake City, Utah 84111 I 801-585-5618 I gardner.utah.edu
Utah’s diverse travel and tourism industry provides jobs and income for Utah residents and contributes state and local tax revenue. Utah’s natural, cultural, and historical assets draw domestic and international visitors year-round. Since 2014, visitor spending in Utah’s economy increased by an average 3.4% annually when adjusted for inflation. In 2018, travelers directly spent a record $9.75 billion in Utah, generating an estimated 136,000 total Utah jobs, and $1.28 billion in state
and local tax revenue. Utah’s national parks, state parks, and ski resorts experienced record visitation in 2018 as well.
This report presents a high-level annual review of Utah’s travel and tourism industry for 2018. It captures visitor spending and visitation trends, employment and wages, fiscal impacts, hotel occupancy data, and a snapshot of general tourism industry indicators. This report also recaps 2018 travel and tourism news events and provides an industry outlook.
$549.6 MLocal
$729.7 MState
$397.8 MLocal
Direct Tax Revenue($9.75 B in visitor spending)
$889.0 M
$491.2 MState
$1.28 B
Total Tax Revenue($15.94 B in visitor-related spending)
Local PropertyTax $189.9 M
State SalesTax $366.9 M
Local Sales Tax $359.7 M
State IncomeTax, $151.7 M
State - OtherTax $192.9 M
State CorporateTax $18.2 M
$0.0
$1.0
$2.0
$3.0
$4.0
$5.0
$6.0
$7.0
$8.0
Canyon Country Central Utah Dixie Eastern Utah NorthMountains
NorthwesternUtah
Wasatch Front
Q1 Q2 Q3 Q4
$61.0
$34.1
$53.4
$19.8
$173.8
2014
$64.8
$35.7
$58.9
$21.4
$186.5
2015
$70.0
$41.1
$65.8
$23.3
$206.3
2016
$74.4
$45.5
$74.7
$25.7
$226.9
2017
$76.5
$48.5
$80.9
$26.8
$239.7
2018
Tourism, Recreation,Cultural, andConvention
Zoo, Arts, Parks
Transient Room Tax
Resort CommunitiesSales Tax
Statewide Car Rental
$1.28 B
National Park Visits 10.6 M
Utah Skier Days 5.1 M
State Park Visits 6.7 M
Key Points include the following:
• Spending – visitors directly spent a record $9.75 billion in the Utah economy in 2018, a 6.5% year-over-year increase.
• Jobs – Utah’s travel and tourism industry accounted for an estimated 136,000 total jobs in 2018, a 5.4% year-over-year increase. Approximately 1 in 11 Utah jobs is supported by visitor spending, either directly or indirectly.
• Wages – private travel and tourism-related employment sectors experienced healthy year-over-year wage increases. Passenger air industry wages increased 10.5%, foodservice wages increased 7.8%, and wages in the accommodations sector increased 6.7%.
• Tax Revenue – the $9.75 billion in direct visitor spending—leading to $15.94 billion in total (direct, indirect, and induced) visitor-related spending—generated an estimated $1.28 billion in total tax revenue.
• Accommodations – taxable sales in the accommodations sector reached $2.0 billion for the first time ever in 2018, a 5.5% year-over-year increase; however, average statewide hotel occupancy rates and daily room rates remained flat.
• Visitation – Utah’s national parks, state parks, and ski resorts experienced record visitation in 2018.
One in Eleven Utah Jobsis supported by visitor spending, either directly or indirectly.
136,000Utah jobs supported by the travel and tourism industry.
2018 Record Visitation
I N F O R M E D D E C I S I O N S TM 2 gardner.utah.edu I November 2019
This research was sponsored by the Utah Office of Tourism.
Table of ContentsIntroduction . . . . . . . . . . . . . . . . . . . . . . . . . . . . . . . . . . . . . . . . . . 3
Travel and Tourism Industry – 2018 Year in Review . . . . . . . . . 3Travel and Tourism 2019 Outlook . . . . . . . . . . . . . . . . . . . . . . . . . 3
Spending and Visitation . . . . . . . . . . . . . . . . . . . . . . . . . . . . . . . 4Park Visitation . . . . . . . . . . . . . . . . . . . . . . . . . . . . . . . . . . . . . . . . . . . . 6Ski Industry . . . . . . . . . . . . . . . . . . . . . . . . . . . . . . . . . . . . . . . . . . . . . . . 8Travel and Tourism Employment . . . . . . . . . . . . . . . . . . . . . . . . . . . 8Tax Revenue . . . . . . . . . . . . . . . . . . . . . . . . . . . . . . . . . . . . . . . . . . . . .11Hotel Occupancy and Rates . . . . . . . . . . . . . . . . . . . . . . . . . . . . . .13Travel and Tourism - Other Indicators . . . . . . . . . . . . . . . . . . . . .13
Research Methods . . . . . . . . . . . . . . . . . . . . . . . . . . . . . . . . . . . . 14Modeling Economic and Fiscal Impacts . . . . . . . . . . . . . . . . . 15References . . . . . . . . . . . . . . . . . . . . . . . . . . . . . . . . . . . . . . . . . . . 16
FiguresFigure 1: Direct Visitor Spending as Percent of State
GDP, 2018 . . . . . . . . . . . . . . . . . . . . . . . . . . . . . . . . . . . . . . . . . . . . . . . . 4Figure 2: Direct Visitor Spending . . . . . . . . . . . . . . . . . . . . . . . . . . . . . 4Figure 3: Direct Visitor Spending by Visitor Type, 2018 . . . . . . . . 5Figure 4: Direct Visitor Spending by Category, 2018 . . . . . . . . . . 5Figure 5: Leisure and Hospitality Taxable Sales by
Travel Region, 2018 . . . . . . . . . . . . . . . . . . . . . . . . . . . . . . . . . . . . . . . 5Figure 6: Share of Domestic Visitors by State, 2018 . . . . . . . . . . . 6Figure 7: Share of International Arrivals by Country, 2018 . . . . . 6Figure 8: National Park Jobs by State, 2018 . . . . . . . . . . . . . . . . . . . 6Figure 9: Utah National Park Annual Visitor Spending by
Category, 2018 (Millions of Dollars) . . . . . . . . . . . . . . . . . . . . . . . . 7Figure 10: Utah National Park and Place Visitation . . . . . . . . . . . . 7Figure 11: Utah National Park Visitation by Month, 2018 . . . . . . 7Figure 12: Number of Ski Resorts/Ski Areas by State, 2018 . . . . 9Figure 13: Utah Ski Visitors by Place of Origin, 2018–2019 . . . . . 9Figure 14: Utah Skier/Snowboarder Annual Spending, 2018 . . 9Figure 15: Average Per Person Per Day Spending by
Category, 2018–2019 Ski Season . . . . . . . . . . . . . . . . . . . . . . . . . . 9
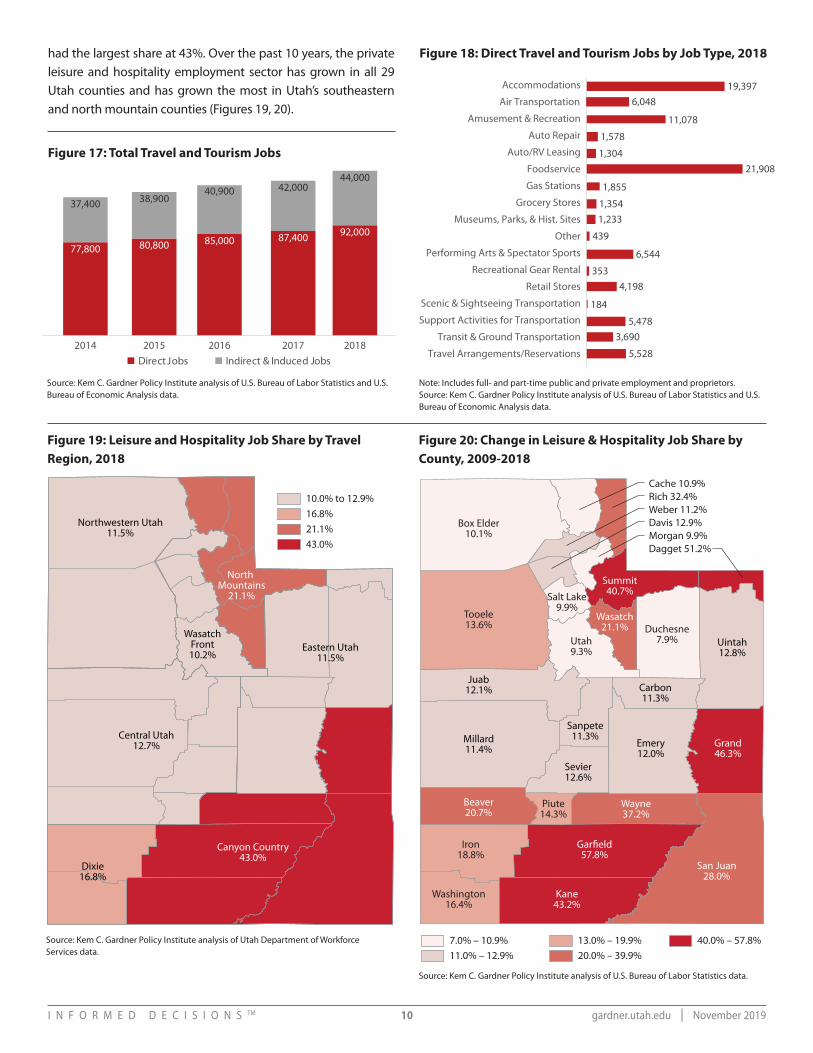
Figure 16: Utah Skier Days . . . . . . . . . . . . . . . . . . . . . . . . . . . . . . . . . . . 9Figure 17: Total Travel and Tourism Jobs . . . . . . . . . . . . . . . . . . . . .10Figure 18: Direct Travel and Tourism Jobs by Job Type, 2018 . . .10 Figure 19: Leisure and Hospitality Job Share by Travel
Region, 2018 . . . . . . . . . . . . . . . . . . . . . . . . . . . . . . . . . . . . . . . . . . . .10Figure 20: Change in Leisure & Hospitality Job Share by
County, 2009-2018 . . . . . . . . . . . . . . . . . . . . . . . . . . . . . . . . . . . . . . .10Figure 21: Travel and Tourism-Generated Tax Revenue, 2018 . .11Figure 22: Total Tax Revenue by Tax Type, 2018 . . . . . . . . . . . . . .11Figure 23: Direct Tourism-Related Sales Tax Revenues . . . . . . .11 Figure 24: County Transient Room Tax Revenue by Select
County, Top Ten Counties, 2018 . . . . . . . . . . . . . . . . . . . . . . . . . . .11Figure 25: Percent Change in County Transient Room Tax
Revenue by Travel Region, 2017-2018 . . . . . . . . . . . . . . . . . . . .12Figure 26: Percent Change in County Transient Room Tax
Revenue by County, 2017-2018 . . . . . . . . . . . . . . . . . . . . . . . . . . .12Figure 27: County Transient Room Tax Revenue by Travel
Region and Quarter, 2018 . . . . . . . . . . . . . . . . . . . . . . . . . . . . . . . .12Figure 28: Statewide Occupancy Rates by Month . . . . . . . . . . . .13Figure 29: Average Daily Room Rates by County, 2018 . . . . . . .13
TablesTable 1: Leisure and Hospitality Taxable Sales . . . . . . . . . . . . . . . . 5Table 2: Leisure and Hospitality Taxable Sales,
Top Ten Counties, 2018 . . . . . . . . . . . . . . . . . . . . . . . . . . . . . . . . . . . . 5Table 3: Utah National Park Visitation by Park . . . . . . . . . . . . . . . . . 7Table 4: Utah National Place Visitation by Place . . . . . . . . . . . . . . . 8Table 5: Utah State Park Visitation . . . . . . . . . . . . . . . . . . . . . . . . . . . . 8Table 6: Utah’s Passenger Air Industry . . . . . . . . . . . . . . . . . . . . . . .13Table 7: Utah’s Arts, Entertainment, and Recreation
Industry . . . . . . . . . . . . . . . . . . . . . . . . . . . . . . . . . . . . . . . . . . . . . . . . .13Table 8: Utah’s Accommodations Industry . . . . . . . . . . . . . . . . . . .13Table 9: Utah’s Food Services Industry. . . . . . . . . . . . . . . . . . . . . . .13

IntroductionUtah is home to steep mountains, mixed forests, red
rock deserts, and the largest salt water lake in the Western Hemisphere. In addition to its year-round outdoor recreation opportunities, Utah has a Native American history and pioneer heritage, a growing arts and culture scene, and a variety of conference and convention venues, all of which attract leisure and business visitors annually.
In 2018, travelers directly spent a record $9.75 billion in Utah, generating an estimated $1.28 billion in total state and local tax revenue. Travel and tourism spending also supported an estimated 136,000 total Utah jobs. Utah’s national parks, state parks, and ski resorts all reported record visitation. Once again, Utah visitors purchased more hotel rooms and spent more money on Utah arts, entertainment, recreation, and restaurants than ever before.
Travel and Tourism Industry – 2018 Year in ReviewIn 2018, Utah’s Board of Tourism Development allocated more
than $3.9 million in cooperative marketing matching funds, as well as $676,000 in additional matching funds through its Cafeteria Co-op Marketing Program. Cooperative marketing programs enable destination-marketing organizations such as convention and visitor bureaus, county tourism offices, and nonprofit organizations to combine their marketing dollars with Utah Office of Tourism matching funds to promote a wide variety of statewide destinations and events.
During this same time, Utah became the first and only state to receive a Michelin three-star rating. Michelin usually awards one to three stars for particular state attractions; however, Michelin awarded the entire state of Utah a three-star “exceptional” designation, denoting the destination as “worth a special journey in itself.”
In April 2018, the National Park Service (NPS) announced modest entrance fee increases at 115 national parks (including Utah’s five national parks).1 The NPS implemented fee increases to address an almost $12 billion national park maintenance backlog. Natural Resources Chairman Rob Bishop and Representative Raul Grijalva introduced legislation to earmark national park infrastructure maintenance funding to further address this backlog.2 Both House and Senate committees approved the bill, which currently awaits review by both chambers of Congress.
News media outlets announced in November that officials approved sales and property tax incentives for the construction of a 29-story Salt Lake City convention hotel.3 With construction slated for fall 2019 and hotel completion targeted for spring 2020, the $337 million hotel will house over 700 rooms in addition to ballrooms, meeting spaces, and rooftop amenities. The new convention hotel aims to attract some of the world’s largest gatherings that could generate millions of dollars in direct visitor spending.
In October 2018, the Utah Tourism Industry Association hosted its annual Utah Tourism Conference at Salt Lake City’s Salt Palace Convention Center. The conference convened a record 500 local and national travel partners and industry experts who gathered to share tourism and travel industry information, ideas, and best practices.
Finally, a year after President Trump directed a reduction in Bears Ears and Grand Staircase–Escalante National Monuments, Representatives John Curtis and Chris Stewart proposed legislation to create two new monuments (Curtis) and a national park (Stewart) within the previously designated monument areas. Congress did not pass either measure. U.S. District Judge Tanya Chutkan is reviewing pending lawsuits against both national monument reductions and has rejected the Trump Administration’s bid to dismiss these lawsuits.4
Travel and Tourism 2019 Outlook Although the U.S. travel industry remained strong in 2018,
travel industry forecasters predict slower growth in 2019. Taking into account European economic uncertainty, rising U.S./China trade tensions, and a general cooling of the global economy, the U.S. Travel Association forecasts domestic person-trips to decelerate and international person-trips to remain flat in 2019. Nevertheless, continued business investments, firming wages, and heightened U.S. consumer confidence lead forecasters to predict a 4.0% year-over-year increase in domestic and international visitor spending.5
I N F O R M E D D E C I S I O N S TM 3 gardner.utah.edu I November 2019

I N F O R M E D D E C I S I O N S TM 4 gardner.utah.edu I November 2019
Spending and Visitation
Utah visitors directly spent a record $9.75 billion in 2018. Domestic visitors contributed close to 92% and international visitors 8% of this total spending amount. When adjusted for inflation, Utah visitor spending increased 3.5% year-over-year and 16.6% over the past five years. Last year, out of 51 states (includes District of Columbia), Utah ranked 32nd in the nation for domestic visitor spending, 23rd for international visitor spending, and 21st for visitor spending as a percent of state GDP (Figure 1).
Of the $9.75 billion in visitor spending, nonresident visitors spent an 86% share and Utah residents a 14% share. Overall, leisure travelers contributed 81% of the spending and business travelers 19%. Resident travelers spent smaller relative shares on dining and lodging and larger relative shares on shopping and groceries than nonresident visitors (Figures 2, 3, 4).
Taxable sales in the leisure and hospitality sector—which includes the arts, entertainment, recreation, accommodations, and foodservice sectors—increased 27.2% over the last five years and 3.1% year-over-year (Table 1). Leisure and hospitality sector sales generally reflect Utah tourism industry trends since travelers and tourists make around 30% of arts, entertainment,
recreation purchases, 85% of accommodations purchases, and 20% of foodservice purchases on a statewide basis. Regionally, the majority of leisure and hospitality sales took place in the Wasatch Front and North Mountains regions, followed by the Dixie and Canyon Country regions (Figure 5).
4.4%
5.0%
9.6%
7.6%6.2%
5.8%
9.0%
5.4%
26.6%5.4%
4.2%6.5%
4.8%
4.2%
5.7%
5.7%
4.3%
4.8%
3.7%
5.3%
4.8%
4.7%
3.6%
5.8%
4.6%
4.6%
6.0%
5.0%
5.4%
3.5%
5.8%
3.9%
3.1%
4.7%5.0%
3.3%
6.7%
6.5%
FL: 10.0%
5.6%MD: 4.4%
VT: 7.9%NH: 5.2%
MA: 4.2%
NJ: 3.7%
CT: 4.3%
DE: 3.0%
RI: 3.6%
5.5%
HI: 28.7%
3.0% to 3.9%4.0% to 4.9%5.0% to 5.9%6.0% to 9.9%10.0% to 28.7%
Figure 1: Direct Visitor Spending as Percent of State GDP, 2018
Source: Kem C. Gardner Policy Institute analysis of National Park Service and U.S. Bureau of Labor Statistics data.
Figure 2: Direct Visitor Spending
$0
$2,000
$4,000
$6,000
$8,000
$10,000
$12,000
$7,530
$826
2014
$7,870
$809
2015
$8,051
$839
2016
$8,502
$848
2017
$8,922
$823
2018
$mill
ions
of 2
018
dolla
rs
Domestic Spending International Spending
$0.0
$1,000.0
$2,000.0
$3,000.0
$4,000.0
$5,000.0
$6,000.0
$7,000.0
$8,000.0
$9,000.0
$6,719.8
$1,663.8
Nonresident
$1,205.1
$156.6
Resident
$mill
ions
of d
olla
rs
Leisure Travel Business Travel
Nonresident Resident
LodgingDining OutShoppingGroceries
Entertainment& Amenities
Other
Japan 3%
Australia 4%Mexico 3%
France 4%
Germany 5%
United Kingdom 5%
China 10%
Washington 3%
Arizona 3%
Texas 3%
Nevada 8%
Colorado 5%
Idaho 6%
California 10%
Utah 44%
Other 18%
Canada 33%
Other 33%
Note: Includes resident, domestic nonresident, and international visitor spending.Source: U.S. Travel Association and Tourism Economics

I N F O R M E D D E C I S I O N S TM 5 gardner.utah.edu I November 2019
Figure 3: Direct Visitor Spending by Visitor Type, 2018
$0
$2,000
$4,000
$6,000
$8,000
$10,000
$12,000
$7,530
$826
2014
$7,870
$809
2015
$8,051
$839
2016
$8,502
$848
2017
$8,922
$823
2018
$mill
ions
of 2
018
dolla
rs
Domestic Spending International Spending
$0.0
$1,000.0
$2,000.0
$3,000.0
$4,000.0
$5,000.0
$6,000.0
$7,000.0
$8,000.0
$9,000.0
$6,719.8
$1,663.8
Nonresident
$1,205.1
$156.6
Resident
$mill
ions
of d
olla
rs
Leisure Travel Business Travel
Nonresident Resident
LodgingDining OutShoppingGroceries
Entertainment& Amenities
Other
Japan 3%
Australia 4%Mexico 3%
France 4%
Germany 5%
United Kingdom 5%
China 10%
Washington 3%
Arizona 3%
Texas 3%
Nevada 8%
Colorado 5%
Idaho 6%
California 10%
Utah 44%
Other 18%
Canada 33%
Other 33%
Source: U.S. Travel Association
Figure 4: Direct Visitor Spending by Category, 2018
$0
$2,000
$4,000
$6,000
$8,000
$10,000
$12,000
$7,530
$826
2014
$7,870
$809
2015
$8,051
$839
2016
$8,502
$848
2017
$8,922
$823
2018
$mill
ions
of 2
018
dolla
rs
Domestic Spending International Spending
$0.0
$1,000.0
$2,000.0
$3,000.0
$4,000.0
$5,000.0
$6,000.0
$7,000.0
$8,000.0
$9,000.0
$6,719.8
$1,663.8
Nonresident
$1,205.1
$156.6
Resident
$mill
ions
of d
olla
rs
Leisure Travel Business Travel
Nonresident Resident
LodgingDining OutShoppingGroceries
Entertainment& Amenities
Other
Japan 3%
Australia 4%Mexico 3%
France 4%
Germany 5%
United Kingdom 5%
China 10%
Washington 3%
Arizona 3%
Texas 3%
Nevada 8%
Colorado 5%
Idaho 6%
California 10%
Utah 44%
Other 18%
Canada 33%
Other 33%
Note: Public transportation spending (airfare, train, bus, taxi, etc.) has been removed.Source: Kem C. Gardner Policy Institute analysis of U.S. Travel Association data.
Table 1: Leisure and Hospitality Taxable Sales (Millions of 2018 Dollars)
Industry 2014 2015 2016 2017 2018% Change 2014-2018
% Change 2017-2018
Performing Arts, Spectator Sports, Related $117.2 $124.1 $143.5 $145.2 $156.4 33.5% 7.7%
Museums, Historical Sites, Zoos, Parks, Similar $38.8 $34.9 $40.3 $57.3 $61.9 59.6% 8.0%
Amusement & Recreation $505.6 $607.3 $681.4 $702.7 $711.9 40.8% 1.3%
Hotels, Motels, B&Bs, Resorts, Other $1,460.6 $1,625.3 $1,775.0 $1,935.1 $1,989.6 36.2% 2.8%
RV Parks, Camps $35.0 $40.4 $44.4 $48.6 $44.5 27.1% -8.4%
Restaurants & Other Eating Places $3,776.0 $4,118.3 $4,305.5 $4,421.0 $4,554.5 20.6% 3.0%
Special Food Services, Food Carts $384.2 $423.9 $454.1 $495.3 $529.6 37.8% 6.9%
Drinking Places (alcoholic beverages) $117.1 $123.4 $127.5 $133.8 $138.4 18.2% 3.5%
Total $6,434 .5 $7,097 .7 $7,571 .8 $7,938 .8 $8,186 .8 27 .2% 3 .1%
Source: Kem C. Gardner Policy Institute analysis of Utah State Tax Commission data.
Table 2: Leisure and Hospitality Taxable Sales, Top Ten Counties, 2018
Salt Lake County . . . . . . . . . . . . . . . . . . . . . . . . . . . . . . $3,439,631,776Utah County . . . . . . . . . . . . . . . . . . . . . . . . . . . . . . . . . . . . $960,466,879Summit County . . . . . . . . . . . . . . . . . . . . . . . . . . . . . . . . . $802,141,317Davis County . . . . . . . . . . . . . . . . . . . . . . . . . . . . . . . . . . . $600,925,046Washington County . . . . . . . . . . . . . . . . . . . . . . . . . . . . . $572,906,770
Weber County . . . . . . . . . . . . . . . . . . . . . . . . . . . . . . . . . . $441,372,948Grand County . . . . . . . . . . . . . . . . . . . . . . . . . . . . . . . . . . . $198,066,019Cache County . . . . . . . . . . . . . . . . . . . . . . . . . . . . . . . . . . . $182,729,264Wasatch County . . . . . . . . . . . . . . . . . . . . . . . . . . . . . . . . $142,665,129Kane County . . . . . . . . . . . . . . . . . . . . . . . . . . . . . . . . . . . . $135,902,019
Figure 5: Leisure and Hospitality Taxable Sales by Travel Region, 2018
Dixie$693.5
Central Utah$111.1
Northwestern Utah$151.1
$100.0 to $199.9$200.0 to $699.9$1,152.2$5,442.4
Eastern Utah$136.7
WasatchFront
$5,442.4
North Mountains
$1,152.2
Canyon Country$504.6
Source: Kem C. Gardner Policy Institute analysis of Utah State Tax Commission data.
Source: Kem C. Gardner Policy Institute analysis of Utah State Tax Commission data.

I N F O R M E D D E C I S I O N S TM 6 gardner.utah.edu I November 2019
In 2018, California, Nevada, and Idaho were the top three sources of domestic nonresident visitors to Utah; Canada, China, and Germany were the top three sources of international visitors (Figures 6, 7).
Park VisitationUtah’s national parks and national monuments, recreation
areas, and historic sites (“national places”) and state parks draw resident and nonresident visitors annually. In 2018, national
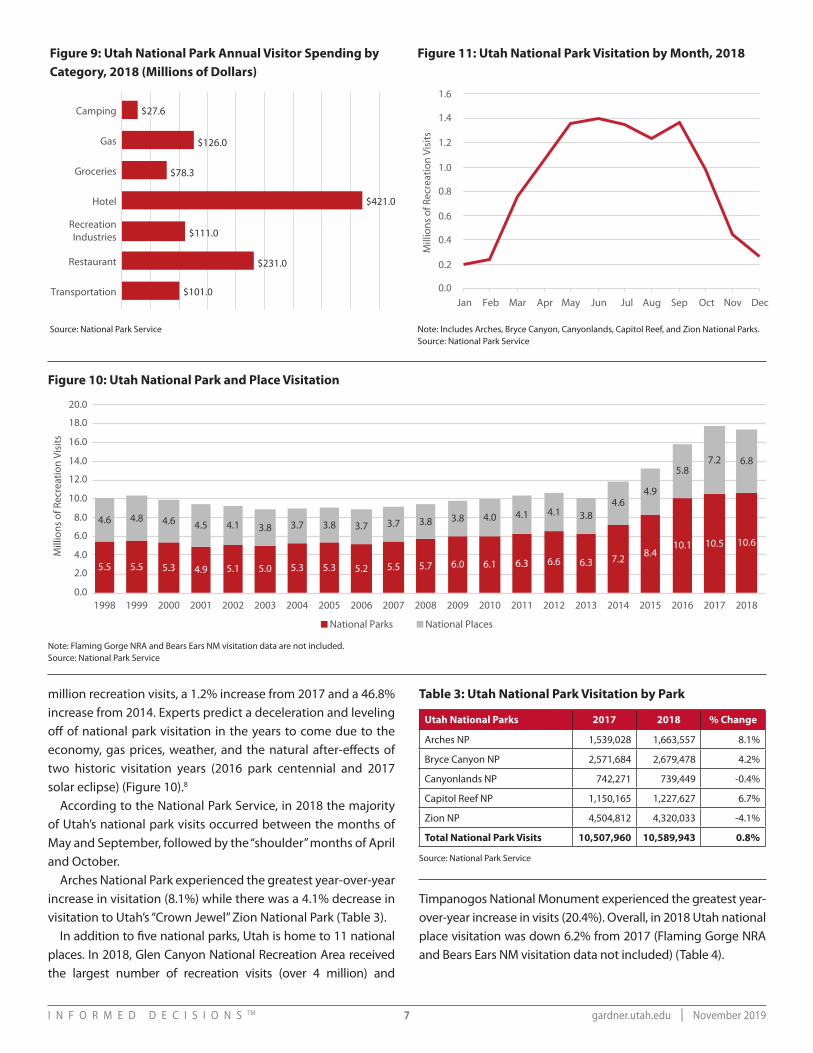
park visitors spent $1.2 billion in Utah’s “gateway communities,” generating 18,700 jobs, $605 million in labor income, and $1.8 billion in total output.6 Utah national park visitors spent the largest share of dollars on hotels, restaurants, and gasoline (Figures 8, 9).
With five national parks, Utah ranked third in the nation for number of national parks, fourth for number of national park jobs, and fifth for national park visitor spending.7 In 2018, Utah’s five national parks received a combined record 10.6
$0
$2,000
$4,000
$6,000
$8,000
$10,000
$12,000
$7,530
$826
2014
$7,870
$809
2015
$8,051
$839
2016
$8,502
$848
2017
$8,922
$823
2018
$mill
ions
of 2
018
dolla
rs
Domestic Spending International Spending
$0.0
$1,000.0
$2,000.0
$3,000.0
$4,000.0
$5,000.0
$6,000.0
$7,000.0
$8,000.0
$9,000.0
$6,719.8
$1,663.8
Nonresident
$1,205.1
$156.6
Resident
$mill
ions
of d
olla
rs
Leisure Travel Business Travel
Nonresident Resident
LodgingDining OutShoppingGroceries
Entertainment& Amenities
Other
Japan 3%
Australia 4%Mexico 3%
France 4%
Germany 5%
United Kingdom 5%
China 10%
Washington 3%
Arizona 3%
Texas 3%
Nevada 8%
Colorado 5%
Idaho 6%
California 10%
Utah 44%
Other 18%
Canada 33%
Other 33%
Figure 7: Share of International Arrivals by Country, 2018
Source: Tourism Economics
$0
$2,000
$4,000
$6,000
$8,000
$10,000
$12,000
$7,530
$826
2014
$7,870
$809
2015
$8,051
$839
2016
$8,502
$848
2017
$8,922
$823
2018
$mill
ions
of 2
018
dolla
rs
Domestic Spending International Spending
$0.0
$1,000.0
$2,000.0
$3,000.0
$4,000.0
$5,000.0
$6,000.0
$7,000.0
$8,000.0
$9,000.0
$6,719.8
$1,663.8
Nonresident
$1,205.1
$156.6
Resident
$mill
ions
of d
olla
rs
Leisure Travel Business Travel
Nonresident Resident
LodgingDining OutShoppingGroceries
Entertainment& Amenities
Other
Japan 3%
Australia 4%Mexico 3%
France 4%
Germany 5%
United Kingdom 5%
China 10%
Washington 3%
Arizona 3%
Texas 3%
Nevada 8%
Colorado 5%
Idaho 6%
California 10%
Utah 44%
Other 18%
Canada 33%
Other 33%
Figure 6: Share of Domestic Visitors by State, 2018
Source: OmniTrak Group Inc.
4,260
80
9,540
35,720
930
570
1,770
2902,980
7,100
700
270
1,350
19,780
160
190
870
12,3004,290
680
4,610
18,700
5,830
510
6,130
2,690
2,990
7,920
7,380
8,870
3,380
1,030
1,560
20,600
1,300
5,820
16,800
1,260
50
FL: 7,650
1,050
30
CT: 30
MD: 2,570DE: 0NJ: 2,090
MA: 10,500RI: 50
DC: 6,750
17,760
HI: 5,820
0 to 499
500 to 1,999
2,000 to 4,999
5,000 to 9,999
10,000 to 35,720
Figure 8: National Park Jobs by State, 2018
Source: National Park Service
I N F O R M E D D E C I S I O N S TM 7 gardner.utah.edu I November 2019
million recreation visits, a 1.2% increase from 2017 and a 46.8% increase from 2014. Experts predict a deceleration and leveling off of national park visitation in the years to come due to the economy, gas prices, weather, and the natural after-effects of two historic visitation years (2016 park centennial and 2017 solar eclipse) (Figure 10).8
According to the National Park Service, in 2018 the majority of Utah’s national park visits occurred between the months of May and September, followed by the “shoulder” months of April and October.
Arches National Park experienced the greatest year-over-year increase in visitation (8.1%) while there was a 4.1% decrease in visitation to Utah’s “Crown Jewel” Zion National Park (Table 3).
In addition to five national parks, Utah is home to 11 national places. In 2018, Glen Canyon National Recreation Area received the largest number of recreation visits (over 4 million) and
Timpanogos National Monument experienced the greatest year-over-year increase in visits (20.4%). Overall, in 2018 Utah national place visitation was down 6.2% from 2017 (Flaming Gorge NRA and Bears Ears NM visitation data not included) (Table 4).
$101.0Transportation
$231.0Restaurant
$111.0RecreationIndustries
$421.0Hotel
$78.3Groceries
$126.0Gas
$27.6Camping
0.0
2.0
4.0
6.0
8.0
10.0
12.0
14.0
16.0
18.0
20.0
5.5
4.6
1998
5.5
4.8
1999
5.3
4.6
2000
4.9
4.5
2001
5.1
4.1
2002
5.0
3.8
2003
5.3
3.7
2004
5.3
3.8
2005
5.2
3.7
2006
5.5
3.7
2007
5.7
3.8
2008
6.0
3.8
2009
6.1
4.0
2010
6.3
4.1
2011
6.6
4.1
2012
6.3
3.8
2013
7.2
4.6
2014
8.4
4.9
2015
10.1
5.8
2016
10.5
7.2
2017
10.6
6.8
2018
Mill
ions
of R
ecre
atio
n Vi
sits
National Parks National Places
0.2
0.0
0.4
0.6
0.8
1.0
1.2
1.4
1.6
Mill
ions
of R
ecre
atio
n Vi
sits
Jan Feb Mar Apr May Jun Jul Aug Sep Oct Nov Dec$101.0Transportation
$231.0Restaurant
$111.0RecreationIndustries
$421.0Hotel
$78.3Groceries
$126.0Gas
$27.6Camping
0.0
2.0
4.0
6.0
8.0
10.0
12.0
14.0
16.0
18.0
20.0
5.5
4.6
1998
5.5
4.8
1999
5.3
4.6
2000
4.9
4.5
2001
5.1
4.1
2002
5.0
3.8
2003
5.3
3.7
2004
5.3
3.8
2005
5.2
3.7
2006
5.5
3.7
2007
5.7
3.8
2008
6.0
3.8
2009
6.1
4.0
2010
6.3
4.1
2011
6.6
4.1
2012
6.3
3.8
2013
7.2
4.6
2014
8.4
4.9
2015
10.1
5.8
2016
10.5
7.2
2017
10.6
6.8
2018
Mill
ions
of R
ecre
atio
n Vi
sits
National Parks National Places
0.2
0.0
0.4
0.6
0.8
1.0
1.2
1.4
1.6
Mill
ions
of R
ecre
atio
n Vi
sits
Jan Feb Mar Apr May Jun Jul Aug Sep Oct Nov Dec
Figure 9: Utah National Park Annual Visitor Spending byCategory, 2018 (Millions of Dollars)
Figure 11: Utah National Park Visitation by Month, 2018
Source: National Park Service Note: Includes Arches, Bryce Canyon, Canyonlands, Capitol Reef, and Zion National Parks.Source: National Park Service
Figure 10: Utah National Park and Place Visitation
$101.0Transportation
$231.0Restaurant
$111.0RecreationIndustries
$421.0Hotel
$78.3Groceries
$126.0Gas
$27.6Camping
0.0
2.0
4.0
6.0
8.0
10.0
12.0
14.0
16.0
18.0
20.0
5.5
4.6
1998
5.5
4.8
1999
5.3
4.6
2000
4.9
4.5
2001
5.1
4.1
2002
5.0
3.8
2003
5.3
3.7
2004
5.3
3.8
2005
5.2
3.7
2006
5.5
3.7
2007
5.7
3.8
2008
6.0
3.8
2009
6.1
4.0
2010
6.3
4.1
2011
6.6
4.1
2012
6.3
3.8
2013
7.2
4.6
2014
8.4
4.9
2015
10.1
5.8
2016
10.5
7.2
2017
10.6
6.8
2018
Mill
ions
of R
ecre
atio
n Vi
sits
National Parks National Places
0.2
0.0
0.4
0.6
0.8
1.0
1.2
1.4
1.6
Mill
ions
of R
ecre
atio
n Vi
sits
Jan Feb Mar Apr May Jun Jul Aug Sep Oct Nov Dec
Note: Flaming Gorge NRA and Bears Ears NM visitation data are not included.Source: National Park Service
Table 3: Utah National Park Visitation by Park
Utah National Parks 2017 2018 % Change
Arches NP 1,539,028 1,663,557 8.1%
Bryce Canyon NP 2,571,684 2,679,478 4.2%
Canyonlands NP 742,271 739,449 -0.4%
Capitol Reef NP 1,150,165 1,227,627 6.7%
Zion NP 4,504,812 4,320,033 -4.1%
Total National Park Visits 10,507,960 10,589,943 0 .8%
Source: National Park Service

I N F O R M E D D E C I S I O N S TM 8 gardner.utah.edu I November 2019
Table 4: Utah National Place Visitation by Place
Utah National Places 2017 2018 % Change
Cedar Breaks NM 909,199 644,515 -29.1%
Dinosaur NM 315,859 304,468 -3.6%
Glen Canyon NRA 4,574,940 4,219,441 -7.8%
Golden Spike NHS 67,811 60,130 -11.3%
Grand Staircase-Escalante NM 982,993 1,157,916 17.8%
Hovenweep NM 39,970 40,574 1.5%
Natural Bridges NM 107,443 103,118 -4.0%
Rainbow Bridge NM 108,418 110,904 2.3%
Timpanogos NM 100,740 121,311 20.4%
Total National Place Visits 7,207,373 6,762,377 -6 .2%
Source: National Park Service
Utah has 44 state parks, which attract resident and nonresident visitors year-round. In fiscal year 2018, Utah state parks recorded a combined 6.7 million recreation visits (a new record), with annual total visits increasing 17.9% from the previous year. Dead Horse Point State Park experienced the greatest visitation with over 750,000 visits, while Great Salt Lake State Park received the largest year-over-year visit increase (126.2%) (Table 5).
Utah State Park FY 2017 FY 2018 % Change
Anasazi Indian Village State Park 19,565 20,062 2.5%
Antelope Island State Park 431,190 496,023 15.0%
Bear Lake State Park 298,463 338,018 13.3%
Camp Floyd State Park Museum 12,340 13,121 6.3%
Coral Pink Sand Dunes State Park 108,745 124,701 14.7%
Dead Horse Point State Park 560,783 765,436 36.5%
Deer Creek State Park 338,865 415,800 22.7%
East Canyon State Park 102,922 124,117 20.6%
Edge Of The Cedars State Park Museum
11,801 12,228 3.6%
Escalante Petrified Forest State Park
57,117 64,693 13.3%
Fred Hayes State Park at Starvation
115,328 120,856 4.8%
Fremont Indian State Park 22,446 25,373 13.0%
Frontier Homestead State Park Museum
10,493 12,458 18.7%
Goblin Valley State Park 241,770 268,760 11.2%
Goosenecks State Park 64,789 66,342 2.4%
Great Salt Lake State Park 54,031 122,192 126.2%
Green River State Park 58,459 73,655 26.0%
Gunlock State Park 19,122 33,459 75.0%
Huntington State Park 34,086 37,232 9.2%
Hyrum Lake State Park 75,636 90,320 19.4%
Utah State Park FY 2017 FY 2018 % Change
Jordanelle State Park 507,780 606,001 19.3%
Jordan River OHV State Park 17,172 35,951 109.4%
Kodachrome Basin State Park 116,992 125,867 7.6%
Millsite State Park 16,468 11,873 -27.9%
Otter Creek State Park 40,016 34,332 -14.2%
Palisade State Park 132,884 151,399 13.9%
Piute State Park 1,205 1,146 -4.9%
Quail Creek State Park 96,030 127,948 33.2%
Red Fleet State Park 31,156 43,393 39.3%
Rockport State Park 132,565 142,710 7.7%
Sand Hollow State Park 539,683 677,418 25.5%
Scofield State Park 20,846 24,438 17.2%
Snow Canyon State Park 299,798 343,043 14.4%
Steinaker State Park 42,546 33,859 -20.4%
Territorial Statehouse State Park Museum
7,869 7,445 -5.4%
Utah Field House Of Natural History State Park Museum
54,701 56,039 2.4%
Utah Lake State Park 134,511 93,437 -30.5%
Wasatch Mountain State Park 360,383 343,959 -4.6%
Willard Bay State Park 394,136 522,926 32.7%
Yuba State Park 105,964 103,904 -1.9%
Total Visits 5,690,656 6,711,932 17 .9%
Table 5: Utah State Park Visitation
Note: Echo State Park, Flight Path State Recreation Area, Historic Union Pacific Rail Trail, and This is the Place Heritage Park visitation data are not included.Source: Utah State Parks
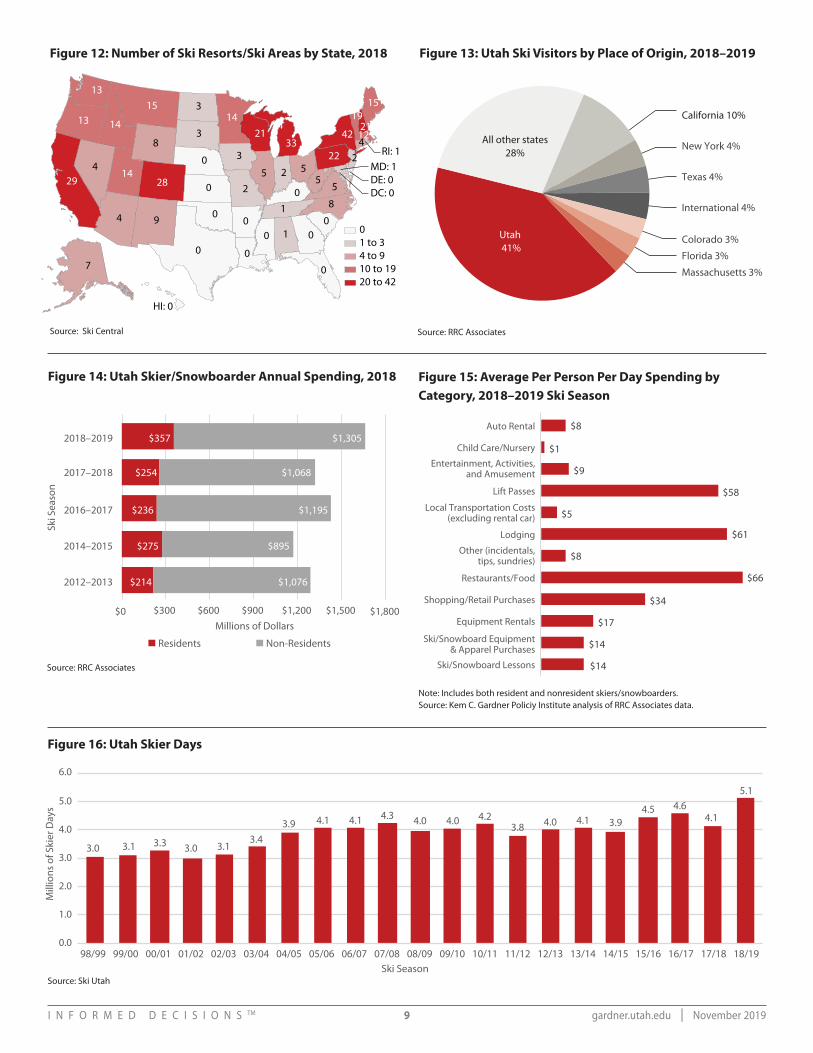
Ski IndustryIn 2018, Utah ranked 11th in the nation for number of ski
resorts/ski areas (14 total), matching Minnesota and Idaho. Ski Utah reported a record-setting season in 2018–2019 with an unprecedented 5.1 million skier days. During this historic ski season, skiers and snowboarders spent an estimated $1.76 billion in Utah with the largest shares of dollars going to dining, lodging, and lift passes. California, Texas, and New York were the top three domestic sources of nonresident visitors who enjoyed Utah’s “Greatest Snow on Earth.” In addition, nearly one out of 15 skiers and snowboarders visited Utah’s slopes from outside of the U.S. (Figures 12–16).
Travel and Tourism EmploymentVisitor spending directly and indirectly generates and supports
Utah jobs. In 2018, the record $9.75 billion in direct visitor spending generated close to 92,000 direct jobs and supported around 44,000 additional indirect and induced jobs, summing to 136,000 total jobs statewide (a 5.4% year-over-year increase) (Figures 17, 18).
Specifically looking at the share of private leisure and hospitality sector jobs (i.e. arts, entertainment, recreation, accommodations, and foodservice) to total private jobs, the Canyon Country region
I N F O R M E D D E C I S I O N S TM 9 gardner.utah.edu I November 2019
0
94
4
8
029
0
3
15 3
0
2
0
5
3
0
0
28
1
8
13
0
0
14
14
1
14
5
0 52
13
0
21
5
42
2233
1519
MD: 12
42112
DE: 0
RI: 1
DC: 0
7
HI: 0
01 to 34 to 910 to 1920 to 42
Figure 12: Number of Ski Resorts/Ski Areas by State, 2018
Source: Ski Central
Ski S
easo
n
Residents Non-Residents
$0 $300 $600 $900 $1,200 $1,500 $1,800
2012–2013 $214 $1,076
2014–2015 $275 $895
2016–2017 $236 $1,195
2017–2018 $254 $1,068
2018–2019
Millions of Dollars
$357 $1,305
$8Auto Rental
$1Child Care/Nursery
$9Entertainment, Activities,
and Amusement
$58Lift Passes
$5Local Transportation Costs
(excluding rental car)
$61Lodging
$8Other (incidentals,tips, sundries)
$66Restaurants/Food
$34Shopping/Retail Purchases
$17Equipment Rentals
$14Ski/Snowboard Equipment& Apparel Purchases
$14Ski/Snowboard Lessons
International 4%
Texas 4%
Massachusetts 3%
New York 4%
Colorado 3%
Florida 3%
Utah 41%
All other states28%
California 10%
Mill
ions
of S
kier
Day
s
Ski Season
0.0
1.0
2.0
3.0
4.0
5.0
6.0
98/99 99/00 00/01 01/02 02/03 03/04 04/05 05/06 06/07 07/08 08/09 09/10 10/11 11/12 12/13 13/14 14/15 15/16 16/17 17/18 18/19
3.0 3.1 3.3 3.0 3.13.4
3.9 4.1 4.1 4.3 4.0 4.0 4.23.8 4.0 4.1 3.9
4.5 4.64.1
5.1
Figure 14: Utah Skier/Snowboarder Annual Spending, 2018
Source: RRC Associates
Ski S
easo
n
Residents Non-Residents
$0 $300 $600 $900 $1,200 $1,500 $1,800
2012–2013 $214 $1,076
2014–2015 $275 $895
2016–2017 $236 $1,195
2017–2018 $254 $1,068
2018–2019
Millions of Dollars
$357 $1,305
$8Auto Rental
$1Child Care/Nursery
$9Entertainment, Activities,
and Amusement
$58Lift Passes
$5Local Transportation Costs
(excluding rental car)
$61Lodging
$8Other (incidentals,tips, sundries)
$66Restaurants/Food
$34Shopping/Retail Purchases
$17Equipment Rentals
$14Ski/Snowboard Equipment& Apparel Purchases
$14Ski/Snowboard Lessons
International 4%
Texas 4%
Massachusetts 3%
New York 4%
Colorado 3%
Florida 3%
Utah 41%
All other states28%
California 10%
Mill
ions
of S
kier
Day
s
Ski Season
0.0
1.0
2.0
3.0
4.0
5.0
6.0
98/99 99/00 00/01 01/02 02/03 03/04 04/05 05/06 06/07 07/08 08/09 09/10 10/11 11/12 12/13 13/14 14/15 15/16 16/17 17/18 18/19
3.0 3.1 3.3 3.0 3.13.4
3.9 4.1 4.1 4.3 4.0 4.0 4.23.8 4.0 4.1 3.9
4.5 4.64.1
5.1
Figure 15: Average Per Person Per Day Spending by Category, 2018–2019 Ski Season
Note: Includes both resident and nonresident skiers/snowboarders.Source: Kem C. Gardner Policiy Institute analysis of RRC Associates data.
Ski S
easo
n
Residents Non-Residents
$0 $300 $600 $900 $1,200 $1,500 $1,800
2012–2013 $214 $1,076
2014–2015 $275 $895
2016–2017 $236 $1,195
2017–2018 $254 $1,068
2018–2019
Millions of Dollars
$357 $1,305
$8Auto Rental
$1Child Care/Nursery
$9Entertainment, Activities,
and Amusement
$58Lift Passes
$5Local Transportation Costs
(excluding rental car)
$61Lodging
$8Other (incidentals,tips, sundries)
$66Restaurants/Food
$34Shopping/Retail Purchases
$17Equipment Rentals
$14Ski/Snowboard Equipment& Apparel Purchases
$14Ski/Snowboard Lessons
International 4%
Texas 4%
Massachusetts 3%
New York 4%
Colorado 3%
Florida 3%
Utah 41%
All other states28%
California 10%
Mill
ions
of S
kier
Day
s
Ski Season
0.0
1.0
2.0
3.0
4.0
5.0
6.0
98/99 99/00 00/01 01/02 02/03 03/04 04/05 05/06 06/07 07/08 08/09 09/10 10/11 11/12 12/13 13/14 14/15 15/16 16/17 17/18 18/19
3.0 3.1 3.3 3.0 3.13.4
3.9 4.1 4.1 4.3 4.0 4.0 4.23.8 4.0 4.1 3.9
4.5 4.64.1
5.1
Figure 13: Utah Ski Visitors by Place of Origin, 2018–2019Sk
i Sea
son
Residents Non-Residents
$0 $300 $600 $900 $1,200 $1,500 $1,800
2012–2013 $214 $1,076
2014–2015 $275 $895
2016–2017 $236 $1,195
2017–2018 $254 $1,068
2018–2019
Millions of Dollars
$357 $1,305
$8Auto Rental
$1Child Care/Nursery
$9Entertainment, Activities,
and Amusement
$58Lift Passes
$5Local Transportation Costs
(excluding rental car)
$61Lodging
$8Other (incidentals,tips, sundries)
$66Restaurants/Food
$34Shopping/Retail Purchases
$17Equipment Rentals
$14Ski/Snowboard Equipment& Apparel Purchases
$14Ski/Snowboard Lessons
International 4%
Texas 4%
Massachusetts 3%
New York 4%
Colorado 3%
Florida 3%
Utah 41%
All other states28%
California 10%
Mill
ions
of S
kier
Day
s
Ski Season
0.0
1.0
2.0
3.0
4.0
5.0
6.0
98/99 99/00 00/01 01/02 02/03 03/04 04/05 05/06 06/07 07/08 08/09 09/10 10/11 11/12 12/13 13/14 14/15 15/16 16/17 17/18 18/19
3.0 3.1 3.3 3.0 3.13.4
3.9 4.1 4.1 4.3 4.0 4.0 4.23.8 4.0 4.1 3.9
4.5 4.64.1
5.1
Figure 16: Utah Skier Days
Source: Ski Utah
Source: RRC Associates
I N F O R M E D D E C I S I O N S TM 10 gardner.utah.edu I November 2019
had the largest share at 43%. Over the past 10 years, the private leisure and hospitality employment sector has grown in all 29 Utah counties and has grown the most in Utah’s southeastern and north mountain counties (Figures 19, 20).
77,800
37,400
2014
80,800
38,900
2015
85,000
40,900
2016
87,400
42,000
2017
92,000
44,000
2018Direct Jobs Indirect & Induced Jobs
Cache 10.9%Rich 32.4%Weber 11.2%Davis 12.9%Morgan 9.9%Dagget 51.2%
Iron18.8%
Gar�eld57.8%
Washington16.4%
Kane43.2%
Box Elder10.1%
Salt Lake9.9%
Utah9.3%
Tooele13.6%
Summit40.7%
Wasatch21.1% Duchesne
7.9% Uintah12.8%
Carbon11.3%
Emery12.0%
Grand46.3%
San Juan28.0%
Sanpete11.3%
Sevier12.6%
Piute14.3%
Wayne37.2%
Juab12.1%
Millard11.4%
Beaver20.7%
7.0% – 10.9%11.0% – 12.9%
13.0% – 19.9%20.0% – 39.9%
40.0% – 57.8%
Dixie16.8%
Central Utah12.7%
Northwestern Utah11.5%
10.0% to 12.9%16.8%21.1%43.0%
Eastern Utah11.5%
WasatchFront10.2%
North Mountains
21.1%
Canyon Country43.0%
Figure 17: Total Travel and Tourism Jobs
Figure 18: Direct Travel and Tourism Jobs by Job Type, 2018
Source: Kem C. Gardner Policy Institute analysis of U.S. Bureau of Labor Statistics and U.S. Bureau of Economic Analysis data.
Note: Includes full- and part-time public and private employment and proprietors.Source: Kem C. Gardner Policy Institute analysis of U.S. Bureau of Labor Statistics and U.S. Bureau of Economic Analysis data.
77,800
37,400
2014
80,800
38,900
2015
85,000
40,900
2016
87,400
42,000
2017
92,000
44,000
2018Direct Jobs Indirect & Induced Jobs
Cache 10.9%Rich 32.4%Weber 11.2%Davis 12.9%Morgan 9.9%Dagget 51.2%
Iron18.8%
Gar�eld57.8%
Washington16.4%
Kane43.2%
Box Elder10.1%
Salt Lake9.9%
Utah9.3%
Tooele13.6%
Summit40.7%
Wasatch21.1% Duchesne
7.9% Uintah12.8%
Carbon11.3%
Emery12.0%
Grand46.3%
San Juan28.0%
Sanpete11.3%
Sevier12.6%
Piute14.3%
Wayne37.2%
Juab12.1%
Millard11.4%
Beaver20.7%
7.0% – 10.9%11.0% – 12.9%
13.0% – 19.9%20.0% – 39.9%
40.0% – 57.8%
Dixie16.8%
Central Utah12.7%
Northwestern Utah11.5%
10.0% to 12.9%16.8%21.1%43.0%
Eastern Utah11.5%
WasatchFront10.2%
North Mountains
21.1%
Canyon Country43.0%
Source: Kem C. Gardner Policy Institute analysis of U.S. Bureau of Labor Statistics data.
Figure 19: Leisure and Hospitality Job Share by Travel Region, 2018
77,800
37,400
2014
80,800
38,900
2015
85,000
40,900
2016
87,400
42,000
2017
92,000
44,000
2018Direct Jobs Indirect & Induced Jobs
Cache 10.9%Rich 32.4%Weber 11.2%Davis 12.9%Morgan 9.9%Dagget 51.2%
Iron18.8%
Gar�eld57.8%
Washington16.4%
Kane43.2%
Box Elder10.1%
Salt Lake9.9%
Utah9.3%
Tooele13.6%
Summit40.7%
Wasatch21.1% Duchesne
7.9% Uintah12.8%
Carbon11.3%
Emery12.0%
Grand46.3%
San Juan28.0%
Sanpete11.3%
Sevier12.6%
Piute14.3%
Wayne37.2%
Juab12.1%
Millard11.4%
Beaver20.7%
7.0% – 10.9%11.0% – 12.9%
13.0% – 19.9%20.0% – 39.9%
40.0% – 57.8%
Dixie16.8%
Central Utah12.7%
Northwestern Utah11.5%
10.0% to 12.9%16.8%21.1%43.0%
Eastern Utah11.5%
WasatchFront10.2%
North Mountains
21.1%
Canyon Country43.0%
Source: Kem C. Gardner Policy Institute analysis of Utah Department of Workforce Services data.
5,528Travel Arrangements/Reservations
3,690Transit & Ground Transportation5,478Support Activities for Transportation
184Scenic & Sightseeing Transportation
4,198Retail Stores353Recreational Gear Rental
6,544Performing Arts & Spectator Sports
439Other
1,233Museums, Parks, & Hist. Sites1,354Grocery Stores1,855Gas Stations
21,908Foodservice1,304Auto/RV Leasing1,578Auto Repair
11,078Amusement & Recreation
6,048Air Transportation19,397Accommodations
Figure 20: Change in Leisure & Hospitality Job Share by County, 2009-2018

I N F O R M E D D E C I S I O N S TM 11 gardner.utah.edu I November 2019
Tax RevenueIn 2018, the $9.75 billion in direct visitor spending, which led
to $15.94 billion in total visitor-related spending through indirect and induced spending effects, generated an estimated $1.28 billion in state and local tax revenues. All local travel and tourism-related tax revenues increased from 2017, even after adjusting for inflation. In fact, municipal transient room tax collections increased 20.9% from 2017 to 2018. Regionally, the Canyon Country and Dixie regions experienced the largest year-over-year growth in county transient room tax collections. At a county level, Piute, Wasatch, and Rich experienced over 20% revenue increases from the prior year. Salt Lake, Summit, and Washington counties collected the largest amount of county transient room tax statewide (Figures 21–26).
Tracking transient room tax revenue over time reveals the seasonality of each Utah travel region. In 2018, all regions but North Mountains received the greatest visitation during the spring and summer months. The North Mountains Region collected the most transient room tax revenue during the winter months, reflecting the popularity of skiing and snowboarding in the Park City area. In addition, the Wasatch Front region experienced steady visitation winter, spring, and summer with a decline in fall due to a seasonal downturn in conferences and conventions during the fourth quarter (Figure 27).
Source: Kem C. Gardner Policy Institute analysis of U.S. Travel Association and Utah State Tax Commission data.
$549.6 MLocal
$729.7 MState
$397.8 MLocal
Direct Tax Revenue($9.75 B in visitor spending)
$889.0 M
$491.2 MState
$1.28 B
Total Tax Revenue($15.94 B in visitor-related spending)
Local PropertyTax $189.9 M
State SalesTax $366.9 M
Local Sales Tax $359.7 M
State IncomeTax, $151.7 M
State - OtherTax $192.9 M
State CorporateTax $18.2 M
$0.0
$1.0
$2.0
$3.0
$4.0
$5.0
$6.0
$7.0
$8.0
Canyon Country Central Utah Dixie Eastern Utah NorthMountains
NorthwesternUtah
Wasatch Front
Q1 Q2 Q3 Q4
$61.0
$34.1
$53.4
$19.8
$173.8
2014
$64.8
$35.7
$58.9
$21.4
$186.5
2015
$70.0
$41.1
$65.8
$23.3
$206.3
2016
$74.4
$45.5
$74.7
$25.7
$226.9
2017
$76.5
$48.5
$80.9
$26.8
$239.7
2018
Tourism, Recreation,Cultural, andConvention
Zoo, Arts, Parks
Transient Room Tax
Resort CommunitiesSales Tax
Statewide Car Rental
$1.28 B
Figure 21: Travel and Tourism-Related Tax Revenue, 2018
Note: Includes direct tourism-related sales tax revenues only; fiscal year totals shown.Source: Kem C. Gardner Policy Institute analysis of Utah State Tax Commission data.
$549.6 MLocal
$729.7 MState
$397.8 MLocal
Direct Tax Revenue($9.75 B in visitor spending)
$889.0 M
$491.2 MState
$1.28 B
Total Tax Revenue($15.94 B in visitor-related spending)
Local PropertyTax $189.9 M
State SalesTax $366.9 M
Local Sales Tax $359.7 M
State IncomeTax, $151.7 M
State - OtherTax $192.9 M
State CorporateTax $18.2 M
$0.0
$1.0
$2.0
$3.0
$4.0
$5.0
$6.0
$7.0
$8.0
Canyon Country Central Utah Dixie Eastern Utah NorthMountains
NorthwesternUtah
Wasatch Front
Q1 Q2 Q3 Q4
$61.0
$34.1
$53.4
$19.8
$173.8
2014
$64.8
$35.7
$58.9
$21.4
$186.5
2015
$70.0
$41.1
$65.8
$23.3
$206.3
2016
$74.4
$45.5
$74.7
$25.7
$226.9
2017
$76.5
$48.5
$80.9
$26.8
$239.7
2018
Tourism, Recreation,Cultural, andConvention
Zoo, Arts, Parks
Transient Room Tax
Resort CommunitiesSales Tax
Statewide Car Rental
$1.28 B
Figure 23: Direct Tourism-Related Sales Tax Revenues (Millions of 2018 Dollars)
Figure 24: County Transient Room Tax Revenue by Select County, Top Ten Counties, 2018
Source: Kem C. Gardner Policy Institute of U.S. Travel Association and Utah State Tax Commission data.
$549.6 MLocal
$729.7 MState
$397.8 MLocal
Direct Tax Revenue($9.75 B in visitor spending)
$889.0 M
$491.2 MState
$1.28 B
Total Tax Revenue($15.94 B in visitor-related spending)
Local PropertyTax $189.9 M
State SalesTax $366.9 M
Local Sales Tax $359.7 M
State IncomeTax, $151.7 M
State - OtherTax $192.9 M
State CorporateTax $18.2 M
$0.0
$1.0
$2.0
$3.0
$4.0
$5.0
$6.0
$7.0
$8.0
Canyon Country Central Utah Dixie Eastern Utah NorthMountains
NorthwesternUtah
Wasatch Front
Q1 Q2 Q3 Q4
$61.0
$34.1
$53.4
$19.8
$173.8
2014
$64.8
$35.7
$58.9
$21.4
$186.5
2015
$70.0
$41.1
$65.8
$23.3
$206.3
2016
$74.4
$45.5
$74.7
$25.7
$226.9
2017
$76.5
$48.5
$80.9
$26.8
$239.7
2018
Tourism, Recreation,Cultural, andConvention
Zoo, Arts, Parks
Transient Room Tax
Resort CommunitiesSales Tax
Statewide Car Rental
$1.28 B
Figure 22: Total Tax Revenue by Tax Type, 2018
Salt Lake County . . . . . . . . . . . . . . . . . . . . . . . . . . . . . . . . .$20,425,587
Summit County . . . . . . . . . . . . . . . . . . . . . . . . . . . . . . . . . . . $9,928,866
Washington County . . . . . . . . . . . . . . . . . . . . . . . . . . . . . . . $8,599,254
Grand County . . . . . . . . . . . . . . . . . . . . . . . . . . . . . . . . . . . . . $5,370,097
Utah County . . . . . . . . . . . . . . . . . . . . . . . . . . . . . . . . . . . . . . $3,813,235
Kane County . . . . . . . . . . . . . . . . . . . . . . . . . . . . . . . . . . . . . . $2,987,023
Wasatch County . . . . . . . . . . . . . . . . . . . . . . . . . . . . . . . . . . $2,293,372
Garfield County . . . . . . . . . . . . . . . . . . . . . . . . . . . . . . . . . . . $2,210,479
Davis County . . . . . . . . . . . . . . . . . . . . . . . . . . . . . . . . . . . . . $1,865,755
Weber County . . . . . . . . . . . . . . . . . . . . . . . . . . . . . . . . . . . . $1,698,260
Source: Utah State Tax Commission

I N F O R M E D D E C I S I O N S TM 12 gardner.utah.edu I November 2019
Figure 25: Percent Change in County Transient Room Tax Revenue by Travel Region, 2017-2018
Figure 26: Percent Change in County Transient Room Tax Revenue by County, 2017-2018
Iron5.3%
Gar�eld5.4%
Washington9.5%
Kane11.4%
Box Elder1.7%
Cache 14.7%Rich 22.9%Weber 1.5%Davis 4.0%Morgan -4.1%
Salt Lake5.1%
Utah5.9%
Dagget 15.1%
Tooele-0.9%
Summit1.5%
Wasatch26.6% Duchesne
-12.3% Uintah5.8%
Carbon17.3%
Emery-2.5%
Grand7.6%
San Juan15.2%
Sanpete-0.4%
Sevier-8.3%
Piute68.3%
Wayne11.5%
Juab-12.5%
Millard-12.9%
Beaver1.0%
-12.9 to -4.0%-3.9 to 3.9%
4.0 to 6.9%7.0 to 11.9%
12.0 to 68.3%
Dixie8.8%
Central Utah-4.3%
Northwestern Utah0.3%
-4.3%0.3%4.9%6.4%8.8% to 8.9%
Eastern Utah4.9%
WasatchFront4.9%
North Mountains
6.4%
Canyon Country8.9%
Source: Kem C. Gardner Policy Institute analysis of Utah State Tax Commission data.
Source: Kem C. Gardner Policy Institute analysis of Utah State Tax Commission data.
$549.6 MLocal
$729.7 MState
$397.8 MLocal
Direct Tax Revenue($9.75 B in visitor spending)
$889.0 M
$491.2 MState
$1.28 B
Total Tax Revenue($15.94 B in visitor-related spending)
Local PropertyTax $189.9 M
State SalesTax $366.9 M
Local Sales Tax $359.7 M
State IncomeTax, $151.7 M
State - OtherTax $192.9 M
State CorporateTax $18.2 M
$0.0
$1.0
$2.0
$3.0
$4.0
$5.0
$6.0
$7.0
$8.0
Canyon Country Central Utah Dixie Eastern Utah NorthMountains
NorthwesternUtah
Wasatch Front
Q1 Q2 Q3 Q4
$61.0
$34.1
$53.4
$19.8
$173.8
2014
$64.8
$35.7
$58.9
$21.4
$186.5
2015
$70.0
$41.1
$65.8
$23.3
$206.3
2016
$74.4
$45.5
$74.7
$25.7
$226.9
2017
$76.5
$48.5
$80.9
$26.8
$239.7
2018
Tourism, Recreation,Cultural, andConvention
Zoo, Arts, Parks
Transient Room Tax
Resort CommunitiesSales Tax
Statewide Car Rental
$1.28 B
Figure 27: County Transient Room Tax Revenue by Travel Region and Quarter, 2018
Source: Utah State Tax Commission

I N F O R M E D D E C I S I O N S TM 13 gardner.utah.edu I November 2019
Hotel Occupancy and RatesThe average annual statewide occupancy rate in 2018 (64.1%)
was slightly lower than in 2017 (65.3%); likewise, average daily room rates and revenue per available room remained flat. Possible explanations for these temperate year-over-year changes could be more visitors staying in short-term rentals (vs.
hotels) and/or a larger 2018 hotel room supply (vs. 2017). On a statewide basis, Utah hotels experienced the highest occupancy in March (spring break) and June–September (summer break)(Figure 28). Summit, Wasatch, Kane, and Grand counties had the highest average daily room rates in 2018 (Figure 29).
Travel and Tourism Industry — Other IndicatorsUtah’s travel and tourism industries performed well in 2018.
Private jobs in the leisure and hospitality industries grew 2.2 to 4.4% and wages 5.7 to 7.8%. Airline industry jobs increased 2.4% from 2017 and wages 10.5% (Tables 6-9).
Table 6: Utah’s Passenger Air Industry
Year Tota
l D
epla
ned
Pass
enge
rs
% A
nnua
l Ch
ange
Empl
oym
ent
% A
nnua
l Ch
ange
Wag
es
($M
illio
ns)
% A
nnua
l Ch
ange
2014 10,569,675 4.8% 6,212 2.5% $398 0.7%
2015 11,073,700 4.8% 6,162 -0.8% $444 11.5%
2016 11,573,010 4.5% 6,256 1.5% $527 18.6%
2017 12,100,265 4.6% 6,704 7.2% $561 6.4%
2018 12,777,748 5.6% 6,868 2.4% $619 10.5%
Source: Kem C. Gardner Policy Institute analysis of U.S. Bureau of Labor Statistics and SLC International Airport data.
Table 7: Utah’s Arts, Entertainment, and Recreation Industry
Year 2017 2018 % Change
Private Employment 24,244 24,939 2.9%
Private Wages ($Millions) $667 $705 5.7%
Public Employment 7,203 7,417 3.0%
Public Wages ($Millions) $122 $123 0.9%
Taxable Sales ($Millions) $880 $930 5.7%
Source: Kem C. Gardner Policy Institute analysis of U.S. Bureau of Labor Statistics and Utah State Tax Commission data.
Table 8: Utah’s Accommodations Industry
Year 2017 2018 % Change
Employment 20,555 21,137 2.8%
Wages ($Millions) $529 $565 6.7%
Taxable Sales ($Millions) $1,928 $2,034 5.5%
Source: Kem C. Gardner Policy Institute analysis of U.S. Bureau of Labor Statistics and Utah State Tax Commission data.
Table 9: Utah’s Food Services Industry
Year 2017 2018 % Change
Employment 98,228 102,528 4.4%
Wages ($Millions) $1,595 $1,720 7.8%
Taxable Sales ($Millions) $4,908 $5,223 6.4%
Source: Kem C. Gardner Policy Institute analysis of U.S. Bureau of Labor Statistics and Utah State Tax Commission data.
Figure 28: Statewide Occupancy Rates by Month
0.0%10.0%20.0%30.0%40.0%50.0%60.0%70.0%80.0%90.0%
100.0%
Jan Feb Mar Apr May Jun July Aug Sep Oct Nov Dec2017 2018
Iron$85
Gar�eld$120
Washington$108
Kane$186
Box Elder$84
Cache $99Rich $99Weber $83Davis $89Morgan N/A
Salt Lake$114
Utah$96
Dagget N/A
Tooele$103
Summit$256
Wasatch$237 Duchesne
N/A Uintah$106
Carbon$83
Emery$97
Grand$148
San Juan$120
SanpeteN/A
Sevier$85
PiuteN/A
Wayne$120
Juab$75
Millard$75
Beaver$66
$66 to $84$85 to $99
$100 to $124$125 to $199
$200 to $256Not Available
Note: Republication or other re-use of this data without the express written permission of STR, Inc. is strictly prohibited.Source: Kem C. Gardner Policy Institute analysis of STR, Inc. data.
Note: Republication or other re-use of this data without the express written permission of STR, Inc. is strictly prohibited.Source: STR, Inc.
Figure 29: Average Daily Room Rates by County, 2018

I N F O R M E D D E C I S I O N S TM 14 gardner.utah.edu I November 2019
Research MethodsThis section provides insight regarding how the Kem C.
Gardner Policy Institute conducted its analysis. The Institute defines key terms for conceptual clarity and economic impact and estimated tax revenue modeling in this report.
Terms
Employment is a measure of the average number of full-time and part-time jobs. Employment data from the Utah Department of Workforce Service and the U.S. Bureau of Labor Statistics include virtually all company and government employees. Employment impacts include the self-employed, as well as employees.
An industry is a category for grouping similar types of companies. For uniformity, government agencies and researchers in the U.S. follow the North American Industry Classification System (NAICS), which federal agencies periodically update as new types of companies become common enough to warrant a new category. However, the travel and tourism industry is not one distinct industry but rather an assortment of industries, comprised of goods and services purchased prior to, during, and even after a trip. The travel and tourism industry can be characterized as an export industry when travel-related goods and services are purchased in Utah by nonresident visitors.
Leisure and Hospitality Employment. The leisure and hospitality employment sector, as per the U.S. Bureau of Labor Statistics, includes the arts, entertainment, recreation, accommodation, and foodservice industries (e.g. NAICS 711–722). Statewide, around 65% of all travel- and tourism-related jobs are in the leisure and hospitality sector, while the other 35% are in several different sectors (e.g. transportation, real estate, rental and leasing, retail, personal services, etc.).
Travel Regions. For purposes of this report, Utah is divided into seven travel regions, organized by counties with similar demographics, economies, natural amenities, and recreational opportunities.
Wasatch Front includes Davis, Salt Lake, Utah, and Weber counties. This region is the state’s metropolitan hub and is bordered by mountains on the east and lakes on the west. Travelers visit the Wasatch Front to ski and/or recreate outdoors, attend arts and cultural events, visit historic, religious, and other local attractions, attend conventions and trade shows, shop, and dine.
Canyon Country includes Garfield, Grand, Kane, San Juan, and Wayne counties. This region, which is home to four of Utah’s five national parks, attracts visitors to its unique geology, recreational opportunities, and scenic beauty.
Central Utah includes Beaver, Juab, Millard, Piute, Sanpete, and Sevier counties. This region, located in the “heart” of the state, comprises rolling hills, agricultural lands, historic sites, and popular ATV trail systems.
Dixie includes Iron and Washington counties. Located in the southwestern corner of Utah, Dixie is the gateway to Zion National Park and is the warmest region in the state, allowing for year-round golf, outdoor theater, and general recreation and leisure.
Eastern Utah includes Carbon, Daggett, Duchesne, Emery, and Uintah counties. This region offers fly-fishing, boating, and river rafting opportunities in and around Flaming Gorge National Recreation Area, as well as abundant paleontological, archaeological, and geological sites.
North Mountains includes Cache, Rich, Summit, and Wasatch counties. This region includes large portions of Wasatch-Cache and Uinta National Forests, mountain topography, as well as eight state parks.
Northwestern Utah includes Box Elder and Tooele counties. This region consists of basin and range geography with rugged mountains, endless vistas, and the unique Great Salt Lake ecosystem.
Traveler Types. Utah visitors are divided into two categories: residents and nonresidents. Resident travelers are Utahns that travel at least 50 miles away from home (one-way) for work or leisure either for a day or overnight. Nonresident travelers include both domestic and international travelers. Domestic nonresident visitors are American travelers who are not Utah residents, and international visitors include all travelers from outside of the U.S.
I N F O R M E D D E C I S I O N S TM 15 gardner.utah.edu I November 2019
Modeling Economic and Fiscal ImpactsThe travel and tourism industry supports individuals and
businesses in many different industries. Total economic impacts include direct, indirect, and induced impacts. When Utah visitors purchase from Utah businesses, these are the direct effects, including the employees and earnings that are supported by these purchases. These businesses purchase inputs from other local businesses, who in turn may purchase from other local businesses. These rounds of activity produce indirect employment and earnings effects. Then, direct and indirect employees spend a portion of their earnings in the local economy, spurring additional “induced” effects. In the tourism industry, a direct spending example would be a visitor paying their hotel bill. Indirect spending would be the hotel owner purchasing bed sheets from a linen company. Induced spending would include hotel employees and linen company employees spending their paychecks on personal purchases (e.g. rent, groceries, health care, etc.).
U.S. Travel Association provides the Utah Office of Tourism with direct spending numbers. To estimate the indirect and induced impacts that resulted from this direct activity, the Gardner Institute customized a travel and tourism economic impact model for Utah. This customized model utilizes 2017 IMPLAN economic impact software as well as U.S. Bureau of Labor Statistics and U.S. Bureau of Economic Analysis data.
To estimate fiscal impacts, the Gardner Institute customized a travel and tourism fiscal impact calculator. This customized model utilizes both the 2017 IMPLAN economic modeling software and the Gardner Institute fiscal calculator. The Gardner Institute’s fiscal calculator uses effective tax rates and per capita government spending to estimate the fiscal impacts related to the travel and tourism industry. Inputs to the model are employment, value added, and labor income results generated by IMPLAN software (based on total direct visitor spending entered as “output” and margined by the software). The underlying fiscal calculator analysis relies on historical data and assumes a linear relationship between taxes paid and personal income, earnings, industry output, and employment.
The Gardner Institute estimated tax revenue impacts for state and local sales taxes, personal and corporate income taxes, local property taxes, and other state taxes and fees (e.g. travel and tourism portion of fuel tax revenue, boat registration fees, alcohol and tobacco taxes, etc.). The Institute limited its model to state and local governments because Utah federal tax collections have a relatively small impact on federal government receipts. Similarly, the Gardner Institute assumed federal spending in the state in a given year is largely independent of economic activity in Utah’s industries, including the travel- and tourism-related industries.

I N F O R M E D D E C I S I O N S TM 16 gardner.utah.edu I November 2019
ReferencesBureau of Land Management. 2018. Visits and Visitor Days by
Regional Management Areas (GSENM), Fiscal Year Range October 1, 2017, to September 30, 2018 (RMIS).
Cliff, C. and E. Carr. 2008. Utah Atlas: Geography & History. Utah State University Department of Geography. Gibbs Smith Publishing, Layton, Utah.
Franz, Justin. Drop in Glacier Park Visitation Reflects National Trend. August 26, 2019. Flathead Beacon. https://flatheadbeacon.com/2019/08/26/drop-glacier-park-visitation-reflects-national-trend/
Frechtling, D. 1994. “Assessing the Impacts of Travel and Tourism – Measuring Economic Benefits,” reprinted in Clement A. Tinsdall, ed., The Economics of Tourism, Edward Elgar Publishing Ltd., Cheltenham, UK, 2000.
Headwaters Economics. 2018. National Park’s Economic Impacts. https://headwaterseconomics.org/dataviz/national-park-service-units/
Hintze, L. 2005. Utah’s Spectacular Geology: How it Came to Be, B.Y.U. Department of Geology.
OmniTrak Group, Inc. June 2019. Calendar Year 2018 – Utah TravelTrakAmerica Executive Summary and Key Insights.
RRC Associates. June 2019. Ski Utah Skier & Snowboarder Survey 2018-19 Season Overview.
Salt Lake City International Airport. July 2019. Salt Lake City International Airport: Summary Statistics for 2018. https://www.slcairport.com/about-the-airport/airport-overview/air-traffic-statistics/
Ski tourism in Utah hit an all-time high this season. May 21, 2019. Deseret News. https://www.deseret.com/2019/5/21/20673823/ski-tourism-in-utah-hit-an-all-time-high-this-season#nathaniel-evans-catches-snow-flakes-in-his-mouth-at-snowbird-in-little-cottonwood-canyon-on-tuesday-feb-5-2019
STR, Inc. 2018. Utah Hotel & Lodging Reports: January 2018–December 2018.
U.S. Bureau of Economic Analysis. 2019. Regional Data: GDP and Personal Income. Annual Gross Domestic Product by State. https://apps.bea.gov/itable/iTable.cfm?ReqID=70&step=1
U.S. Bureau of Labor Statistics. 2019. Databases, Tables & Calculators by Subject: State and County Employment and
Wages (QCEW). https://www.bls.gov/data/U.S. National Park Service. July 2019. 2018 National Park Visitor
Spending Effects Report. Retrieved from https://www.nps.gov/subjects/socialscience/vse.htm
U.S. National Park Service. 2019. Visitor Use Statistics. Retrieved from https://irma.nps.gov/Stats/
U.S. Travel Association. March 2019. Domestic Travel Market Report, 2018. https://www.ustravel.org/research/domestic-travel-market-report-2018
U.S. Travel Association. August 2019. Outlook: U.S. Travel’s Research Trends from David Huether. https://www.ustravel.org/sites/default/files/media_root/document/
Outlook-back-page.htmlU.S. Travel Association. 2018. U.S. Travel Answer Sheet: Facts
about a Leading American Industry That’s More Than Just Fun. https://www.ustravel.org/system /files/media_root/document/Research_Fact-Sheet_US-Travel-Answer-Sheet.pdf
U.S. Travel Association. July 2019. Travelers Direct Spending in Utah—2018.
U.S. Travel Association. 2019. Travel Volume To and Within the United States. https://www.ustravel.org/system/files/media_root/document/Research_Fact-Sheet_US-Travel-and-Tourism-Overview.pdf
Utah Department of Workforce Services. 2019. Utah Economic Data Viewer - Employment and Wages. http://jobs.utah.gov/jsp/utalmis/#/industry
Utah Office of Tourism. 2019. Utah Tourism Industry Metrics. https://travel.utah.gov/research-planning/utah-tourism-industry-metrics
Utah State Parks. July 2019. Resources: Park Visitation. https://stateparks.utah.gov/
resources/park-visitation-data/Utah State Tax Commission. 2019. Annual Report: 2018 Fiscal
Year. https://tax.utah.gov/commission/reports/fy18report.pdfUtah State Tax Commission. 2015. Sales and Use Tax General
Information, Publication 25. Revised September 2015. http://tax.utah.gov/forms/pubs/pub-25.pdf
Tourism Economics. August 2019. International State Travel: Summary of International Travel to the U.S.
Endnotes1. See https://www.nps.gov/orgs/1207/04-12-2018-entrance-fees.htm.2. H.R. 6510.3. See https://www.sltrib.com/news/2018/11/07/with-tax-incentives-okd/ 4. See https://kutv.com/news/local/trump-administration-loses-bid-to-
dismiss-bears-ears-grand-staircase-escalante-lawsuits5. See https://www.ustravel.org/system/files/media_root/document/
Research_Travel-Forecast_Summary-Table.pdf. 6. See https://www.nps.gov/subjects/socialscience/vse.htm
7. Utah ranks third behind California and Arizona for number of national parks; fourth behind California, North Carolina, and Arizona for number of national park jobs; and fifth behind California, Alaska, North Carolina, and Arizona for national park visitor spending.
8. See https://flatheadbeacon.com/2019/08/26/drop-glacier-park-visitation-reflects-national-trend/

I N F O R M E D D E C I S I O N S TM 17 gardner.utah.edu I November 2019
Kem C. Gardner Policy Institute I 411 East South Temple Street, Salt Lake City, Utah 84111 I 801-585-5618 I gardner.utah.edu
Kem C. Gardner Policy Institute Staff and AdvisorsLeadership TeamNatalie Gochnour, Associate Dean and DirectorJennifer Robinson, Associate DirectorShelley Kruger, Accounting and Finance ManagerColleen Larson, Administrative ManagerDianne Meppen, Director of Survey ResearchPamela S. Perlich, Director of Demographic ResearchJuliette Tennert, Director of Economic and
Public Policy ResearchNicholas Thiriot, Communications Director James A. Wood, Ivory-Boyer Senior Fellow
Faculty AdvisorsMatt Burbank, Faculty AdvisorAdam Meirowitz, Faculty Advisor
Senior AdvisorsJonathan Ball, Office of the Legislative Fiscal AnalystGary Cornia, Marriott School of BusinessTheresa Foxley, EDCUtahDan Griffiths, Tanner LLCRoger Hendrix, Hendrix ConsultingJoel Kotkin, Chapman UniversityDarin Mellott, CBREChris Redgrave, Zions BankBud Scruggs, Cynosure GroupWesley Smith, Western Governors University
StaffSamantha Ball, Research AssociateMallory Bateman, Senior Research Analyst DJ Benway, Research AnalystMarin Christensen, Research Associate Mike Christensen, Scholar-in-ResidenceJohn C. Downen, Senior Managing EconomistDejan Eskic, Senior Research AnalystEmily Harris, DemographerMichael T. Hogue, Senior Research StatisticianMike Hollingshaus, DemographerThomas Holst, Senior Energy Analyst Meredith King, Research Associate Jennifer Leaver, Senior Tourism AnalystLevi Pace, Senior Research EconomistShannon Simonsen, Research CoordinatorJoshua Spolsdoff, Research Economist Paul Springer, Senior Graphic DesignerLaura Summers, Senior Health Care AnalystNatalie Young, Research Analyst
Kem C. Gardner Policy Institute Advisory BoardConvenersMichael O. LeavittMitt Romney
BoardScott Anderson, Co-ChairGail Miller, Co-ChairDoug AndersonDeborah BayleCynthia A. BergRoger BoyerWilford ClydeSophia M. DiCaroCameron Diehl
Lisa EcclesSpencer P. EcclesMatt EyringKem C. GardnerChristian GardnerNatalie GochnourBrandy GraceClark IvoryMike S. LeavittKimberly Gardner MartinDerek MillerAnn MillnerSterling Nielsen Cristina Ortega
Jason PerryRay PickupGary B. PorterTaylor RandallJill Remington LoveBrad RencherJosh RomneyCharles W. SorensonJames Lee SorensonVicki VarelaRuth V. WatkinsTed Wilson
Ex Officio (invited)Governor Gary HerbertSpeaker Brad WilsonSenate President
Stuart AdamsRepresentative Brian KingSenator Karen MayneMayor Jenny WilsonMayor Jackie Biskupski
Partners in the Community The following individuals and entities help support the research mission of the Kem C. Gardner Policy Institute.
Legacy PartnersThe Gardner CompanyIntermountain HealthcareClark and Christine Ivory FoundationKSL and Deseret NewsLarry H. & Gail Miller Family FoundationMountain America Credit UnionMitt and Ann RomneySalt Lake City CorporationSalt Lake CountyUniversity of Utah HealthUtah Governor’s Office of Economic Development
Zions Bank
Executive PartnersMark and Karen BouchardThe Boyer CompanySalt Lake ChamberSorenson Impact Center
WCF Insurance
Sustaining PartnersClyde CompaniesDominion EnergyStaker Parson Companies