the state of the uk’s birds - the rspb wildlife charity ... · the state of the uk’s birds...
TRANSCRIPT

THE STATE OF THE UK’S BIRDS 2011
Contents
THE STATE OF THE UK’S BIRDS 2011 1
� The headlines 2
� Wild Bird Indicators 4
� Birds in the UK Biodiversity Action Plan 6
� Recent surveys 8
� Trends in common breeding birds in the UK 11
� Rare Breeding Birds Panel 14
� Breeding seabirds in the UK 16
� Ramsar at 40: the protection of wetland birds in the UK 19
� Wintering waterbirds in the UK 24
� Birds in the UK's Overseas Territories 30
� Bird Atlas 2007-11 34
� What you can do to help 37
� About us 40
Throughout this report, species
are colour-coded according to
their conservation status, as
published in Birds of
Conservation Concern 3 in 2009.
The 52 species identified as being
of the greatest conservation
concern are red-listed, the 126
species of moderate concern are
amber-listed and the 68 species
of least concern are green-listed. In a few cases where particular
races are discussed, the
colour-coding from a separate
race level assessment is used.
Mark H
amblin (rspb-im
ages.com)

Introduction
THE STATE OF THE UK’S BIRDS 2011 32 THE STATE OF THE UK’S BIRDS 2011
The headlinesTo mark the 40th
anniversary of the Ramsar
Convention on wetlands,
SUKB 2011 has a particular
focus on waterbirds and
their conservation. We
review the impact of the
Convention on waterbird
conservation in the UK,
and report on:
• the return and spread of the crane as a breeding bird in the UK• the fortunes of our rarer breeding waterbirds, most of which
are thriving• mixed fortunes for our breeding seabirds, with some –
Arctic skua, herring gull and kittiwake amongst them –declining sharply
• how in recent years many of our wintering waterbirds havebegun to show population declines following decades ofrecovery or increase. For many, a shift in range in responseto climate change is the most likely cause, but for othersthere may be genuine population-level declines
• how the removal of rats from Henderson Island in the SouthPacific, one of the UK’s Overseas Territories, is great newsfor that island’s breeding seabirds.
Of course, the report remains a one-stop shop for all the latestresults from bird monitoring in the UK. Other headlines include:
• both farmland and woodland indicators fell to their lowestever levels in the UK, driven by further declines in habitatspecialists such as turtle doves, grey partridges and corn
buntings (farmland) and willow tits, lesser spotted
woodpeckers and lesser redpolls (woodland)• we give an update on the status of birds on the UK's
Biodiversity Action Plan priority species list• new surveys of hen harriers and capercaillie reveal national
populations have declined recently• after a mammoth effort by more than 16,000 observers,
fieldwork for the Bird Atlas 2007-11 is complete and theresults are awaited eagerly.
This is the 12th The state of the UK’s birds (SUKB)
report. Published in 2011, it contains results from
annual, periodic and one-off surveys and studies
from as recently as 2010. It draws on many
sources of information to give an up-to-date
overview of the status of bird populations in the
UK and its Overseas Territories.
The state of the UK’s birds 2011 is produced by a coalition ofthree NGOs – the Royal Society for the Protection of Birds(RSPB), the British Trust for Ornithology (BTO) and theWildfowl & Wetlands Trust (WWT) – and the UK Government’sstatutory nature conservation agencies – the CountrysideCouncil for Wales (CCW), Natural England (NE), NorthernIreland Environment Agency (NIEA), Scottish Natural Heritage(SNH) and the Joint Nature Conservation Committee (JNCC).
This report should be referenced as Eaton MA, Balmer DE,Cuthbert R, Grice PV, Hall J, Hearn RD, Holt CA, MusgroveAJ, Noble DG, Parsons M, Risely K, Stroud DA & Wotton S2011. The state of the UK’s birds 2011. RSPB, BTO, WWT,CCW, JNCC, NE, NIEA and SNH, Sandy, Bedfordshire.
A special thank you to volunteers
Bird monitoring in the UK is led by NGOs incollaboration with the Government, but relies on the
efforts of many thousands of volunteers, withoutwhom the evidence base upon which bird conservationin the UK depends would be much poorer. The state ofthe UK’s birds gives us the opportunity to recognise and
celebrate the huge role of volunteers in birdmonitoring, and to thank them for the time and effort
they devote to the schemes described within thereport. If this is you, then thank you; if not, why
not consider joining one of the widevariety of schemes outlined on
page 37?
Graham
e Madge (rspb-im
ages.com)
� Lesser redpoll, one of a number of
red-listed woodland birds.
� Arctic skua moved straight from the green
list to red in 2009.
Much of the information on which this publication is based comes from dedicated volunteers: thank you to all of them.
Guy R
ogers (rspb-images.com
)B
en Hall (rspb-im
ages.com)
Mark S
isson (rspb-images.com
)
� Although still widespread around the coast
and increasingly so inland, numbers of herring
gulls have greatly reduced in recent years.
THE STATE OF THE UK’S BIRDS 2011 54 THE STATE OF THE UK’S BIRDS 2011
Wild bird indicators
UK wild bird indicator
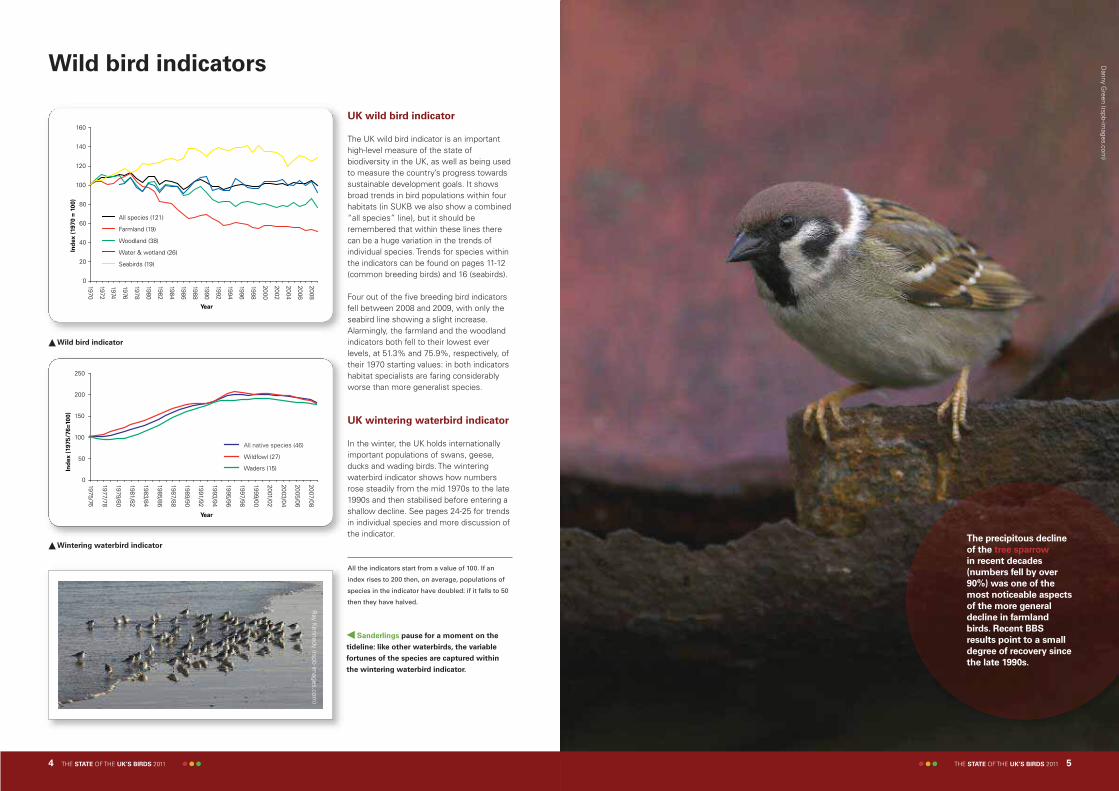
The UK wild bird indicator is an importanthigh-level measure of the state ofbiodiversity in the UK, as well as being usedto measure the country’s progress towardssustainable development goals. It showsbroad trends in bird populations within fourhabitats (in SUKB we also show a combined“all species” line), but it should beremembered that within these lines therecan be a huge variation in the trends ofindividual species. Trends for species withinthe indicators can be found on pages 11-12(common breeding birds) and 16 (seabirds).
Four out of the five breeding bird indicatorsfell between 2008 and 2009, with only theseabird line showing a slight increase.Alarmingly, the farmland and the woodlandindicators both fell to their lowest everlevels, at 51.3% and 75.9%, respectively, oftheir 1970 starting values: in both indicatorshabitat specialists are faring considerablyworse than more generalist species.
UK wintering waterbird indicator
In the winter, the UK holds internationallyimportant populations of swans, geese,ducks and wading birds. The winteringwaterbird indicator shows how numbersrose steadily from the mid 1970s to the late1990s and then stabilised before entering ashallow decline. See pages 24-25 for trendsin individual species and more discussion ofthe indicator.
All the indicators start from a value of 100. If an
index rises to 200 then, on average, populations of
species in the indicator have doubled: if it falls to 50
then they have halved.
0
20
40
60
80
100
120
140
160
1970
1972
1974
1976
1978
1980
1982
1984
1986
1988
1990
1992
1994
1996
1998
2000
2002
2004
2006
2008
Year
Ind
ex (
1970 =
10
0)
All species (121)
Farmland (19)
Woodland (38)
Water & wetland (26)
Seabirds (19)
� Wild bird indicator
0
50
100
150
200
250
Year
Ind
ex
(19
75
/76
=10
0)
All native species (46)
Wildfowl (27)
Waders (15)
1975/76
1977/78
1979/80
1981/82
1983/84
1985/86
1987/88
1989/90
1991/92
1993/94
1995/96
1997/98
1999/00
2001/02
2003/04
2005/06
2007/08
� Wintering waterbird indicator
Ray Kennedy (rspb-im
ages.com)
� Sanderlings pause for a moment on the
tideline: like other waterbirds, the variable
fortunes of the species are captured within
the wintering waterbird indicator.
The precipitous decline
of the tree sparrow
in recent decades
(numbers fell by over
90%) was one of the
most noticeable aspects
of the more general
decline in farmland
birds. Recent BBS
results point to a small
degree of recovery since
the late 1990s.
Danny G
reen (rspb-images.com
)
THE STATE OF THE UK’S BIRDS 2011 76 THE STATE OF THE UK’S BIRDS 2011
Birds in the UK Biodiversity Action Plan
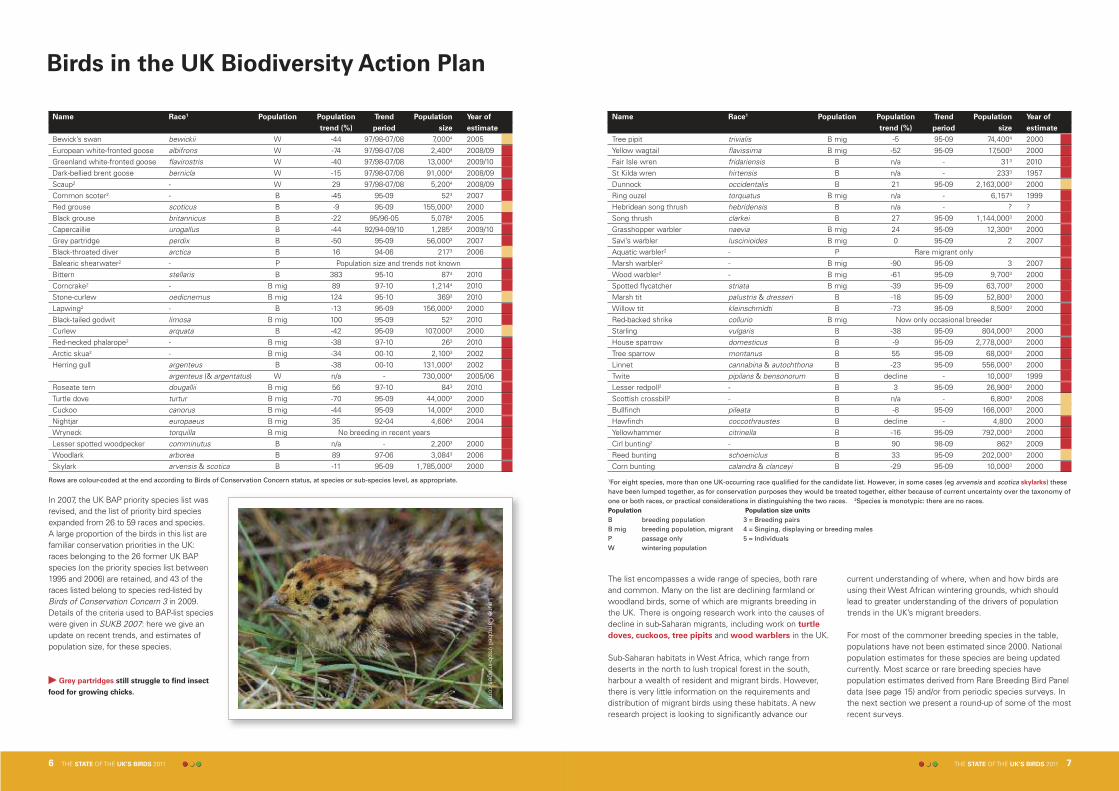
In 2007, the UK BAP priority species list wasrevised, and the list of priority bird speciesexpanded from 26 to 59 races and species. A large proportion of the birds in this list arefamiliar conservation priorities in the UK:races belonging to the 26 former UK BAPspecies (on the priority species list between1995 and 2006) are retained, and 43 of theraces listed belong to species red-listed byBirds of Conservation Concern 3 in 2009.Details of the criteria used to BAP-list specieswere given in SUKB 2007: here we give anupdate on recent trends, and estimates ofpopulation size, for these species.
Name Race1 Population Population Trend Population Year of
trend (%) period size estimate
Bewick’s swan bewickii W -44 97/98-07/08 7,0004 2005European white-fronted goose albifrons W -74 97/98-07/08 2,4004 2008/09Greenland white-fronted goose flavirostris W -40 97/98-07/08 13,0004 2009/10Dark-bellied brent goose bernicla W -15 97/98-07/08 91,0004 2008/09Scaup2 - W 29 97/98-07/08 5,2004 2008/09Common scoter2 - B -45 95-09 523 2007Red grouse scoticus B -9 95-09 155,0003 2000Black grouse britannicus B -22 95/96-05 5,0784 2005Capercaillie urogallus B -44 92/94-09/10 1,2854 2009/10Grey partridge perdix B -50 95-09 56,0003 2007Black-throated diver arctica B 16 94-06 2173 2006Balearic shearwater2 - P Population size and trends not knownBittern stellaris B 383 95-10 874 2010Corncrake2 - B mig 89 97-10 1,2144 2010Stone-curlew oedicnemus B mig 124 95-10 3693 2010Lapwing2 - B -13 95-09 156,0003 2000Black-tailed godwit limosa B mig 100 95-09 523 2010Curlew arquata B -42 95-09 107,0003 2000Red-necked phalarope2 - B mig -38 97-10 263 2010Arctic skua2 - B mig -34 00-10 2,1003 2002Herring gull argenteus B -38 00-10 131,0003 2002
argenteus (& argentatus) W n/a - 730,0004 2005/06Roseate tern dougallii B mig 56 97-10 843 2010Turtle dove turtur B mig -70 95-09 44,0003 2000Cuckoo canorus B mig -44 95-09 14,0004 2000Nightjar europaeus B mig 35 92-04 4,6064 2004Wryneck torquilla B mig No breeding in recent yearsLesser spotted woodpecker comminutus B n/a - 2,2003 2000Woodlark arborea B 89 97-06 3,0843 2006Skylark arvensis & scotica B -11 95-09 1,785,0003 2000
Name Race1 Population Population Trend Population Year of
trend (%) period size estimate
Tree pipit trivialis B mig -5 95-09 74,4004 2000Yellow wagtail flavissima B mig -52 95-09 17,5003 2000Fair Isle wren fridariensis B n/a - 313 2010St Kilda wren hirtensis B n/a - 2333 1957Dunnock occidentalis B 21 95-09 2,163,0003 2000Ring ouzel torquatus B mig n/a - 6,1574 1999Hebridean song thrush hebridensis B n/a - ? ?Song thrush clarkei B 27 95-09 1,144,0003 2000Grasshopper warbler naevia B mig 24 95-09 12,3004 2000Savi’s warbler luscinioides B mig 0 95-09 2 2007Aquatic warbler2 - P Rare migrant onlyMarsh warbler2 - B mig -90 95-09 3 2007Wood warbler2 - B mig -61 95-09 9,7003 2000Spotted flycatcher striata B mig -39 95-09 63,7003 2000Marsh tit palustris & dresseri B -18 95-09 52,8003 2000Willow tit kleinschmidti B -73 95-09 8,5003 2000Red-backed shrike collurio B mig Now only occasional breederStarling vulgaris B -38 95-09 804,0003 2000House sparrow domesticus B -9 95-09 2,778,0003 2000Tree sparrow montanus B 55 95-09 68,0003 2000Linnet cannabina & autochthona B -23 95-09 556,0003 2000Twite pipilans & bensonorum B decline - 10,0003 1999Lesser redpoll2 - B 3 95-09 26,9003 2000Scottish crossbill2 - B n/a - 6,8003 2008Bullfinch pileata B -8 95-09 166,0003 2000Hawfinch coccothraustes B decline - 4,800 2000Yellowhammer citrinella B -16 95-09 792,0003 2000Cirl bunting2 - B 90 98-09 8623 2009Reed bunting schoeniclus B 33 95-09 202,0003 2000Corn bunting calandra & clanceyi B -29 95-09 10,0003 2000
Laurie Cam
pbell (rspb-images.com
)
1For eight species, more than one UK-occurring race qualified for the candidate list. However, in some cases (eg arvensis and scotica skylarks) thesehave been lumped together, as for conservation purposes they would be treated together, either because of current uncertainty over the taxonomy ofone or both races, or practical considerations in distinguishing the two races. 2Species is monotypic: there are no races.Population Population size units
B breeding population 3 = Breeding pairsB mig breeding population, migrant 4 = Singing, displaying or breeding malesP passage only 5 = IndividualsW wintering population
The list encompasses a wide range of species, both rare and common. Many on the list are declining farmland orwoodland birds, some of which are migrants breeding in the UK. There is ongoing research work into the causes ofdecline in sub-Saharan migrants, including work on turtle
doves, cuckoos, tree pipits and wood warblers in the UK.
Sub-Saharan habitats in West Africa, which range fromdeserts in the north to lush tropical forest in the south,harbour a wealth of resident and migrant birds. However,there is very little information on the requirements anddistribution of migrant birds using these habitats. A newresearch project is looking to significantly advance our
current understanding of where, when and how birds areusing their West African wintering grounds, which shouldlead to greater understanding of the drivers of populationtrends in the UK’s migrant breeders.
For most of the commoner breeding species in the table,populations have not been estimated since 2000. Nationalpopulation estimates for these species are being updatedcurrently. Most scarce or rare breeding species havepopulation estimates derived from Rare Breeding Bird Paneldata (see page 15) and/or from periodic species surveys. Inthe next section we present a round-up of some of the mostrecent surveys.
� Grey partridges still struggle to find insect
food for growing chicks.
Rows are colour-coded at the end according to Birds of Conservation Concern status, at species or sub-species level, as appropriate.
Cranes in the UK
Research during 2010 has given us a betterunderstanding of the status of cranes in the UK.Cranes became extinct as UK breeders over 400 yearsago, probably mainly due to hunting. However, 1981saw the return of breeding cranes to the UK, in theNorfolk Broads, with the first successful breedingthe following year. Over the next two decades,the population grew very slowly, and by 2000numbers had only increased to four pairs, allin the Norfolk Broads. However, over the last10 years the population has seen significantgrowth. In 2010, the national crane populationwas put at 17 pairs, of which between 13 and 14pairs were breeding, and these fledged eight young.This represents both the largest breeding population andhighest number of young fledged since recolonisation.
The nucleus of the population remains in the Norfolk Broads,but breeding cranes have recently colonised the north ofEngland and the Fens. The majority of the population isresident (unlike other breeding populations in Europe, whichmigrate to Iberia), and between 40 and 50 birds are
typically present during the winter, mainly in the Broads. The crane remains a rare breeder in the UK, but if this trendcontinues, it should spread into new areas. Thisrecolonisation is being aided by an ambitious projectreintroducing cranes to the Somerset Levels; it is intendedto release up to 100 juvenile cranes, raised from eggs taken
under licence from Germany, between 2010 and 2014, toestablish a healthy breeding population here.
Together with the naturally re-established birds, itis hoped that they will provide the nucleus forthe continued recovery of this magnificentspecies in the UK.
THE STATE OF THE UK’S BIRDS 2011 98 THE STATE OF THE UK’S BIRDS 2011
Recent surveys
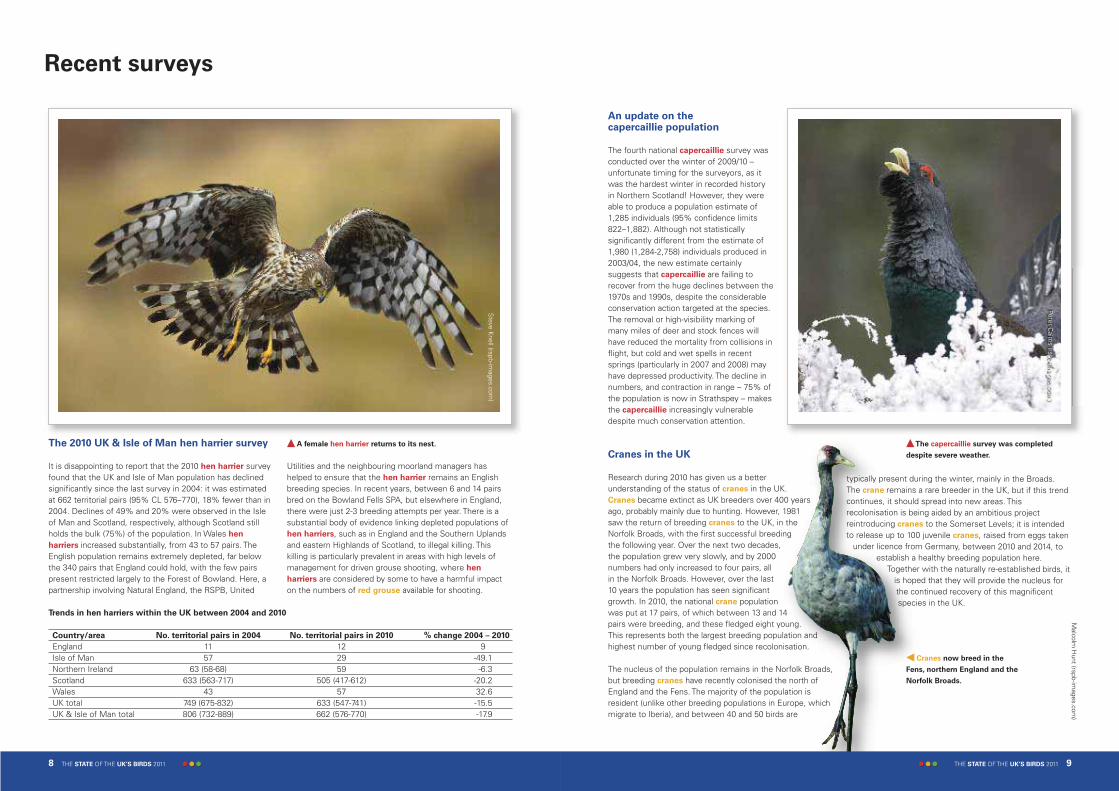
The 2010 UK & Isle of Man hen harrier survey
It is disappointing to report that the 2010 hen harrier surveyfound that the UK and Isle of Man population has declinedsignificantly since the last survey in 2004: it was estimatedat 662 territorial pairs (95% CL 576–770), 18% fewer than in2004. Declines of 49% and 20% were observed in the Isleof Man and Scotland, respectively, although Scotland stillholds the bulk (75%) of the population. In Wales hen
harriers increased substantially, from 43 to 57 pairs. TheEnglish population remains extremely depleted, far belowthe 340 pairs that England could hold, with the few pairspresent restricted largely to the Forest of Bowland. Here, apartnership involving Natural England, the RSPB, United
Trends in hen harriers within the UK between 2004 and 2010
Country/area No. territorial pairs in 2004 No. territorial pairs in 2010 % change 2004 – 2010
England 11 12 9Isle of Man 57 29 -49.1Northern Ireland 63 (58-68) 59 -6.3Scotland 633 (563-717) 505 (417-612) -20.2Wales 43 57 32.6UK total 749 (675-832) 633 (547-741) -15.5UK & Isle of Man total 806 (732-889) 662 (576-770) -17.9
Steve K
nell (rspb-images.com
)
Peter Cairns (rspb-im
ages.com)
Malcolm
Hunt (rspb-im
ages.com)
Utilities and the neighbouring moorland managers hashelped to ensure that the hen harrier remains an Englishbreeding species. In recent years, between 6 and 14 pairsbred on the Bowland Fells SPA, but elsewhere in England,there were just 2-3 breeding attempts per year. There is asubstantial body of evidence linking depleted populations ofhen harriers, such as in England and the Southern Uplandsand eastern Highlands of Scotland, to illegal killing. Thiskilling is particularly prevalent in areas with high levels ofmanagement for driven grouse shooting, where hen
harriers are considered by some to have a harmful impacton the numbers of red grouse available for shooting.
� A female hen harrier returns to its nest. �The capercaillie survey was completed
despite severe weather.
An update on the capercaillie population
The fourth national capercaillie survey wasconducted over the winter of 2009/10 –unfortunate timing for the surveyors, as itwas the hardest winter in recorded historyin Northern Scotland! However, they wereable to produce a population estimate of1,285 individuals (95% confidence limits822–1,882). Although not statisticallysignificantly different from the estimate of1,980 (1,284-2,758) individuals produced in2003/04, the new estimate certainlysuggests that capercaillie are failing torecover from the huge declines between the1970s and 1990s, despite the considerableconservation action targeted at the species.The removal or high-visibility marking ofmany miles of deer and stock fences willhave reduced the mortality from collisions inflight, but cold and wet spells in recentsprings (particularly in 2007 and 2008) mayhave depressed productivity. The decline innumbers, and contraction in range – 75% ofthe population is now in Strathspey – makesthe capercaillie increasingly vulnerabledespite much conservation attention.
� Cranes now breed in the
Fens, northern England and the
Norfolk Broads.

Trends in common breeding birds in the UK
THE STATE OF THE UK’S BIRDS 2011 1110 THE STATE OF THE UK’S BIRDS 2011
Breeding waders on lowland wetgrassland in England
During 2009 and 2010, breeding waders weresurveyed on 275 lowland wet grassland sitesacross England. Coverage was based on the2002 Breeding Waders of Wet Meadows(BWWM) survey, of which 159 sites had beensurveyed in 1982 and 179 in 2002 enablingdirect comparison of numbers across the threesurveys spanning nearly 30 years.
The aims of this survey were to: • provide Site Condition Monitoring of the
Sites of Special Scientific Interest (SSSIs)designated for breeding waders;
• estimate trends in population from previoussurveys in 1982 and 2002;
• investigate whether the distribution ofwaders in 2009–10 was related to sitedesignation and/or presence of wader-relatedagri-environment (AE) prescriptions; and
• investigate whether the change in waderpopulations between 2002 and 2009–10was related to wader-related AEprescriptions, and sites entering (or leaving)higher-level AE schemes.
Across England’s wet lowland grassland,lapwings declined by 20% between 1982 and2009–10 and snipe declined significantly by 43%between 1982 and 2009–10, although there wasa non-significant increase of 21% between 2002and 2009–10 in the latter species. Between 1982and 2009–10 oystercatchers increasedsignificantly by 146% in lowland wet grassland;curlews declined by 26% and redshanks
increased by 25% over the same period.Lapwings, snipe and redshanks becameincreasingly concentrated into a smaller numberof sites between 1982 and 2009-10.
At the scale of individual fields, those fieldswithin nature reserves, or within sitesdesignated as SSSIs, were significantly morelikely to hold lapwings, snipe and redshanks.These species were also more likely to bepresent if fields were also under specific higherlevel AE management (such as Higher LevelStewardship). Furthermore, the probability ofoccupation by waders increased in fields whichwere not under wader-specific AE managementin 2002 but were in 2010, welcome signs thatsuch schemes may be working for thisvulnerable group of birds.
Mark H
amblin (rspb-im
ages.com)
Species Long-term trend % BBS trend %
(1970–2009) (1995-2009)
Mute swan 179 23Greylag goose na 148Canada goose na 93Shelduck 145* 2Mallard 98 18Tufted duck 104 47Red grouse na 3Red-legged partridge -14 27Grey partridge -91 -54Pheasant 76* 34Grey heron 21 2Little grebe -40 15Great crested grebe na 16Red kite na 475Sparrowhawk 81 -8Buzzard 435* 72Kestrel -39* -28Hobby na 20Moorhen -5 14Coot 81 37Oystercatcher na -8Golden plover na -4Lapwing -48 -20Snipe na 50Curlew -60* -41Redshank na -35Common sandpiper -40 -7Feral pigeon na -8Stock dove 83* 4Woodpigeon 130 38Collared dove 400 25Turtle dove -91 -74Ring-necked parakeet na 842Cuckoo -61* -48Barn owl na 501Little owl -43 -29Tawny owl -32 -18Swift na -31Kingfisher -11 -17Green woodpecker 127* 47Great spotted woodpecker 364 139Lesser spotted woodpecker -70 naSkylark -55* -15Sand martin 9 33Swallow 21* 34House martin -45* -4Tree pipit -75* -13Meadow pipit -44* -21Yellow wagtail -75 -55Grey wagtail -35 15Pied wagtail 31 -5Dipper -32 -35
Steve Knell (rspb-images.com
)G
ordon Langsbury (rspb-images.com
)
� Bullfinch: now a localised species in many
parts of the UK.
� Kingfishers need ice-free conditions to
hunt fish and are typically affected by long
spells of severe weather.
Lapwings declined by
20% on England's
lowland wet grasslands
between 1982 and
2009-10. However, there
are encouraging signs
that agri-environment
schemes are beginning
to benefit this species.
This table shows the estimated
long-term (1970–2009) and short-term
(1995–2009) trends for common
breeding birds in the UK, based on
the results of four annual bird
surveys; the Common Birds Census
(CBC) from 1970 to 2000, its
replacement – the Breeding Bird
Survey (BBS) from 1994 to 2009, the
Waterways Bird Survey (WBS) from
1974 to 2009, and its replacement –
the Waterways Breeding Bird Survey
(WBBS) from 1998 to 2009.
THE STATE OF THE UK’S BIRDS 2011 1312 THE STATE OF THE UK’S BIRDS 2011
All short-term trends are based on the smoothed
BBS estimates of change in the UK between 1995
and 2009 except for seven riverine species (little
grebe, tufted duck, grey wagtail, sand martin, dipper,
kingfisher and common sandpiper) for which a
similar measure is calculated by combining the WBS
and WBBS data, and grey heron, which is based on
the Heronries Census. For most species, the long
term trends are based on the smoothed estimates of
change between 1970 and 2009 in a combined CBC-
BBS analysis. However, for species with evidence of
marked differences in the population monitored by
the BBS and its predecessor the CBC (coded *) we
use the CBC results until 1994, and solely the BBS
from 1994 to 2009. Hence, long-term trends for these
species may not be representative of the UK
population prior to 1994, due to the more limited
geographical and habitat coverage of the CBC
(mainly farmland and woodland sites in England).
Long-term trends for six riverine species are based
on smoothed WBS-WBBS estimates of change
between 1975 and 2009 and between 1978 and 2009
for sand martin. Although all data, including the
most recent from 2010, are included in these
analyses, we report measures of change from 1970
or 1995 to the penultimate year – 2009, to avoid
unreliable effects due to smoothing at the endpoints
of time series. Apart from the six riverine species,
long-term trends cover shorter time periods due to
the later availability of reliable data, as follows: 1972-
2009 for collared doves, 1975-2009 for sparrowhawks
and 1977-2009 for house sparrows.
More details on the BBS, including The Breeding Bird
Survey 2010 report, can be found at www.bto.org/bbs
Species Long-term trend % BBS trend %
(1970–2009) (1995-2009)
Wren 44 12Dunnock -29 24Robin 49 19Nightingale na -60Redstart 27 7Whinchat na -55Stonechat na 68Wheatear na 1Blackbird -13 26Song thrush -49 24Mistle thrush -53 -21Grasshopper warbler na 23Sedge warbler -14 8Reed warbler 135 30Blackcap 175 73Garden warbler 6 -10Lesser whitethroat 19 3Whitethroat 1 25Wood warbler na -63Chiffchaff 49 52Willow warbler -39* -5Goldcrest -25* -8Spotted flycatcher -87 -47Pied flycatcher na -51Long-tailed tit 109* 24Blue tit 23 4Great tit 91 45Coal tit 30 12Willow tit -92 -76Marsh tit -68 -21Nuthatch 203 66Treecreeper -22 -6Jay 6 16Magpie 94 -3Jackdaw 124 39Rook na -12Carrion crow 85* 9Hooded crow na 3Raven na 0Starling -78* -45House sparrow -66* -6Tree sparrow -92* 73Chaffinch 36 11Greenfinch 0 2Goldfinch 103* 73Siskin na 38Linnet -56* -23Lesser redpoll -88* 16Common crossbill na 10Bullfinch -47 -4Yellowhammer -56 -17Reed bunting -33 30Corn bunting -90 -33
Graham
Eaton (rspb-images.com
)
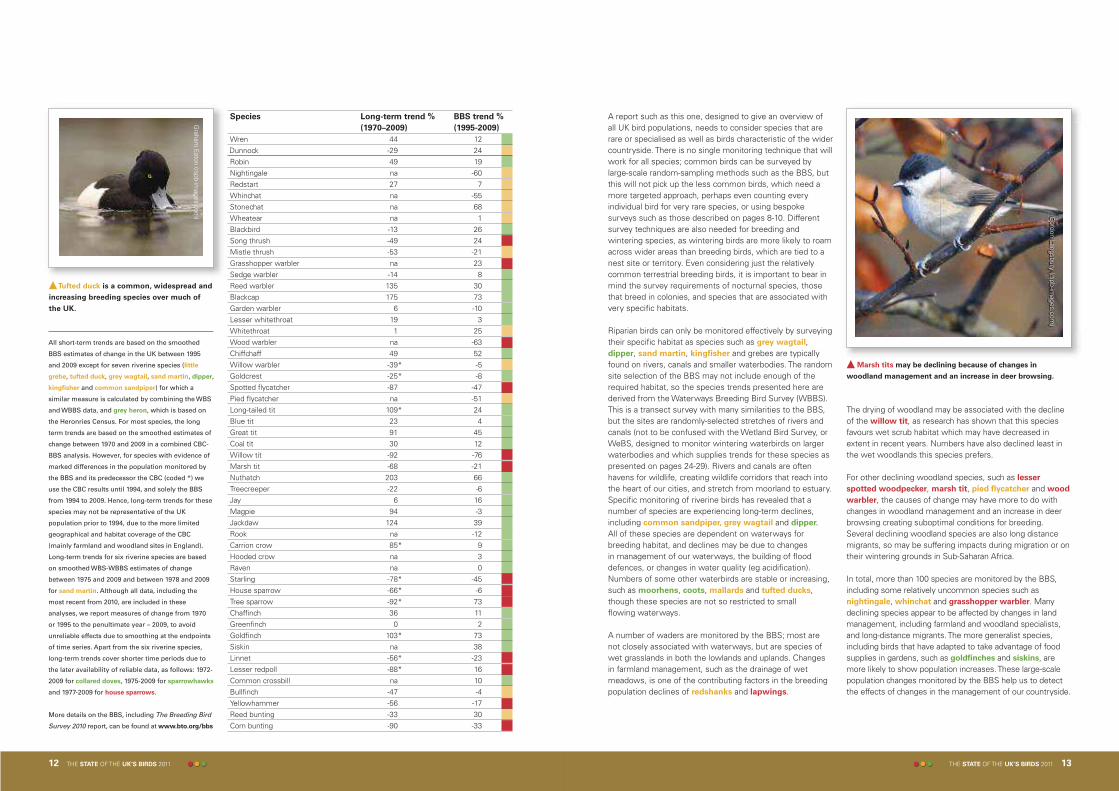
�Tufted duck is a common, widespread and
increasing breeding species over much of
the UK.
A report such as this one, designed to give an overview ofall UK bird populations, needs to consider species that arerare or specialised as well as birds characteristic of the widercountryside. There is no single monitoring technique that willwork for all species; common birds can be surveyed bylarge-scale random-sampling methods such as the BBS, butthis will not pick up the less common birds, which need amore targeted approach, perhaps even counting everyindividual bird for very rare species, or using bespokesurveys such as those described on pages 8-10. Differentsurvey techniques are also needed for breeding andwintering species, as wintering birds are more likely to roamacross wider areas than breeding birds, which are tied to anest site or territory. Even considering just the relativelycommon terrestrial breeding birds, it is important to bear inmind the survey requirements of nocturnal species, thosethat breed in colonies, and species that are associated withvery specific habitats.
Riparian birds can only be monitored effectively by surveyingtheir specific habitat as species such as grey wagtail,dipper, sand martin, kingfisher and grebes are typicallyfound on rivers, canals and smaller waterbodies. The randomsite selection of the BBS may not include enough of therequired habitat, so the species trends presented here arederived from the Waterways Breeding Bird Survey (WBBS).This is a transect survey with many similarities to the BBS,but the sites are randomly-selected stretches of rivers andcanals (not to be confused with the Wetland Bird Survey, orWeBS, designed to monitor wintering waterbirds on largerwaterbodies and which supplies trends for these species aspresented on pages 24-29). Rivers and canals are oftenhavens for wildlife, creating wildlife corridors that reach intothe heart of our cities, and stretch from moorland to estuary.Specific monitoring of riverine birds has revealed that anumber of species are experiencing long-term declines,including common sandpiper, grey wagtail and dipper.
All of these species are dependent on waterways forbreeding habitat, and declines may be due to changes in management of our waterways, the building of flooddefences, or changes in water quality (eg acidification).Numbers of some other waterbirds are stable or increasing,such as moorhens, coots, mallards and tufted ducks,though these species are not so restricted to small flowing waterways.
A number of waders are monitored by the BBS; most arenot closely associated with waterways, but are species ofwet grasslands in both the lowlands and uplands. Changesin farmland management, such as the drainage of wetmeadows, is one of the contributing factors in the breedingpopulation declines of redshanks and lapwings.
The drying of woodland may be associated with the declineof the willow tit, as research has shown that this speciesfavours wet scrub habitat which may have decreased inextent in recent years. Numbers have also declined least inthe wet woodlands this species prefers.
For other declining woodland species, such as lesser
spotted woodpecker, marsh tit, pied flycatcher and wood
warbler, the causes of change may have more to do withchanges in woodland management and an increase in deerbrowsing creating suboptimal conditions for breeding.Several declining woodland species are also long distancemigrants, so may be suffering impacts during migration or ontheir wintering grounds in Sub-Saharan Africa.
In total, more than 100 species are monitored by the BBS,including some relatively uncommon species such asnightingale, whinchat and grasshopper warbler. Manydeclining species appear to be affected by changes in landmanagement, including farmland and woodland specialists,and long-distance migrants. The more generalist species,including birds that have adapted to take advantage of foodsupplies in gardens, such as goldfinches and siskins, aremore likely to show population increases. These large-scalepopulation changes monitored by the BBS help us to detectthe effects of changes in the management of our countryside.
Gordon Langsbury (rspb-im
ages.com)
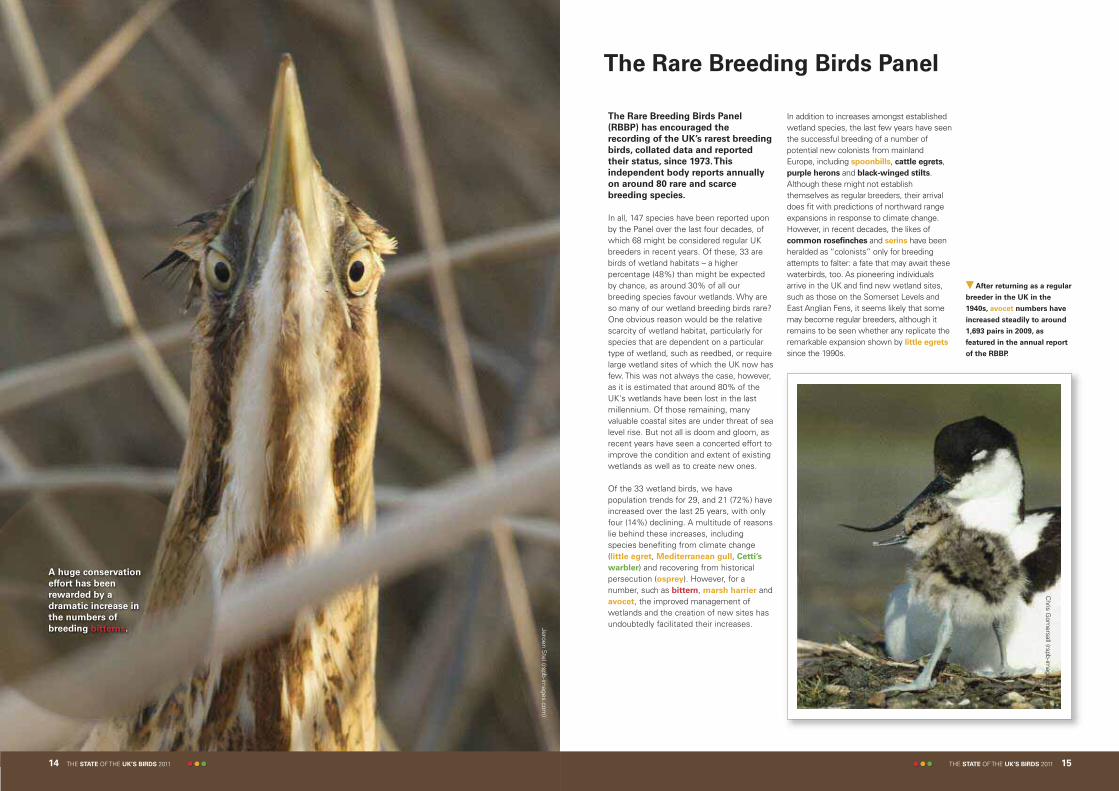
� Marsh tits may be declining because of changes in
woodland management and an increase in deer browsing.
The Rare Breeding Birds Panel
THE STATE OF THE UK’S BIRDS 2011 1514 THE STATE OF THE UK’S BIRDS 2011
A huge conservation
effort has been
rewarded by a
dramatic increase in
the numbers of
breeding bitterns.
The Rare Breeding Birds Panel
(RBBP) has encouraged the
recording of the UK’s rarest breeding
birds, collated data and reported
their status, since 1973. This
independent body reports annually
on around 80 rare and scarce
breeding species.
In all, 147 species have been reported uponby the Panel over the last four decades, ofwhich 68 might be considered regular UKbreeders in recent years. Of these, 33 arebirds of wetland habitats – a higherpercentage (48%) than might be expectedby chance, as around 30% of all ourbreeding species favour wetlands. Why areso many of our wetland breeding birds rare?One obvious reason would be the relativescarcity of wetland habitat, particularly forspecies that are dependent on a particulartype of wetland, such as reedbed, or requirelarge wetland sites of which the UK now hasfew. This was not always the case, however,as it is estimated that around 80% of theUK's wetlands have been lost in the lastmillennium. Of those remaining, manyvaluable coastal sites are under threat of sealevel rise. But not all is doom and gloom, asrecent years have seen a concerted effort toimprove the condition and extent of existingwetlands as well as to create new ones.
Of the 33 wetland birds, we havepopulation trends for 29, and 21 (72%) haveincreased over the last 25 years, with onlyfour (14%) declining. A multitude of reasonslie behind these increases, includingspecies benefiting from climate change(little egret, Mediterranean gull, Cetti’s
warbler) and recovering from historicalpersecution (osprey). However, for anumber, such as bittern, marsh harrier andavocet, the improved management ofwetlands and the creation of new sites hasundoubtedly facilitated their increases.
In addition to increases amongst establishedwetland species, the last few years have seenthe successful breeding of a number ofpotential new colonists from mainlandEurope, including spoonbills, cattle egrets,purple herons and black-winged stilts.Although these might not establishthemselves as regular breeders, their arrivaldoes fit with predictions of northward rangeexpansions in response to climate change.However, in recent decades, the likes ofcommon rosefinches and serins have beenheralded as “colonists” only for breedingattempts to falter: a fate that may await thesewaterbirds, too. As pioneering individualsarrive in the UK and find new wetland sites,such as those on the Somerset Levels andEast Anglian Fens, it seems likely that somemay become regular breeders, although itremains to be seen whether any replicate theremarkable expansion shown by little egrets
since the 1990s.
Chris G
omersall (rspb-im
ages.com)
Jeroen Stel (rspb-im
ages.com)
� After returning as a regular
breeder in the UK in the
1940s, avocet numbers have
increased steadily to around
1,693 pairs in 2009, as
featured in the annual report
of the RBBP.

THE STATE OF THE UK’S BIRDS 2011 1716 THE STATE OF THE UK’S BIRDS 2011
Breeding seabirds in the UK
Since 1986 the Seabird Monitoring
Programme (SMP) has co-ordinated
the monitoring of breeding seabird
populations in the UK, through an
extensive sample of colonies
monitored by partner organisations,
supplemented with more intensive
monitoring of behavioural and
demographic parameters at key
colonies. This information is helping
us to understand how the main
drivers of change are affecting the
UK’s internationally important
seabird populations.
The table shows the differing fortunes ofspecies monitored by the SMP. Since 1986,substantial declines have occurred in thebreeding populations of shags, Arctic skuas,herring gulls, kittiwakes and roseate terns.Continuing declines have been seen in allthese species, apart from the roseate tern,which continues its slow recovery from thelarge declines that occurred in the 1980s.
Trends in breeding seabird numbers in the UK
Species 1986-2010 trend % 2000-2010 trend %
Fulmar -17 1Gannet1 77 26Cormorant 10 -7Shag -33 -15Arctic skua -57 -34Great skua1 49 18Black-headed gull 34 29Lesser black-backed gull -2 -36Herring gull -29 -38Great black-backed gull -9 -14Kittiwake -47 -30Little tern -13 7Sandwich tern 0 -7Common tern 17 3Roseate tern -71 99Arctic tern 16 7Guillemot 49 17Razorbill 41 1
1trend derived from census interpolations and extrapolations
Numbers of Arctic skuas have fluctuated at very low levelsduring the past five years, following severe declines sincethe mid 1980s. In contrast, numbers of great skuas – bywhich Arctic skuas tend to be outcompeted – haveincreased during the monitoring period, although the rate ofincrease has probably slowed. This slowdown has probablybeen fuelled by reductions in fishery discards, associatedwith the decline of the fishing industry, together withshortages of sandeels.
Kittiwake numbers have declined steadily since the early1990s, with an estimated 30% decline in the last decade.Productivity approximately halved during the period 1986 to2010; this is related to declines in their sandeel prey and, insome areas, this has been negatively correlated with seasurface temperatures, associated with climate change.
Numbers of guillemots are probably now higher than at anytime since the first census in the late 1960s. Following signsthat the rate of increase had slowed, the population indexincreased by 14% between 2009 and 2010. Productivity wasexceptionally low in 2005-8 but increased thereafter. Razorbill
numbers increased until 2005, then declined by 22% to 2010.Productivity has declined during the recording period.
Mark H
amblin (rspb-im
ages.com)
The population index for cormorant
increased from the mid 1980s to the mid1990s, boosted by increases at inlandcolonies (largely of the race sinensis,originating from continental Europe).Numbers have declined since 1995 (with atemporary increase in the mid 2000s).Shooting – licensed and unlicensed – is aprobable contributory factor in their recentdecline, as well as possible changes in foodavailability. Shag numbers remain aroundtheir lowest level since monitoring began inthe mid 1980s. The species is affected byhigh mortality following prolonged onshoregales, with severe events occurring in 1994and 2005; populations appear to be veryslow to recover from these events.
Lesser black-backed gull, great black-
backed gull and herring gull have shownsimilar patterns: an increase up to the mid1990s, a marked decline during the early2000s, then smaller declines since. Thecauses are poorly understood. Herring gulls
and lesser black-backed gulls now breedon rooftops and other man-made structures.Recent information on such breeders isincomplete, but it appears that urbannesters fare better than those in naturalhabitats, so the main causes of declinewould appear to be at coastal colonies.Black-headed gull numbers have increasedduring the last seven years, followingdeclines from the early 1990s. The speciesmay have benefited – in common with manyground-nesting birds – from recent minkcontrol and eradication measures.
Little tern numbers have increased since2005, following a period of decline since themid 1980s. Productivity has fluctuated fromyear to year with no clear trend but hasoften been low. Factors contributing to thelow productivity include predation of chicksand eggs by foxes, carrion crows andkestrels, nest loss due to bad weather, foodshortage and, chiefly, disturbance by people.
Sandwich tern breeding numbers havedeclined since 2002 and their productivityhas declined since 2000, with fewer thanone pair in three raising a chick in 2010.Predation by foxes is often a cause offailure, and fencing to exclude them is not
always successful. Because Sandwich
terns and little terns nest on low-lyingground close to the tide edge, their nestsare vulnerable to tidal inundation anderosion; increased storminess and sea-levelrises predicted under climate change maylead to increased prevalence of such events.Arctic tern numbers decreased from thelate 1980s (due to sandeel shortagesprobably caused by regional oceanographicchange) to a low in 2004, but have sinceincreased, probably helped by minkeradication in the west of Scotland.
� Kittiwake numbers have nearly halved since the mid 1980s.
0
20
40
60
80
100
120
140
160
1986
1987
1988
1989
1990
1991
1992
1993
1994
1995
1996
1997
1998
1999
2000
2001
2002
2003
2004
2005
2006
2007
2008
2009
2010
Year
Ind
ex (
1986 =
10
0)
Cormorant
Shag
1986
1987
1988
1989
1990
1991
1992
1993
1994
1995
1996
1997
1998
1999
2000
2001
2002
2003
2004
2005
2006
2007
2008
2009
2010
Year
0
20
40
60
80
100
120
140
160
180
200
Ind
ex (
1986 =
10
0)
Black-headed gull
Great black-backed gull
Herring gull
Lesser black-backed gull
� Trends in cormorants and shags in the UK.
� Trends in four species of gull in the UK.
Ramsar at 40: the protection of wetland birds in the UK
THE STATE OF THE UK’S BIRDS 2011 1918 THE STATE OF THE UK’S BIRDS 2011
Seabirds and Ramsar
The Ramsar Convention, 40 years old in 2011and described on pages 19-23, is oftenregarded as a tool for the conservation ofwildfowl and waders. It has, however, alsoacted as a valuable driver for seabirdconservation in the UK. The seabirds primarilybenefiting from the provisions of theConvention are gulls, terns, cormorants andshags, which comprise the seabird elementof “waterfowl”, one of the groups for whichthe Convention has identified specific site-selection criteria. These seabirds – typicallybeing highly colonial and thus occurring athigh densities in restricted areas – benefitespecially from site protection measuresafforded by the Convention, vulnerable asthey are to mammalian nest predation,human disturbance, tidal inundation/erosionand vegetation succession. Significantproportions of UK populations are protectedwithin the UK network of Ramsar Sites.
Ramsar Sites notable for their breedingseabirds include the Ythan Estuary and MeikleLoch in north-east Scotland (holding 5% ofthe GB population of Sandwich terns), theIsles of Scilly (with England’s only knownbreeding storm petrels and large numbers oflesser black-backed gulls and shags) andStrangford Lough in Northern Ireland (with asignificant population of common terns andSandwich terns).
Assessing the role that the Convention hashad on populations of birds is problematic, notleast because sometimes the drivers ofchange are factors influencing populationswhen the birds are either away from the sitesconcerned (eg whilst feeding at sea), and/orat different times of year (eg in winter).Additionally, it is hard to assess the“protective” consequences of sitedesignations such as, for instance, destructivedevelopment that didn’t occur because thesite was designated. By their nature, veryoften such events are unknowable.
However, there is no doubt that the RamsarSite network has been and continues to beof great significance for the conservation ofbreeding seabirds in the UK.
Forty years ago, representatives of
23 countries and nine international
organisations met in the Iranian
town of Ramsar on the Caspian Sea
coast to discuss the first modern
multi-lateral environmental
agreement. What was agreed – the
Convention on Wetlands of
International Importance especially
as waterfowl habitat – is still the
only such agreement to be focused
on a specific biotope and marked a
watershed moment for
international conservation.
For the previous decade, it had becomeincreasingly apparent that there was apressing need for an international treaty tohelp protect and manage crucially importantwetlands, not just for waterbirds but since“wetlands constitute a resource of greateconomic, cultural, scientific and recreationalvalue, the loss of which would be irreparable”.
Through the 1960s, technical meetings hadshaped the elements eventually to beincluded in the “Ramsar Convention”. Whilstit is usual these days to caricature theConvention as initially being narrowlyfocused just on waterbirds, the reality is thatthe Convention has always had a holisticvision, both of the values and servicesprovided by wetlands and in what it asks ofits Contracting Parties. Indeed, it introducedthe concept of wetland “wise use” decadesbefore its synonym “sustainable use”became widespread conservation parlance.
Those drafting the Convention were“confident that the conservation ofwetlands and their flora and fauna can beensured by combining far-sighted nationalpolicies with co-ordinated internationalaction”. UK progress to that end can beconsidered against each of the Convention’sthree “pillars” of activity:• the protection of wetlands of
international importance through theirdesignation as Ramsar sites;
• the wise use of all wetlands (whether ornot designated); and
• international co-operation in the contextof the conservation of wetlands andmigratory species.
Wetlands of international importance
In 1976, the UK became the ninth ContractingParty to accede to the Convention, with thedesignation of 12 Ramsar sites. These initialdesignations were largely state-ownedNational Nature Reserves, such as CorsFochno and the Dyfi Estuary, Loch Lomond,and Lindisfarne. Later designations haveincluded some of the most ornithologicallyimportant sites in the UK, including thepeatlands of the Flow Country in Caithnessand Sutherland, and of Lewis, with theirvaluable populations of breeding waders suchas greenshanks and dunlins, red- and black-
throated divers, wigeons and common
scoters; estuaries such as The Wash, Dee andSolway Firth with huge numbers of winteringwaterfowl (between 2004-05 and 2008-09 thetotal number of waterbirds on The Washaveraged 372,964); and wet heathlands suchas those in Dorset and the New Forest, whichare rich in many sorts of flora and faunaincluding waders such as curlews and snipe.
Most sites in metropolitan UK weredesignated between 1985 and 2001 (seegraph on page 23), with more recentdesignations occurring in some of theOverseas Territories and CrownDependencies (see page 31).
Wetland types within the network aredominated by estuaries and other “soft”coastlines comprising more than a third
1986
1987
1988
1989
1990
1991
1992
1993
1994
1995
1996
1997
1998
1999
2000
2001
2002
2003
2004
2005
2006
2007
2008
2009
2010
Year
0
20
40
60
80
100
120
140
160
180
200
Ind
ex (
1986 =
10
0)
Arctic tern
Common tern
Little tern
Roseate tern
Sandwich tern
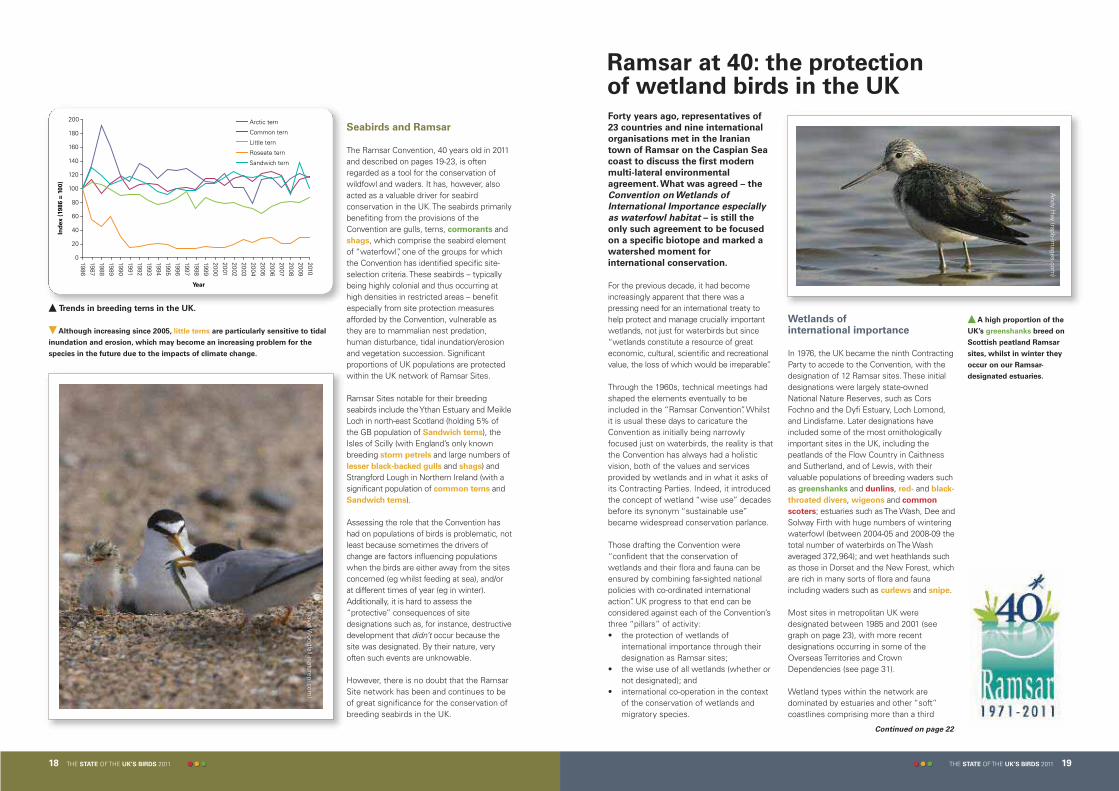
� Trends in breeding terns in the UK.
David W
oodfall (naturepl.com)
� Although increasing since 2005, little terns are particularly sensitive to tidal
inundation and erosion, which may become an increasing problem for the
species in the future due to the impacts of climate change.
Andy H
ay (rspb-images.com
)
� A high proportion of the
UK’s greenshanks breed on
Scottish peatland Ramsar
sites, whilst in winter they
occur on our Ramsar-
designated estuaries.
Continued on page 22
THE STATE OF THE UK’S BIRDS 2011 2120 THE STATE OF THE UK’S BIRDS 2011
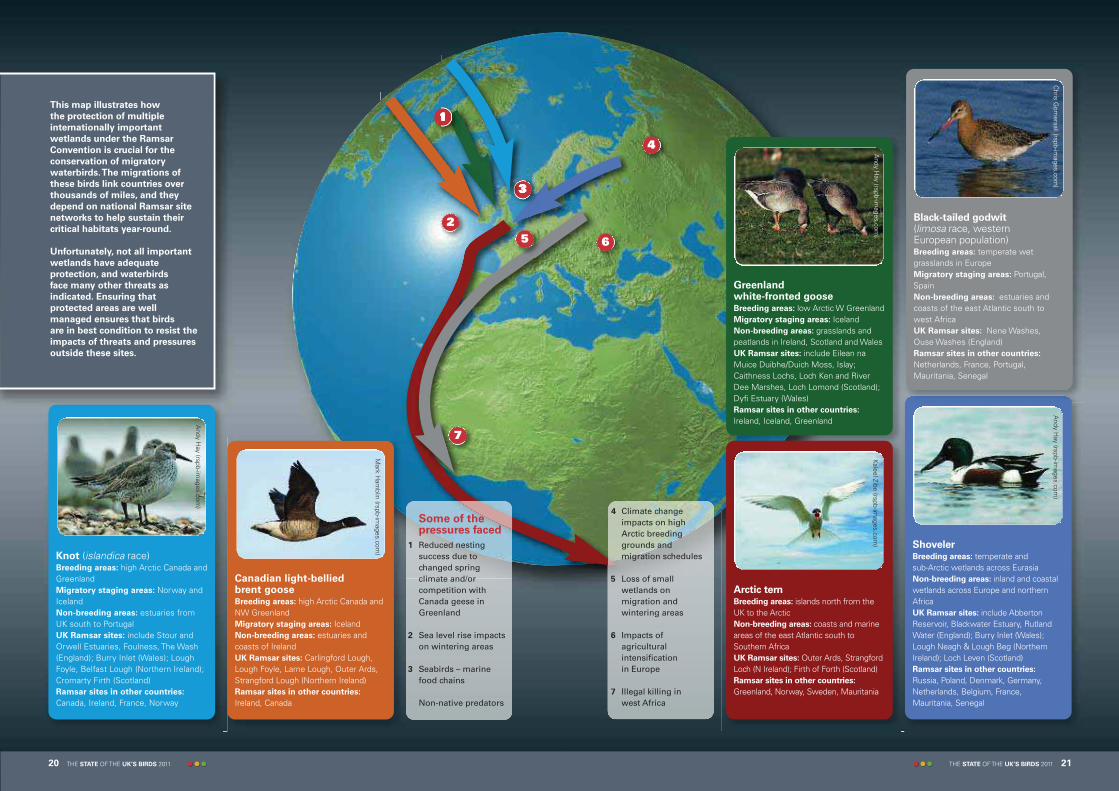
Knot (islandica race)Breeding areas: high Arctic Canada andGreenlandMigratory staging areas: Norway andIcelandNon-breeding areas: estuaries fromUK south to Portugal UK Ramsar sites: include Stour andOrwell Estuaries, Foulness, The Wash(England); Burry Inlet (Wales); LoughFoyle, Belfast Lough (Northern Ireland);Cromarty Firth (Scotland)Ramsar sites in other countries:
Canada, Ireland, France, Norway
Canadian light-bellied brent goose Breeding areas: high Arctic Canada andNW GreenlandMigratory staging areas: IcelandNon-breeding areas: estuaries andcoasts of Ireland UK Ramsar sites: Carlingford Lough, Lough Foyle, Larne Lough, Outer Ards,Strangford Lough (Northern Ireland)Ramsar sites in other countries:
Ireland, Canada
Greenland white-fronted gooseBreeding areas: low Arctic W GreenlandMigratory staging areas: IcelandNon-breeding areas: grasslands andpeatlands in Ireland, Scotland and WalesUK Ramsar sites: include Eilean naMuice Duibhe/Duich Moss, Islay;Caithness Lochs, Loch Ken and RiverDee Marshes, Loch Lomond (Scotland);Dyfi Estuary (Wales)Ramsar sites in other countries:
Ireland, Iceland, Greenland
Arctic ternBreeding areas: islands north from theUK to the ArcticNon-breeding areas: coasts and marineareas of the east Atlantic south toSouthern AfricaUK Ramsar sites: Outer Ards, StrangfordLoch (N Ireland); Firth of Forth (Scotland)Ramsar sites in other countries:
Greenland, Norway, Sweden, Mauritania
ShovelerBreeding areas: temperate and sub-Arctic wetlands across Eurasia Non-breeding areas: inland and coastalwetlands across Europe and northernAfricaUK Ramsar sites: include AbbertonReservoir, Blackwater Estuary, RutlandWater (England); Burry Inlet (Wales);Lough Neagh & Lough Beg (NorthernIreland); Loch Leven (Scotland)Ramsar sites in other countries:
Russia, Poland, Denmark, Germany,Netherlands, Belgium, France,Mauritania, Senegal
Black-tailed godwit (limosa race, western European population)Breeding areas: temperate wetgrasslands in EuropeMigratory staging areas: Portugal,SpainNon-breeding areas: estuaries andcoasts of the east Atlantic south towest AfricaUK Ramsar sites: Nene Washes, Ouse Washes (England)Ramsar sites in other countries:
Netherlands, France, Portugal,Mauritania, Senegal
Some of the pressures faced
1 Reduced nestingsuccess due tochanged springclimate and/orcompetition withCanada geese inGreenland
2 Sea level rise impactson wintering areas
3 Seabirds – marinefood chains
Non-native predators
Andy H
ay (rspb-images.com
)
Mark H
amblin (rspb-im
ages.com)
Chris G
omersall (rspb-im
ages.com)
Andy H
ay (rspb-images.com
)
Kaleel Zibe (rspb-im
ages.com)
1
2
3
5
4
6
7
4 Climate changeimpacts on highArctic breedinggrounds andmigration schedules
5 Loss of smallwetlands onmigration andwintering areas
6 Impacts ofagriculturalintensification in Europe
7 Illegal killing in west Africa
This map illustrates how
the protection of multiple
internationally important
wetlands under the Ramsar
Convention is crucial for the
conservation of migratory
waterbirds. The migrations of
these birds link countries over
thousands of miles, and they
depend on national Ramsar site
networks to help sustain their
critical habitats year-round.
Unfortunately, not all important
wetlands have adequate
protection, and waterbirds
face many other threats as
indicated. Ensuring that
protected areas are well
managed ensures that birds
are in best condition to resist the
impacts of threats and pressures
outside these sites.
Andy H
ay (rspb-images.com
)
THE STATE OF THE UK’S BIRDS 2011 2322 THE STATE OF THE UK’S BIRDS 2011
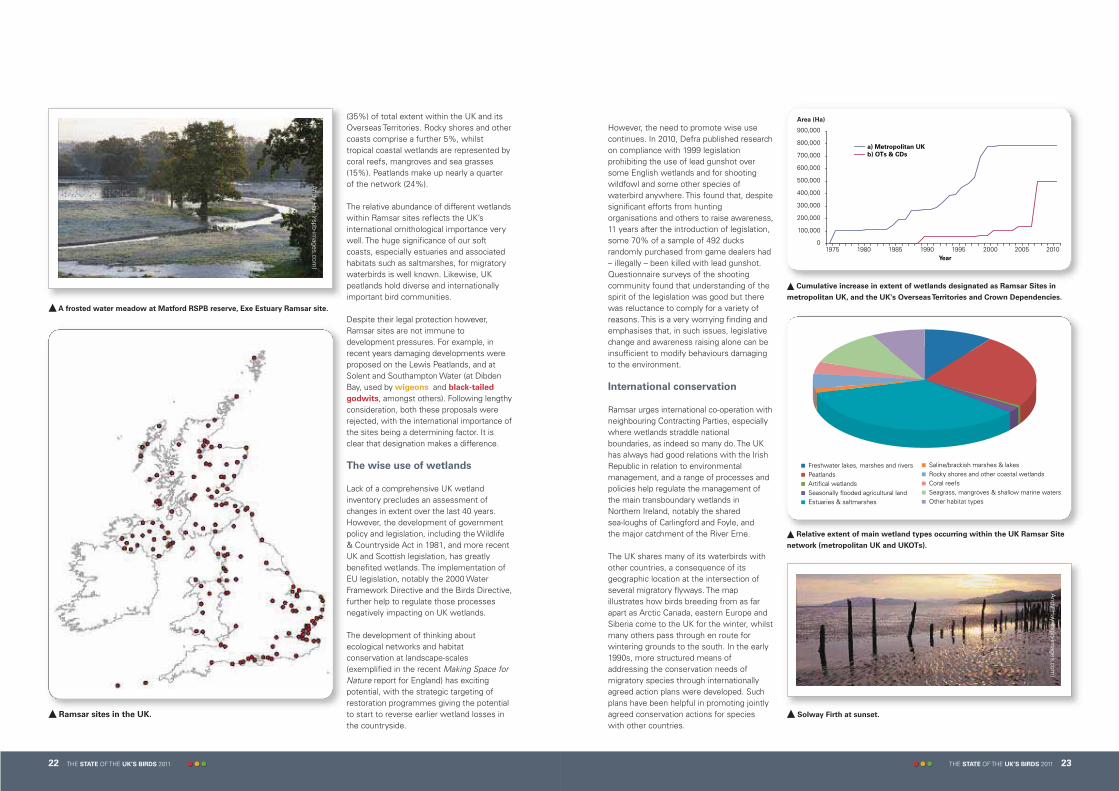
(35%) of total extent within the UK and itsOverseas Territories. Rocky shores and othercoasts comprise a further 5%, whilsttropical coastal wetlands are represented bycoral reefs, mangroves and sea grasses(15%). Peatlands make up nearly a quarterof the network (24%).
The relative abundance of different wetlandswithin Ramsar sites reflects the UK’sinternational ornithological importance verywell. The huge significance of our softcoasts, especially estuaries and associatedhabitats such as saltmarshes, for migratorywaterbirds is well known. Likewise, UKpeatlands hold diverse and internationallyimportant bird communities.
Despite their legal protection however,Ramsar sites are not immune todevelopment pressures. For example, inrecent years damaging developments wereproposed on the Lewis Peatlands, and atSolent and Southampton Water (at DibdenBay, used by wigeons and black-tailed
godwits, amongst others). Following lengthyconsideration, both these proposals wererejected, with the international importance ofthe sites being a determining factor. It isclear that designation makes a difference.
The wise use of wetlands
Lack of a comprehensive UK wetlandinventory precludes an assessment ofchanges in extent over the last 40 years.However, the development of governmentpolicy and legislation, including the Wildlife& Countryside Act in 1981, and more recentUK and Scottish legislation, has greatlybenefited wetlands. The implementation ofEU legislation, notably the 2000 WaterFramework Directive and the Birds Directive,further help to regulate those processesnegatively impacting on UK wetlands.
The development of thinking aboutecological networks and habitatconservation at landscape-scales(exemplified in the recent Making Space forNature report for England) has excitingpotential, with the strategic targeting ofrestoration programmes giving the potentialto start to reverse earlier wetland losses inthe countryside.
However, the need to promote wise usecontinues. In 2010, Defra published researchon compliance with 1999 legislationprohibiting the use of lead gunshot oversome English wetlands and for shootingwildfowl and some other species ofwaterbird anywhere. This found that, despitesignificant efforts from huntingorganisations and others to raise awareness,11 years after the introduction of legislation,some 70% of a sample of 492 ducksrandomly purchased from game dealers had– illegally – been killed with lead gunshot.Questionnaire surveys of the shootingcommunity found that understanding of thespirit of the legislation was good but therewas reluctance to comply for a variety ofreasons. This is a very worrying finding andemphasises that, in such issues, legislativechange and awareness raising alone can beinsufficient to modify behaviours damagingto the environment.
International conservation
Ramsar urges international co-operation withneighbouring Contracting Parties, especiallywhere wetlands straddle nationalboundaries, as indeed so many do. The UKhas always had good relations with the IrishRepublic in relation to environmentalmanagement, and a range of processes andpolicies help regulate the management ofthe main transboundary wetlands inNorthern Ireland, notably the shared sea-loughs of Carlingford and Foyle, and the major catchment of the River Erne.
The UK shares many of its waterbirds withother countries, a consequence of itsgeographic location at the intersection ofseveral migratory flyways. The mapillustrates how birds breeding from as farapart as Arctic Canada, eastern Europe andSiberia come to the UK for the winter, whilstmany others pass through en route forwintering grounds to the south. In the early1990s, more structured means ofaddressing the conservation needs ofmigratory species through internationallyagreed action plans were developed. Suchplans have been helpful in promoting jointlyagreed conservation actions for specieswith other countries.
� Ramsar sites in the UK.
Andy H
ay (rspb-images.com
)
Year
0
100,000
200,000
300,000
400,000
500,000
600,000
700,000
800,000
900,000
1975 1980 1985 1990 1995 2000 2005 2010
a) Metropolitan UK
b) OTs & CDs
Area (Ha)
� Cumulative increase in extent of wetlands designated as Ramsar Sites in
metropolitan UK, and the UK's Overseas Territories and Crown Dependencies.
Freshwater lakes, marshes and riversPeatlandsArtifical wetlandsSeasonally flooded agricultural landEstuaries & saltmarshes
Saline/brackish marshes & lakesRocky shores and other coastal wetlandsCoral reefsSeagrass, mangroves & shallow marine watersOther habitat types
� Relative extent of main wetland types occurring within the UK Ramsar Site
network (metropolitan UK and UKOTs).
� A frosted water meadow at Matford RSPB reserve, Exe Estuary Ramsar site.
Andy H
ay (rspb-images.com
)
� Solway Firth at sunset.
THE STATE OF THE UK’S BIRDS 2011 2524 THE STATE OF THE UK’S BIRDS 2011
Species/population Long-term Ten-year Britain winter UK winter
trend % trend % population population
estimate estimate
Mute swan 126 2 74,000 79,000Bewick's swan -24 -44 7,000 7,000Whooper swan 279 122 11,000 15,000Pink-footed goose 216 27 360,000 360,000European white-fronted goose -81 -74 2,400 2,400Greenland white-fronted goose 73 -40 13,000 13,000Icelandic greylag goose 6 11 85,000 88,000British greylag goose 527 54 140,000 140,000Canada goose 138 23 190,000 190,000Greenland barnacle goose 139 66 58,000 58,000Svalbard barnacle goose 220 21 33,000 33,000Dark-bellied brent goose 11 -15 91,000 91,000Canadian light-bellied brent goose n/a 14 710 27,000Svalbard light-bellied brent goose 352 43 3,400 3,400Shelduck -1 -19 61,000 66,000Wigeon 69 -2 440,000 450,000Gadwall 310 19 25,000 25,000Teal 33 -4 210,000 220,000Mallard -38 -22 680,000 710,000Pintail -4 -5 29,000 29,000Shoveler 69 27 18,000 18,000Pochard -43 -46 38,000 48,000Tufted duck 16 -13 110,000 120,000Scaup 82 29 5,200 12,000Eider (except Shetland) -12 -13 55,000 58,000Eider (Shetland) n/a n/a 5,500 5,500Goldeneye -17 -41 20,000 27,000Red-breasted merganser -15 -34 8,400 9,000Goosander -21 -42 12,000 12,000Ruddy duck -23 -71 150 150Little grebe n/a 23 16,000 17,000Great crested grebe n/a -3 19,000 23,000Cormorant n/a 10 35,000 41,000Coot n/a -8 180,000 190,000Oystercatcher 0 -14 320,000 340,000Avocet >1,000 95 7,500 7,500Ringed plover -16 -26 34,000 36,000Golden plover 403 9 400,000 unknownGrey plover 78 -22 43,000 43,000Lapwing 137 -23 620,000 unknownKnot 16 8 320,000 330,000Sanderling 81 39 16,000 17,000Purple sandpiper -48 -13 13,000 13,000Dunlin -28 -39 350,000 360,000Black-tailed godwit 442 53 43,000 44,000Bar-tailed godwit -22 -29 38,000 41,000Curlew 27 -16 140,000 150,000Redshank 23 -13 120,000 130,000Turnstone 3 -6 48,000 51,000
Trends in wintering waterbirds (including population estimates)
New population estimates have
recently been published for the
UK’s wintering waterbirds, so
these rounded estimates are
presented for Britain and the UK,
alongside the trends.
Lower coverage of some habitats
(such as non-estuarine open coast,
rivers and farmland) means that
trends for species found largely on
such habitats (such as sanderling,
mallard and lapwing) may be less
representative than those for
species found in habitats with
better survey coverage.
Long-term trends are the
percentage changes between the
smoothed index values for
1982–83 and 2007–08. Ten-year
trends are the percentage changes
between the smoothed index
values for 1997–98 and 2007–08.
Calculation of smoothed indices by
use of a generalised additive
model is detailed further at
www.bto.org/webs/alerts.
National monitoring of Canadian
light-bellied brent geese, little
grebes, great crested grebes, coots
and cormorants started later than
for other species, so only
10-year trends are shown. British
greylag geese relates to
“re-established” and “North-west
Scotland” populations listed
separately in previous SUKBs
but both now considered as a
single population.
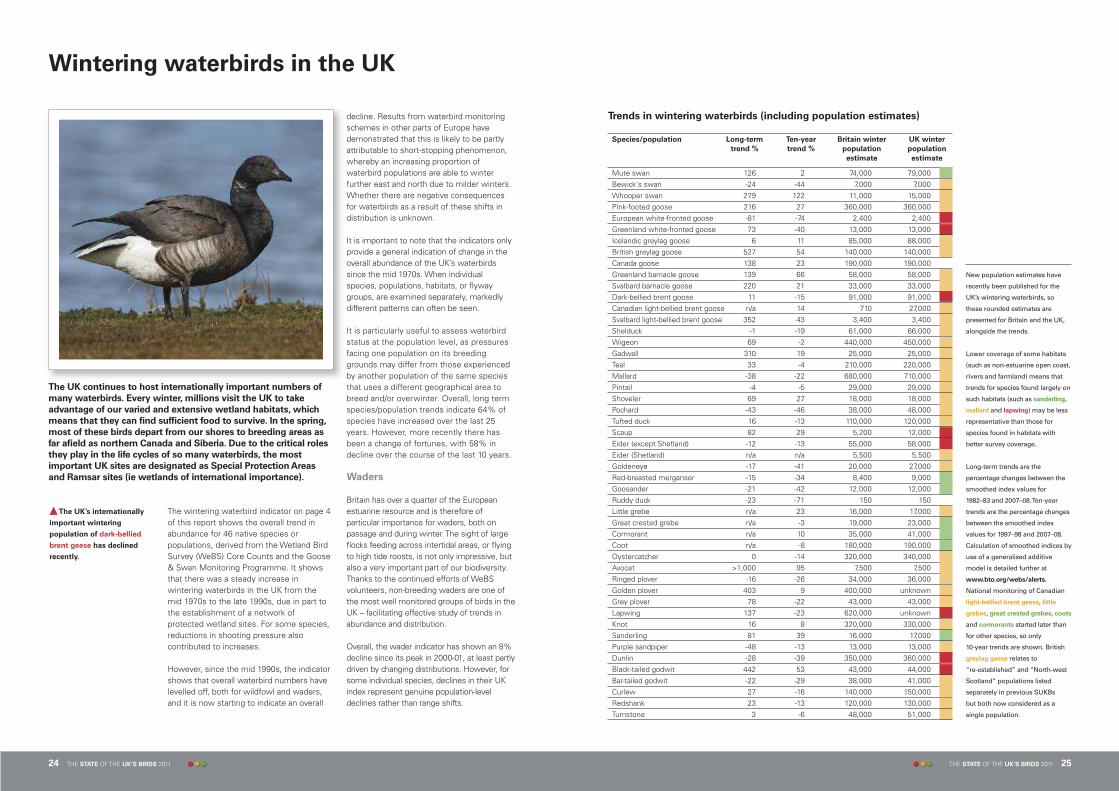
Wintering waterbirds in the UK
The UK continues to host internationally important numbers of
many waterbirds. Every winter, millions visit the UK to take
advantage of our varied and extensive wetland habitats, which
means that they can find sufficient food to survive. In the spring,
most of these birds depart from our shores to breeding areas as
far afield as northern Canada and Siberia. Due to the critical roles
they play in the life cycles of so many waterbirds, the most
important UK sites are designated as Special Protection Areas
and Ramsar sites (ie wetlands of international importance).
decline. Results from waterbird monitoringschemes in other parts of Europe havedemonstrated that this is likely to be partlyattributable to short-stopping phenomenon,whereby an increasing proportion ofwaterbird populations are able to winterfurther east and north due to milder winters.Whether there are negative consequencesfor waterbirds as a result of these shifts indistribution is unknown.
It is important to note that the indicators onlyprovide a general indication of change in theoverall abundance of the UK’s waterbirdssince the mid 1970s. When individualspecies, populations, habitats, or flywaygroups, are examined separately, markedlydifferent patterns can often be seen.
It is particularly useful to assess waterbirdstatus at the population level, as pressuresfacing one population on its breedinggrounds may differ from those experiencedby another population of the same speciesthat uses a different geographical area tobreed and/or overwinter. Overall, long termspecies/population trends indicate 64% ofspecies have increased over the last 25years. However, more recently there hasbeen a change of fortunes, with 58% indecline over the course of the last 10 years.
Waders
Britain has over a quarter of the Europeanestuarine resource and is therefore ofparticular importance for waders, both onpassage and during winter. The sight of largeflocks feeding across intertidal areas, or flyingto high tide roosts, is not only impressive, butalso a very important part of our biodiversity.Thanks to the continued efforts of WeBSvolunteers, non-breeding waders are one ofthe most well monitored groups of birds in theUK – facilitating effective study of trends inabundance and distribution.
Overall, the wader indicator has shown an 8%decline since its peak in 2000-01, at least partlydriven by changing distributions. However, forsome individual species, declines in their UKindex represent genuine population-leveldeclines rather than range shifts.
Mike Lane (rspb-im
ages.com)
�The UK’s internationally
important wintering
population of dark-bellied
brent geese has declined
recently.
The wintering waterbird indicator on page 4of this report shows the overall trend inabundance for 46 native species orpopulations, derived from the Wetland BirdSurvey (WeBS) Core Counts and the Goose& Swan Monitoring Programme. It showsthat there was a steady increase inwintering waterbirds in the UK from the mid 1970s to the late 1990s, due in part tothe establishment of a network ofprotected wetland sites. For some species,reductions in shooting pressure alsocontributed to increases.
However, since the mid 1990s, the indicatorshows that overall waterbird numbers havelevelled off, both for wildfowl and waders,and it is now starting to indicate an overall
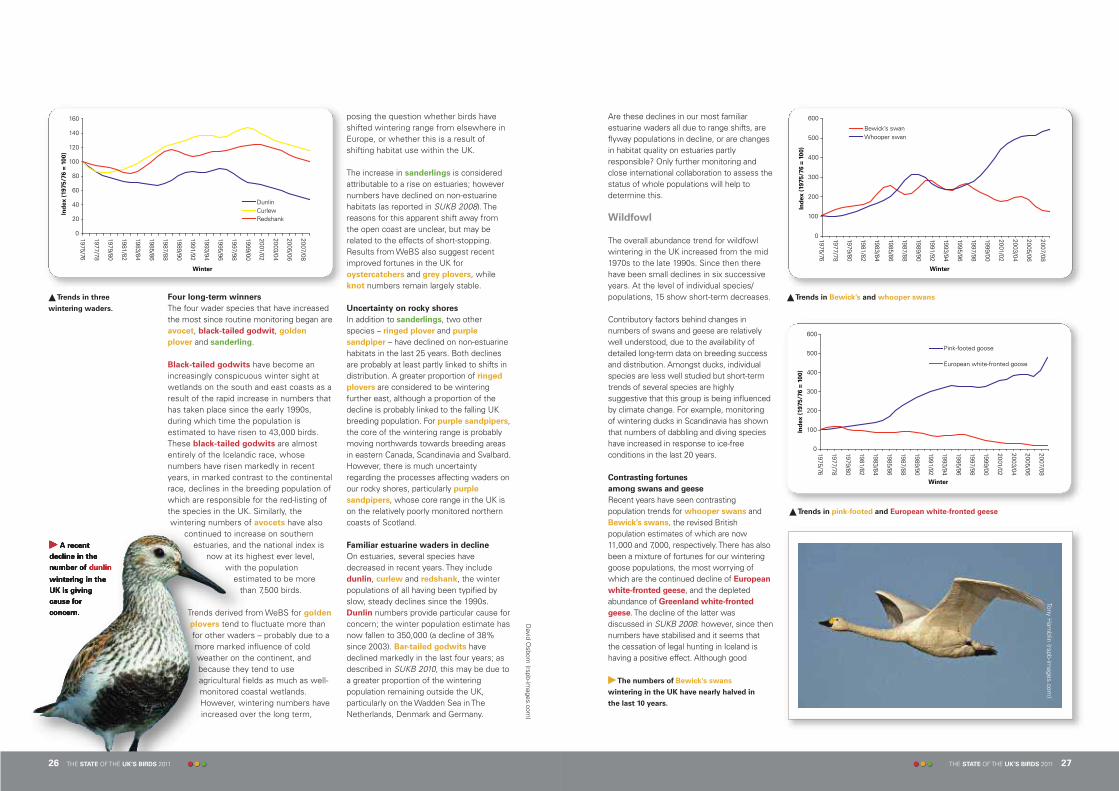
� A recent
decline in the
number of dunlin
wintering in the
UK is giving
cause for
concern.
THE STATE OF THE UK’S BIRDS 2011 2726 THE STATE OF THE UK’S BIRDS 2011
Four long-term winners
The four wader species that have increasedthe most since routine monitoring began areavocet, black-tailed godwit, golden
plover and sanderling.
Black-tailed godwits have become anincreasingly conspicuous winter sight atwetlands on the south and east coasts as aresult of the rapid increase in numbers thathas taken place since the early 1990s,during which time the population isestimated to have risen to 43,000 birds.These black-tailed godwits are almostentirely of the Icelandic race, whosenumbers have risen markedly in recentyears, in marked contrast to the continentalrace, declines in the breeding population ofwhich are responsible for the red-listing ofthe species in the UK. Similarly, thewintering numbers of avocets have also
continued to increase on southernestuaries, and the national index is
now at its highest ever level,with the population
estimated to be morethan 7,500 birds.
Trends derived from WeBS for golden
plovers tend to fluctuate more thanfor other waders – probably due to amore marked influence of coldweather on the continent, andbecause they tend to useagricultural fields as much as well-monitored coastal wetlands.However, wintering numbers haveincreased over the long term,
posing the question whether birds haveshifted wintering range from elsewhere inEurope, or whether this is a result ofshifting habitat use within the UK.
The increase in sanderlings is consideredattributable to a rise on estuaries; howevernumbers have declined on non-estuarinehabitats (as reported in SUKB 2008). Thereasons for this apparent shift away fromthe open coast are unclear, but may berelated to the effects of short-stopping.Results from WeBS also suggest recentimproved fortunes in the UK foroystercatchers and grey plovers, whileknot numbers remain largely stable.
Uncertainty on rocky shores
In addition to sanderlings, two otherspecies – ringed plover and purple
sandpiper – have declined on non-estuarinehabitats in the last 25 years. Both declinesare probably at least partly linked to shifts indistribution. A greater proportion of ringed
plovers are considered to be winteringfurther east, although a proportion of thedecline is probably linked to the falling UKbreeding population. For purple sandpipers,the core of the wintering range is probablymoving northwards towards breeding areasin eastern Canada, Scandinavia and Svalbard.However, there is much uncertaintyregarding the processes affecting waders onour rocky shores, particularly purple
sandpipers, whose core range in the UK ison the relatively poorly monitored northerncoasts of Scotland.
Familiar estuarine waders in decline
On estuaries, several species havedecreased in recent years. They includedunlin, curlew and redshank, the winterpopulations of all having been typified byslow, steady declines since the 1990s.Dunlin numbers provide particular cause forconcern; the winter population estimate hasnow fallen to 350,000 (a decline of 38%since 2003). Bar-tailed godwits havedeclined markedly in the last four years; asdescribed in SUKB 2010, this may be due toa greater proportion of the winteringpopulation remaining outside the UK,particularly on the Wadden Sea in TheNetherlands, Denmark and Germany.
�The numbers of Bewick's swans
wintering in the UK have nearly halved in
the last 10 years.
Winter
0
20
40
60
80
100
120
140
160
1975/76
1977/78
1979/80
1981/82
1983/84
1985/86
1987/88
1989/90
1991/92
1993/94
1995/96
1997/98
1999/00
2001/02
2003/04
2005/06
2007/08
Ind
ex (
1975/7
6 =
10
0)
DunlinCurlewRedshank
�Trends in three
wintering waders.
Are these declines in our most familiarestuarine waders all due to range shifts, areflyway populations in decline, or are changesin habitat quality on estuaries partlyresponsible? Only further monitoring andclose international collaboration to assess thestatus of whole populations will help todetermine this.
Wildfowl
The overall abundance trend for wildfowlwintering in the UK increased from the mid1970s to the late 1990s. Since then therehave been small declines in six successiveyears. At the level of individual species/populations, 15 show short-term decreases.
Contributory factors behind changes innumbers of swans and geese are relativelywell understood, due to the availability ofdetailed long-term data on breeding successand distribution. Amongst ducks, individualspecies are less well studied but short-termtrends of several species are highlysuggestive that this group is being influencedby climate change. For example, monitoringof wintering ducks in Scandinavia has shownthat numbers of dabbling and diving specieshave increased in response to ice-freeconditions in the last 20 years.
Contrasting fortunes
among swans and geese
Recent years have seen contrastingpopulation trends for whooper swans andBewick’s swans, the revised Britishpopulation estimates of which are now11,000 and 7,000, respectively. There has alsobeen a mixture of fortunes for our winteringgoose populations, the most worrying ofwhich are the continued decline of European
white-fronted geese, and the depletedabundance of Greenland white-fronted
geese. The decline of the latter wasdiscussed in SUKB 2008: however, since thennumbers have stabilised and it seems thatthe cessation of legal hunting in Iceland ishaving a positive effect. Although good
0
100
200
300
400
500
600
Winter
Bewick’s swanWhooper swan
1975/76
1977/78
1979/80
1981/82
1983/84
1985/86
1987/88
1989/90
1991/92
1993/94
1995/96
1997/98
1999/00
2001/02
2003/04
2005/06
2007/08
Ind
ex (
1975/7
6 =
10
0)
Tony Ham
blin (rspb-images.com
)
0
100
200
300
400
500
600
Winter
Ind
ex (
1975/7
6 =
10
0)
Pink-footed goose
European white-fronted goose
1975/76
1977/78
1979/80
1981/82
1983/84
1985/86
1987/88
1989/90
1991/92
1993/94
1995/96
1997/98
1999/00
2001/02
2003/04
2005/06
2007/08
�Trends in Bewick’s and whooper swans
�Trends in pink-footed and European white-fronted geese
David O
sborn (rspb-images.com
)
THE STATE OF THE UK’S BIRDS 2011 2928 THE STATE OF THE UK’S BIRDS 2011
breeding seasons in 2009 and 2010 givecause for hope, the lack of clear recovery innumbers gives continued cause for concernfor the population. By contrast, numbers ofboth Svalbard barnacle geese and pink-
footed geese are now at record levels.
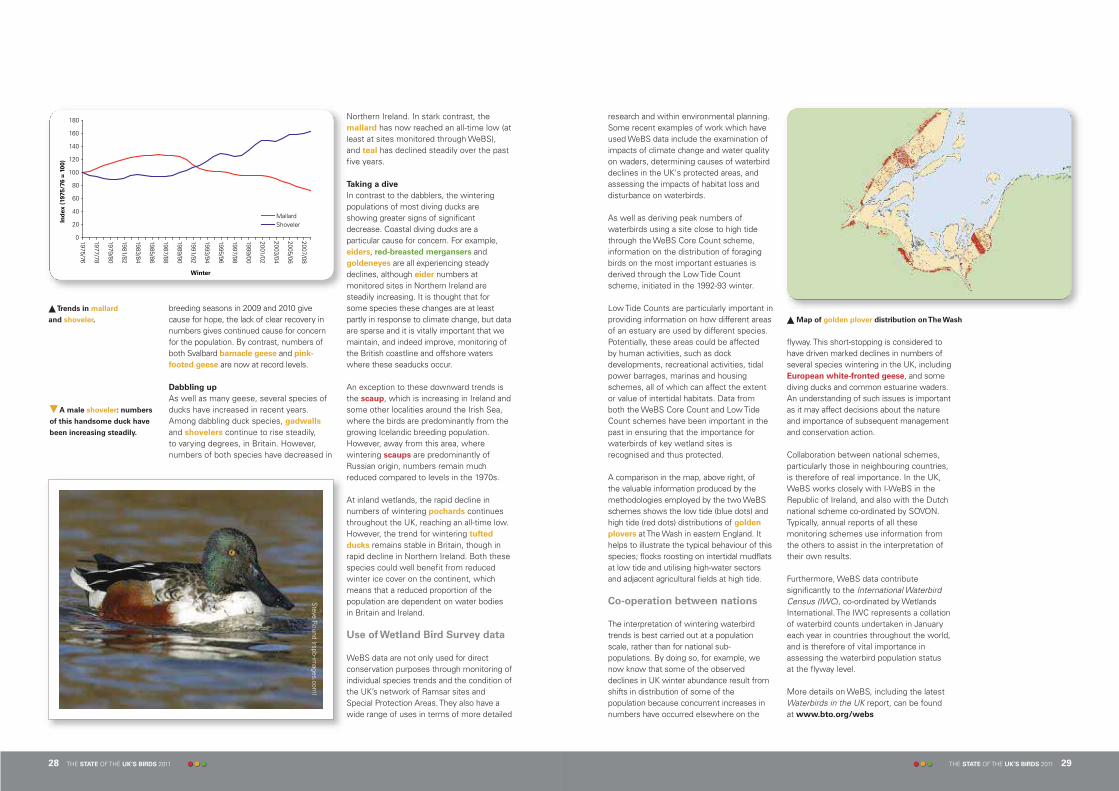
Dabbling up
As well as many geese, several species ofducks have increased in recent years.Among dabbling duck species, gadwalls
and shovelers continue to rise steadily, to varying degrees, in Britain. However,numbers of both species have decreased in
Northern Ireland. In stark contrast, themallard has now reached an all-time low (atleast at sites monitored through WeBS),and teal has declined steadily over the pastfive years.
Taking a dive
In contrast to the dabblers, the winteringpopulations of most diving ducks areshowing greater signs of significantdecrease. Coastal diving ducks are aparticular cause for concern. For example,eiders, red-breasted mergansers andgoldeneyes are all experiencing steadydeclines, although eider numbers atmonitored sites in Northern Ireland aresteadily increasing. It is thought that forsome species these changes are at leastpartly in response to climate change, but dataare sparse and it is vitally important that wemaintain, and indeed improve, monitoring ofthe British coastline and offshore waterswhere these seaducks occur.
An exception to these downward trends isthe scaup, which is increasing in Ireland andsome other localities around the Irish Sea,where the birds are predominantly from thegrowing Icelandic breeding population.However, away from this area, wherewintering scaups are predominantly ofRussian origin, numbers remain muchreduced compared to levels in the 1970s.
At inland wetlands, the rapid decline innumbers of wintering pochards continuesthroughout the UK, reaching an all-time low.However, the trend for wintering tufted
ducks remains stable in Britain, though inrapid decline in Northern Ireland. Both thesespecies could well benefit from reducedwinter ice cover on the continent, whichmeans that a reduced proportion of thepopulation are dependent on water bodiesin Britain and Ireland.
Use of Wetland Bird Survey data
WeBS data are not only used for directconservation purposes through monitoring ofindividual species trends and the condition ofthe UK’s network of Ramsar sites andSpecial Protection Areas. They also have awide range of uses in terms of more detailed
research and within environmental planning.Some recent examples of work which haveused WeBS data include the examination ofimpacts of climate change and water qualityon waders, determining causes of waterbirddeclines in the UK's protected areas, andassessing the impacts of habitat loss anddisturbance on waterbirds.
As well as deriving peak numbers ofwaterbirds using a site close to high tidethrough the WeBS Core Count scheme,information on the distribution of foragingbirds on the most important estuaries isderived through the Low Tide Countscheme, initiated in the 1992-93 winter.
Low Tide Counts are particularly important inproviding information on how different areasof an estuary are used by different species.Potentially, these areas could be affected by human activities, such as dockdevelopments, recreational activities, tidalpower barrages, marinas and housingschemes, all of which can affect the extentor value of intertidal habitats. Data fromboth the WeBS Core Count and Low TideCount schemes have been important in thepast in ensuring that the importance forwaterbirds of key wetland sites isrecognised and thus protected.
A comparison in the map, above right, of the valuable information produced by themethodologies employed by the two WeBSschemes shows the low tide (blue dots) andhigh tide (red dots) distributions of golden
plovers at The Wash in eastern England. Ithelps to illustrate the typical behaviour of thisspecies; flocks roosting on intertidal mudflatsat low tide and utilising high-water sectorsand adjacent agricultural fields at high tide.
Co-operation between nations
The interpretation of wintering waterbirdtrends is best carried out at a populationscale, rather than for national sub-populations. By doing so, for example, wenow know that some of the observeddeclines in UK winter abundance result fromshifts in distribution of some of thepopulation because concurrent increases innumbers have occurred elsewhere on the
� Map of golden plover distribution on The Wash
flyway. This short-stopping is considered tohave driven marked declines in numbers ofseveral species wintering in the UK, includingEuropean white-fronted geese, and somediving ducks and common estuarine waders.An understanding of such issues is importantas it may affect decisions about the natureand importance of subsequent managementand conservation action.
Collaboration between national schemes,particularly those in neighbouring countries,is therefore of real importance. In the UK,WeBS works closely with I-WeBS in theRepublic of Ireland, and also with the Dutchnational scheme co-ordinated by SOVON.Typically, annual reports of all thesemonitoring schemes use information fromthe others to assist in the interpretation oftheir own results.
Furthermore, WeBS data contributesignificantly to the International WaterbirdCensus (IWC), co-ordinated by WetlandsInternational. The IWC represents a collationof waterbird counts undertaken in Januaryeach year in countries throughout the world,and is therefore of vital importance inassessing the waterbird population status at the flyway level.
More details on WeBS, including the latestWaterbirds in the UK report, can be found at www.bto.org/webs
0
20
40
60
80
100
120
140
160
180
1975/76
1977/78
1979/80
1981/82
1983/84
1985/86
1987/88
1989/90
1991/92
1993/94
1995/96
1997/98
1999/00
2001/02
2003/04
2005/06
2007/08
Winter
Ind
ex (
1975/7
6 =
10
0)
MallardShoveler
Steve R
ound (rspb-images.com
)
� A male shoveler: numbers
of this handsome duck have
been increasing steadily.
�Trends in mallard
and shoveler.
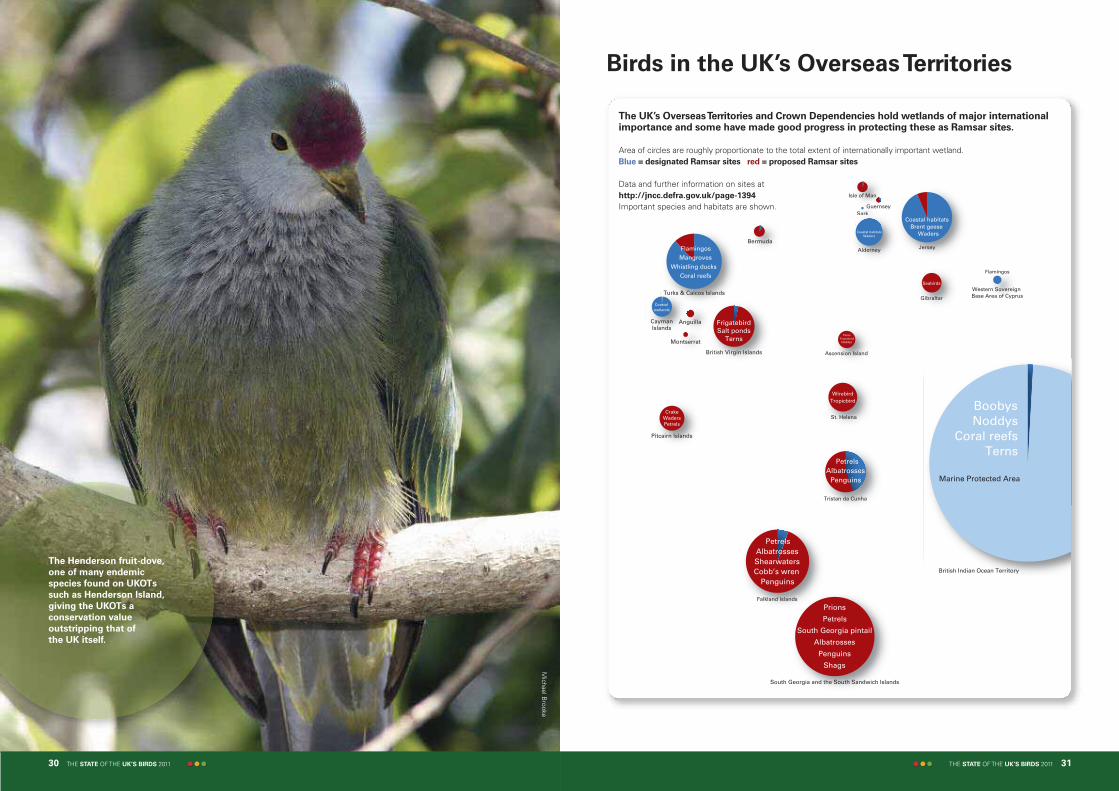
The Henderson fruit-dove,
one of many endemic
species found on UKOTs
such as Henderson Island,
giving the UKOTs a
conservation value
outstripping that of
the UK itself.
THE STATE OF THE UK’S BIRDS 2011 3130 THE STATE OF THE UK’S BIRDS 2011
Marine Protected Area
Bermuda
British Virgin Islands Ascension Island
Montserrat
St. Helena
Tristan da Cunha
Pitcairn Islands
Falkland Islands
South Georgia and the South Sandwich Islands
CaymanIslands
Anguilla
Turks & Caicos IslandsGibraltar
Western Sovereign Base Area of Cyprus
JerseyAlderney
SarkGuernsey
Isle of Man
British Indian Ocean Territory
PetrelsAlbatrosses
Penguins
TernsTropicbird
Noddys
CrakeWadersPetrels
PetrelsAlbatrossesShearwatersCobb’s wren
Penguins
Prions
Petrels
South Georgia pintail
Albatrosses
Penguins
Shags
Seabirds
FrigatebirdSalt ponds
Terns
Coastal habitatsBrent geese
Waders
FlamingosMangroves
Whistling ducksCoral reefs
Coastal wetlands
WirebirdTropicbird Boobys
NoddysCoral reefs
Terns
Flamingos
Coastal habitatsWaders
S kSarkGuern
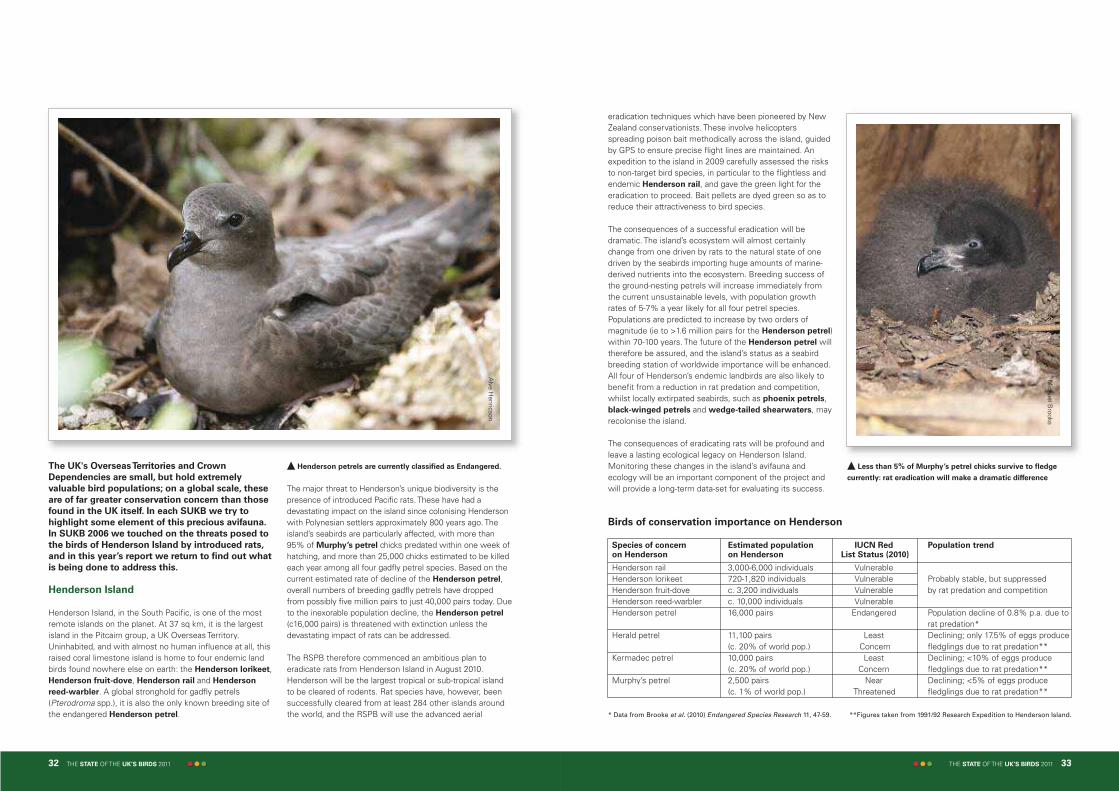
Birds in the UK’s Overseas Territories
The UK’s Overseas Territories and Crown Dependencies hold wetlands of major internationalimportance and some have made good progress in protecting these as Ramsar sites.
Area of circles are roughly proportionate to the total extent of internationally important wetland. Blue = designated Ramsar sites red = proposed Ramsar sites
Data and further information on sites at http://jncc.defra.gov.uk/page-1394
Important species and habitats are shown.
Michael B
rooke
THE STATE OF THE UK’S BIRDS 2011 3332 THE STATE OF THE UK’S BIRDS 2011
The UK's Overseas Territories and Crown
Dependencies are small, but hold extremely
valuable bird populations; on a global scale, these
are of far greater conservation concern than those
found in the UK itself. In each SUKB we try to
highlight some element of this precious avifauna.
In SUKB 2006 we touched on the threats posed to
the birds of Henderson Island by introduced rats,
and in this year’s report we return to find out what
is being done to address this.
Henderson Island
Henderson Island, in the South Pacific, is one of the mostremote islands on the planet. At 37 sq km, it is the largestisland in the Pitcairn group, a UK Overseas Territory.Uninhabited, and with almost no human influence at all, thisraised coral limestone island is home to four endemic landbirds found nowhere else on earth: the Henderson lorikeet,Henderson fruit-dove, Henderson rail and Henderson
reed-warbler. A global stronghold for gadfly petrels(Pterodroma spp.), it is also the only known breeding site ofthe endangered Henderson petrel.
eradication techniques which have been pioneered by NewZealand conservationists. These involve helicoptersspreading poison bait methodically across the island, guidedby GPS to ensure precise flight lines are maintained. Anexpedition to the island in 2009 carefully assessed the risksto non-target bird species, in particular to the flightless andendemic Henderson rail, and gave the green light for theeradication to proceed. Bait pellets are dyed green so as toreduce their attractiveness to bird species.
The consequences of a successful eradication will bedramatic. The island’s ecosystem will almost certainlychange from one driven by rats to the natural state of onedriven by the seabirds importing huge amounts of marine-derived nutrients into the ecosystem. Breeding success ofthe ground-nesting petrels will increase immediately fromthe current unsustainable levels, with population growthrates of 5-7% a year likely for all four petrel species.Populations are predicted to increase by two orders ofmagnitude (ie to >1.6 million pairs for the Henderson petrel)within 70-100 years. The future of the Henderson petrel willtherefore be assured, and the island’s status as a seabirdbreeding station of worldwide importance will be enhanced.All four of Henderson’s endemic landbirds are also likely tobenefit from a reduction in rat predation and competition,whilst locally extirpated seabirds, such as phoenix petrels,black-winged petrels and wedge-tailed shearwaters, mayrecolonise the island.
The consequences of eradicating rats will be profound andleave a lasting ecological legacy on Henderson Island.Monitoring these changes in the island’s avifauna andecology will be an important component of the project andwill provide a long-term data-set for evaluating its success.
Birds of conservation importance on Henderson
Species of concern Estimated population IUCN Red Population trendon Henderson on Henderson List Status (2010)
Henderson rail 3,000-6,000 individuals VulnerableHenderson lorikeet 720-1,820 individuals Vulnerable Probably stable, but suppressedHenderson fruit-dove c. 3,200 individuals Vulnerable by rat predation and competitionHenderson reed-warbler c. 10,000 individuals VulnerableHenderson petrel 16,000 pairs Endangered Population decline of 0.8% p.a. due to
rat predation*Herald petrel 11,100 pairs Least Declining; only 17.5% of eggs produce
(c. 20% of world pop.) Concern fledglings due to rat predation** Kermadec petrel 10,000 pairs Least Declining; <10% of eggs produce
(c. 20% of world pop.) Concern fledglings due to rat predation**Murphy’s petrel 2,500 pairs Near Declining; <5% of eggs produce
(c. 1% of world pop.) Threatened fledglings due to rat predation**
* Data from Brooke et al. (2010) Endangered Species Research 11, 47-59. **Figures taken from 1991/92 Research Expedition to Henderson Island.
The major threat to Henderson’s unique biodiversity is thepresence of introduced Pacific rats. These have had adevastating impact on the island since colonising Hendersonwith Polynesian settlers approximately 800 years ago. Theisland’s seabirds are particularly affected, with more than95% of Murphy’s petrel chicks predated within one week ofhatching, and more than 25,000 chicks estimated to be killedeach year among all four gadfly petrel species. Based on thecurrent estimated rate of decline of the Henderson petrel,overall numbers of breeding gadfly petrels have droppedfrom possibly five million pairs to just 40,000 pairs today. Dueto the inexorable population decline, the Henderson petrel
(c16,000 pairs) is threatened with extinction unless thedevastating impact of rats can be addressed.
The RSPB therefore commenced an ambitious plan toeradicate rats from Henderson Island in August 2010.Henderson will be the largest tropical or sub-tropical islandto be cleared of rodents. Rat species have, however, beensuccessfully cleared from at least 284 other islands aroundthe world, and the RSPB will use the advanced aerial
Alve H
enricson
� Henderson petrels are currently classified as Endangered.
Michael B
rooke
� Less than 5% of Murphy’s petrel chicks survive to fledge
currently: rat eradication will make a dramatic difference

Provisional results
from the Bird Atlas
2007-11 show an
accelerated range
contraction for the
lesser spotted
woodpecker since
the 1988-91
breeding atlas.
Bird Atlas 2007–11
THE STATE OF THE UK’S BIRDS 2011 3534 THE STATE OF THE UK’S BIRDS 2011
Fieldwork for the Bird Atlas 2007-11
is now complete. Thanks to more
than 16,000 dedicated volunteers,
coverage across Britain and Ireland
has been excellent. The breeding
season has been a tough challenge
as the organisers tried to ensure that
species lists for all 10-km squares
were comprehensive and that the
highest level of breeding evidence
for all species in a square was
recorded.
Through the complementary methods ofRoving Records (casual records) and TimedTetrad Visits (timed counts in 2 x 2-kmsquares), together with extra informationfrom a wide range of sources including birdclubs, BTO and BWI surveys and the RSPB,the Atlas has all the information needed tomap the distribution and relative abundanceof birds in both the winter and breeding
Graham
Eaton (naturepl.com
)
Lesser spotted woodpecker by S
teve Knell (rspb-im
ages.com)
seasons. Before the start of the last breedingfield season, the Atlas had logged recordsfrom more than 166,000 Timed Tetrad Visits,3.3 million Roving Records and 3.7 millionBirdTrack records (www.birdtrack.net).More than 580 different species (includingsubspecies) have been recorded and we arepleased that non-native species have beenwell documented. As an example, black
swans have been recorded in 267 10-kmsquares in winter and 221 10-km squares in the breeding season (2008-10, including 28 10-km squares where breeding wasconfirmed).
The results of the Atlas will have a strongemphasis on change. We are fortunate tohave previous atlases carried out in thewinter (1981-84) and breeding seasons(1968-72 and 1988-91), so there is theopportunity to assess changes in range overthe last 30-40 years. Provisional results
� Changes in the distribution
of non-native species like the
black swan will be captured
by the Atlas.

THE STATE OF THE UK’S BIRDS 2011 3736 THE STATE OF THE UK’S BIRDS 2011
What you can do to help
Current and planned surveys
The information summarised in The state of the UK’s birds2011 is drawn from the annual and periodic monitoringprogrammes described below and from the work ofindividual ornithologists. Anyone interested or wishing totake part in these surveys should contact the relevantorganisations at the addresses on page 40.
The Breeding Bird Survey (BBS) is the monitoring schemefor common and widespread breeding land birds throughoutthe UK and aims to provide data on population trends toinform and direct conservation action. It is a partnershipbetween the British Trust for Ornithology (BTO), the JointNature Conservation Committee (JNCC) – on behalf ofNatural England (NE), Scottish Natural Heritage (SNH), theCountryside Council for Wales (CCW) and Northern IrelandEnvironment Agency (NIEA) – and the RSPB [Contact BTO].
The Wetland Bird Survey (WeBS) is the monitoring scheme fornon-breeding waterbirds in the UK, which aims to provide theprincipal data for the conservation of their populations andwetland habitats. It is a partnership between BTO, the RSPBand JNCC (on behalf of NE, SNH, CCW and NIEA) in associationwith Wildfowl & Wetlands Trust (WWT) [Contact BTO].
Goose and swan data are collected by the WWT Goose &
Swan Monitoring Programme, funded under theWWT/JNCC/SNH partnership [Contact WWT].
The Waterways Bird Survey (WBS) and the Waterways
Breeding Bird Survey (WBBS) have been running since 1974and 1998 respectively. These schemes aim to monitorriverside breeding birds, particularly waterway specialists,across the UK [Contact BTO].
Andy H
ay (rspb-images.com
)
suggest substantial losses in the numbersof 10-km squares occupied for species suchas willow tit, lesser spotted woodpecker,capercaillie and corn bunting. The mapshows changes in 10-km square occupancyin the winter for corn buntings and depictsa mix of gains and losses across Britain(with an overall loss of around 25%).
The Atlas will also highlight winners; species which have increased in range forexample, following natural colonisation, or re-introductions. These include little egrets, red kites, avocets and Cetti’s warblers.
Bird Atlas 2007-11 is organised by BTO,BirdWatch Ireland and the ScottishOrnithologists’ Club, who work closely witha network of regional Atlas Organisersacross Britain and Ireland. We would like toexpress our sincere thanks to allfieldworkers, regional organisers andhelpers (validators, square stewards etc) fortheir time, commitment and enthusiasm.
Andy H
ay (rspb-images.com
)
� Bird monitoring in the UK relies largely on the efforts of skilled volunteers.
� Change in 10-km square
occupancy in winter between
the Winter Atlas of 1981-84
and Bird Atlas 2007-11 for
corn bunting. Blue upward
pointing triangles show a
gain and open downward
pointing triangles show a
loss – squares occupied in
both atlases are not shown.
� Provisional results of the 2007-11 Bird
Atlas show a marked range contraction for
the corn bunting in both summer and winter.

Ernie Janes (rspb-im
ages.com)
THE STATE OF THE UK’S BIRDS 2011 3938 THE STATE OF THE UK’S BIRDS 2011
The Seabird Monitoring Programme
gathers information on breeding numbers,breeding success and other parameters tohelp us understand drivers of change and totarget conservation action. Co-ordinated byJNCC, it is a partnership between thestatutory nature conservation agencies,research and conservation organisations;see www.jncc.defra.gov.uk/page-1550
The Barn Owl Monitoring Programme
was started in 2000 to monitor populations,through standardised recording at a set ofbarn owl sites representative of thedistribution in the UK [Contact BTO].
The Big Garden Birdwatch is the largestwildlife survey in the world – a simpledesign (one hour watching birds in thegarden each January) means over 600,000people took part in 2011. The data provide anexcellent snapshot of garden bird numbersacross the UK [Contact the RSPB].
Garden Bird Watch is a year-round schemerecording the weekly occurrence andnumbers of birds in participants’ gardens.The data collected provides valuableinformation on changes in bird use of ruraland urban habitats that can be related topopulation trends in the wider countryside[Contact BTO].
BirdTrack is a year-round online birdrecording system run by BTO, the RSPB,BirdWatch Ireland and the ScottishOrnithologists’ Club. The collection of listdata from a large number of observers willenable the fulfilment of a range of nationalresearch and monitoring objectives [ContactBTO/RSPB or see www.birdtrack.net].
An advance programme of UK-wide surveysof other priority breeding species has beenestablished under the StatutoryConservation Agencies and RSPB BreedingBird Scheme (SCARABBS) Agreement. A Montane Bird Survey (focusing ondotterels and snow buntings) wasconducted in 2011; species to be surveyedin 2012 may include spotted crake, ring
ouzel and twite [Contact the RSPB].
Genevieve Leaper (rspb-im
ages.com)
Andrew
Parkinson (rspb-images.com
)
� Many of the UK’s internationally important seabird colonies are covered in
the Seabird Monitoring Programme.
�The first ever national survey of snow buntings was carried out in 2011:
results will be featured in next year’s SUKB.
Acknowledgements
Monitoring of birds in the UK, such as that covered
in this report, involves a broad partnership of
government agencies, NGOs, sponsors and
independent ornithologists, including:
Anglian Water; BirdWatch Ireland; British Birds; BritishTrust for Ornithology; British Waterways; Centre forEcology and Hydrology; Countryside Council for Wales;Department for Environment, Food and Rural Affairs(Defra); Environment Agency; Environment Wales;European Bird Census Council; European Social Fund;European Union Life Programme; Forestry Commission;Forest Enterprise; Game and Wildlife Conservation Trust;Greenland White-fronted Goose Study; Hawk and OwlTrust; Irish Brent Goose Research Group; Joint NatureConservation Committee; Manx BirdLife; Ministry of
Defence; National Trust; National Trust for Scotland;Natural England; Northern England Raptor Forum;Northern Ireland Environment Agency; NorthumbrianWater; Raptor Study Groups; Rare Breeding Birds Panel;the Royal Society for the Protection of Birds; ScottishExecutive Rural Affairs Department; Scottish NaturalHeritage; Scottish Ornithologists’ Club; Scottish RaptorStudy Groups; Seabird Group; Severn Trent Water;Shetland Oil Terminal Environmental Advisory Group;Thames Water; University of Cambridge; Wales RaptorStudy Group; Welsh Kite Trust; the Wildfowl & WetlandsTrust; the Wildlife Trusts; Woodland Trust.
In particular, we thank the landowners and their agents,tenants and employees who have allowed surveyors to visittheir land to count birds.
� Watching pink-footed geese coming into roost; a great way to end a winter’s day surveying.
The barn owl is the
subject of a dedicated
monitoring programme,
which can detect
short-term fluctuations
caused by variation
in prey levels and
harsh winters.
Edw
in Kats (rspb-im
ages.com)
40 THE STATE OF THE UK’S BIRDS 2011
About us
The state of the UK’s birds 2011 is also available online on the websites of theBTO, the RSPB and WWT (see addresses below).Designed and published by the RSPB on behalf of:
The BTO:
Headquarters, The Nunnery, Thetford, Norfolk IP24 2PUTel: 01842 750050 BTO Scotland, School of Biological and Environmental Sciences, CottrellBuilding, University of Stirling, Stirling FK9 4LATel: 01786 466560BTO Cymru, Thoday Building, Deiniol Road, Bangor, Gwynedd LL57 2UW Tel: 01248 383285www.bto.org
Registered charity no. 216652
The WWT:
WWT, Slimbridge, Gloucestershire GL2 7BTTel: 01453 891900 www.wwt.org.uk
Registered charity no. 1030884
The RSPB:
UK Headquarters, The Lodge, Sandy, Bedfordshire SG19 2DLTel: 01767 680551 Northern Ireland Headquarters, Belvoir Park Forest, Belfast BT8 7QTTel: 028 9049 1547 Scotland Headquarters, 2 Lochside View, Edinburgh Park, Edinburgh EH12 9DHTel: 0131 317 4100 Wales Headquarters, 2nd Floor, Sutherland House, Castlebridge, CowbridgeRoad East, Cardiff CF11 9ABTel: 029 2035 3000 www.rspb.org.uk
Registered charity in England and Wales no. 207076; in Scotland SC037654
Countryside Council for Wales:
Maes-y-Ffynnon, Penrhosgarnedd, Bangor, Gwynedd LL57 2DWTel: 0845 130 6229 www.ccw.gov.uk
Joint Nature Conservation Committee
Monkstone House, City Road,Peterborough, PE1 1JYTel: 01733 562626Fax: 01733 555948
Visit the JNCC website:www.jncc.gov.uk
Natural England:
1 East Parade, Sheffield, S1 2ETTel: 0845 600 3078www.naturalengland.org.uk
Northern Ireland Environment Agency:
Klondyke Building, Cromac Avenue, Lower Ormeau Road, Belfast, BT7 2JATel: 0845 302 0008 www.ni-environment.gov.uk
Scottish Natural Heritage:
Great Glen House, Leachkin Road, Inverness, IV3 8NWTel: 01463 725000www.snh.org.uk
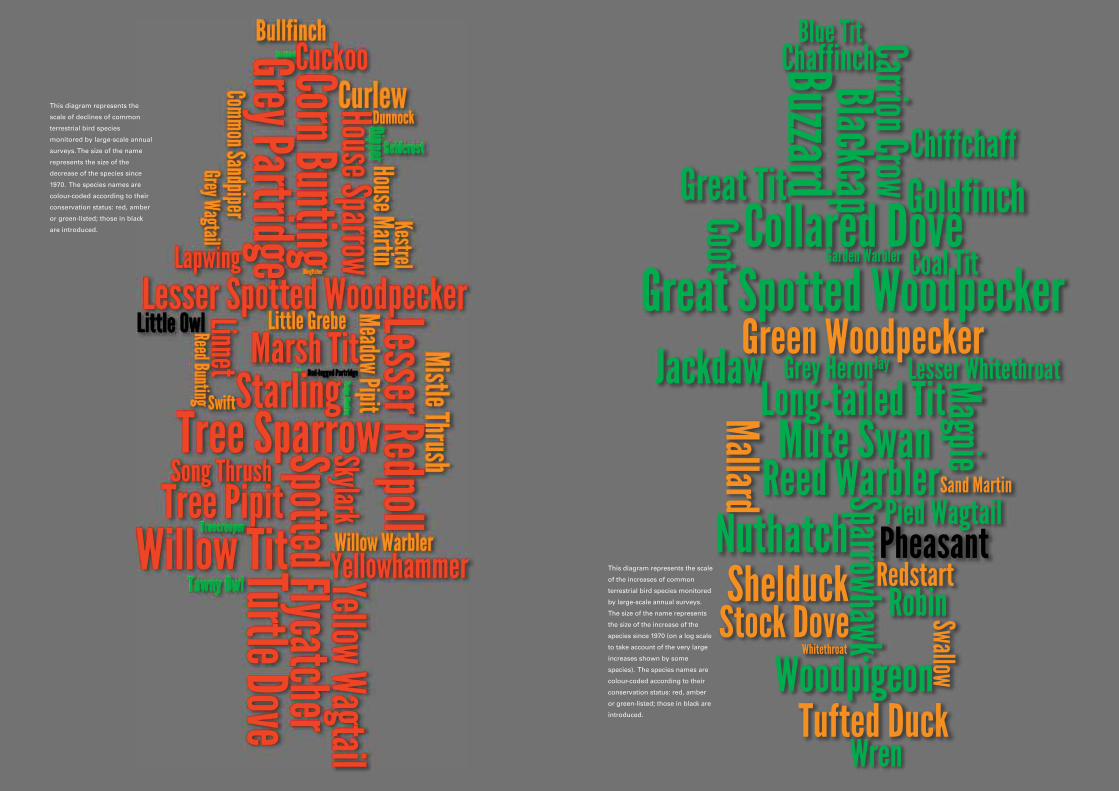
This diagram represents the
scale of declines of common
terrestrial bird species
monitored by large-scale annual
surveys. The size of the name
represents the size of the
decrease of the species since
1970. The species names are
colour-coded according to their
conservation status: red, amber
or green-listed; those in black
are introduced.
This diagram represents the scale
of the increases of common
terrestrial bird species monitored
by large-scale annual surveys.
The size of the name represents
the size of the increase of the
species since 1970 (on a log scale
to take account of the very large
increases shown by some
species). The species names are
colour-coded according to their
conservation status: red, amber
or green-listed; those in black are
introduced.

THE STATE OF THE UK’S BIRDS 2011
Front cover: eider by Peter Cairns (rspb-images.com)
Produced by the Royal Society for the Protection of Birds (RSPB), a registered charity: England & Wales no. 207076, Scotland no. SC037654 210-0607-10-11