the state of small and rural libraries in the united states
TRANSCRIPT

Institute of Museum and Library Services • • 1800 M Street NW, 9th Floor • • Washington, DC 20036 • • www.imls.gov
The State of Small and Rural Libraries in the United States
By Deanne W. Swan, Justin Grimes, and Timothy Owens Page 1 of 13
Research Brief No. 5, September 2013
Highlights• Small and rural libraries
make up the majority of
public library systems in
the United States (80.5%).
• Although most rural
libraries are small, only
half of small libraries are
located in rural areas.
• States have varying levels
of challenges when meeting
the needs of rural residents.
The percentage of rural
public libraries in a given
state varies widely –
from 3.6% to 83.3%.
• Small and rural libraries
continue to provide
substantial electronic and
digital resources for patrons
through access to e-books
and publicly accessible
computer terminals.
• Although per capita
revenue has decreased
over the past three years,
visitation and circulation
have increased for both
small and rural libraries.
Rural and small public libraries provide a variety of critical services and informa-
tion resources to meet the needs of residents across the United States. Recog-
nizing the unique needs of rural communities, state governments and federal
agencies1 support targeted programs to promote social and economic develop-
ment. For example, the Federal Communication Commission (FCC) provides
oversight for the Universal Service Program for Schools and Libraries, also called
e-rate, which uses rurality as a qualifying factor. Many of these state and federal
programs support intermediary organizations, such as public libraries, to deliver
needed services.
Congress has long recognized the importance of library services in rural com-
munities. The Library Services Act of 1956, a precursor to the current Library
Services and Technology Act, was enacted in part to improve the role that
public library services play in rural areas. Nongovernmental agencies have also
recognized the important role that rural libraries play in their communities. As
an example, the Bill & Melinda Gates Foundation’s Rural Library Sustainability Project has played a significant role in securing public libraries’ place as com-
munity computing centers.
Though the distribution of small and rural libraries across the U.S. can be
determined from available data, IMLS has never conducted a targeted analysis
of trends for rural and small library services. This brief is designed to fill that
void. In the review that follows we examine the overlap between three categories
of “rural” libraries and three categories of “small” libraries. We look at the basic
characteristics of these institutions to examine differences in visitation, revenue
and staffing. 2 The report provides an overview of the current state of small and
rural library services for policymakers, program managers, and researchers con-
cerned with rural development.
What is a “Rural” library?The term rural seems simple and straightforward but can be difficult to define.
Rurality is often determined by delineations in geographic boundary or popula-
tion threshold (Cromartie & Bucholtz, 2008). The federal government has at
1 This includes but is not limited to Housing and Urban Development (HUD), U.S. Department of Agriculture (USDA), the National Telecommunications and Information Administration (NTIA) of the U.S. Department of Commerce, and the U.S. Small Business Administration (SBA).
2 Data for this analysis was drawn from the Public Libraries Survey (PLS) from fiscal years 2008 through 2011. For more information on the PLS, see the data documentation and datasets at www.imls.gov/research.

Page 2 of 13
Institute of Museum and Library Services • • 1800 M Street NW, 9th Floor • • Washington, DC 20036 • • www.imls.gov
The State of Small and Rural Libraries in the United States
Rural Libraries
Rural & SmallLibraries
SmallLibraries
All other libraries
3.4%
33.7%
19.5%
43.4%
least fifteen different definitions of “rural” (Fahrenthold,
2013), each designed to address a different policy priority.
This analysis makes use of the urban-centric locale code
system of the Public Libraries Survey (PLS), which sepa-
rates rural areas into three categories:
Rural, Fringe a Census-defined rural territory that is less than or equal to 5 miles from an urbanized area, as well as rural territory that is less than or equal to 2.5 miles from an urban cluster
Rural, Distant a Census-defined rural territory that is more than 5 miles but less than or equal to 25 miles from an urbanized area, as well as rural territory that is more than 2.5 miles but less than or equal to 10 miles from an urban cluster
Rural, Remote a Census-defined rural territory that is more than 25 miles from an urbanized area and is also more than 10 miles from an urban cluster
What is a “Small” library?Unlike the classification of rural libraries, there are few
guideposts for determining what constitutes a “small”
library. There has been little discussion in the library and
information science (LIS) research literature on the sub-
ject. In the few occasions in which the term small library has been defined, it has been based on a variety of factors,
such as geography and population (Heurtz, Gordon, Gor-
don, & Moore 2003; Olszewski, Van Orden, & Dalrymple,
2007); a library service area or population of area served
(Heurtz, Gordon, Gordon, & Moore 2003); or the charac-
teristics of the libraries in question, such as the size of
a library’s staff, collection, building, or budget (Strouse,
Henry, Brown, & Outsell, Inc. 2008; Calhoun, 2008).
In this analysis, we have defined small library based on
the population size of a library’s legal service area. Librar-
ies with a legal service area population of 25,000 or less
were categorized as small libraries. After identifying all
libraries below this basic threshold, these small libraries
were further subdivided into the following three categories:
Small (10 to 25K)
A library with a legal service area population between 10,000 and 24,999
Small (2.5 to 10K)
A library with a legal service area population between 2,500 and 9.999
Small (Less than 2.5K)
A library with a legal service area population under 2,500
Small and Rural Public LibrariesIn Fiscal Year 2011 (FY2011), the most recent year for
which data are available, there were 8,956 public libraries
in the United States.3 Most of these public libraries can
be categorized as small (77.1%), with legal service area
populations of less than 25,000. Similarly, almost half of
all public libraries were rural libraries (46.8%). Figure 1
highlights the substantial overlap between these two cat-
egories: 43.4% of all public libraries in the U.S. were both
small and rural.
Figure 1. Designation of Public Libraries as Small and Rural, FY2011
Source: Public Libraries Survey (PLS) FY 2011, Institute of Museum and Library Services.
This overlap, however, highlights an unexpected find-
ing. The terms “small” and “rural” are often conflated,
but there is not always a direct correspondence between
the two. Although most rural libraries (92.8%) are also
small, only half of small libraries (56.3%) were located in
rural areas.
Figure 2 provides graphic representations of the distri-
bution of each category of small and rural public libraries
for the entire county. Table 1 provides a more detailed
look at the distribution of small and rural public libraries
for each of the 50 states and the District of Columbia. As
expected, there was substantial variability across all states
in the proportion of small and rural libraries. The per-
3 The analysis is conducted at the level of the library administrative entity, which could be either a multi-outlet library system or a single-outlet library. For administrative entities with more than one branch, the locale code was assigned based on the modal locale code of all outlets of that public library.

Page 3 of 13
Institute of Museum and Library Services • • 1800 M Street NW, 9th Floor • • Washington, DC 20036 • • www.imls.gov
The State of Small and Rural Libraries in the United States
Small Public Libraries Rural Public Libraries
Service area less than 25,000 Rural, Fringe
Rural, Distant
Rural, Remote
Service area less than 10,000
Service area less than 2,500
Figure 2: Distribution of Small and Rural Libraries in the United States
Note: Hawaii had no rural or small public libraries Source: Public Library Survey (PLS), FY 2008 – 2011, Institute of Museum and Library Services.

Page 4 of 13
Institute of Museum and Library Services • • 1800 M Street NW, 9th Floor • • Washington, DC 20036 • • www.imls.gov
The State of Small and Rural Libraries in the United States
State # Public Libraries
Rural*
% Rural Libraries
Small**
% Small LibrariesFringe Distant Remote
10K to 25K
2.5K to 10K
up to 2.5K
AK - Alaska 72 2 3 55 83.3% 3 16 48 93.1%
AL - Alabama 212 17 66 30 53.3% 55 73 44 81.1%
AR - Arkansas 55 - 13 6 34.5% 11 6 4 38.2%
AZ - Arizona 90 9 10 20 43.3% 12 28 21 67.8%
CA - California 182 5 6 7 9.9% 23 4 4 17.0%
CO - Colorado 114 2 12 47 53.5% 20 37 30 76.3%
CT - Connecticut 183 47 16 - 34.4% 65 62 19 79.8%
DC - District of Columbia 1 - - - - - - - -
DE - Delaware 21 3 2 - 23.8% 8 5 - 61.9%
FL - Florida 77 6 6 15.6% 12 4 1 22.1%
GA - Georgia 61 5 11 2 29.5% 6 - - 9.8%
HI - Hawaii 1 - - - - - - - -
IA - Iowa 531 15 229 170 78.0% 39 127 340 95.3%
ID - Idaho 101 6 21 34 60.4% 13 33 40 85.1%
IL - Illinois 621 33 170 33 38.0% 127 201 183 82.3%
IN - Indiana 238 9 85 7 42.4% 49 82 52 76.9%
KS - Kansas 311 8 63 162 74.9% 19 63 215 95.5%
KY - Kentucky 118 2 24 23 41.5% 58 16 1 63.6%
LA - Louisiana 68 5 15 8 41.2% 23 5 2 44.1%
MA - Massachusets 359 59 40 - 27.6% 109 116 64 80.5%
MD - Maryland 24 1 5 - 25.0% 1 - - 4.2%
ME - Maine 214 16 85 56 73.4% 22 100 89 98.6%
MI - Michigan 389 28 103 59 48.8% 88 178 32 76.6%
MN - Minnesota 138 4 26 47 55.8% 19 46 45 79.7%
MO - Missouri 147 2 19 46 45.6% 31 48 31 74.8%
MS - Mississippi 50 2 8 11 42.0% 7 6 26.0%
MT - Montana 81 - 7 50 70.4% 11 35 27 90.1%
NC - North Carolina 77 4 21 3 36.4% 6 3 - 11.7%
ND - North Dakota 76 - 3 59 81.6% 7 11 51 90.8%
NE - Nebraska 216 3 34 129 76.9% 8 32 168 96.3%
NH - New Hampshire 221 41 91 32 74.2% 17 92 109 98.6%
NJ - New Jersey 281 9 1 - 3.6% 94 100 10 72.6%
NM - New Mexico 82 4 11 21 43.9% 12 27 32 86.6%
NV - Nevada 22 1 1 9 50.0% 2 6 4 54.5%
NY - New York 756 69 211 51 43.8% 145 274 216 84.0%
Table 1: Small and Rural Public Libraries by State

Page 5 of 13
Institute of Museum and Library Services • • 1800 M Street NW, 9th Floor • • Washington, DC 20036 • • www.imls.gov
The State of Small and Rural Libraries in the United States
State # Public Libraries
Rural*
% Rural Libraries
Small**
% Small LibrariesFringe Distant Remote
10K to 25K
2.5K to 10K
up to 2.5K
OH - Ohio 251 11 68 1 31.9% 66 75 11 60.6%
OK - Oklahoma 117 5 18 32 47.0% 18 41 45 88.9%
OR - Oregon 126 4 18 27 38.9% 28 36 32 76.2%
PA - Pennsylvania 456 22 60 12 20.6% 141 154 37 72.8%
RI - Rhode Island 48 8 2 - 20.8% 22 16 1 81.3%
SC - South Carolina 42 1 12 - 31.0% 5 - - 11.9%
SD - South Dakota 103 4 11 66 78.6% 8 22 68 95.1%
TN - Tennessee 185 17 51 20 47.6% 53 50 25 69.2%
TX - Texas 553 38 70 83 34.5% 113 218 82 74.7%
UT - Utah 72 5 8 19 44.4% 15 25 12 72.2%
VA - Virginia 91 7 25 8 44.0% 20 7 2 31.9%
VT - Vermont 159 17 71 38 79.2% 9 47 101 98.7%
WA - Washington 61 3 13 11 44.3% 12 10 15 60.7%
WI - Wisconsin 382 15 123 88 59.2% 73 164 97 87.4%
WV - West Virginia 97 6 29 19 55.7% 27 46 5 80.4%
WY - Wyoming 23 - - 12 52.2% 8 6 1 65.2%
Total (U.S.) 8,956 580 1,997 1,613 46.8% 1,740 2,753 2,416 77.1%
6.5% 22.3% 18.0% 19.4% 30.7% 27.0%
* Rural designation is based upon the urban-centric locale codes used in the Common Core of Data.** Small designation is based on the size of the unduplicated service population.
centage of rural libraries in a state may be a reflection of
population density, but it may also reflect library legisla-
tion or administrative structure (single- versus multi-outlet
libraries).
States varied in the proportion of rural libraries, from
3.6% to 83.3% of public libraries. In 10 states, rural
libraries comprised 70% or more of the public libraries
(Table 1). Alaska (83.3%) and North Dakota (81.6%)
had the highest percentage of libraries in a rural area. In
three states – New Jersey (3.6%), California (9.9%), and
Florida (15.6%)4 – fewer than 20% of libraries were in a
rural area.
Table 2 provides a detailed breakdown of the percent-
4 Neither Hawaii nor the District of Columbia had any public libraries that were classified as either rural or small.
age of libraries that fall within these small and rural library
categories. Overall there were 4,109 public libraries in
rural areas of the U.S.5 in FY2011. The vast majority of
these libraries fall into the subcategories of rural-distant
(47.7%) or rural-remote (38.5%), and over half of ru-
ral public libraries serve populations of less than 2,500
people. As might be expected, the overwhelming major-
ity of city libraries serve populations in excess of 25,000
people. Indeed, the median service population for city
libraries is 99,743, compared to the median service popu-
lation for rural libraries, which is 2,244.
It is important to note that there is not a direct rela-
tionship between the number of libraries found in each
5 For the purpose of this brief, “in the U.S.” refers to the 50 states and the District of Columbia.
Table 1: Small and Rural Public Libraries by State (continued)

Page 6 of 13
Institute of Museum and Library Services • • 1800 M Street NW, 9th Floor • • Washington, DC 20036 • • www.imls.gov
The State of Small and Rural Libraries in the United States
category and the size of the population served. Overall, ru-
ral libraries in the U.S. target a population6 of 37,030,458
people for library services, which amounts to just over
12% of the target library service population in the United
States. In contrast, city libraries, which are far fewer in
number, target a service population of over 104 million
people (34.9% of the U.S. population).
Services in Rural Public LibrariesIn FY2011, there were 167.6 million recorded visits to
rural public libraries. Median visitation to rural public
libraries was 11,282. Average visitation per capita at rural
public libraries was 6.7 visits per year; the average visita-
tion per capita at rural remote libraries was 7.6 visits per
year. Although visitation to rural public libraries decreased
by 3.9% from FY2010, it has increased by 4.2% over the
past three years. In contrast, there were 519.1 million
visits to city public libraries in FY2011. For comparative
purposes, the average visitation per capita at city public
libraries was 5.7. Visitation has declined by 1.7% in city
libraries over the past three years.
Across all rural public libraries, 241.9 million materials
were circulated to the public. Although overall circulation
decreased by 5.9% from FY2010, there was a three-year
increase of 4.4%. Median circulation in rural libraries was
15,847. The highest levels of circulation were in rural-
fringe libraries, with a median circulation of 41,408. The
average circulation per capita for rural libraries was 8.7.
Service hours have remained fairly stable for rural
libraries for the past 3 years. Rural libraries in the U.S.
were open for a total of 10.6 million service hours across
all outlets, resulting in an average of 33.5 hours per outlet
6 All population references are based upon unduplicated service area population estimates.
Table 2: Distribution of Public Libraries by Population Service Size Category, FY 2011
Medium to Large Small (10 to 25K)
Small (2.5 to 10 K)
Small (< 2.5K)
% Libraries # Libraries
City 94.6% 3.7% 1.4% 0.2% 5.4% 483
Suburb 39.3% 35.8% 22.7% 2.2% 23.0% 2,058
Town 21.6% 30.9% 43.1% 4.4% 24.8% 2,225
Rural 7.2% 7.1% 31.5% 54.2% 46.8% 4,190
each week. In contrast, city libraries were open for an
average of 42.7 hours each week, which was a three-year
decrease of 7.2%.
Revenue in Rural Public LibrariesRevenue has fallen for most public libraries since the re-
cession. Rural libraries had $1.09 billion in total revenue
in FY2011, a one-year decrease of 3.4%. The median
revenue for rural libraries overall was $69,215. However,
there was wide variability across rural libraries, ranging
from $0 to $20.4 million, and there is a significant rela-
tionship between the size of a library’s service area popula-
tion and revenue (r = 0.84), with eight rural libraries serv-
ing populations in excess of 250,000 people. In FY2011,
more than 90% of the rural libraries had revenue of less
than $500,000. Median revenue for rural-fringe libraries
was $174,970; for rural-remote libraries, median revenue
was $53,235. Most public library revenue typically comes
from local government sources. In FY2011, rural libraries
received 80.2% of total revenue from local government
sources and 10.3% from state government, a three-year
increase of 4.5% in local revenue and decrease of 20.4%
in state revenue. In contrast to rural libraries, urban librar-
ies had $4.29 billion in revenue in FY2011. Whereas
revenue for city libraries began to decline in FY2008, rural
library revenues did not decline until FY2009.
One measure of capacity for public libraries is revenue
per capita, a ratio of the total revenue to the number
of people in the legal service area. In other words, the
amount of revenue the library has available to serve each
person. Across all rural libraries, revenue per capita was
$29.44, a three-year decrease of 3.3% (Figure 3). In com-
parison, revenue per capita for city libraries was $40.06,
a three-year decrease of 6.1%. The median revenue per
capita was $32.10 for rural libraries; for city libraries, it

Page 7 of 13
Institute of Museum and Library Services • • 1800 M Street NW, 9th Floor • • Washington, DC 20036 • • www.imls.gov
The State of Small and Rural Libraries in the United StatesRe
venu
e pe
r ca
pita
was $36.62. Although city areas have more money for
each person, they have experienced a more dramatic
decrease in funds over the past three years.
Figure 3. Revenue per Capita in Rural Libraries, FY2008-2011
Fiscal Year
Source: Public Library Survey (PLS), FY 2008 – 2011, Institute of Museum and Library Services.
Electronic Resources in Rural Public LibrariesRural areas have less access to broadband services than
urban areas, and proximity to an urban area is a greater
factor in access than population density. In order to miti-
gate this disparity in access, rural libraries have made
additional efforts to increase their electronic resources.
There were 49,048 publicly accessible computer termi-
nals in rural libraries in FY2011, a three-year increase
of 20.2%. The median number of terminals in rural
libraries was six. These terminals were used over 41.3
million times, a three-year increase of 6.7%. In contrast,
the use of publicly accessible computer terminals in
city libraries has decreased by 9.5% over the past three
years. This trend in city libraries may not reflect the
need for digital resources in public libraries, but rather
locale differences in how patrons use technology in
public libraries.7
Rural libraries had 10.3 million e-books available
to the public in FY2011. Of the 1,475 rural libraries
7 The usage of mobile devices in libraries has increased since 2009. See the Rainie et al. (2012) and Bertot et al. (2010).
(35.2%) that include e-books in their collections, the
median number of e-books was 2,578 per library.
Staffing at Rural Public LibrariesA particular challenge for rural libraries is staffing. Rural
libraries have difficulty finding and retaining academical-
ly trained staff (Hildreth, 2007). In light of the economic
recession and accompanying unemployment, it has been
important to look at the public library workforce.
Nationally, the public library workforce has shown a
decrease since FY2008 (Swan, et al., 2013). Overall,
staffing levels have decreased in rural libraries over the
past three years, but not by as much as that experienced
by city libraries. Rural libraries provided 17,090 full-time
equivalent (FTE) jobs, 7,412 of which were positions
for librarians (FTE). Rural libraries accounted for 12.4%
of employment across all libraries in the U.S., 15.9%
of all librarian positions in public libraries. One-third of
rural librarians (FTEs) held a Master’s of Library Sci-
ence (MLS) from a program accredited by the American
Library Association (ALA). The number of ALA-MLS li-
brarians in rural libraries has increased by 2.6% over the
past three years. In contrast, ALA-MLS librarians have
decreased by 7.8% in urban libraries during the same
time period. The median number of librarians (FTE) per
library was 1.0. Many public libraries in rural-distant and
rural-remote areas did not have librarians who worked
a full-time schedule (i.e., 40 hour week). Median total
staff at rural libraries was 1.5. In contrast, urban librar-
ians had a median of 44.7 staff, 14.0 of whom held the
position title of librarian. Total staff in urban libraries has
decreased by 8.9% over the past three years.
Small Libraries in the United StatesThere were 6,909 public libraries (77.1%) in the U.S.
that had a legal service area population of less than
25,000 in FY2011. Most small libraries (74.8%) had a
service population of less than 10,000. Overall, small
libraries served a population of 46.0 million people,
15.4% of the total population served by public librar-
ies. Most small public libraries were in towns (25.3%)
or rural areas (56.3%). Perhaps not surprisingly, very
few small public libraries are in cities (0.4%), as shown
in Table 3.
Page 8 of 13
Institute of Museum and Library Services • • 1800 M Street NW, 9th Floor • • Washington, DC 20036 • • www.imls.gov
The State of Small and Rural Libraries in the United States
Reve
nue
per
capi
ta
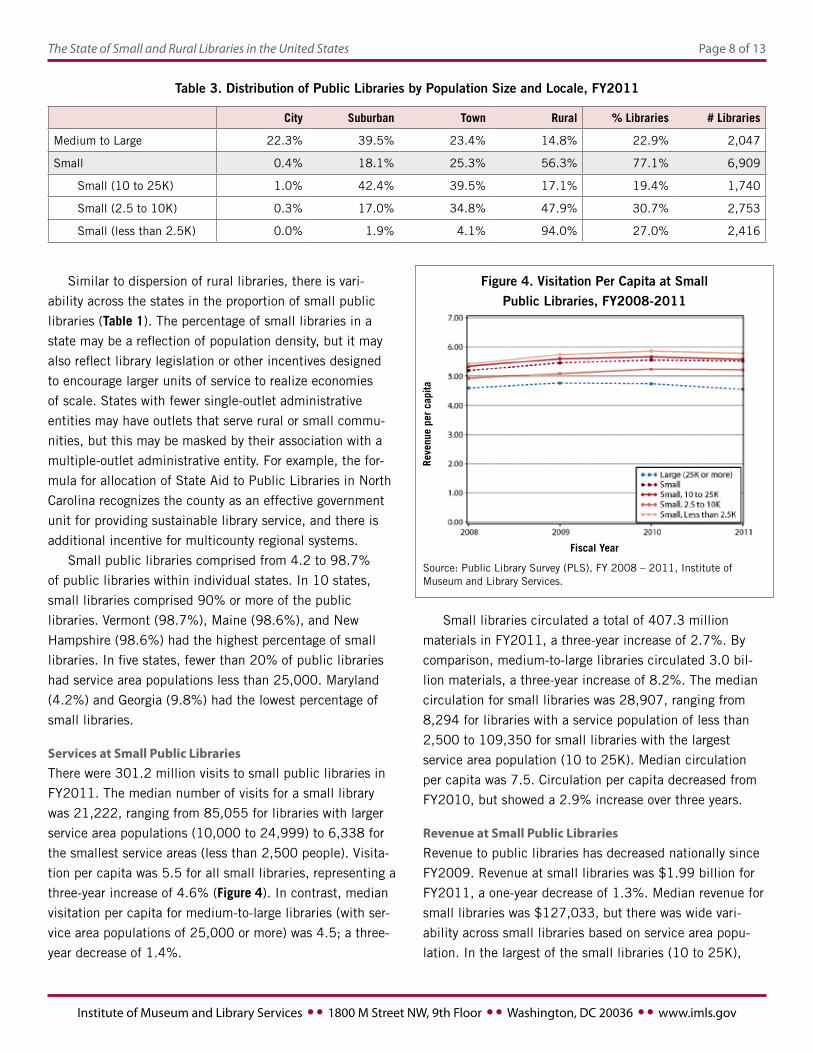
Table 3. Distribution of Public Libraries by Population Size and Locale, FY2011
City Suburban Town Rural % Libraries # Libraries
Medium to Large 22.3% 39.5% 23.4% 14.8% 22.9% 2,047
Small 0.4% 18.1% 25.3% 56.3% 77.1% 6,909
Small (10 to 25K) 1.0% 42.4% 39.5% 17.1% 19.4% 1,740
Small (2.5 to 10K) 0.3% 17.0% 34.8% 47.9% 30.7% 2,753
Small (less than 2.5K) 0.0% 1.9% 4.1% 94.0% 27.0% 2,416
Figure 4. Visitation Per Capita at Small Public Libraries, FY2008-2011
Fiscal Year
Source: Public Library Survey (PLS), FY 2008 – 2011, Institute of Museum and Library Services.
Small libraries circulated a total of 407.3 million
materials in FY2011, a three-year increase of 2.7%. By
comparison, medium-to-large libraries circulated 3.0 bil-
lion materials, a three-year increase of 8.2%. The median
circulation for small libraries was 28,907, ranging from
8,294 for libraries with a service population of less than
2,500 to 109,350 for small libraries with the largest
service area population (10 to 25K). Median circulation
per capita was 7.5. Circulation per capita decreased from
FY2010, but showed a 2.9% increase over three years.
Revenue at Small Public LibrariesRevenue to public libraries has decreased nationally since
FY2009. Revenue at small libraries was $1.99 billion for
FY2011, a one-year decrease of 1.3%. Median revenue for
small libraries was $127,033, but there was wide vari-
ability across small libraries based on service area popu-
lation. In the largest of the small libraries (10 to 25K),
Similar to dispersion of rural libraries, there is vari-
ability across the states in the proportion of small public
libraries (Table 1). The percentage of small libraries in a
state may be a reflection of population density, but it may
also reflect library legislation or other incentives designed
to encourage larger units of service to realize economies
of scale. States with fewer single-outlet administrative
entities may have outlets that serve rural or small commu-
nities, but this may be masked by their association with a
multiple-outlet administrative entity. For example, the for-
mula for allocation of State Aid to Public Libraries in North
Carolina recognizes the county as an effective government
unit for providing sustainable library service, and there is
additional incentive for multicounty regional systems.
Small public libraries comprised from 4.2 to 98.7%
of public libraries within individual states. In 10 states,
small libraries comprised 90% or more of the public
libraries. Vermont (98.7%), Maine (98.6%), and New
Hampshire (98.6%) had the highest percentage of small
libraries. In five states, fewer than 20% of public libraries
had service area populations less than 25,000. Maryland
(4.2%) and Georgia (9.8%) had the lowest percentage of
small libraries.
Services at Small Public LibrariesThere were 301.2 million visits to small public libraries in
FY2011. The median number of visits for a small library
was 21,222, ranging from 85,055 for libraries with larger
service area populations (10,000 to 24,999) to 6,338 for
the smallest service areas (less than 2,500 people). Visita-
tion per capita was 5.5 for all small libraries, representing a
three-year increase of 4.6% (Figure 4). In contrast, median
visitation per capita for medium-to-large libraries (with ser-
vice area populations of 25,000 or more) was 4.5; a three-
year decrease of 1.4%.
Page 9 of 13
Institute of Museum and Library Services • • 1800 M Street NW, 9th Floor • • Washington, DC 20036 • • www.imls.gov
The State of Small and Rural Libraries in the United States
median revenue was $511,204; in the smallest (less than
2.5K), median revenue was $41,287. Revenue per capita
for small libraries was $34.63, with a range from $32.11
(service population 2,500 to 9,999) to $37.03 (service
population less than 2,500).
Electronic Resources at Small Public LibrariesThere were 71,366 publicly accessible computers at small
libraries across the U.S., a three-year increase of 18.1%.
The median number of computers for small libraries was
seven; the number of computers at small libraries ranged
from 0 to 117. In contrast, there were 190,047 comput-
ers at libraries with service area populations of 25,000 or
more. There were 63.4 million uses of public-access com-
puters at small libraries in FY2011, a one-year decrease
of 3.3%. In contrast, uses of public-access computers at
large libraries (over 25,000) decreased by 8.0%. This may
be because of the decrease in visitation or because of the
ubiquity of mobile devices as a platform for library patrons
to access library resources.
Small libraries had 21.1 million e-books available to
the public, 60.2% of all e-book holdings across the U.S.
Small libraries have increased their e-books by 194.3%
over three years. Of the 2,933 small libraries (42.4%) that
had e-books in their collections, the median number of e-
books was 2929.
Staffing at Small Public LibrariesMaintaining the workforce at small public libraries can
be particularly difficult. In many small libraries, the total
staff can be one person who works less than 40 hours each
week. Unlike in some library systems where, during times
of budget cuts, positions can be eliminated for a cost sav-
ings, small libraries cannot sacrifice their human resources.
Small libraries in the U.S. provided 29,329 full-time
equivalent (FTE) positions, 21.4% of all FTEs offered by
public libraries in FY2011. Like many sectors, staffing at
public libraries has decreased since the recession. How-
ever, small libraries experienced a three-year decrease of
1.2%, compared to the decrease of 6.6% by their larger
peers (libraries with service populations greater than
25,000). Librarians comprised 13,604 of the total FTEs,
40.7% of whom held an ALA-MLS degree.
The total paid staff is an indicator that is closely tied to
size. The median number of total staff (FTEs) was 2.5, with
1.0 librarian positions. More telling of the heterogeneity of
small libraries is the variation across the different popula-
tion levels: median staffing levels from 7.9 FTEs in the
larger small libraries to 0.9 in the smallest. Thus, in some
of the smallest public libraries, one person is entrusted
with duties as diverse as cataloging, program administra-
tion, and outreach.
ConclusionsOne of the surprising findings in this review is the sheer
number of public libraries that can be classified as either
small or rural. Their broad distribution across the country
speaks volumes about the value local communities place
on library services. Despite fiscal challenges and rapid
technological changes, services in small and rural public
libraries continue to evolve to serve the unique needs of
their communities. The fact that service utilization con-
tinues to increase at these libraries at a time when other
libraries are experiencing declines on a per capita basis
is a further testament to their resilience and continued
relevance to rural life.
This increase in use of small and rural libraries may
be due the fact that other services in rural communities
are contracting as a result financial challenges. Small and
rural libraries, which are present in so many communi-
ties, serve a strategic role in extending public services
to residents that may be hard to reach by other means.
Many small and rural libraries are accustomed to linking
what might be considered traditional library services with
a variety of other social, educational and economic devel-
opment programs. Other agencies are seeing the value of
their roles as well. For example, the U.S. Postal Service
has used Public Library Survey data to identify library loca-
tions in communities where post offices were likely to see
reduced hours. This analysis identified as many as 2,450
libraries in the affected areas that could provide services
through the new Village Post Office program.8
In addition to broadening service options in rural com-
munities, rural libraries have made significant investments
in connectivity and digital technology. In comparison to
8 For more on the Village Post Office, see the IMLS Blog at http://blog.imls.gov/?p=1705 and Library Journal at http://lj.libraryjournal.com/ 2012/08/library-services/libraries-could-double-as-post-offices.

Page 10 of 13
Institute of Museum and Library Services • • 1800 M Street NW, 9th Floor • • Washington, DC 20036 • • www.imls.gov
The State of Small and Rural Libraries in the United States
urban public libraries, rural libraries have outpaced them
in building infrastructure and resources, with higher levels
of publicly accessible Internet computers and e-books. In
conjunction with the disparity of broadband access in rural
communities, this further emphasizes the strong role pub-
lic libraries play in providing access to the critical digital
resources that are directly related to 21st-century skills.
ReferencesAmerican Library Association Allied Professional Association. (2007). ALA-APA rural library staff salary survey. Retrieved from www.ala-apa.org/salaries/RuralLibrarySalarySurvey.pdf
Bertot, J.C., McDermott, A., Lincoln, R., Real, B., & Peterson, K. (2012). 2011-2012 Public Library Funding & Technology Access Survey: Survey Findings & Report. College Park, MD: Informa-tion Policy & Access Center, University of Maryland College Park. www.plinternetsurvey.org
Borman, G. S. (2009). Rural U.S. Libraries: Serving Populations and Meeting Challenges. Library Student Journal, 4(0). Retrieved from www.librarystudentjournal.org/index.php/lsj/article/view/117
Calhoun, K (2008, June 17), Hello, and On Small Libraries, Metalogue. Retrieved from http://community.oclc.org/metalogue/archives/2008/06/hello-and-on-small-libraries.html
Cromrtie, J. & Bucholtz, S (2008). Defining the “Rural” in Rural America. Amber Waves, 6(3).
Deavers, K. (1992). What is Rural? Policy Studies Journal, 20(2), 184–189. doi:10.1111/j.1541-0072.1992.tb00146.x
DeGruyter, L. (1980). The History and Development of Rural Public Libraries. Library Trends, 28(4), 513–523.
Fahrenthold, D. (2013, June 08). What does rural mean? Uncle Sam has more than a dozen answers. Washington Post. Retrieved from www.washingtonpost.com/politics/what-does-rural-mean-un-cle-sam-has-more-than-a-dozen-answers/2013/06/08/377469e8-ca26-11e2-9c79-a0917ed76189_story.html
Heurtz, L, Gordon, A., Gordon, M., & Moore, E., (2003). The Impact of Public Access Computing on Rural and Small Town Libraries. Rural Libraries, 1.
Hildreth, S. (2007). Rural Libraries: The Heart of Our Commu-nity, Public Libraries, 46, 7-11.
Hobbs, Daryl J. and Vicki M. Hobbs. (n.d.) Rural America: Assessing the Extent of and Demand for Telecommunications Infrastructure in Rural America. Organization for the Promotion and Advancement of Small Telecommunications Companies. Retrieved 30 April 2007. www.opastco.org/docs/Whitep2a.pdf
Ivie, T. (2009). Defining “Rural” for Rural Library Research. The Idaho Librarian, 59(1).
Majekodunmi, A. (2012) Examining the Role of Rural Commu-nity Libraries: Social Connectedness and Adult Learning
Olszewski, L., Van Orden, R., & Dalrymple, T. (2007, May 2) Small and Rural Libraries Discussion Paper. from www.webjunc-tion.org/documents/webjunction/Small_and_Rural_Libraries_ Discussion_Paper.html
Raine, L., Zickuhr, K., & Duggan, M. (2012). Mobile Connec-tions to Libraries. Pew Research Center: Washington, DC. http://libraries.pewinternet.org/2012/12/31/mobile-connections-to-libraries
Strouse, R., Henry, H., Brown, S., & Outsell, Inc. (2008). 2008 library market size, share & forecast report. Burlingame, CA: Outsell.
Swan, D.W., Grimes, J., Owens, T., Vese, J., R.D., Miller, K., Arroyo, J., Craig, T., Dorinski, S., Freeman, M., Isaac, N., O’Shea, P., Shilling, P., Scotto, J. (2013). Public Libraries Survey: Fiscal Year 2010 (IMLS-2013-PLS-01). Institute of Museum and Library Services: Washington, DC.
About the Institute of Museum and Library ServicesThe Institute of Museum and Library Services is the primary source of federal support for the nation’s 123,000 libraries and 17,500 museums. Our mission is to inspire libraries and muse-ums to advance innovation, lifelong learning, and cultural and civic engagement. Our grant making, policy development, and research help libraries and museums deliver valuable services that make it possible for communities and individuals to thrive. To learn more, visit www.imls.gov.
Office of Planning, Research, and EvaluationDirector, Carlos Manjarrez
Suggested CitationSwan, D.W., Grimes, J. & Owens, T. (2013). The State of Small and Rural Libraries in the United States. Research Brief series, no. 5 (IMLS-2013-RB-05). Washington, DC: Institute of Mu-seum and Library Services.
Public Libraries SurveyThe Public Libraries Survey (PLS) is a national census of public library systems. It is conducted annually by the Institute of Mu-seum and Library Services in partnership with the U.S. Census Bureau, State Library Administrative Agencies, and the Library Statistics Working Group. Its data elements cover library service measures of public library services, resources, and funding. The PLS is designed as a universe survey; its survey frame consists of 9,217 public libraries in the 50 states, the District of Columbia and selected US territories.

Page 11 of 13
Institute of Museum and Library Services • • 1800 M Street NW, 9th Floor • • Washington, DC 20036 • • www.imls.gov
The State of Small and Rural Libraries in the United States
Appendix: Table A. Descriptive Statistics for Rural Public Libraries
Average Median Minimum MaximumServicesVisitation
Rural 39,992 11,282 21 3,283,898Rural Fringe 72,777 25,693 257 1,881,264Rural Distant 43,677 11,180 21 3,283,898Rural Remote 23,640 8,580 160 1,135,265
Visitation, per capitaRural 6.7 5.0 0.0 211.2
Rural Fringe 6.5 4.9 0.1 62.7Rural Distant 6.0 4.6 0.0 98.5Rural Remote 7.6 5.6 0.1 211.2
CirculationRural 57,730 15,847 48 4,437,942
Rural Fringe 115,855 41,408 171 2,778,783Rural Distant 62,433 16,310 48 4,437,942Rural Remote 31,007 11,311 104 2,045,346
Circulation, per capitaRural 8.7 6.9 0.0 144.4
Rural Fringe 9.7 7.7 0.1 94.9Rural Distant 8.0 6.4 0.1 75.4Rural Remote 9.3 7.3 0.0 144.4
RevenueRevenue
Rural $260,196 $69,215 $0 $20,373,817 Rural Fringe $505,763 $174,970 $5,300 $8,753,016 Rural Distant $277,091 $69,522 $1,000 $20,373,817 Rural Remote $150,979 $53,235 $0 $10,714,390
Revenue, per capitaRural $42.40 $32.10 $0.00 $1,186.29
Rural Fringe $44.94 $32.88 $0.65 $680.21 Rural Distant $37.22 $30.02 $0.28 $561.94 Rural Remote $47.89 $34.77 $0.00 $1,186.29
Electronic ResourcesPC Terminals
Rural 12 6 0 402Rural Fringe 16 8 0 402Rural Distant 12 6 0 355Rural Remote 9 6 0 280
PC Uses (per 1,000 Visits)Rural 9,855 2,813 0 650,641
Rural Fringe 15,811 4,241 0 650,641Rural Distant 11,098 2,811 0 628,309Rural Remote 6,173 2,436 0 463,965
E-BooksRural 2,463 0 0 93,829
Rural Fringe 2,994 7 0 52,024Rural Distant 2,735 0 0 91,317Rural Remote 1,935 0 0 93,829
StaffingLibrarians
Rural 1.8 1.0 0 91Rural Fringe 2.9 1.4 0 50Rural Distant 1.8 0.9 0 91Rural Remote 1.3 0.8 0 29

Page 12 of 13
Institute of Museum and Library Services • • 1800 M Street NW, 9th Floor • • Washington, DC 20036 • • www.imls.gov
The State of Small and Rural Libraries in the United States
Average Median Minimum MaximumTotal Staff
Rural 4.1 1.5 0.0 249.8Rural Fringe 7.3 3.0 0.1 196.8Rural Distant 4.4 1.5 0.0 249.8Rural Remote 2.4 1.1 0.1 87.9
Programs Programs (total)
Rural 151 57 0 10,077Rural Fringe 274 155 0 10,077Rural Distant 161 61 0 8,236Rural Remote 93 36 0 3,276
Children’s ProgramsRural 95 37 0 5,873
Rural Fringe 162 92 0 1,996Rural Distant 103 40 0 5,873Rural Remote 62 23 0 2,303
Program Attendance (total)Rural 21.4 15.9 0.0 1,867.0
Rural Fringe 19.6 16.7 0.0 96.4Rural Distant 21.5 16.0 0.0 351.0Rural Remote 21.9 15.5 0.0 1,867.0
Appendix: Table A. Descriptive Statistics for Rural Public Libraries (continued)
Average Median Minimum MaximumServicesVisitation
Small 43,599 21,222 0 860,964Small (10 to 25K) 101,595 85,055 443 860,964Small (2.5 to 10K) 37,396 26,294 173 747,448Small (Less than 2.5K) 8,898 6,338 0 135,660
Visitation, per capitaSmall 7.1 5.5 0.0 211.2
Small (10 to 25K) 6.4 5.6 0.0 44.9Small (2.5 to 10K) 6.8 5.2 0.1 107.1Small (Less than 2.5K) 8.0 5.8 0.0 211.2
CirculationSmall 58,943 28,907 48 1,260,950
Small (10 to 25K) 140,716 109,350 832 1,260,950Small (2.5 to 10K) 48,715 36,631 100 772,023Small (Less than 2.5K) 11,704 8,294 48 171,405
Circulation, per capitaSmall 9.2 7.5 0.0 144.4
Small (10 to 25K) 8.8 7.4 0.0 52.0Small (2.5 to 10K) 8.9 7.3 0.0 109.7Small (Less than 2.5K) 10.0 7.7 0.1 144.4
RevenueRevenue
Small $288,255 $127,033 $0 $6,021,810 Small (10 to 25K) $705,991 $511,204 $5,000 $6,021,810 Small (2.5 to 10K) $227,141 $157,675 $0 $3,897,450 Small (Less than 2.5K) $57,041 $41,287 $719 $2,742,918
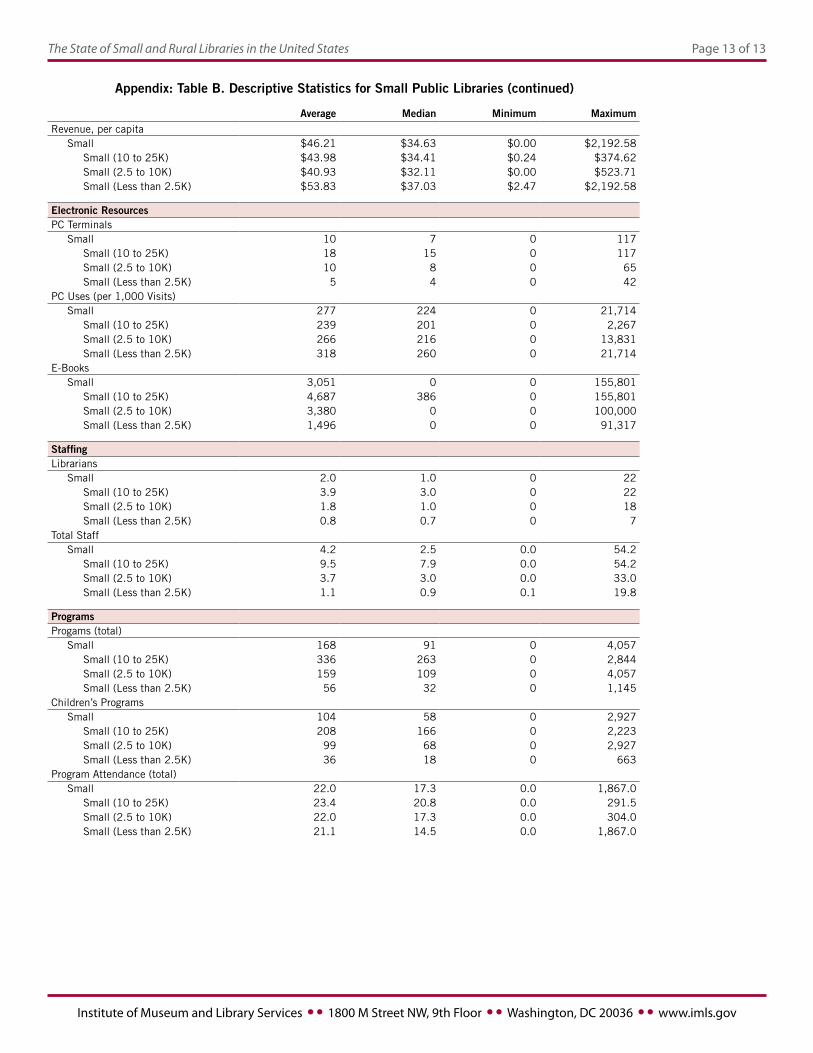
Appendix: Table B. Descriptive Statistics for Small Public Libraries
Page 13 of 13
Institute of Museum and Library Services • • 1800 M Street NW, 9th Floor • • Washington, DC 20036 • • www.imls.gov
The State of Small and Rural Libraries in the United States
Average Median Minimum MaximumRevenue, per capita
Small $46.21 $34.63 $0.00 $2,192.58 Small (10 to 25K) $43.98 $34.41 $0.24 $374.62 Small (2.5 to 10K) $40.93 $32.11 $0.00 $523.71 Small (Less than 2.5K) $53.83 $37.03 $2.47 $2,192.58
Electronic ResourcesPC Terminals
Small 10 7 0 117Small (10 to 25K) 18 15 0 117Small (2.5 to 10K) 10 8 0 65Small (Less than 2.5K) 5 4 0 42
PC Uses (per 1,000 Visits)Small 277 224 0 21,714
Small (10 to 25K) 239 201 0 2,267Small (2.5 to 10K) 266 216 0 13,831Small (Less than 2.5K) 318 260 0 21,714
E-BooksSmall 3,051 0 0 155,801
Small (10 to 25K) 4,687 386 0 155,801Small (2.5 to 10K) 3,380 0 0 100,000Small (Less than 2.5K) 1,496 0 0 91,317
StaffingLibrarians
Small 2.0 1.0 0 22Small (10 to 25K) 3.9 3.0 0 22Small (2.5 to 10K) 1.8 1.0 0 18Small (Less than 2.5K) 0.8 0.7 0 7
Total StaffSmall 4.2 2.5 0.0 54.2
Small (10 to 25K) 9.5 7.9 0.0 54.2Small (2.5 to 10K) 3.7 3.0 0.0 33.0Small (Less than 2.5K) 1.1 0.9 0.1 19.8
Programs Progams (total)
Small 168 91 0 4,057Small (10 to 25K) 336 263 0 2,844Small (2.5 to 10K) 159 109 0 4,057Small (Less than 2.5K) 56 32 0 1,145
Children’s ProgramsSmall 104 58 0 2,927
Small (10 to 25K) 208 166 0 2,223Small (2.5 to 10K) 99 68 0 2,927Small (Less than 2.5K) 36 18 0 663
Program Attendance (total)Small 22.0 17.3 0.0 1,867.0
Small (10 to 25K) 23.4 20.8 0.0 291.5Small (2.5 to 10K) 22.0 17.3 0.0 304.0Small (Less than 2.5K) 21.1 14.5 0.0 1,867.0
Appendix: Table B. Descriptive Statistics for Small Public Libraries (continued)