the state of mental health in the european...
TRANSCRIPT

EUROPEAN COMMISSION
The State of Mental Healthin the European Union


The State of Mental Health
in the European Union
EUROPEAN COMMISSION

Neither the European Commission nor any person acting on its behalf is responsible for any use that might be made of the following information. The information contained in this publication does not necessarily reflect the opinion or the position of the European Commission. Reproduction is authorised, except for commercial purposes, provided the source is acknowledged
Europe Direct is a service to help you find answers
to your questions about the European Union
New freephone number:
00 800 6 7 8 9 10 11
A great deal of additional information on the European Union is available on the Internet. It can be accessed through the Europa server (http://europa.eu.int). ISBN 92-894-8320-2 © European Communities, 2004 Photo cover page: © European Communities, reproduction authorised until 2012, provided the source is acknowledged. Printed by the services of the European Commission

ContentsList of contributors 5
Executive summary 6
1 Introduction 81.1 Mental health and mental illness 81.2 Burden of mental illness 91.3 Why publish a European report on mental health? 10
2 Comparing mental health in Europe 122.1 Context of mental health in Europe 122.2 Methodology for comparing mental health in Europe 15
3 Mental health status in Europe 203.1 Positive mental health 203.2 Negative mental health: psychological distress 20
and psychiatric disorders3.3 Suicide 253.4 Alcohol, tobacco and drug related problems 28
4 Protective and risk factors 344.1 Gender and mental health 344.2 Age and mental health 384.3 Marital status 434.4 Social factors - poverty, unemployment and deprivation 444.5 Rural-urban differences in mental health 484.6 Migration and mental health 51
5 Responses to mental health problems across Europe 545.1 General description 545.2 Psychiatric inpatient care 545.3 Community services, facilities and support 565.4 Mental health in primary health care 565.5 Staffing issues 575.6 Patient and family involvement 585.7 Use of psychotropic drugs 595.8 Survey results: Seeking help for mental health problems 61
6 Conclusions and recommendations 646.1 Summary of findings 646.2 Conclusions 666.3 Recommendations 66
Annex I Details of studies used in survey of surveysReferences
1
T H E S T A T E O F M E N T A L H E A L T H I N T H E E U R O P E A N U N I O N

2
T H E S T A T E O F M E N T A L H E A L T H I N T H E E U R O P E A N U N I O N
FiguresFigure 1 Determinants of mental health 11Figure 2 Population density in the EU and Norway 12Figure 3 Urban population in the EU and Norway 12Figure 4 Population aged over 65 in the EU and Norway 13Figure 5 Gross domestic product, unemployment and percentage of population at risk of poverty 14Figure 6 Health expenditure in EU countries and Norway 14Figure 7 Positive mental health in ten EU countries 20Figure 8 Psychological distress in ten EU countries 22Figure 9 Psychological Distress in seven EU countries (6 ESEMeD, plus UK) 22Figure 10 Any mental disorder in the last 12 months in six EU countries 23Figure 11 Any mood disorder in the last 12 months in six EU countries 23Figure 12 Anxiety disorders in the last 12 months in six EU countries 23Figure 13 Total suicide mortality rates across Europe, 1997 25Figure 14 Male deaths from suicide, events of undetermined intent and unknown and unspecified causes 25Figure 15 Female deaths from suicide, events of undetermined intent and unknown and
unspecified causes 25Figure 16 Trends in male suicide by country 26Figure 17 Trends in female suicide by country 26Figure 18 Suicide and old age in males across Europe 27Figure 19 Suicide and old age in females across Europe 27Figure 20 Suicides in young people across Europe 27Figure 21 Suicide, risk of poverty and unemployment 27Figure 22 Alcohol consumption across Europe 28Figure 23 Trend in alcohol consumption 1980–2001 29Figure 24 Trends in alcohol related death 1980–1997 29Figure 25 Occurrence of alcohol disorders in men and in women in the last 12 months
six European countries 25Figure 26 Effect of country on relative risk of lifetime alcohol disorders 26Figure 27 Cigarettes consumed per person per year in EU countries and Norway 27Figure 28 Deaths from smoking related causes in the EU and Norway 28Figure 29 Recent use of cannabis among young adults (15–34 years) in European Countries,
measured by national surveys 29Figure 30 Evolution of recent cannabis and cocaine use in some EU countries 32Figure 31 Trends in acute drug-deaths in some EU countries, 1985-99 33Figure 32 Positive mental health in men and women 34Figure 33 The effect of gender on the risk of poor mental health 35Figure 34 Relative risk of psychological distress for women compared to men in
some EU countries 35Figure 35 Psychological distress in males and females in some EU countries 35Figure 36 The effect of gender on the risk of depression 36Figure 37 Effect of gender for the risk of any disorders in ESEMeD 00Figure 38 Effect of gender for the risk of anxiety disorders in six EU countries 36Figure 39 Effect of gender for the risk of any disorders in six EU countries 37Figure 40 Ratio of male to female deaths from suicide in EU countries 37Figure 41 Ratio of male to female suicides across Europe, 1987 and 1997 38Figure 42 Relative risk of psychological distress for young people 38Figure 43 Psychological distress in seven EU countries 39Figure 44 Relative risk of any mental health disorders in young people in six EU countries 39Figure 45 Relative risk of anxiety disorders in young people in six EU countries 39Figure 46 Risk of psychological distress in older people 40Figure 47 Psychological distress in older people 40

3
T H E S T A T E O F M E N T A L H E A L T H I N T H E E U R O P E A N U N I O N
FiguresFigure 48 Relative risk of mood disorders in older people 41 Figure 49 Relative risk of anxiety disorders in older people 42Figure 50 Relative risk of psychological distress by marital status across Europe 43Figure 51 Mental health and living arrangements in six European countries 43Figure 52 Relative risk of mood disorders according to living arrangements 44Figure 53 Relative risk of psychological distress by employment status 47Figure 54 Psychological distress and unemployment in seven European countries 47Figure 55 Relative risk of any mood disorder in the last 12 months for unemployed people by country 47Figure 56 Relative risk of psychological distress by low income 48Figure 57 Psychological distress in rural and urban areas 50 Figure 58 Comparison of any mental disorders in the last 12 months for people living in
urban and rural areas 50Figure 59 Migration rates across Europe 51Figure 60 Psychological distress and migrants in five European countries 53Figure 61 Psychiatric hospital beds in European countries 55Figure 62 Numbers of psychiatrists in EU countries 57Figures 63 Numbers of GPs in EU countries 63Figure 64 Pharmaceutical expenditure across Europe 59Figure 65 People seeking help for a mental health problem 61 Figure 66 Relative risk of seeking help for a mental health problem among
cases of mental ill-health by country 61Figure 67 Probability of seeking help with a mental health problem 62Figure 68 People seeking help for mental health problems from any health provider 68 Figure 69 Types of providers consulted in case of mental health problems in the last year 69Figure 70 People seeking help from different providers in six ESEMeD countries 63Figure 71 Referrals from a family doctor to a mental health specialist 63Figure 72 Prescriptions of Drug for Individuals with any mental health disorder 63
4
T H E S T A T E O F M E N T A L H E A L T H I N T H E E U R O P E A N U N I O N
TablesTable 1 Prevalence rates of depressive disorders in selected major European studies 21Table 2 Prevalence of schizophrenia in the Nemesis study 24Table 3 Lifetime prevalence estimates of WMH-CIDI / DSM-IV mood disorders in
Europe for individuals aged 65+, ESEMeD project 41Table 4 Anxiety disorder in people aged over 65 in six European countries 42Table 5 Alcohol disorders in people aged over 65 in six European countries 43Table 6 Studies reporting associations with higher rates of the common
mental disorders, by indicators of less privileged social position 44Table 7 Impact of work on mental health 46Table 8 Depression in rural and urban areas in males and females 49Table 9 Consumption of antidepressants in 14 different
European Union countries 60Table 10 Consumption of anxiolytics and hypnotics in 14 different European Union countries 60
AcknowledgementsMany thanks to Frederic Capuano, Jocelyne Gagnon, Maria Carolina Hardoy, Trevor Hill, Zoe Morgan, Nick Taub, and Jane Smith for their help with this report.

5
T H E S T A T E O F M E N T A L H E A L T H I N T H E E U R O P E A N U N I O N
Participants and contributorsProject leaderViviane Kovess MGEN Foundation of Public Health, Paris 5 University, France
Co-ordinating boardTerry Brugha University of Leicester, UKMauro Giovanni Carta University of Cagliari, ItalyVille Lehtinen STAKES, National Research and Development Centre for
Welfare and Health, FinlandTopic expertsMatthias C Angermeyer (Older people) University of Leipzig, GermanyMariola Bernal (Immigrants) Sant Joan de Deu-SSM, SpainMiguel Xavier (Substances) Faculty Medical Sciences of Lisbon, PortugalFrance Kittel (Gender) ESP ULB Campus Erasme, BelgiumTom Fryers (Deprivation) University of Leicester, UK
National expertsBairbre Nic Aongusa Department of Health and Children, IrelandClaes-Goran Stefansson The National Board of Health and Welfare, SwedenHenrik Day Poulsen Copenhagen University Hospital, Rigshospitalet, DenmarkCharles Pull Centre Hospitalier de Luxembourg, LuxembourgJosep Maria Haro Abad Sant Joan de Deu-SSM, SpainHeinz Katschnig University of Vienna, AustriaMichael G Madianos University of Athens School of Nursing, GreeceOdd Steffen Dalgard University of Oslo, NorwayRob Bijl Ministry of Justice Research & Documentation, NetherlandsViviane Kovess MGEN Foundation of Public Health, Paris 5 University, FranceMauro Giovanni Carta University of Cagliari, ItalyVille Lehtinen STAKES,National Research and Development Centre for Welfare and Health, FinlandMatthias C Angermeyer University of Leipzig, GermanyMiguel Xavier Faculty Medical Sciences of Lisbon, PortugalFrance Kittel ESP ULB Campus Erasme, BelgiumTom Fryers University of Leicester, UK
Other expertsWolfgang Rutz WHO Regional Office for EuropeJohn H Henderson Mental Health EuropeGaetan Lafortune OECD
National refereesRaimundo Mateos Faculty of Medecine Santiago of Compostela, SpainPaul Bebbington University College London Medical School, UKJosé Miguel Caldas de Almeida Pan American Health Organization, PortugalAlv Dahl Aliv University Hospital, Norway Matti Joukaama University of Oulu, FinlandVenetsanos Mavrey University of Ionnina GreecePierluigi Morosini National Institute of Health, ItalyPer Nettelbladt Lund University, SwedenJohan Ormel University of Groningen, NetherlandsFrédéric Rouillon University Paris XII, FranceDermot Walsh Health Research Board Dublin, IrelandJohannes Wancata University of Vienna, AustriaSiegfried Weyerer Organisation Central Institute of Mental Health, GermanyKoen Demyttenaere KU Lueven, Belgium
Managing editorKaren McColl UK

This report aims to describe and compare the state ofmental health in the European Union and Norway, in thecontext of longstanding efforts of EU public healthprogrammes to promote good mental health and toprevent mental ill health.
A documented knowledge of the population’s mentalhealth status, and its determinants, is essential toestablish the basis for such programmes and to monitorand improve them.
In preparing this report, it has been assumed thatcollecting and comparing information on mental healthbetween countries will enable Member States to improvetheir understanding of mental health issues and to planappropriate policy responses. Mental health has to beconsidered as a public health priority due to the heavyburden it places on the EU and its Member States.
The report’s starting point is the acknowledgement thatMember States are different in terms of populationdensity, aging, poverty levels, cultural background andhabits. Furthermore, all of these factors have beenshown to have some links with mental health status andsome of them have been identified as risk factors.
This project has involved representatives from all EU countries plus Norway, WHO Europe, a representativeof a non-governmental organisation (Mental HealthEurope) and a representative of OECD Europe.
Each country representative was asked to summarise allthe surveys on mental health which had been carried outin their country. In addition, the experts each prepareda report on their country, its health system andparticular issues relating to the mental health domain.
Routinely collected statistics, such as cause of death orthe reasons for hospital discharge, do not fully reflectthe reality of the majority of mental health problems,which do not lead to death or hospitalisation. Thismeans that surveys among the general population arevery important for assessing the state of mental health.
Consequently this report has been prepared combiningtwo main kinds of data:
• routinely collected statistics on deaths from suicide,the use of drugs and alcohol and psychotropic drug consumption
• results from general population surveys.
The report is based on previous expert recommendationson mental health indicators, which propose that mentalhealth should be described in three dimensions. Positivemental health relates to well-being and the ability tocope with adversity. Negative mental health comprisesboth psychological distress, which refers to the presenceof symptoms (mainly depression or anxiety), anddiagnosis of psychiatric disorders. These are the threedimensions which have to be measured through surveys.
However, although many surveys which include mentalhealth measures were identified, the differences in surveytechniques and research methods make real comparisonsalmost impossible. This highlights the importance ofcollecting data in a comparable manner across the EU.
Two EU designed surveys – Eurobarometer and ESEMeD –provide important information for comparisons for mostof the countries. But even EU designed surveys facemethodological challenges when interpreting differences.
This report compiles the diverse indicators and describesthe major differences across countries in differentdimensions, with an attempt to set up individual countryprofiles where sufficient information was available.
Measures of positive mental health do differ significantlybetween European countries. Similarly, measurement ofpsychological distress in the two European surveysshows significant differences between Member States.After controlling for major socio-demographic variables,differences also appear for most of the psychiatricdisorders across the countries involved in the surveys.However, there are quite different patterns whenconsidering these three dimensions and this underlinesthe necessity of collecting information on diversedimensions (Section 3).
Suicide varies across Europe, ranging from 3 deaths per100,000 in Greece to 24 deaths per 100,000 in Finland.Although males have higher suicide rates, the ratio ofmale:female suicides differs across countries as well as therelative proportion of younger and older people whocommitted suicide.
6
T H E S T A T E O F M E N T A L H E A L T H I N T H E E U R O P E A N U N I O N
Executive Summary

Since methods for collecting suicide data are not totallyidentical, data on deaths whose suicidal intention isdoubtful (deaths from events of undetermined intent)have been compared as well.
In general, suicide rates have dropped across Europe in thelast 20 years. In all countries a decreased trend is observedfor suicide in males with the exception of Ireland and, toa lesser degree, of Spain and Luxembourg. This decreasingtrend is stronger for suicides among women.
Alcohol, tobacco and drug use all vary between MemberStates. Alcohol-related problems are responsible foraround nine per cent of Europe’s total burden of disease.Cigarette smoking is also relevant to mental healthbecause nicotine dependence has been defined as anaddictive disorder. Use of illicit drugs varies from countryto country and different usage patterns are also reflectedin national differences in acute drug-related deaths.
Since mental health surveys results have to beinterpreted with caution, a promising way to makecomparisons is to compare risk groups across countries.The main relevant factors are gender, age, marital status,employment, socio-economic status, rural-urban place ofliving and immigration status (See Section 4).
Important differences are reported concerning the relativerisk of women for psychological distress and depressiveand anxiety disorders across countries. Similarly, there aredifferences for young people in some countries. Data onthe older population were more difficult to compare fordepressive disorders, as well as for cognitive disorders,although they will represent a major challenge for eachcountry. To be divorced or to live alone is also a risk factorall around the EU, as are unemployment and poverty butthe magnitude of these risks varies. Data on urban/ruralcomparisons are more difficult to compare, partiallybecause socio-demographic compositions of the twopopulations are different and also because uniformdefinitions of what constitutes rural and what is urbanhave to be found. Very few data exist to allow comparisonson immigrant mental health status across countries.
The extent to which people seek help for any mentalhealth problems, who they seek help from and what helpis on offer also differ throughout the EU. Human andmaterial resources are different, quantitatively andqualitatively, across the EU. The reported use of care andhealth seeking behaviour, however, does not fit theavailability of resources and differs remarkably acrosscountries as does the type of help sought. Similarly, therelationships between the primary care system, which is themost frequent provider in all countries, and the specialisedmental health system are very different. Consequently, thetype of care provided varies too (Section 5).
Thanks to the ESEMeD and Eurobarometer surveys, it ispossible to present a complex picture of mental health insix countries, by putting together all available indicators.
This report demonstrates that comparisons of mentalhealth, and its socio-economic determinants, areessential and feasible. Yet such comparisons should beinterpreted with caution, at least until data is collectedin a more comparable manner across Europe.
Widespread, although not universal, improvements insome indicators, such as suicide or alcohol consumption,point to effective public health policies. The effectivenessof these interventions should encourage the remainingcountries, including the new Member States, to introducesimilar policies.
Comparisons of the different mental health provisionpatterns may also be fruitful for EU countries.
The report recommends that, at the EU level:
• information be collected about mental health acrossthe EU in an appropriate way to enable validcomparisons. EU level surveys have to be set upincluding longitudinal surveys and surveys on children,adolescents, immigrants and older populations. Datacollected in various surveys such as labour force surveysshould include a mental health component developed incollaboration with mental health surveys experts
• a report on mental health which collects and comparesdata from all sources, and which includes the enlargedEurope, should be produced on a regular basis in orderto stimulate common efforts across the Member States
Many of the above recommendations apply at thenational level as well as at the EU level. In addition,some further recommendations are made at MemberState level. These stress the importance of:
• implementing EU data collection guidelines andinstruments in each health-related survey and ofconducting mental health surveys accordingly atregular periods.
7
T H E S T A T E O F M E N T A L H E A L T H I N T H E E U R O P E A N U N I O N
It is increasingly evident that mental health problems area major public health burden. In the last few years, theworld has become more aware of this enormous burdenand the tremendous potential for mental health gains.
This project aimed to produce a report on the state ofmental health in the European Union and Norway and tostimulate the collection of further data on mental healthacross Europe.
This report describes and compares the state of mentalhealth in the various Member States and proposes abasis for relevant programmes for the promotion of goodmental health and the prevention of risk factors.Comparison of information on mental health betweencountries will enable Member States to improve theirunderstanding of mental health issues and to planappropriate policy responses.
1.1 Mental health and mental illness
Since mental health is a rather broad concept, abackground project was designed: the 'Key Concepts'project, was carried out in 1997 in order to ‘develop andevaluate the best options for the key concepts of mentalhealth promotion in Europe’.
This project considered that mental health has a positiveand a negative dimension. The positive dimension refersto the concepts of well-being and ability to cope in theface of adversity. This encompasses various dimensions
including: self-esteem, internal locus of control ormastery, optimism, and sense of coherence, to mentionthe most frequently measured.
The negative dimension relates to the presence ofsymptoms defined as psychological distress as well as to mental disorders. These mental disorders are defined through recognised classifications such as theInternational Classification of Disease (ICD10) or theDiagnostic Statistical Manual Version IV (DSM IV). In thisreport, all the disorders included in Chapter 5 of ICD10 areconsidered as mental disorders: organic mental disorders,deficiencies and dementias (whatever their cause),psychotic disorders, depressive and anxiety disorders,substance use disorders, personality and conduct disordersand eating disorders. Although disorders in children areincluded in Chapter 5, in this report only adult disorderswill be considered. Chapter 5 concerns psychiatricdisorders only and does not include any neurologicaldisorders from degenerative or traumatic origin.
It is important to clarify the relationship betweenpsychological distress and mental disorders. Psychologicaldistress refers to the presence of symptoms which aremainly types of depression or anxiety. These symptoms are usually measured by ‘checklists’ which produce a score by adding up the answers to the various questions.Psychological distress is, therefore, a continuousdimension. The symptoms are rather common and could betransient, for example, following a negative or stressfullife event. However, most of the time the person does notfit into a psychiatric diagnostic category and probably
8
1
I N T R O D U C T I O N
Introduction
The need for information on mental health in Europe has beenemphasised in the Public Health Policy, the Health MonitoringProgramme and the Public Health Programme (2003–2008) of theEuropean Commission.1 Problems relating to mental health are a public health priority: the social and economic costs of depression,for example, are of huge importance since depression will be, in a fewyears, the disease group with the second heaviest toll globally.2 Moreover,there is no good health without good mental health. Mental health isthus crucial to the well-being of individuals and societies.
1
never will. Those who are defined as having psychiatricdisorders, however, do usually also score highly on thepsychological distress checklist.
Psychiatric diagnoses on the other hand, are discreteentities described in classification through syndromes.These syndromes are a cluster of symptoms whoseduration, severity, and impairment on daily lifecorrespond to different diagnoses which usually relate toa need for care, either primary care or psychiatric care.
For each of these three dimensions, there are variousmeasurement instruments: positive mental health andpsychological distress are measured by checklists, while the categorical diagnoses are measured throughdiagnostic instruments which follow, as closely aspossible, the classifications which they aim to produce.
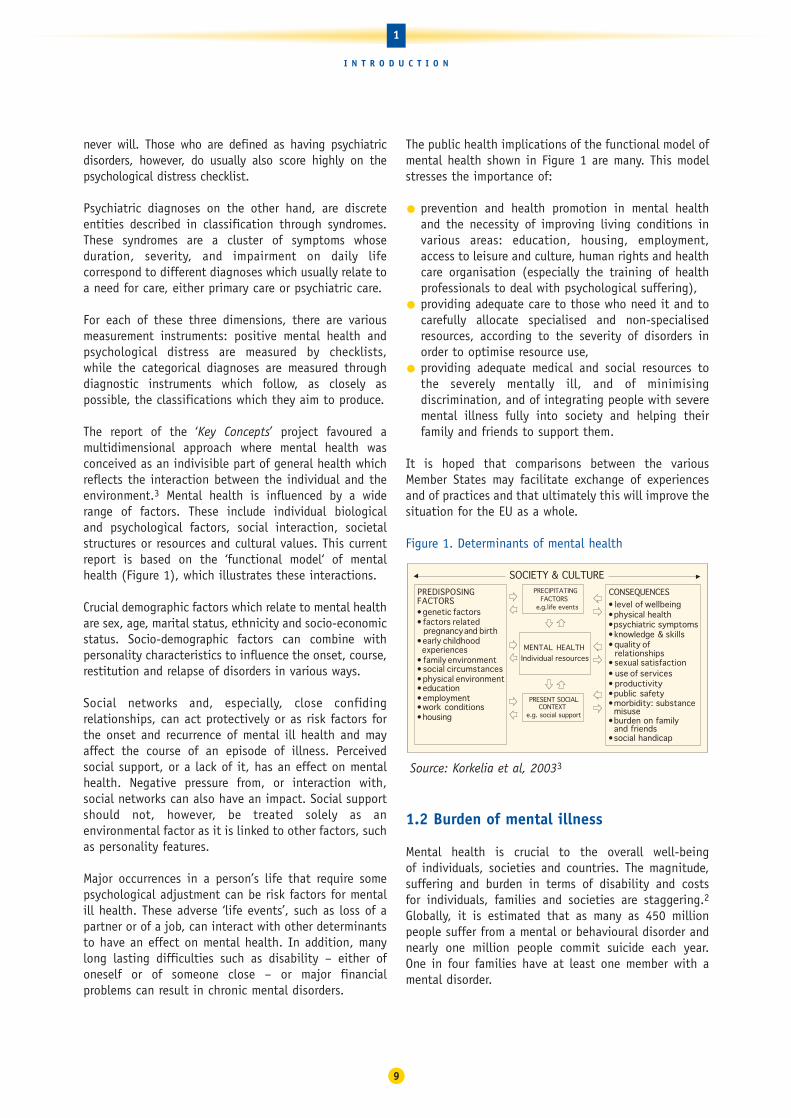
The report of the ‘Key Concepts’ project favoured amultidimensional approach where mental health wasconceived as an indivisible part of general health whichreflects the interaction between the individual and theenvironment.3 Mental health is influenced by a widerange of factors. These include individual biological and psychological factors, social interaction, societalstructures or resources and cultural values. This currentreport is based on the ‘functional model‘ of mentalhealth (Figure 1), which illustrates these interactions.
Crucial demographic factors which relate to mental healthare sex, age, marital status, ethnicity and socio-economicstatus. Socio-demographic factors can combine withpersonality characteristics to influence the onset, course,restitution and relapse of disorders in various ways.
Social networks and, especially, close confidingrelationships, can act protectively or as risk factors forthe onset and recurrence of mental ill health and mayaffect the course of an episode of illness. Perceivedsocial support, or a lack of it, has an effect on mentalhealth. Negative pressure from, or interaction with,social networks can also have an impact. Social supportshould not, however, be treated solely as anenvironmental factor as it is linked to other factors, suchas personality features.
Major occurrences in a person’s life that require somepsychological adjustment can be risk factors for mentalill health. These adverse ‘life events’, such as loss of apartner or of a job, can interact with other determinantsto have an effect on mental health. In addition, manylong lasting difficulties such as disability – either ofoneself or of someone close – or major financialproblems can result in chronic mental disorders.
The public health implications of the functional model ofmental health shown in Figure 1 are many. This modelstresses the importance of:
• prevention and health promotion in mental healthand the necessity of improving living conditions invarious areas: education, housing, employment,access to leisure and culture, human rights and healthcare organisation (especially the training of healthprofessionals to deal with psychological suffering),
• providing adequate care to those who need it and tocarefully allocate specialised and non-specialisedresources, according to the severity of disorders inorder to optimise resource use,
• providing adequate medical and social resources tothe severely mentally ill, and of minimisingdiscrimination, and of integrating people with severemental illness fully into society and helping theirfamily and friends to support them.
It is hoped that comparisons between the variousMember States may facilitate exchange of experiencesand of practices and that ultimately this will improve thesituation for the EU as a whole.
Figure 1. Determinants of mental health
Source: Korkelia et al, 20033
1.2 Burden of mental illness
Mental health is crucial to the overall well-being of individuals, societies and countries. The magnitude,suffering and burden in terms of disability and costs for individuals, families and societies are staggering.2Globally, it is estimated that as many as 450 millionpeople suffer from a mental or behavioural disorder andnearly one million people commit suicide each year.One in four families have at least one member with amental disorder.
PRECIPITATINGFACTORS
e.g.life events
MENTAL HEALTHIndividual resources
PRESENT SOCIALCONTEXT
e.g. social support
CONSEQUENCESPREDISPOSINGFACTORS• genetic factors• factors related
pregnancy and birth• early childhood
experiences• family environment• social circumstances• physical environment• education• employment• work conditions• housing
• level of wellbeing• physical health• psychiatric symptoms• knowledge & skills• quality of
relationships• sexual satisfaction• use of services• productivity• public • morbidity: substance
misuse • burden on family
and friends• social handicap
safety
SOCIETY & CULTURE
9
1
I N T R O D U C T I O N

According to the World Health Organization’s GlobalBurden of Disease project in 2001, one third of the years lived with disability are due to neuropsychiatricdisorders and a further 2.1% are associated withintentional injuries.2 Four of the six leading causes ofyears lived with disability are due to neuropsychiatricdisorders (depression, alcohol use disorders, schizophreniaand bipolar disorders).
Depression alone causes over 12% of the years lived withdisability globally, and ranks as the third leadingcontributor to the global burden of disease. More than150 million persons suffer from depression at any pointin time. About 25 million suffer from schizophrenia andmore than 90 million suffer from an alcohol or drugrelated problem. In 2000, more than 1.8 million deathswere attributed to alcohol related risks and 205,000deaths were attributed to illicit drug use.
Dementia presents another enormous challenge forEurope’s health and social care systems. There were anestimated 7.1 million cases of dementia in Europe in2000, and dementia is the principal cause of disabilityamong the elderly.
It is increasingly clear that mental health and physicalhealth are interconnected. A number of mentaldisorders, such as depression, anxiety or substanceabuse, are more common in people suffering fromcommunicable and non-communicable diseases. Andpeople suffering from chronic physical health problemsare more likely to develop mental disorders such asdepression. While in the general population theprevalence of major depression can range from three to10%, it is consistently higher in people affected by chronic disease. In people suffering from high blood pressure, for example, the prevalence of majordepression is up to 29%. In people living with HIV/AIDSthe prevalence is as high as 44%. Rates of suicide arealso higher among people with physical health problemsthan among other people. This co-morbidity – when aperson is suffering from two medical conditions at thesame time – has important consequences. People withco-morbid depression, for example, are less likely toadhere to medical treatment or recommendations, andare at increased risk of death or disability.
Given the prevalence of mental health and substancedependence problems, the emotional, but also thefinancial burden, on individuals, their families andsocieties is enormous. The economic impact of mentalillness includes the effects on personal income, onability to work (for individuals and for carers) and tomake productive contributions to the national economy,as well as the use of health and support services.
In the Member States of the European Union the cost ofmental health problems is estimated to be between 3%and 4% of gross national product. Of this, healthcarecosts account for an average of 2% of GNP. Studies have also shown that the relative and absolute costs oftreating chronic disease conditions, such as psychosisand neurosis, are comparatively high when contrastedwith a wide range of health disorders. The average annualcosts, including medical, pharmaceutical and disabilitycosts, for employees with depression are estimated as upto 4.2 times higher than costs for people with otherconditions. In the United Kingdom, for example, a studyinto the aggregate costs of all mental disordersestimated the total as 44.8 million euros.
An important characteristic of mental health is thatmental disorders often start at a relatively young ageand mortality from these disorders is relatively low. Thismeans that people can live for a long time with theeffects of mental ill-health and that the indirect costs,from lost or reduced productivity in the workplace, are high.
Similarly, it is known that the costs of mental healthproblems in childhood are large and largely hidden.Research from the UK shows the substantial additionalcosts generated by children with conduct disorders from ages 10 to 27 years in terms of education andcriminal justice.
1.3 Why publish a European report on mental health?
Health issues have belonged to the competence of theEuropean Community for a relatively short time. Healthwas mentioned in this sense for the first time in the1993 Maastricht Treaty in article 129:
‘The Community is to make a contribution towardsensuring a high level of health protection by 1) theencouragement of cooperation between the MemberStates and, if necessary, the provision of support to theiractions; 2) the promotion of policies and programmes ofthe Member States in the areas of disease prevention,research into causes and transmission of diseases, healthinformation and health education; and 3) fostering of co-operation with third countries and the competentinternational organisations in the sphere of public health.’
Further Treaties of the European Union have built on thisEuropean competence in public health. The 1997 Treatyof Amsterdam focused on health protection and diseaseprevention and identified the need for further actions to
10
1
I N T R O D U C T I O N

‘achieve improvements in public health’ as well asactivities to ‘prevent diseases and health problems’ andthe ‘reduction of risks to human health’.
Based on the mandate for public health established in Maastricht, the Commission of the EuropeanCommunities published in 1993 the Public HealthFramework Programme with its eight action programmes.This was adopted by the Parliament and Council inDecember 1995 and started in 1996.
Within the Public Health Framework Programme, anaction programme on health monitoring was launched inthe European Union and Norway. The main objectives ofthis Programme, which was adopted by the Parliament inJune 1997, were:
• to establish a set of Community (core andbackground) health indicators for monitoring healthin the Community that would facilitate the planning,monitoring and evaluation of Community programmesand actions, and that would provide added value toMember States’ own health information systems, thussupporting the development of national health policies;
• to specify the content of a network to be set up forthe collection and dissemination of health data andindicators, mainly with the aid of telematics; and
• to establish a capacity to undertake analyses, and tosupport the preparation and dissemination of reportson health status, trends and determinants and theimpact of policies.
Mental health was mentioned under the heading‘Functioning and Quality of Life’ as one area for whichhealth indicators might be established under a futureCommunity health monitoring system.
This, in turn, stimulated a number of projects in themental health field, financed by the EuropeanCommission, which have made an important contributionto this report. Specifically, this has included somecomparative community surveys, such as ODIN3, a largeEuropean survey (ESEMED)5, plus the addition of amental health part to the Eurobarometer survey in 2002.6
A project entitled Putting Mental Health on the EuropeanAgenda was carried out between 1998 and 2000. Thisproject outlined a public health approach for mentalhealth in Europe proposing a framework for mentalhealth policy in the European Union, published in thebook Public Health Approach on Mental Health in Europe.
The project strongly stressed the need to shift the focusof mental health. First, as a major contributor to healthand well-being, mental health needs to be brought out
from professional, organisational and political isolationinto the broader sphere of public health. Second, instead of concentrating on mental health at the level of individuals, it is important to strengthen thepopulation-level mental health approach. Third, there isa need to shift the understanding of mental health,which traditionally has focused on mental disorders.Instead of looking only at the negative side of mentalhealth, contemporary thinking and actions must drawattention to positive mental health.
In September 2002, a new public health programme wasadopted for the years 2003–2008.1 The generalobjectives of this programme are:
• to improve information and knowledge for thedevelopment of public health,
• to enhance the capability of responding rapidly andin a coordinated fashion to health threats, and
• to promote health and prevent disease throughaddressing health determinants across all policies.
Based on this new programme, the European Commissionhas identified its priority work areas. These include somecross-cutting themes such as health impact assessmentand tackling health inequalities. Other priorities relateto health information (including a working party formental health monitoring), to specific health threats andto health determinants, of which mental health is one.
The existing network of people concerned with mentalhealth in Europe, the European Network on MentalHealth Policy (ENMHPO), produced a framework andproposed key concepts and indicators relevant to goodmental health.3 The aim of this report is to build on thework of the ENMHPO and to expand the frameworkwithin the European Union.
The publication of this report on mental health isimportant in order to find out more about mental healthand its determinants. This report will enable overallcomparisons to be made and will enable people incharge of policies, analysts and researchers of theMember States to instigate their own preventionprogrammes. This report should also stimulate furtherprojects on mental health in Europe.
11
1
I N T R O D U C T I O N

2.1 Context of mental health in Europe
For many individuals within any one country of the EU,the diversity of European culture may seem the moststriking feature, and, indeed, there is incontrovertiblediversity. The differences of which most of us are aware(with the exception of language) are largely in rathersmall-scale traditional features of everyday life, whichimportantly define our identity and sense of belonging,and vary significantly within, as well as between, nation states.
Yet, looked at from outside, Europe may seemremarkably homogeneous. Profound changes have beentaking place across Europe as a whole, varying in paceand degree, but essentially similar in all countries.Changes in the nature of work increasingly emphasiseservices and communications rather than manufacturingand agriculture. The place of work in people’s lives haschanged, to provide a great deal more leisure time,which, together with the mechanisation of domestictasks, higher levels of disposable income and cheap andeasy travel, has provoked a huge tourist industry almosteverywhere. Communications – telephone, fax, e-mail,radio, television and internet – have opened up theworld, especially for younger people, even in remoterural areas.
Marriage, divorce and co-habitation, have changedthroughout the continent, apparently independent ofreligious traditions. First births are later and family sizeis smaller everywhere. In all countries, concurrent withthe reduction in children, there is a huge and growingincrease in elderly people, but they are fitter andhealthier for much longer. These changes in the make upof the population present serious challenges in relationto retirement and pensions right across Europe.
All of the features mentioned above, and many more, haveprofound implications for mental health – the experienceof ordinary people, the challenges of prevention, and theorganisation of treatment and care. These are importantissues where exchange of information and experience canbring significant benefits.
2.1.1 Population
In most countries there are very wide variations indensity of population, yet urbanisation continues itsapparently irresistible progress.
Figure 2.Population Density in the EU and NorwayAverage Population Density per square km, 2001
Source: WHO Health for All Database1
Figure 3. Urban Population in the EU and NorwayPercentage of Population Living in Urban Environment, 2001
Source: WHO Health for All Database
0
10
20
30
40
50
60
70
80
90
100
Austri
a
Belgium
Denm
ark
Finlan
dFra
nceGer
man
y
Greec
e
Irelan
dItaly
Luxe
mbo
urg
Nethe
rland
s
Norway
Portu
galSpa
inSweden
United
King
dom
2001
0
100
200
300
400
500
Austri
a
Belgium
Denm
ark
Finlan
dFra
nce
Germ
any
Greec
e
Irelan
d
Italy
Luxe
mbo
urg
Nethe
rland
s
Norway
Portu
gal
Spain
Sweden
United
King
dom
2001
12
2
C O M P A R I N G M E N T A L H E A L T H I N E U R O P E
Comparing mental health in Europe
2

Immigration has also been a feature of most EUcountries in the last few decades and most migrantssettle also in towns.
Everywhere there are issues of multi-culturalism andassimilation, legal and illegal residents and citizenship,participation, discrimination and disadvantage. Thereare risks to both general health and mental healthattached to immigrant status, and to experience ofsocial exclusion, made more difficult by seriouscommunication problems related to alien languages andcultures (see Section 4.6).
In many countries of Europe there is concern about lowfertility, some failing to reach replacement level. OECDfigures for 2000 show Spain, Italy, Greece, Austria andGermany with very low rates (between 1.22 and 1.34births per women aged 15–49). The highest rates werefound in France and Ireland (1.89 births per woman).Alongside this, life expectancy has been increasing at allages. In most European countries 15-20% of thepopulation is aged 65 or more and about 4% aged 80 or more. The exceptions with lower proportions ofpopulation aged 65 or more in 1997 were Ireland,Netherlands and Luxembourg. Children under 15generally make up less than 20% of the population.
Figure 4. Population Aged over 65 in the EU and NorwayPercentage of population aged over 65, 1997
Source: WHO Health for All Database
This holds the prospect of increasing imbalance ofpopulations in favour of the elderly. As the proportion ofelderly people increases, high dependency levels aremaintained even where the proportion of childrendecreases. This probably means that people reachingtraditional retirement age will need to continue working– they are, in general much fitter and healthier thanprevious generations and face much longer retirement
prospects. It certainly means increasing numbers ofpeople with dementia and increasing numbers of carers,often themselves elderly and vulnerable (see Section4.2). It should also mean that children are more valued,but also that child deaths, now rare, are more tragic intheir effects on families.
The low birth and fertility rates are no doubt related toincreasingly late marriage, at least among middle-income groups. In all groups, and apparently in allcountries, marriage has become much less common, andco-habiting has become very common, whether short-term, anticipating marriage, or long-term. This hascreated havoc with marital status statistics, so that it is difficult to know what health associations there noware. Divorce has also become far more frequent, andliving alone consequently more common, needing moreindependent housing. This is often accompanied by alack of social support, especially of close confidingrelationships known to be protective in mental healthterms. Children increasingly have broken and multiplefamilies; it is not yet clear what mental healthconsequences there may be on a whole population scale.
In general, deaths from the main causes – heart disease,cerebro-vascular disease and malignancies – are falling.Virtually all European countries can point to year on yearincreases in life expectancy from birth (which deriveslargely from substantial improvements in peri-natal andinfant mortality), and in life expectancy from age 65 and80. Whatever the perceived problems, this represents ahuge success for both socio-economic improvement andhealth care systems. However, there are sub-groups thatdo not share these improvements to the full.
2.1.2 Economy
In a global context, all countries in the EU are relativelywealthy, with thriving economies and most aredesignated high income countries by the World Bank.Figures from the Organisation for Economic Co-operationand Development (OECD) showed only Greece, Portugaland Spain with significantly lower gross domesticproduct (GDP) in terms of dollars per capita aspurchasing power parity. This is confirmed by data fromWHO. The outstanding GDP of Luxembourg, which is thehighest in Europe, is presumably related to itsinternational status and the very high proportion of non-Luxembourgeois working there. It will be noted later theeffect this has on measures of health spending. Irelandhas the second highest GDP and this illustrates therelatively recent economic boom, and, perhaps, therelatively low proportion of elderly, non-productive people.
0
5
10
15
20
Austri
aBelg
ium
Denm
ark
Finlan
dFranc
e
Germ
any
Greec
e
Irelan
d
Italy
Luxe
mbo
urg
Nethe
rland
sNor
way
Portu
gal
SpainSwed
en
United
King
dom
1997
13
2
C O M P A R I N G M E N T A L H E A L T H I N E U R O P E
Yet, in almost all countries there are regions of pooreconomic performance, with relatively low familyincomes, high rates of unemployment, inadequateeducation, and limited opportunities. And there areethnic minorities or other distinct sub-groups in thepopulation who are also disadvantaged in these variousways. Since these features are linked at the populationlevel to higher prevalence rates of the common mentaldisorders, there are obvious implications for bothprevention and care.
Unemployment rates vary across Europe. But thesenational rates mask those regional and sub-groupvariations mentioned above. For example a rate of 10.4%in Germany masks 8.2% in the old ‘West’ and 18.6% inthe old ‘East’. In Italy, the overall rate hides the fact thatthere is a very high rate of unemployment in youngadults (age 15-24) nationwide, and particularly in youngadults in the South. Unemployment figures show onlypart of the picture of non-employment, and the rest ofthe picture will no doubt be very different in differentcountries. In Sweden, for example, alongside 4.7%unemployment among the workforce aged 16-64 years,we must also consider that there are 13.1% receivingsickness benefit, and therefore temporarily not working,and 8.0% receiving a disability pension, and thereforepermanently not working.
In many countries, as the economy has expanded, thereis concern about increasing gaps between rich and poor.The poor may increasingly include old people unless thepensions crisis currently experienced or anticipated bymost countries is resolved. Apart from social justice andequity, resolution of this issue is thus needed to avoidpotentially huge health and social care burdens oncommunities in the future with ageing populations.
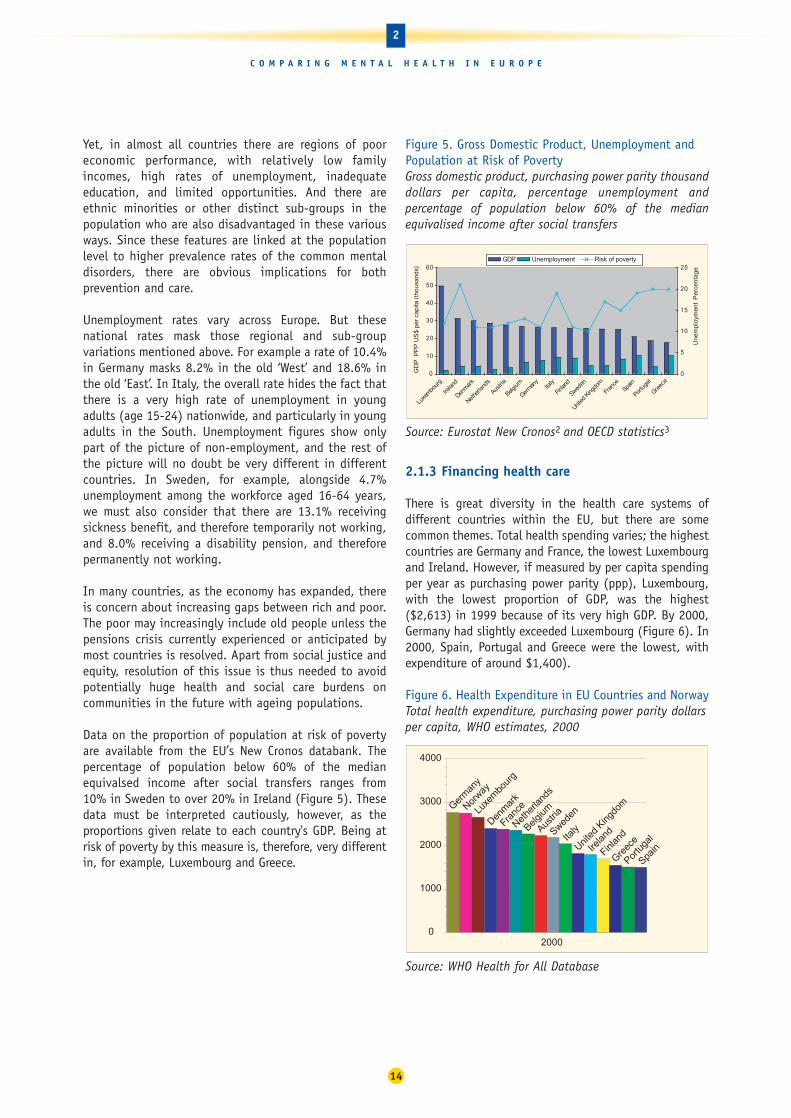
Data on the proportion of population at risk of povertyare available from the EU’s New Cronos databank. Thepercentage of population below 60% of the medianequivalsed income after social transfers ranges from 10% in Sweden to over 20% in Ireland (Figure 5). These data must be interpreted cautiously, however, as theproportions given relate to each country's GDP. Being atrisk of poverty by this measure is, therefore, very differentin, for example, Luxembourg and Greece.
Figure 5. Gross Domestic Product, Unemployment andPopulation at Risk of Poverty Gross domestic product, purchasing power parity thousanddollars per capita, percentage unemployment andpercentage of population below 60% of the medianequivalised income after social transfers
Source: Eurostat New Cronos2 and OECD statistics3
2.1.3 Financing health care
There is great diversity in the health care systems ofdifferent countries within the EU, but there are somecommon themes. Total health spending varies; the highestcountries are Germany and France, the lowest Luxembourgand Ireland. However, if measured by per capita spendingper year as purchasing power parity (ppp), Luxembourg,with the lowest proportion of GDP, was the highest($2,613) in 1999 because of its very high GDP. By 2000,Germany had slightly exceeded Luxembourg (Figure 6). In2000, Spain, Portugal and Greece were the lowest, withexpenditure of around $1,400).
Figure 6. Health Expenditure in EU Countries and NorwayTotal health expenditure, purchasing power parity dollarsper capita, WHO estimates, 2000
Source: WHO Health for All Database
0
1000
2000
3000
4000
Austri
a
Belgium
Denm
ark
Finlan
dFra
nceGer
man
y
Greec
eIre
land
Italy
Luxe
mbo
urg
Nethe
rland
s
Norway
Portu
gal
Spain
Sweden
United
King
dom
2000
0
10
20
30
40
50
60
Luxe
mbour
g
Irelan
d
Denmar
k
Nethe
rland
s
Austri
a
Belgium
German
yIta
ly
Finlan
d
Sweden
United
King
dom
Fran
ceSp
ain
Portu
gal
Greec
e
GD
P P
PP
US
$ pe
r ca
pita
(th
ousa
nds)
0
5
10
15
20
25
Un
em
plo
yme
nt
Pe
rce
nta
ge
GDP Unemployment Risk of poverty
14
2
C O M P A R I N G M E N T A L H E A L T H I N E U R O P E

All countries appear to have been increasing their healthexpenditure over the last few years, but even large extrasums of money for health care as, for example, in the UK,take a very long time to work their way through thesystem to produce recognisable improvements. However,there is an overlap between 'health' and 'social'spending, especially in relation to long-term illness anddisability, not least in respect of mental illness. Fewcountries give the relevant social budget, but it is clear,for Germany and Sweden at least, that it is very large andmay be of a similar order to the overt 'health' budget. Nodoubt it is much less in some other countries.
The mixture of health care funding sources – fromtaxation, national or compulsory insurance, privateinsurance and direct patient payments – varies.Therefore, the proportions of total health expenditurethat are public and private also vary. High proportions ofpublic spending are now the norm in Europe, and theseare often very high proportions. The corollary is avariable private sector which, however, is mostcommonly an option for relatively affluent people, whocan afford it in a situation where they are alreadycovered by a national system of health care.
In every country there appear to be direct payments bypatients for some aspects of health care. This is probablymost common in respect of drugs, social care and dentalcare, but a few countries have charges for hospitalattendance or even GP consultations. In these casesthere are exemptions for poorer people. For example, inIreland where a fee is charged to see a GP, about onethird of the population have free medical cards. Ashealth budgets are under pressure everywhere, there is astrong impression that patient direct payments aretending to increase in many health care systems. This ismade explicit in a recent reform plan for health care inGermany. Although Sweden's comprehensive health andsocial care system is funded out of taxation, about 30%of the total health spend comes from direct patientpayments. Mental health is usually fully encompassed by national financial systems, whether insurance basedor tax based, but may not be covered by privateinsurance systems.
2.2 Methodology for comparing mentalhealth in Europe
This project has involved representatives from all EUcountries plus Norway, WHO Europe, a representative ofa non-governmental organisation (Mental Health Europe)and a representative of OECD Europe. See the list ofparticipants and contributors on page 5.
Each country representative was asked to prepare areport on all the surveys on mental health which hadbeen carried out in their country. In addition, theexperts were asked to prepare a report on the mainfeatures of their country, its health system andparticular issues relating to the mental health domain.
2.2.1 Methodology of this report
The aim of this report is to describe mental healthstatus, and its determinants, across Europe. As dataalready exist concerning psychiatric care systems, theemphasis is on epidemiological data.
Mental health and mental health needs can be measuredat both individual and population levels. These may beassessed using techniques such as surveys, analyses ofroutinely collected data, analyses of socio-economicindicators and combinations of these techniques. Healthand healthcare may be measured by various indicators.
This report has been prepared combining two main kindsof data:
• Routinely collected statistics
• Results from general population surveys
2.2.1.1 Routinely collected statistics
This report followed the recommendations of the MentalHealth Indicators project.x This report presents ananalytical comparison of some macro indicatorscollected routinely from institutional sources in Europe.The objective is a general description of mental healthstatus, which includes well being, in the European Unionand Norway using officially available statistics.Monitoring a set of routine indicators could allow a goodgeneral framework and may provide a source ofhypotheses.
A review of macro indicators collected routinely frominstitutional sources such as World Health Organization(WHO), Organization for Economic Cooperation andDevelopment (OECD) and from EUROSTAT (particularlythe New Cronos databank) was carried out. Indicatorswhich could help illustrate mental health status, and theavailability of psychiatric care, for European countrieswere chosen.
Tables and figures are presented throughout the reportto enable internal comparisons within each country(trends over time) and between different Member States.Reliability of results may sometimes be doubtfulbetween countries but the measure of the temporaltrends in each nation allows methodologically safercomparisons.
15
2
C O M P A R I N G M E N T A L H E A L T H I N E U R O P E

SuicideSuicide mortality statistics were collected using theInternational Classification of Disease (ICD) 10 group‘Suicide and intentional self harm’. Suicide data areavailable from different sources: the OECD databank2,the WHO Health for All database1 and from Eurostat(New Cronos)3. The majority of data used in this reportare taken from the WHO Health for All Database.
Deaths due to events of undetermined intentThe Eurostat databank was used to provide rates for maleand female deaths due to events of undetermined intent.These figures are important because artefacts of deathregistration and disparities in the procedures fordetermining suicide may contribute to the internationaldiscrepancies in suicide rates. Rates of deaths due toevents of undetermined intent were therefore presentedas well as suicide rates.
Alcohol consumptionAt the population level the crude rate of the consumptionof alcohol and alcoholic beverages is measured per capita (litres of alcohol per person per year). The alcoholconsumption is calculated as the difference betweenproduction, alcohol imported and alcohol exported.
There are several reasons why these data should betreated with caution. On one hand, a country’s entirepopulation, irrespective of age, is sometimes used to calculate per capita consumption. This leads to areduction in the estimated average figures for the agegroups among which consumption is actually highest.On the other hand, consumption calculations are basedon statistics for the production and sale of differentalcoholic drinks, and this can lead to overvaluation(drinks that are produced but not consumed) and/orunder-valuation (undeclared or illegal production, drinksimported by tourists, countries with a high proportion of children and/or young people in general). Per capitadata thus provide us with what is, at best, an estimateof alcohol consumption, but not exact figures, howeverclose the approximation may be.
Data on alcohol consumption were taken from the WHOHealth for All Database for the sake of consistency, sincethe HFA database is a key source throughout this report.The WHO has also, however, been developing the GlobalAlcohol Database4 since 1997 and this contains a hugeamount of suitably treated and analysed information onthe most important indicators in this field.
When consumption trends from both sources are comparedit is interesting to note that, despite the fact that theGlobal Alcohol Database figures (weighted estimate forpeople over the age of 15 only) are higher than those fromthe Health for All database, both reveal the same trends.
Drug useData relating to drug use were taken from the 2002 and2003 reports of the European Monitoring Centre for Drugsand Drug Addiction (EMCDDA)5 which provides an annualoverview of the drug phenomenon in the European Unionand Norway. The data used in this report relate to trendsin drug use and trends in acute drug related deaths.
Mental health care resourcesThis project did not set out to describe the diversehealth systems across Europe. It was consideredrelevant, however, to bring in some data concerninghealth care resources; WHO data for general practitionersand psychiatric beds and Eurostat (New Cronos) forpsychiatrists.
Pharmaceutical drug useComparing psychotropic drug use across countries is notan easy task. Pharmaceutical companies provide data onthe spending in euros by country and by inhabitants and the data could be presented in categories (ATCclassification). In this way, antidepressants, sedative/anxiolytics and antipsychotics drugs can be identified.However the data are provided by a paid-for servicecompany (IMS) and are costly to obtain. In addition,this indicator reflects diverse prices so it does notreflect differences in consumption in countries.
The same company provides another indicator from arepresentative panel of physicians which is the numberof prescriptions by ATC. In this case, the data are basedon prescription analysis and one prescription couldconcern either a short or a long period of care, so theymay correspond to rather different number of units,Furthermore, hospital consumption is not taken into account.
To avoid all these biases the Defined Daily Dose system(DDD/1000 inhabitants) is supposed to be the standardas it uses total mg of product sold in a country by thestandard dosage for a day‘s treatment and reports it per1,000 inhabitants.
The EU has set up a website on this – Euromedicine –but unfortunately the DDD data are not available for allcountries. And some challenges remain with the DDDsystem. A standard dose for antidepressants, for example,is not easy to define since this may be different forindividual antidepressants.
This report presents data from all three approaches:
• Per capita euros expenditure
• Number of prescriptions per inhabitant
• Defined daily dose per 1,000 inhabitants
16
2
C O M P A R I N G M E N T A L H E A L T H I N E U R O P E

2.2.1.2 General population surveys
General population surveys are extremely importantwhen it comes to collecting mental health morbiditydata. This is because routinely collected statistics ondeaths related to mental health problems do not reflectthe reality of mental health. Nor do hospital dischargedata. These statistics contain no information on thelarge numbers of people who suffer from mental healthproblems but neither die nor are hospitalised as a result.
Comparison between surveys is difficult since thisrequires identical sampling design and use ofinstruments, including identical training for interviewersand diagnostic construction.
Instruments to measure mental healthAs previously described, mental health can be describedin three complementary dimensions. These are positivemental health (well-being) and negative mental health,which includes psychological distress and psychiatricdisorders.
Some instruments are actually designed to produceanswers which correspond to diagnoses of mentaldisorders. The Composite International DiagnosticInterview (CIDI), for example, is a diagnostic instrumentwhich is capable of uncovering a wide variety ofdiagnose. In general population surveys, however, it maybe limited to mood disorders, anxiety disorders and drug and alcohol disorders. These surveys will generateestimates of prevalence of particular disorders.
Other instruments measure more generic factors such as‘psychological distress’ by recording the presence orabsence of some symptoms, such as those of anxiety ordepression. This type of instrument produces a mentalhealth score, and for some of them cut-off points can beused to categorise people into groups such as ‘probablecases’ with mental health disorders. Instruments in thiscategory include the General Health Questionnaire (GHQ),the MHI-5 which is a sub-scale of a widely used genericinstrument, the Short-Form 36 (SF-36). The SF36 includessome positive mental health dimensions and somequestions on impairment due to mental health problems.The SF-12 has been derived from the SF-36 and includes ascore to evaluate mental health.
This report presents results derived using variousinstruments. Each instruments has been selectedbecause either the survey of surveys revealed that it wasone of the most commonly used instruments or becauseit was included in one of the two Europe-wide surveyswhose results are presented in the following chapters.The instruments presented are:
• Diagnoses of mood disorders, anxiety disorders andalcohol disorders derived using the CIDI interviewtool
• Positive mental health as assessed by the vitalitysubscale of the SF36 questionnaire
• Psychological distress as measured by the MHI-5 sub-scale of the SF-36 and as measured by the SF-12mental health sub-scale
• Risk of poor mental health as measured by the generalhealth questionnaire (GHQ-12) which identifiespeople with a ‘probable mental health problem’
There are difficulties when using mental health surveyinstruments across different countries and cultures.Some rules should be applied when translatinginstruments, such as those edited by WHO, and manyinstruments have validated versions in many languages.However, where there is careful translation, it has to bestressed that the interpretation of comparison results isdifficult. Differences could be either genuine mentalhealth differences, the expression of cultural differencesin the expression of symptoms or both. This is thedilemma of comparative psychiatry which is relevantthroughout this report.
Survey design issuesIn addition to the choice of instrument and classificationsystem, and the difficulties with translation ofinstruments, there are other important factors relating tosurvey design. These include:
• Source of sampling
• Sampling design
• Participation (response) rate
• Weighting system
• Translation of instruments
• The setting of cut-off points
The issues outlined above have important consequenceson the reliability and applicability of survey results inthe population surveyed, and have implications for the comparability of results between surveys (see below). Even in multi-country surveys there aredifficulties in ensuring consistent survey design andexecution across all participating countries.
17
2
C O M P A R I N G M E N T A L H E A L T H I N E U R O P E

A survey of surveysFor this report, surveys done at national, regional andlocal levels were identified by national experts and frompublished and unpublished literature. A form collecteddetailed information about every survey using specifiedmental health instruments,a including the populationcovered, socio-demographics, sampling methods,instruments, analytical methods, main results, and ifdata were available for secondary analyses. To try toensure full coverage, additional National Referees wereasked to review the information.
Information was collected on about 200 surveys. Theintention was to use the results of these surveys togeneralise about prevalence and associations with knownrisk factors, and to pool data from many surveys wherepossible, for meta-analysis. However, many surveys weresmall-scale local surveys, no doubt locally useful butinappropriate for generalisation. And the diversity ofsampling approach, methods, instruments, analysis,diagnostic classification and presentation of resultsamong the others was so great as to preclude even simplecomparisons except in a few cases. Meta-analysis couldbe attempted on only 19 studies, using one of threestandard instruments (the General Health Questionnaire(GHQ), the Composite International Diagnostic Interview(CIDI) and the Short Form 36 (SF-36) and that withrespect only to gender differentials. Annex 1 gives theprincipal characteristics of the selected studies.
The results of the meta-analysis were limited. The resultsmostly lacked statistical confidence, although they didconfirm previous research findings that women generallysuffer worse mental health than men across manydifferent countries and regions (see Section 4.1).
There is huge potential for invaluable comparative meta-analyses where there are many surveys covering thesame ground in countries across the EU. This potentialcannot currently be realised, however, becauseresearchers have not used the same methods. If themany surveys carried out across Europe were morestandardised to enable their findings to be pooled intoa more powerful analysis, then the results of each studywould be much more valuable. This exercise highlightsthe importance of an agreement on standard researchpractice, which would guarantee comparable data, toenable the discovery of differences in mental healthbetween different communities across Europe.
2.2.1.3 European surveys
In addition to the 200 national surveys examined for thesurvey of surveys, data were collated and compared froma number of European level surveys. These included the
mental health questions which were included in theOctober 2002 Eurobarometer survey and theESEMeD/MHEDEA 2000 Project.
The Eurobarometer SurveyThe European Commission funds the Eurobarometersurvey on a wide range of topics twice a year in all EUMember States and two separate regions (East Germanyand Northern Ireland).b In October 2002 a set ofquestions relating to mental health was included.xThese questions were standardised survey measures thathad been proposed by the European project on theestablishment of indicators for mental health monitoringin Europe. These measures related to either negative orpositive dimensions of mental health. The questionsincluded were:
• two sub-scales of the SF-36: MHI-5 (psychologicaldistress measure) and EVA (energy and vitality whichare positive mental health measures). A score of 52 orless on the MHI-5 scale is taken to indicatepsychological distress
• a question about whether respondents had soughthelp from somebody for a mental health problemduring the last 12 months,
• a question on social support, the 3-item Oslo socialsupport scale.
Response rates for the Eurobarometer survey in October2002 ranged from 23% (Great Britain) to 84% (France).In eight of the countries/regions, the response rate wasless than 50%. Thus, for this report countries whoseresponse rates were below 45% were excluded. Thus,Denmark, Greece, Ireland, Northern Ireland, Finland andGreat Britain were excluded.
Despite the methodological issues outlined above, theEurobarometer survey provides interesting informationon mental health status in different European countriesand use of mental health services.
ESEMeDThe ESEMeD/MHEDEA 2000 Project6 (European Study ofthe Epidemiology of Mental Disorders/Mental HealthDisability: a European Assessment in year 2000)comprised six European national surveys in Belgium,France, Germany, Italy, the Netherlands and Spain.c Thesurvey, hereafter referred to as ESEMeD, was partiallysupported by the European Commission.
ESEMeD used the CIDI interview tool (see Section2.2.1.2) to diagnose current or previous mental disordersand also used the SF-12 scale to assess psychologicaldistress. The overall crude response rate of this study was61.2% and within countries the weighted response
18
2
C O M P A R I N G M E N T A L H E A L T H I N E U R O P E
rate ranged from 45.9% in France to 78.6% in Spain. The response rates for Belgium, Germany, Italy and theNetherlands were 50.6, 57.8, 71.3 and 43.4 percentrespectively.
For the SF-12 analysis, we also added the results of aGreat Britain wide national survey carried out in 2000that also used the SF-12.7
These mental health factors were compared with socio-demographic variables and the use of health services.The socio-demographic composition of the sample groupvaried significantly between countries, except for theratio of men to women.
For this report, analyses were carried out to compare therisk of different disorders between countries and tocompare the effect of certain risk factors. These analyseswere adjusted to take into account these differences insex, age, living arrangements (married or living withsomeone or not) and whether people live in a urban orrural setting.
2.2.1.4 Country reports
In addition to this survey of surveys, which led tospecific comparisons, national experts were asked towrite a report on the main features of their country andits mental health care system. To support this nationalreport indicator data tables (including available OECD,WHO and EUROSTAT data) for each country, werecirculated to each national expert.
All of these country reports included some backgroundinformation about the population and economy of thecountry, and the general health care system. Thisbackground information is important to supply contextfor the description of mental health status, care,problems and issues. A compilation of these countryreports will be published separately.
19
2
C O M P A R I N G M E N T A L H E A L T H I N E U R O P E
Notes
a This included any survey using GHQ, SF-36 or SF-12,any form of CIDI, BDI and CESD.
b The Eurobarometer surveys cover the population aged15 years or over, resident in each of the MemberStates. The basic sample design applied in all MemberStates is a multi-stage, random probability one. Ineach EU country, a number of sampling points is drawnwith probability proportional to population size (for atotal coverage of the country) and to populationdensity. The net sample sizes are about 1,000 percountry/region except Luxembourg (about 600) andNorthern Ireland (about 300), giving a total netsample of about 16,000. All interviews are face to facein the respondent’s home, conducted by a nationalsurvey agency.
c The survey is a cross-sectional face to face householdinterview with probability samples representative of adult population of the six countries. The targetpopulation were individuals aged 18 years or olderresiding in private households. A stratified multi-stagerandom sample without replacement was drawn ineach country. In most countries the sampling framewas either a register of residents or postal registries.In France, however, an adjusted commercially obtainedlist of telephone numbers was used. For moreinformation on ESEMeD results see Acta PsychiatrScandin 2004; 109 (Suppl 420): 1-64.

Despite the importance of mental health in public healthterms, we still have a great deal to learn about the stateof mental health in Europe. This chapter brings togetherroutinely collected statistics on suicide, alcohol anddrugs and survey results on positive mental health,psychological distress and diagnosis of mental healthproblems to help develop a picture of mental healthstatus throughout Europe and to understand thedifferences between EU Member States.
Although there have been many surveys at the national orregional level, this chapter, focused on inter-countrycomparisons, places special emphasis on the results of tworecent European level surveys: Eurobarometer and ESEMeD.
3.1 Positive mental health
As described previously, mental health has a positivedimension which can be evaluated in many ways which arevery useful indicators for monitoring mental healthpromotion programmes. Unfortunately, despite the factthat measures of positive mental health have been stronglyrecommended, very few data on positive mental health, orwell being, have been published in Europe.
The few existing results come from the Eurobarometersurvey, which has used the vitality subscale of the SF36survey instrument (Figure 7).
Figure 7. Positive mental health in ten EU countriesScore on the vitality subscale of SF36 (0 to 100). The highest score has the highest positive mental health.Standardised against West German population.
Source: Eurobarometer1
Comparison of the different scores shows significantdifferences after some standardisation. Italy, Portugal,France and Sweden are in the lowest group and Belgium,Netherlands and Spain are in the highest. Germany,Austria and Luxembourg are in the middle.
It is interesting to note that positive mental healthscores, which are considered as reflecting a genuinedimension, do not correspond to the inverse of negativemental health as will be seen further on.
3.2 Negative mental health: psychologicaldistress and psychiatric disorders
Table 1 shows various survey results on mental healthdisorders and depressive disorders. The table illustratesthe fact that the surveys used different instruments,covered different time periods and that the populationssurveyed had different demographics. In addition, thesurveys differed in terms of design effect, participationrates, statistical analyses and weighting systems so theirresults can hardly be compared.
54
56
58
60
62
64
66
68
Italy
Portu
gal
Franc
e
Sweden
Luxe
mbo
urg
Germ
any (
New L
ande
r)
Germ
any (
Old La
nder
)
Austri
a
Belgium
Nethe
rland
s
Spain
Tukey test
20
3
M E N T A L H E A L T H S T A T U S I N E U R O P E
Mental health status in Europe3

Fortunately, there are two European surveys usingidentical instruments and design and whose data can beanalysed together: Eurobarometer and ESEMeD.
However, even though much was done to ensurecomparability, care should be taken with comparisons sincethere are always unmeasured differences in estimates of therates of disorders. As a consequence, this report presentsonly a few overall comparisons and, instead, presents riskfactor comparisons for the major pertinent mental healthvariables (gender, age, marital status, employment,economic situation, rural/urban place of living andimmigration status) because it is safer to compare thesevarious risk factors within different countries.
The figures presented are mainly in the form of relativerisk, or odds ratio. The odds ratio is a number whichindicates how much the risk has to be multiplied for agiven country compared to another chosen as reference.Relative risk can also be presented in this way to
illustrate the size of a risk associated with one variable(such as being female) compared to another (such asbeing male). This format has the advantage that it canexpress, in a easy to understand manner, the risk. It alsoallows researchers to statistically ‘control’ for othervariables which might have an effect in order to ensurethat the risk is attributable to the country. Since thesurveys in question were done on samples, the oddsratios have a confidence interval which should notinclude one (which correspond to a risk at 0) - this willbe indicated in the figures. The odds ratios have beencalculated using stata and those presented have beenadjusted for the main demographic variables.
Two types of comparison are presented: psychologicaldistress, as evaluated by MHI5 (SF36) in Eurobarometerand the mental health scale of SF12 in ESEMeD, andcomparisons by psychiatric diagnoses according tomedical psychiatric classifications (major depressivedisorders and anxiety disorders).
21
3
M E N T A L H E A L T H S T A T U S I N E U R O P E
Table 1. Prevalence rates of depressive disorders in selected major European studies
Country Study Year Population Sample Instrument Taxonomy* Period Age Prevalencegroup All Male Female
Europe MHEDEA/ 2000-2002 Europe 21,425 WMH-CIDI DSM-IV 12-month 18+ 3.90% 2.60% 5%(6 National ESEMeD2 (Spain, Italy, samples) Germany
France, Belgium and Netherlands)
Finland Finland 20003 2000 national 8,028 CIDI ICD-10 12-month 30+ – 4 6
France (Basse Sante des BN4 1998 regional 1,445 CIDI-S DSM-IV 12-month 18+ 3.4 –Normandie)
Germany TACOS5 1998 regional 4,075 M-CIDI DSM-IV 12-month 18-64 2.1 1.1 3 (Lubeck & region)
Germany GHS6 1999 national 4,181 M-CIDI DSM-IV 12-month 18-65 8.30% 5.50% 11.20%
Netherlands NEMESIS7 1996 national 7,076 CIDI v 1.1 DSM-IIIR 12-month 18-64 5.80% 4.10% 7.50%
France (Paris) Paris/Sardinia8 1994-96 regional 2,260 CIDI-S 6-month 18+ 5.9 – –
France (Isle Sante des F9 1998 regional 1,183 CIDI-S DSM-IV 6-month 18+ 5.8 – –de France)
Italy Paris/Sardinia8 1994-96 3 different 1,040 CIDI-S ICD-10 6-month 18+ 6.5 – –(Sardinia) areas
Germany TACOS10 1998 regional 4,075 M-CIDI DSM-IV 4-week 18-64 0.8 0.3 1.2(Lubeck & region)
Netherlands NEMESIS7 1996 national 7,076 CIDI v 1.1 DSM-IIIR 4-week 18-64 2.70% 1.90% 3.40%
Great Britain 1st survey 1993 national CIS-R/SCAN ICD-10 2-week 16-64 2.30% 1.90% 2.80% psych morb11
Great Britain 2nd survey 2000 national CIS-R/SCAN ICD-10 2-week 16-64 2.80% 2.60% 3.00psych morb12
Source: E S Paykel MD FRCP FRCPsych FmedSci., T Brugha MD FRCPsych., T Fryers MD PhD FFPH. (2004) SIZE AND BURDEN OF DEPRESSIVEDISORDERS IN EUROPE. In: European Review on Size and Burden of Mental Disorders. To be published in European Neuropsychopharmacology.

3.2.1 Psychological distress
Psychological distress was measured by two near-identical instruments – MHI-5 and SF-12 – derived fromthe same source. These instruments aim to evaluatecommon symptoms, mostly concerning anxiety anddepression.
The Eurobarometer survey used the MHI-5 scale and arecommended cut-off point was used (Figure 8). Thismeans that those with a score at or below 52 have highpsychological distress. The differences betweencountries are significant.
Figure 8. Psychological distress in ten EU countriesPercentage with a score of 52 or less on MHI-5 scale ofSF36 – those who probably have mental health problems.Standardised against the West German population
Source: Eurobarometer
For SF-12 no standardised cut-off point is available buta low rate is associated with high psychological distressand a high rate with low psychological distress (Figure9). National UK survey data were added to the ESEMeDdata since they were collected using the sameinstrument.12 Data were weighted according to the UKpopulation distribution for age and sex.
Figure 9. Psychological Distress in Seven EU countries Mental health score on the SF-12 sub-scale in six ESEMedDcountries and the UK. A lower score indicates a higherlevel of psychological distress
Source: ESEMeD and UK psychiatric morbidity survey
When the two figures are compared the results arecoherent: France and Italy are those claiming thehighest psychological distress and Netherlands thelowest. Spain, Germany and Belgium are in-between.
When comparing results obtained with positive mentalhealth, one can see that some countries have strictinverse results such as the Netherlands, which has highpositive mental health and is low in psychologicaldistress. It is the reverse for Italy, Portugal and Francewhich have low levels of positive mental health and highlevels of psychological distress (Figures 8 and 9). Somecountries, however, such as Spain and Belgium are highfor positive mental health and relatively high as well forpsychological distress.
3.2.2 Psychiatric disorders
Data from the ESEMeD study enable presentation ofprevalence for major depressive disorders and anxietydisorders for the six countries involved.
2.65
3.11
4.454.514.64.61
3.69
2.50
3.00
3.50
4.00
4.50
5.00
FranceItalySpainGermanyBelgiumNetherlandsUnitedKingdom
Tukey Test
10.9
19.1
23.4
29.3 30.2
25.9
20.119.518.717.6
12.4
468
101214161820222426283032
Netherla
nds
Sweden
Spain
Luxe
mbo
urg
Belgium
Austria
Germ
any (
Old La
nder
)
Germ
any (
New L
ande
r)
France
Portu
gal
Italy
22
3
M E N T A L H E A L T H S T A T U S I N E U R O P E

Figure 10. Any mental disorder in the last 12 months in six EU countries Relative risk for any mental disorder in the last 12 months, using Italy as a base. Adjusted for sex, age, living arrangements and urban/rural
Source: ESEMeD
Five countries in the ESEMeD study had a higherprevalence of any mental disorder in the last 12 monthsthan Italy. Figure 10 shows the relative risk comparedto Italy for each of the other countries involved.
3.2.1.1 Depression
The six-country ESEMeD study included assessment oflifetime and current prevalence of mood disorders (whichincludes depression) and major depressive episodes.Figure 11 shows the relative risk for having had anymood disorder in the last 12 months compared to Italy.For all the following analyses, Italy was used as thereference for comparison because the rates for all theconditions were lower in Italy.
Figure 11. Any mood disorder in the last 12 months insix EU countries Relative risk for any mood disorder in the last 12 months, using Italy as a base. Adjusted for sex, age, living arrangements and urban/rural
Source: ESEMeD
Compared to Italy, there is a significantly increased riskof any mood disorder in Belgium, France and theNetherlands (Figure 11).
3.2.2 Anxiety
The ESEMeD survey assessed the lifetime and currentprevalence of anxiety disorders.
Figure 12. Anxiety disorders in the last 12 months insix EU countriesRelative risk adjusted for sex, age, living arrangementsand rural/urban. Italy as a Reference
Source: ESEMeD
The relative risk of anxiety disorders in the last 12months, compared to Italy, is shown in Figure 12. Foranxiety disorders, France, Germany and the Netherlandsare at risk compared to Italy. Spain and Belgium,however, do not have higher risk.
After controlling for major socio-demographic variables,differences do appear for most of the psychiatricdisorders across the participating countries. Italy has alower risk for any disorders in the last year than theother countries and Spain does not differ from Italy foranxiety and depressive disorders. On the other hand,France and the Netherlands are constantly higher thanItaly and Spain. Belgium is higher than Spain, Germanyand Italy for mood disorders but not for anxiety and itis the reverse for Germany.
Interestingly Italy, which has the lowest rate ofpsychiatric disorders, has one of the highestpsychological distress levels including within the samestudy where diagnosis as well as psychological distressquestions are asked to the same subjects. There arevarious ways that this might be explained. One of thesemight be that Italians are more prone to admit commonsymptoms than to report severe psychiatric symptoms.
Alternatively, there may be some social and culturalmechanisms which prevent those in psychological distressbecoming psychiatric diagnoses. This last hypothesis issupported by the fact that two macro-indicators: alcoholconsumption and suicide are at low levels for this country.Of course we cannot rule out the hypothesis that a rigidpsychiatric instrument such as the CIDI does not capture the
1.94
1.551.37 1.28
1.01.04
0,00
0,50
1,00
1,50
2,00
2,50
3,00
France TheNetherlands
Germany Belgium Spain Italy
1.48 1.411.25
0.94 1.0
2.11
0.00
0.50
1.00
1.50
2.00
2.50
3.00
France Belgium The Netherlands
Spain Germany Italy
2.23
1.721.6
1.321.2
1.0
0,00
0,50
1,00
1,50
2,00
2,50
3,00
France TheNetherlands
Belgium Germany Spain Italy
23
3
M E N T A L H E A L T H S T A T U S I N E U R O P E

diagnosis symptomatology. It worth noting that this lowrate for some of the diagnoses, more specifically depression,in Italy has been regularly reported in other surveys.
The analysis above illustrates that comparisons aredifficult to interpret, as well as demonstrating that dataare coherent between the two studies. This also showsthat psychological distress is a different dimension ofmental health to psychiatric disorders even though theydo overlap to a certain degree.
3.2.3 Psychosis
In addition to the mental health problems describedpreviously, it is important to consider other disorderssuch as schizophrenia.
Mental health literature suggests that the prevalence ofschizophrenia has varied enormously between studiesand countries. It is estimated that the average lifetimeprevalence of schizophrenia would be about 1% of thetotal population.
Large differences in the prevalence of schizophreniabetween different countries (from 0.3 per 1,000 to 13per 1,000) were found in one 1987 review. In addition,pockets with very high and very low prevalence havebeen detected.13
A review by Häfner and an der Heiden14 selected 30prevalence studies of schizophrenia published since1980. The lowest reported prevalence in these studieswas 0.3 per 1,000 in Canada, and the highest from 6.0to 11.0 per 1,000 in the USA in two separate studies.
Some studies, published from Finland, seem to indicatethat the prevalence of schizophrenia would be somewhathigher in this country than in most of the othercountries from which data are available. For example,the national Mini-Finland Health Survey, representingthe whole Finnish adult population and conducted in theend of the 80s15 revealed an overall prevalence ofschizophrenia as 1.3% (same for both sexes). However,a clear difference between the five different regions ofthe country were found: the prevalence was 0.9% in thetwo southern regions, whereas it varied from 1.6% to2.1% in the three northern and eastern regions.
Hovatta et al studied a single municipality in the north-eastern Finland, which they called a ‘genetic isolate’,and they found a very high prevalence of schizophrenia(3.2%).16 A similar isolate had been found in already inthe 40s in northern Sweden.17
The prevalence of psychosis has been estimated in twohousehold surveys in Great Britain in 1993 and 2000.12
In both surveys approximately 9,000 adults wereinterviewed in Wales, Scotland and England and screenedfor possible psychosis using self-report measure.
A follow-up interview by clinicians was used to producea population prevalence estimate that in both surveyswas 4 per thousand.18 A high proportion of, but not all, cases were in contact with primary or secondary(specialist care) services and in receipt of treatment. Therate found is similar to that obtained in a survey basedon service, practitioner and lay healer contacts carriedout in selected parts of Australia.19
A general population random sample of 7,076 men andwomen aged 18-64 years in the NEMESIS study in theNetherlands, using the Composite InternationalDiagnostic Interview (CIDI), yielded the followingresults.8
Table 2: Prevalence of Schizophrenia in the Nemesis Study
Male Female TotalLifetime prevalence 0.4% 0.3% 0.4%12-month prevalence 0.2% 0.2% 0.2%1-month prevalence 0.1% 0.2% 0.1%
Source: Bijl et al., 19988
In this survey, those with evidence of psychosisaccording to the CIDI were additionally interviewed bypsychiatrists. The lifetime prevalence of ‘true’psychiatrist-rated clinical delusions and hallucinationswas 3.3% and 1.7% respectively. The prevalence ofeither delusions or hallucinations was 4.2%. In thegeneral population psychosis symptomatology that isconsidered not clinically relevant is present: lifetimeprevalence is 12.9%. The prevalence of secondarysymptoms (i.e. psychotic symptoms are present, but theresult of drugs or somatic disorders) is 0.6%. Of the17.5% of the population with any type of positivepsychosis rating, only 2.1% had a diagnosis of non-affective psychosis (according to the DSM-III-Rclassification).
From this, it may be concluded that, althoughschizophrenia is rare, psychosis symptoms are rathercommon in the general population. These findings haveto be put in context of the ongoing debate on theconcept of schizophrenia. Although dichotomouslydefined for clinical purposes (using ICD or DSM criteria),some scientists consider that psychosis may exist as acontinuous phenotype in nature. Better study of pre-psychotic states may have implications for prevention.
24
3
M E N T A L H E A L T H S T A T U S I N E U R O P E

3.3 Suicide
There are big discrepancies between suicide rates indifferent EU Member States (Figure 13). The yearly ratesrange from 3 deaths per 100,000 in Greece to 24 deathsper 100,000 in Finland.
The last year with available suicide data for all EUcountries is 1997 (Figure 13). More recent data areavailable for all countries except Belgium (Figures 14and 15).
Figure 13. Total Suicide Mortality Rates Across Europe, 1997Standardised death rates, suicide and self-inflicted injury,all ages per 100,000
Source: WHO Health for All database
Some of the variations in suicide across Europe may bedue to differences in the process of death registration.19
Procedures for recording a death as a suicide are notuniform. Countries like Luxembourg require a suicidenote in order to register a death as suicide, while in theUnited Kingdom an assessment of intent is required by aCoroner. Cultural and social norms also play a role indeath registration. In cultures in which suicide isparticularly stigmatised, it may be more common torecord the cause of death as of undetermined intent orto record another cause.
For this reason it is interesting to take into accountdeaths from events of undetermined intent alongsidesuicide when making country comparisons. For example,the suicide rate in Portugal, which was one of the lowestrates of suicide, became one of the highest whenundetermined intent is taken into account. Of course notall deaths from events of undetermined intent should beconsidered as a suicide, but many of them will be.
Adding these figures to the statistics helps to clarify thetrue situation and makes comparisons more, althoughnot entirely, satisfactory.
Figure 14. Male deaths from suicide, intentional selfharm and events of undetermined intent across Europe1999 by country
Source: Eurostat New Cronos
Figure 15. Female deaths from suicide, intentional selfharm and events of undetermined intent across Europe1999 by country
Source: Eurostat New Cronos
For this reason the evaluation of trends over time ineach nation is probably a better tool for makingcomparisons between countries.
In all countries a decreased trend is observed for suicidein males with the exception of Ireland and, to a lesserdegree, of Spain, Luxembourg and Greece (Figure 16). Itis most notable in Ireland that the increase in suicidedoes not apply to women (Figure 17).
0
2
4
6
8
10
12Events of undetermined intent Suicide and intentional self harm
Portu
gal
Greec
e
Franc
e
Denm
ark
Nethe
rland
s
Norway
Germ
any
Luxe
mbo
urg
Sweden
Finlan
d
Spain
Austri
a
Irelan
d
Unite
d Kin
gdom Ita
ly
0
5
10
15
20
25
30
35
40
45Events of undetermined intent Suicide and intentional self harm
Portu
gal
Franc
e
Norway
Denm
ark
Nethe
rland
s
Finlan
d
Germ
any
Greec
e
Luxe
mbo
urg
Sweden
Austria
Irelan
dSpa
in
United
King
dom
Italy
0
5
10
15
20
25
30
Austri
aBelg
ium
Denm
ark
Finlan
d
Franc
e
Germ
any
Greec
e
Irelan
d
Italy
Luxe
mbo
urg
Nethe
rland
s
Norway
Portu
gal
Spain
Sweden
United
King
dom
1997
25
3
M E N T A L H E A L T H S T A T U S I N E U R O P E

Figure 16. Trends in male suicide by countryStandardised death rates, suicide and self inflicted injury,males all ages per 100,000, 1980-1999. Red linesindicate a decrease and green lines represent an increase.
Source: WHO Health for All Database
The trend of a decrease in suicides in the last 20 yearsis stronger in females (Figure 17).
Figure 17. Trends in female suicide by countryStandardised death rates, suicide and self inflicted injury,females all ages per 100,000, 1980 – 1999. Red linesindicate a decrease and green lines represent an increase.
Source: WHO Health for All Database
Trends in suicide can be influenced by changes inattitudes towards the registration of deaths which occurover time within a country. For example, it could beargued that the Irish suicide rate has not reallyincreased, but that there has been a cultural changetowards suicide. If such a hypothesis were true, thisshould correspond also to a drop in deaths from eventsof undetermined events. This is not the case, however, inIreland where deaths from events of undetermined intentamong men increased by 14% between 1995 and 2000.
Among those countries with an increase in male suiciderates, only Luxembourg witnessed a slight decrease in deaths from events of undetermined events. Bothcountries with an increase in female suicide rates –Spain and Luxembourg – have also seen an increase infemale deaths due to events of undetermined events.
The elderly have the highest suicide rates in thepopulation (Figures 18 and 19). Suicide rates increasewith age. Males aged 75 and above have the highestsuicide rates of all age groups in most industrialisedcountries.
Since the number of people who reach old age isexpanding, the absolute number of suicides is expectedto rise. Suicide is predicted to become the tenth mostcommon cause of death in the world by 2020.20
Risk factors for suicide in old age are mainly chronic,terminal and painful illnesses, psychiatric disorders(mainly depression), conflicts and stress in interpersonalrelationships, social isolation and loneliness.
Elderly men tend to use violent suicide methods. Themethods employed vary among the different culturalsettings, hangings tend to dominate among male elderlysuicide in European nations. The main method employedby elderly women is self-poisoning with prescription drugs.
The ratio of attempted suicides to deaths from suicide inthe general population is estimated at between eightand 20 to one. The corresponding figure for the elderlywas estimated at two to one by a 16-centre WHO study.21
1 2 3 4 5 6 7 8 9 10 11 12 13 14 15 16 17 18 19 20 21 22 23
Value
Great Britain andNorthern Ireland
Sweden
Spain
Portugal
Norway
Netherlands
Luxembourg
Italy
Ireland
Greece
France
Finland
Denmark
Austria
0 10 20 30 40 50
Value
Great Britain andNorthern Ireland
Sweden
Spain
Portugal
Norway
Netherlands
Luxembourg
Italy
Ireland
Greece
France
Finland
Denmark
Austria
26
3
M E N T A L H E A L T H S T A T U S I N E U R O P E

Figure 18. Suicide and old age in males across EuropeStandardised death rates for suicide and self-harm inmales aged 0-64 years and males 65 years and over, 1997
Source: WHO Health for All Database
Figure 19. Suicide and old age in females across Europe Standardised death rates for suicide or intentional selfharm for females 0-64 years and females 65 years orolder, 1997
Source: WHO Health for All Database
Ireland is the only country where the suicide rates inmales in the 0-65 age group is higher than the suiciderate of older adults.
The high suicide rate for adult men is Ireland isconfirmed in the youngest age category: 15 to 24 years.As a result the ratio of suicides in young men comparedto young women in Ireland is the highest in Europe.
Figure 20 shows the suicide rates for young males andfemales aged between 15 and 24 years.
Figure 20. Suicides in young people across EuropeStandardised death rates suicide and self-harm, malesand females aged 15-24 years, 1997
Source: WHO Health for All Database
The variation in suicide rates across countries may bepartly explained by social and cultural factors.22
Figure 21. Suicide, risk of poverty and unemployment
Source: Eurostat New Cronos and WHO Health for All Database
However, the relationship between major economicfactors such as unemployment rate, GDP and povertylevels is not evident from the data available here (Figure 21).
For example, Ireland, the country which has had the besteconomic trend in most indicators in the period between1980 and 2000, has had the highest increase in suicidesduring the same time. However, the causes are not clear and are certainly complex. There have been manychanges in Irish society in the recent past. The wealthof the country has increased, although the risk ofpoverty has remained at a high level (Figure 21). Therehave also been radical changes in Irish social structureand religious attitudes.
GDP Unemployment Suicide Risk of poverty60
50
40
30
20
10
0
25
20
15
10
5
0
GD
P E
uro
s (T
ho
usa
nd
s)
Un
em
plo
yme
nt
Pe
rce
nta
ge
Finland
Belgium
Austri
a
Franc
e
Luxe
mbo
urg
Denm
ark
Ireland
Ger
man
y
Sweden
Nethe
rland
s
Spain
UK and
N. I
reland Ita
ly
Portu
gal
Gre
ece
0
5
10
15
20
25
30
35
40
45
Finla
nd
Belgiu
m
Austria
Luxem
bourg
France
Irela
nd
Ger
man
y
Denm
ark
Swed
en
Nether
lands
Spain
Italy
United K
ingdom
Portugal
Gre
ece
Male Female
0
5
10
15
20
25
Belgium
Finlan
d
Luxe
mbo
urg
Franc
e
Denm
ark
Austri
a
Sweden
Norway
Nethe
rland
s
Germ
any
Irelan
d
Spain
Italy
Portu
gal
Greec
e
United
King
dom
Females 0-64 years Females 65+ years
05
1015202530354045505560657075
Finlan
d
Belgi
um
Luxe
mbour
g
Austri
a
Franc
e
Irela
nd
Germ
any
Sweden
Denmar
k
Norway
Nethe
rland
s
United
King
dom
Spain
Italy
Portu
gal
Gre
ece
Males 0-64 years Males 65+ years
27
3
M E N T A L H E A L T H S T A T U S I N E U R O P E
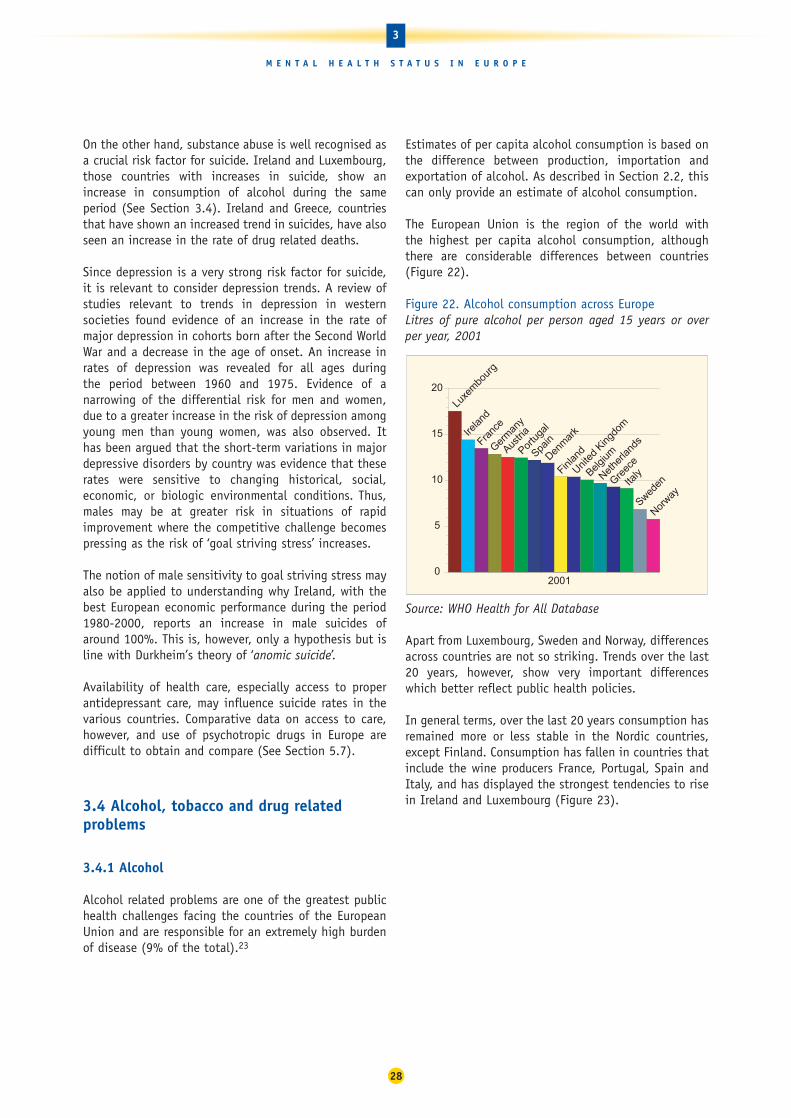
On the other hand, substance abuse is well recognised asa crucial risk factor for suicide. Ireland and Luxembourg,those countries with increases in suicide, show anincrease in consumption of alcohol during the sameperiod (See Section 3.4). Ireland and Greece, countriesthat have shown an increased trend in suicides, have alsoseen an increase in the rate of drug related deaths.
Since depression is a very strong risk factor for suicide,it is relevant to consider depression trends. A review ofstudies relevant to trends in depression in westernsocieties found evidence of an increase in the rate ofmajor depression in cohorts born after the Second WorldWar and a decrease in the age of onset. An increase inrates of depression was revealed for all ages during the period between 1960 and 1975. Evidence of anarrowing of the differential risk for men and women,due to a greater increase in the risk of depression amongyoung men than young women, was also observed. Ithas been argued that the short-term variations in majordepressive disorders by country was evidence that theserates were sensitive to changing historical, social,economic, or biologic environmental conditions. Thus,males may be at greater risk in situations of rapidimprovement where the competitive challenge becomespressing as the risk of ‘goal striving stress’ increases.
The notion of male sensitivity to goal striving stress mayalso be applied to understanding why Ireland, with thebest European economic performance during the period1980-2000, reports an increase in male suicides ofaround 100%. This is, however, only a hypothesis but isline with Durkheim’s theory of ‘anomic suicide’.
Availability of health care, especially access to properantidepressant care, may influence suicide rates in thevarious countries. Comparative data on access to care,however, and use of psychotropic drugs in Europe aredifficult to obtain and compare (See Section 5.7).
3.4 Alcohol, tobacco and drug relatedproblems
3.4.1 Alcohol
Alcohol related problems are one of the greatest publichealth challenges facing the countries of the EuropeanUnion and are responsible for an extremely high burdenof disease (9% of the total).23
Estimates of per capita alcohol consumption is based onthe difference between production, importation andexportation of alcohol. As described in Section 2.2, thiscan only provide an estimate of alcohol consumption.
The European Union is the region of the world with the highest per capita alcohol consumption, althoughthere are considerable differences between countries (Figure 22).
Figure 22. Alcohol consumption across EuropeLitres of pure alcohol per person aged 15 years or over per year, 2001
Source: WHO Health for All Database
Apart from Luxembourg, Sweden and Norway, differencesacross countries are not so striking. Trends over the last20 years, however, show very important differenceswhich better reflect public health policies.
In general terms, over the last 20 years consumption hasremained more or less stable in the Nordic countries,except Finland. Consumption has fallen in countries thatinclude the wine producers France, Portugal, Spain andItaly, and has displayed the strongest tendencies to risein Ireland and Luxembourg (Figure 23).
0
5
10
15
20
Austri
a
BelgiumDen
mar
k
Finlan
dFra
nce
Germ
any
Greec
e
Irelan
d
Italy
Luxe
mbo
urg
Nethe
rland
s
Norway
Portu
gal
Spain
Sweden
United
King
dom
2001
28
3
M E N T A L H E A L T H S T A T U S I N E U R O P E

Figure 23. Trend in alcohol consumption 1980 – 2001Pure alcohol consumption, litres per capita age 15+,both sexes, in the European Union and Norway. Redlines indicate a decrease and green lines represent an increase
Source: WHO Health for All Database
From a public health perspective, alcohol has an impactin such diverse areas as road accidents, organicmorbidity/mortality, suicide and domestic violence, forwhich the existing data are fragmented and almostalways fall short of the reality. There have been seriousattempts in the last few years to address this problem offragmentation of information about alcohol-relatedproblems. Particularly notable is the Global AlcoholDatabase which WHO has been developing since 1997.
Alcohol abuse is associated with many healthconditions, such as liver disease, hypertension, andpsychiatric disorders, as well as with violence, homicide,dangerous driving and accidents. Alcohol abuse is alsooften associated with abuse of other drugs.
It is estimated that about 50% of all deaths in theEuropean Region from intentional and unintentionalinjury are attributable to alcohol consumption.24 Alcoholuse and alcohol-related harm, such as drunkenness,binge drinking and alcohol-related social problems arefrequent among adolescents and young people,particularly in Western Europe.
Alcohol-related mortality has fallen in all countriesincluding those where alcohol consumption has risen,such as Ireland and Finland. This decrease is probablydue to better access to care and lower toxicity ofalcoholic beverages.
Figure 24. Trends in alcohol related death 1980 – 1997Standardised death rates per 100,000 population,alcohol-related deaths for countries with available data.Red lines indicate a decrease and green lines representan increase
Source: WHO Health for All Database
3.4.1.1 European survey findings on alcohol
Data from reported population alcohol sales or alcohol-related deaths do not describe the phenomenacompletely. Alcohol consumption is levelling. Forexample, a country where most of the people aremoderate drinkers will have the same averageconsumption as a country with heavy drinkers and a highrate of abstinence when the risks for health arecompletely different.
Epidemiological surveys could be a useful method toevaluate consumption patterns. However, data arecollected by self declaration and alcohol problems are subject to denial, which usually results inunderestimation.
The ESEMeD study assessed the prevalence of alcoholdisorders in six European studies in the same way (Figure 25).
Value
Great Britain andNorthern Ireland
Spain
Portugal
Netherlands
Italy
Ireland
Greece
France
Belgium
Austria
40 50 60 70 80 90 100 110 120 130 140 150 160 1706 7 8 9 10 11 12 13 14 15 16 17 18 19 20 21
Value
Great Britain andNorthern Ireland
Sweden
Spain
Portugal
Norway
Netherlands
Luxembourg
Italy
Ireland
Greece
France
Finland
Denmark
Belgium
Austria
5
29
3
M E N T A L H E A L T H S T A T U S I N E U R O P E

Figure 25. Occurrence of alcohol disorders in men andin women in six European countries Percentage of men and women with lifetime prevalence ofalcohol disorders, according to DSM IV diagnosis
Source: ESEMeD
As expected, in all countries men have higher rates thanwomen. Italy has a significantly lower rate than all theother countries and this corresponds to a lowerconsumption per inhabitant and to the biggest decreasein consumption.
Figure 26 shows the relative prevalence of alcohol disordersin men and women in five countries relative to Italy.
Figure 26. Effect of country on relative risk of lifetimealcohol disorders Relative risk adjusted, Italy as a reference
Source: ESEMeD
Compared to Italy, all countries have significantlyincreased odds for alcohol disorders.
3.4.2 Tobacco
Cigarette smoking is also relevant to mental health sincenicotine dependence has been defined as an addictivedisorder. In addition, there is evidence that smoking ismore common among people with mental disorders thanin the general population.
Smoking varies across Europe. Figure 27 shows thenumber of cigarettes consumed annually per person ineach country.
Figure 27. Cigarettes consumed per person per year inEU countries and NorwayNumber of cigarettes consumed per person per year, 1997
Source: WHO Health for All Database
The health consequences of smoking are well known andthe enormous implications for mortality and morbidityamong European populations well documented. Smokingkills thousands of people each year in the EU andNorway. Figure 28 illustrates the mortality from selectedsmoking-related causes in EU countries and Norway.
Smoking can result in serious conditions like lungcancer, ateriosclerosis and Chronic Obstructive LungDisease (COLD). Passive smoking has also been shown tobe a risk factor for developing serious medical diseases.
0
500
1000
1500
2000
2500
3000
Austri
aBelg
iumDenm
ark
Finlan
d
Franc
e
Germ
any
Greec
e
Irelan
dIta
ly
Nethe
rland
s
Norway
Portu
gal
Spain
Sweden
United
King
dom
1997
8.747.58
6.415.58
3.13
0
4
2
6
8
10
12
14
Nether
lands
Belgiu
m
France
Germ
any
Spain
2.33
0.24
6.58
11.4712.73
14.5215.24
0.981.671.962.1
3.7
0
2
4
6
8
10
12
14
16
Netherlands Belgium France Germany Spain Italy
Men Women
30
3
M E N T A L H E A L T H S T A T U S I N E U R O P E

Figure 28. Deaths from smoking related causes in theEU and NorwayStandardised death rates from selected smoking relatedcauses per 100,000 population, 1997
Source: WHO Health for All Database
Creating a smoke free environment has been shown todecrease the number of cigarettes smoked andeliminates the risk of passive smoking. Among the EUcountries and Norway there are big differences inrestrictions of smoking in public places. In Ireland,Norway, France and Sweden rules have recently becomequite strict, whereas smoking in public places is stillpermitted in other countries. The introduction of nonsmoking areas in places like restaurants and bars willdecrease passive smoking and possibly also reduce thenumber of cigarettes consumed by smokers.
3.4.3 Drugs
Information on drug use and its consequences iscollected by the European Monitoring Centre for Drugsand Drug Addiction (EMCDDA) which publishes an annualreport on the state of the drug problem in the EuropeanUnion and Norway.
Cannabis remains the most commonly used drug in theEuropean Union and it is estimated that at least one inevery five adults in the EU has tried the drug (Figure 29).
Figure 29. Recent use of cannabis among young adults(15-34 years) in European Countries
Source: EMCDDA 200325
Data are from the most recent national surveys availablein each country. Sample sizes (n) refer to the number ofrespondents for the 15-34 age group. The standardEMCDDA definition of young adults is 15-34 years. InDenmark and the United Kingdom, young adults are aged16-34 years and in Germany and Ireland 18-34 years.Variations in age ranges may, to a small extent, accountfor some national differences. In some countries, thefigures were recalculated at the national level to adapt,as far as possible, to the standard EMCDDA age groups
Surveys also suggest an increase in cocaine use in theUK and, to a lesser extent, in Denmark, Germany and theNetherlands. Cocaine use tends to be more commonamong young people living in urban areas. Nationalfigures may, therefore, not reveal the true picture ofcocaine use in some major European cities.
Relatively high rates of drug treatment attendance forcocaine use are reported from the Netherlands and Spain(30% and 19% respectively). Rates of between 6% and8% are reported in Germany, Italy, Luxembourg and the UK.
10 < 15 %
5 < 10 %
0 < 5 %
8.1(1999)
(n = 794)4.9
(2000)(n = 615)
1(2000)
(n = 575)17.7 (2)(1998)
(n = n.a)
19.2 (3)(2001/02)(n = 7 464)
11. 8(2000/01)(n = 6 687)
13. 1(2000)
(n = 4 141)13
(2000)(n = 3 107)
17 (1)(2000)
(n = 4 749)
8.8(1998)
(n = 2 014)
9.4(2001)
(n = 3 689)
17. 3(2001)
(n = 6 915)
6.2(2001)
(n = 5 472)
15 %
0
50
100
150
200
250
300
350
400
Austri
a
Belgium
Denm
ark
Finlan
d
Franc
e
Germ
any
Greec
e
Irelan
d
ItalyLu
xem
bour
g
Nethe
rland
s
NorwayPor
tuga
l
SpainSwed
en
United
King
dom
1997
31
3
M E N T A L H E A L T H S T A T U S I N E U R O P E

Figure 30. Evolution of recent cannabis and cocaineuse in some EU countries
Trend in cannabis use
Trend in cocaine use
Source: European Monitoring Centre on Drugs and DrugAddiction, Annual Report 2003: the state of the drugsproblem in the European Union and Norway.26
NB: E&W is England and Wales. Data are from the mostrecent national survey available in each country. Thestandard EMCDDA definition of young adults is 15–34years. In Denmark and the United Kingdom, young adultsare aged 16–34 years and in Germany and Ireland 18–34years. In France, the age range is 25–34 (1992), 18–39(1995) but 15–34 for the other years. Sample sizes foreach survey can be obtained on the EMCDDA website.Denmark, the figure for 1994 is for use of ‘hard drugs’.Sources: Reitox national reports 2002, taken from surveys,reports or scientific articles.
After cannabis, the most commonly used drug in EUcountries is usually either ecstasy or amphetamine, withrates of lifetime experience among the adult populationgenerally ranging between 0.5 and 5%.
The prevalence of use of crack cocaine in Europe appears to be relatively low. There are, however, sporadic localreports suggesting a problem within marginal groups insome cities. Despite the low prevalence, any emergingtrends need to be carefully monitored because of thepotential public health impact of even a moderateincrease in crack cocaine use.
Every year there are between 7,000 and 9,000 acutedrug-related deaths reported in the EU. Most of thevictims are young people in their 20s or 30s.
In most cases (usually around 80%), opioids are found,often in combination with other substances. In a smallernumber of cases, cocaine or ecstasy alone is found.Some of the factors that appear to be associated withincreased risk of opioid-related deaths are druginjecting, polydrug use and, in particular, concurrent useof alcohol or depressants, loss of tolerance and notbeing in contact with treatment services.
The number of acute drug related deaths (‘overdoses’) issometimes used as a simplistic way of assessing acountry’s drug situation and to draw comparisons. Drugdeaths are a source of social and political concern,especially acute deaths among young people.
Many EU countries witnessed a marked increase of acutedrug related deaths in the second half of the 1980s andthe early 1990s. However, in recent years, the number ofacute deaths at the EU level as a whole has stabilised,between 7,000 and 8,000 per year, and in somecountries they have even decreased.
Multiple factors have probably contributed to the recentstabilisation of drug-related deaths. The number ofproblem drug users may have stabilised and treatmentdata suggest that risky practices, for example injecting,have also decreased in some countries. In addition,treatment interventions – including substitutionprogrammes – have expanded in many countries andmedical assistance for overdoses may have improved.
The stabilisation is consistent with the decrease inoverall mortality (in some cases also in overdose deaths)among cohorts of problem drug users.
6
5
4
3
2
0
1990
1991
1992
1993
1994
1995
1996
1997
1998
1999
2000
2001
2002
1
%
Finland
Netherlands
GermanyDenmark
France
Spain
UK (E&W)(16–29)
UK (E&W)(16–34)
30
25
20
15
10
0
1990
1991
1992
1993
1994
1995
1996
1997
1998
1999
2000
2001
2002
5
%
Finland
Sweden
Netherlands
Germany
Denmark
France
Spain
UK (E&W)(16–29)
UK (E&W)(16–34)
32
3
M E N T A L H E A L T H S T A T U S I N E U R O P E

Within the overall EU trend, different national trends areobserved:
• Several countries present a general downward trend,although with year to year fluctuations. For example,Austria, France, Germany, Luxembourg, Italy andSpain. Austria (1999), Germany (1999-2000) andLuxembourg (1997-98) reported new increasesrecently but they are not as high as previous values.
• Some countries have reported a substantial upwardtrend until recently – for example, Greece, Ireland (a decrease observed in 1999) and Portugal.
Figure 31. Trends in acute drug-related deaths in someEU countries, 1985-99Examples of divergent trends in some EU countriesIndexed all countries: 1985=100%
Overall trend in the European UnionIndexed: 1985=100
Source: European Monitoring Centre on Drugs and DrugAddiction, Annual Report, 2001: the state of the drugsproblem in the European Union and Norway.25 Data fromReitox national reports 2000, taken from nationalmortality registries or special registries (forensic or police).
NB: These trends can be calculated for all EU countries. A few are presented as examples. Proportional variationsover 1985 figures are presented. For Greece, the seriesbegins in 1986 to avoid distortion. In some countries withan increasing trend, improved reporting may account forpart of the increase. Not all countries provided data for allyears, but this situation has been controlled in the analysis.
Direct comparisons between countries can be misleadingbecause the number of drug-related deaths depends notonly on the prevalence of problem drug use and the riskpatterns (such as injection) but also on nationaldefinitions and recording methods.
Where definitions, methods and quality of reportingremain consistent within a given country, the statisticscan indicate trends over time and, if correctly analysedand integrated with other indicators, can be valuable inmonitoring the more extreme patterns of drug use.
%
0
50
100
150
200
250
300
350
1998
1985
1986
1987
1988
1989
1990
1991
1992
1993
1994
1995
1996
1997
1999
UK (Englandand Wales)
0
100
200
300
400
500
600
700
800
900
1 000
Greece
Germany
Ireland
Spain
France
%
1998
1985
1986
1987
1988
1989
1990
1991
1992
1993
1994
1995
1996
1997
1999
33
3
M E N T A L H E A L T H S T A T U S I N E U R O P E

Since mental health has many determinants, it has beenestablished that some factors will protect a person andincrease his or her resilience to the various stresses heor she may be exposed to. Conversely, some factors areconsidered to be risk factors and these will increasevulnerability. It is important to recognise these riskfactors in order to prevent psychological distress and,potentially, psychiatric disorders.
Most environmental factors have a positive or negativeinfluence on mental health and when policy makers wantto set up prevention programmes it is essential to knowhow much these various factors could be protective orcould constitute a risk. Comparison of these dimensionsacross the EU may help Member States to conductstudies on specific risks for some members of theirpopulation, and to set up mental health promotion andprevention programmes for those at risk.
4.1 Gender and mental health
Mental health problems, which are different frompsychiatric disorders, vary across gender. Women havehigher rates of depression and anxiety (referred to asinternalising disorders) and men have higher rates ofsubstance abuse and antisocial disorders (calledexternalising disorders). Gender differences in severemental health disorders, such as schizophrenia and bipolardisorders, are hardly noticeable but there are somedifferences. For schizophrenia, in men symptoms appearearlier in life, but in women hallucination is more frequentand psychotic symptoms are more noticeable. For bipolardisorders it appears that women have a shorter cycle, theysuffer from more related medical conditions and they aremore likely to be hospitalised for a manic episode.
Various possible factors contributing to the differencesin the mental health of men and women have beensuggested. The socio-economic gradient for health hasbeen repeatedly cited for men and women in nearly allsocieties. Economic inequality both for women and mencontributes to negative health outcomes and is alsoassociated with depression.1 It has been shown,however, that there is a steeper socio-economic gradientfor men than for women. There is evidence that evenafter controlling for occupational grade, perceived workconditions and gender roles, women had stillsignificantly more symptoms than men, which was notthe case for physical symptoms.2
4.1.1 Positive mental health and gender
Males have consistently higher scores than females forpositive mental health (Figure 32). However, there is nointeraction between gender and country which meansthat this male/female difference is rather constantacross countries.
Figure 32. Positive mental health in men and womenPositive mental health by score on the vitality subscaleof SF36 (from 0 to 100), according to gender
Source: Eurobarometer
4.1.2 Psychological distress, psychiatric disordersand gender
4.1.2.1 Psychological distress comparisons
Survey results based on measures of psychologicaldistress show higher levels of psychological distress, andhigher probability of mental ill-health, in women than inmen in most countries.
An attempt was made to collate results from all knownsurveys on prevalence of mental health problems inEurope for this report (see Section 2.2).
The meta-analysis confirmed that women generallysuffer from poorer mental health than men across manydifferent countries and regions. This trend holds true formost mental health problems defined and identified bythe two particular instruments assessed (GHQ in Figure33, CIDI in Figure 36). Figure 33 shows the effect ofgender on the risk of poor mental health as measured by
65.62
61.66
65.0963.1465.4965.4364.6964.21
66.5365.95
68.98
55.1255.83
57.9458.4859.4759.7761.2161.9762.39
63.3663.36
50
60
70
80
Spain
Nether
lands
Belgiu
m
Austria
Germ
any
(Old
Lan
der)
Germ
any
(New
Lan
der)
Luxem
bourg
France
Swed
enIta
ly
Portugal
Male Female
34
4
P R O T E C T I V E A N D R I S K F A C T O R S
Protective and risk factors4

the general health questionnaire (GHQ-12) whichidentifies people with a ‘probable mental health problem’.This plot is based on GHQ-12 studies from sevenpopulations.
Figure 33. The effect of gender on the risk of poormental healthOdds-ratios, log scale for men compared to women for‘caseness’ defined by GHQ-12 in seven studies
In the above diagram, each study is represented by a box.The size of the box is based on the number of surveyrespondents. The bigger boxes carry more weight in theanalysis. The further a box is to the left because it is lessthan 1, the lower the risk for males compared to females.The horizontal lines through the boxes show the 95%confidence intervals. If the line crosses the vertical axis at1, then the results are of doubtful significance. Thecombined odds ratio for all the data from all the studiesis shown in the diamond shape suggesting that men havejust under two-thirds of the risk of poor mental healththat women have.
Figure 34. Relative risk of psychological distress forwomen compared to men in some EU countriesOdds-ratio for females compared to males with MHI-5
Source: Data from Eurobarometer Survey, October 2002
The Eurobarometer survey, which included a measure ofpsychological distress using the MHI-5 scale, allows forcalculation of probable cases of mental ill-health and tocompare the risk by gender (Figure 34). In each countryexcept three – Netherlands, Austria and Luxembourg –females have higher risk than males. However, withinthe countries where the risk is significantly higher forfemales, Portugal shows a much larger risk for womenthan the other countries (except Sweden and Italy). Ithas to be carefully noted that higher relative risks forwomen compared to men, do not mean that thesewomen necessarily are more at risk, but that their riskcompared to men is higher.
Figure 35. Psychological distress in males and femalesin some EU countries Mental health score on the SF-12 sub-scale in sixESEMedD countries and the UK, weighted.
Source: ESEMeD and UK psychiatric morbidity survey
In the ESEMeD study, the mental health score derivedfrom SF-12 is lower for females than males in allcountries. However, statistical tests show a positiveinteraction between gender and ESEMeD countries (0.01)which means that the gender difference does varyaccording to country. (It was not possible to integratethe UK results in the interaction). As a matter of fact,gender differences were larger in Spain, Italy and Francecompared to the Netherlands, Germany and Belgium.
When Eurobarometer and ESEMeD psychological distressdata are compared, it seems that consistent female/maledifferences exist for France, Spain and Italy and that thedifference is smaller, if it exists, in the Netherlands andGermany. For Belgium, a larger difference exists with theEurobarometer approach (MHI-5) than with the ESEMeDapproach (SF-12 MH score).
3.8
1.6
4.414.91
5.735.285.145.37
1.882.55
3.53.83.813.86
0
1
2
3
4
5
6
7
Netherlands Germany Belgium UnitedKingdom
Spain Italy France
Men Women
0.99
1.341.53
1.441.53 1.57 1.68 1.71 1.85 1.9
3.17
0
0.5
1
1.5
2
2.5
3
3.5
4
4.5
5
Nether
lands
Austria
Germ
any (
Old La
nder
)
Spain
Luxe
mbo
urg
Belgium
Germ
any (
New La
nder
)
Fran
ce
SwedenIta
ly
Portu
gal
Odds ratio (log scale).4 .5 .6 .7 .8 .9 1
Combined
Catalonia
Austria
NI
Wallonie
Brussels
Flanders
England
35
4
P R O T E C T I V E A N D R I S K F A C T O R S

It has to be stressed that in most of the countries wherethe psychological distress is the highest – France,Portugal and Italy – the female/male rates are thehighest and, conversely, in the country with the lowestpsychological distress – the Netherlands – there was nodifference. Thus, the female psychological distresscontributes to a large part of the difference betweencountries. Sweden is an exception with a low rate and ahigh female/male ratio.
4.1.2.2 Depression and gender
Several epidemiological studies have shown the higherprevalence of depression among women than among menincluding the results of our survey of surveys.
The meta-analysis of population surveys (see Section 2.2and Annex I) also confirmed that women are at a greaterrisk of major depressive episodes as measured by theCIDI questionnaire (Figure 36). However this relativerisk does not differ significantly between countries.
Figure 36. The effect of gender on the risk of depressionOdds ratio for gender, log scale, on the 12 month risk ofmajor depressive disorders, CIDI data
See Figure 33 for more guidance on interpreting thisfigure. The combined odds ratio for all the data from allthe studies is shown in the diamond shape – suggestingthat men consistently have only about half the risk ofmajor depression in any 12 month period than women.
Figure 37. Effect of gender for the risk of moodDisorders in six EU countriesOdds ratio female to male
Source: ESEMeD
Women consistently score higher than men for any 12-month mood disorder. However, there is no differenceacross countries even though southern Europeancountries seem to carry a slightly higher risk.
4.1.2.3 Anxiety and gender
There are also gender differences in the prevalence ofanxiety disorders. Figure 38 shows the relative risk forwomen compared to men of any anxiety disorder in thelast twelve months in the six country Esemed study.
Figure 38. Effect of gender for the risk of AnxietyDisorders in six EU countriesOdds ratio female to male
Source: ESEMeD
1..20
1.74
2.63
3.27 3.413.8
0.00
1.00
2.00
3.00
4.00
5.00
6.00
Belgium Germany France Spain Italy The Netherlands
1.72 1.78 1.85
2.31
2.86
2,0
0.00
1.00
2.00
3.00
4.00
5.00
Belgium Germany France The Netherlands Italy Spain
Odds ratio for gender - log scale.2 .3 .4 .5 .6 .7 .8 .9 1
Combined
Finland
B. Normandy
N. Germany
Netherlands
All Germany
36
4
P R O T E C T I V E A N D R I S K F A C T O R S

Spanish, Dutch and Italian women have higher relativerisks – with men as reference – than their Belgiancounterparts and Italians more than Germans. Thiscomparison is particularly relevant since in the countrieswhere the risks are the lowest – Italy and Spain – womenhave relative risks higher than in other countries.Conversely, in countries where risks are relatively high,such as Belgium, France and Germany, the relative risk tomen is lower. Netherlands is the less favored since itcombines high rates and a higher relative risk for women.
4.1.2.4 Any mental health disorders
The ESEMeD study also enabled comparison of therelative risk for women compared to men of any mentalhealth disorders (Figure 39).
Figure 39. Effect of gender for the risk of any disordersin six EU countriesOdds ratio female to male.
Source: ESEMeD
When all disorders are put together, including alcoholdisorders, women still have a higher risk, except inBelgium. Italy and Spain carry more relative mentalhealth risks for women than Germany and Belgium.
4.1.3 Suicide, violence and gender
Suicide rates are consistently higher in men than inwomen. The ratio of male to female suicides does varybetween countries. Figure 40 shows the ratio of male tofemale suicides across Europe.
Figure 40. Ratio of male to female deaths from suicidein EU countriesRatio of standardised death rates, suicide and self-inflicted harm, all ages per 100,000, 1997
Source: WHO Health for All Database
The average ratio for male to female suicides for Europerestricted to 15 Member States is 3.1. The ratio in 1997varies from 2.1 to 4.1 with one outsider, namely Greece,showing a ratio of 6.2. The general tendency is thatsouthern countries have higher male to female ratios butthere are some exceptions, like Ireland and Finland.When we extend the scope of countries to the candidateMember States of Europe, the ratios are even biggerreaching ratios between five and seven.
The ratio of male to female suicides has, in general,increased over the last ten years (see Figure 41). Theincrease has been bigger is some countries than in others.
0
1
2
3
4
5
6
7
Austri
a
Belgium
Denm
ark
Finlan
d
Franc
eGer
man
y
Greec
e
Irelan
d
Italy
Luxe
mbo
urg
Nethe
rland
s
Norway
Portu
gal
Spain
Sweden
United
King
dom
1997
1.021.40
1.75
2.24 2.342.57
0,00
1,00
2,00
3,00
4,00
5,00
6,00
Belgium Germany France TheNetherlands
Spain Italy
37
4
P R O T E C T I V E A N D R I S K F A C T O R S

Figure 41. Ratio of male to female suicides acrossEurope, 1987 and 1997Ratio of standardised death rates, suicide and self-inflicted harm, all ages per 100,000, 1987 and 1997
Source: WHO Health for All Database
Men are also more at risk from violent death thanwomen.3 In Europe as a whole, over 8.5 men per 100,000of the male population die as a result of murder. Incomparison, 3.9 women per 100,000 are murdered.
The variation between European countries in mortalityby intentional injuries is considerable, ranging from 6.9in Greece to 37.3 in Finland for rates in males. The ratioof male to female deaths by intentional injury also variesbetween countries: from 2.1 in the Netherlands to 4.2 in Ireland.
In stark contrast to the differences between men andwomen in deaths from suicide across Europe, womenattempt suicide more than men.4 Similarly, althoughthere are more violent deaths in men, more women haveexperienced some form of violence.3 In the Europeanregion it appears that 20 to 50% of women haveexperienced some form of violence, even though muchviolence is under-reported.
4.2 Age and mental health
Age and mental health has to be studied in twodirections: the relative risk for the young populationcompared to the adult population and mental health ofolder people.
4.2.1 Mental health and young adults
This report was dedicated to the adult population only.There are some data, however, which concern youngpeople (Eurobarometer and ESEMeD) so some results forpeople aged 15 to 24 years in the EU can be presented.It should also be mentioned that a report on the healthof young people has been published by the EU relativelyrecently.5
4.2.1.1 Psychological distress and young adults
For psychological distress there are two studies withresults for young people which enable comparisons.
Figure 42. Relative risk of psychological distress for young peopleRelative risk of psychological distress in 15-24 year oldscompared with 25-64 year olds in 11 Eurobarometercountries
Source: Eurobarometer, October 2002
In the Eurobarometer survey no difference was found inthe different countries except for Portugal, and to a lesserdegree Spain and France, where young people carry a lowerrisk than other adults. These are relative comparisons witholder adults, however, so these young people could havehigher rates than their counterparts in other countries ifadult rates are very high in their country.
0.610.43
0.63 0.64 0.65 0.72 0.75 0.8 0.83 0.97
1.38
0
0.5
1
1.5
2
2.5
Belgium
Portu
gal
Spain
Austri
a
Fran
ce
Luxe
mbo
urg
Nethe
rland
s
East G
erm
any
Italy
Wes
t Ger
man
y
Sweden
<= 700
<= 580
<= 460
<= 340
<= 220
No dataMin = 100
Male/Female ratio suicide all ages (in %)
1997
EUROPE452.24
<= 700
<= 580
<= 460
<= 340
<= 220
No dataMin = 100
Male/Female ratio suicide all ages (in %)
1987
EUROPE320.9
38
4
P R O T E C T I V E A N D R I S K F A C T O R S

Figure 43. Psychological distress in seven EU countriesMental health score from SF-12 for six ESEMeD countriesand UK national survey in 18-25 year olds comparedwith 25-64 year olds
Source ESEMeD and UK psychiatric morbidity survey
Figure 43 shows the SF-12 mental health scores fordifferent age groups in the six-country ESEMeD studyand the UK. A lower score indicates a poorer state ofmental health. The interaction is very significant (0.00):in Germany and Belgium younger people have a poorermental health score than the adults, while in Italy andthe UK it is the reverse. France, Spain and Netherlandsdo not have differences.
These results differ from the Eurobarometer findings and this may be due to the different age brackets – Eurobarometer having included the 15 to 17 year age group.
4.2.1.2 Psychiatric disorders and young people
The ESEMeD study allows comparison of diagnoses forthose aged between 18 and 24 years.
Figure 44. Relative risk of any mental health disordersin young people in six EU countriesOdds ratio for 18-24 year olds compared to the adultpopulation for any mental health disorders in the last 12 months
Source: ESEMeD
In the ESEMeD countries young people have no higherrisk that the adult population: except for France whenany disorders are considered. However, when the type ofdisorder is considered, it appears that the youngpopulation is more at risk of anxiety disorders in Spainand Germany (Figure 45).
Figure 45. Relative risk of anxiety disorders in young people in six EU countriesRelative risk for anxiety disorders in the last 12 monthsfor 18-24 year olds compared to the adult population
Source : ESEMeD
ESEMeD shows poorer mental health in some of thecountries and when diagnostic and psychologicaldistress results are put together, young people seem to have poorer mental health than adults. Thisconsideration has to include increasing drugconsumption in most countries that mainly concerns theyoung population. In addition, it has to be rememberedthat comparing relative risk between young and adultsat a certain time does not provide any information aboutevolution over time. Also, a non-significant relative riskmay conceal increasingly negative mental health inEurope’s young population.
4.2.2 Mental health in old age
During the 20th Century, the age structure of thepopulation changed substantially (see Section 2.1).Dramatic demographic changes have resulted in anincrease of elderly people in terms of their absolutenumber and in terms of their proportion of the wholepopulation. It is estimated that the proportion of theEuropean population over 65 will rise from 22% in 2000to 30% in 2025.6 The number of oldest old will increasedisproportionately. With these changes underway, agingand the special circumstances of older people are takingan increasingly central place in public health.
Mental disorders in old age are common. The most seriousthreats to mental health in old age are posed bydepression and dementia.7-11 Serious consequences of depression are reduced functioning, impaired quality of
0.730.97
1.29 1.3
1.65
1.97
0
0.5
1
1.5
2
2.5
3
3.5
Netherlands Italy Belgium France Spain Germany
0.831.04 1.12
1.421.7
2
0
0.5
1
1.5
2
2.5
3
3.5
4
Spain Netherlands Belgium Italy Germany France
1.76
2.3
5.28
4.46
4.31
4.01
3.4
2.68
4.2
3.17
4.12
3.68
4.244.38
0
1
2
3
4
5
6
UnitedKingdom
Italy Netherlands Spain Belgium Germany France
18-25 25-64
39
4
P R O T E C T I V E A N D R I S K F A C T O R S

life, increased suicide rates and increased non-suicidemortality. Dementia, and particularly Alzheimer’s disease,is the principal cause of disability among the elderly.12
4.2.2.1 Psychological distress and age
The 2002 Eurobarometer study measured psychologicaldistress in different age groups (Figure 46).
Figure 46. Risk of psychological distress in older peopleOdds ratio showing relative risk of psychological distressin people aged 65 years or over compared to adults aged26-64 years in ten Eurobarometer countries
Source: Eurobarometer
In the Eurobarometer, Sweden has a lower risk for olderpeople and three countries have higher risk: Austria,Germany and Portugal.
Figure 47. Psychological distress in older peopleSF-12 scores in adults aged 65 and over and those aged25-64 in six ESEMeD countries and the United Kingdom
Source: ESEMeD and UK psychiatric morbidity survey
In ESEMeD, Italy remains the only country where theolder group’s mental health scores are lower than thoseof the adult population. The remaining countries, exceptSpain, have better mental health for older people. Theinteraction is very significant (0.00, UK excluded).
4.2.2.2 Depression and old age
Prevalence of depression in old age has been widelystudied across Europe.13-45 Studies include bothpopulation surveys using dimensional diagnoses, whichcharacterise a person on a scale from healthy to severelydepressed. There are also community surveys which haveapplied categorical diagnoses and use specificdiagnostic tools to decide whether someone meets thecriteria of a diagnostic case or not.
This research provides broad agreement that majordepression, as defined by recent classificatory systems,appears to be a relatively rare disease among the elderly.Most of the studies report prevalence rates under 5%.Some Nordic surveys report slightly higher rates. Asystematic review done by Beekman46 including 16world-wide studies with 22,794 subjects publishedbetween 1989 and 1996 yielded an average prevalencerate of major depression of 1.8%.
When all depressive syndromes deemed clinicallyrelevant are considered, however, it has been shown thatthese conditions are very common in the elderly. Theprevalence of depressive syndromes ascertained bycategorical diagnosis varies between 7.9% and 26.9%.The majority of these studies give results between nineand 15%. Prevalence rates of depressive syndromesascertained by dimensional diagnosis are even slightlyhigher and vary between 9.8 and 27.5%, whereas all butone of the study results are between 13% and 28%. Ananalysis of 28 worldwide studies (involving over 46,000people) found an average rate of all depressivesyndromes of 13.34%.47 A meta-analysis includingresults from nine European study centres applying thesame standardized assessment method (GMS-AGECAT)which was carried out in the framework of the EURODEPprogramme revealed an overall prevalence of 12.3% in atotal of 13,808 subjects.
Divergence of findings may be due to real differences inthe prevalence of depression across regions and are ofgreat interest as they can help us to understand theaetiology and cultural-ecological roots of depression.However, at the current state of research, variationfound in the prevalence rates may be attributed largelyto methodological differences (see Section 2.2). One ofthe main problems seems to be the definition of cases.However, even if the same definition is used, such asthose studies involved in the EURODEP programme, greatvariation without obvious explanation still exists.
The ESEMeD study included a substantial number of non-institutionalised individuals aged over 65 in eachcountry. Preliminary results regarding lifetime prevalenceof depression in old age are shown in Table 3
2.292.3
3.173.47
4.33
5.815.81
6.326.4
3.68
4.384.244.24.12
0
1
2
3
4
5
6
7
UnitedKingdom
Germany Belgium Netherlands France Spain Italy
>65 25-64
0.81 0.871.19 1.3
1.76 1.82
0.52 0.841.04
1.53
2.45
0
0.5
1
1.5
2
2.5
3
3.5
4
Sweden
Luxem
bourg
Belgiu
m
Nether
lands
Italy
France
Germ
any
(New
Lan
der)
Germ
any
(Old
Lan
der)
Spain
Austria
Portugal
40
4
P R O T E C T I V E A N D R I S K F A C T O R S
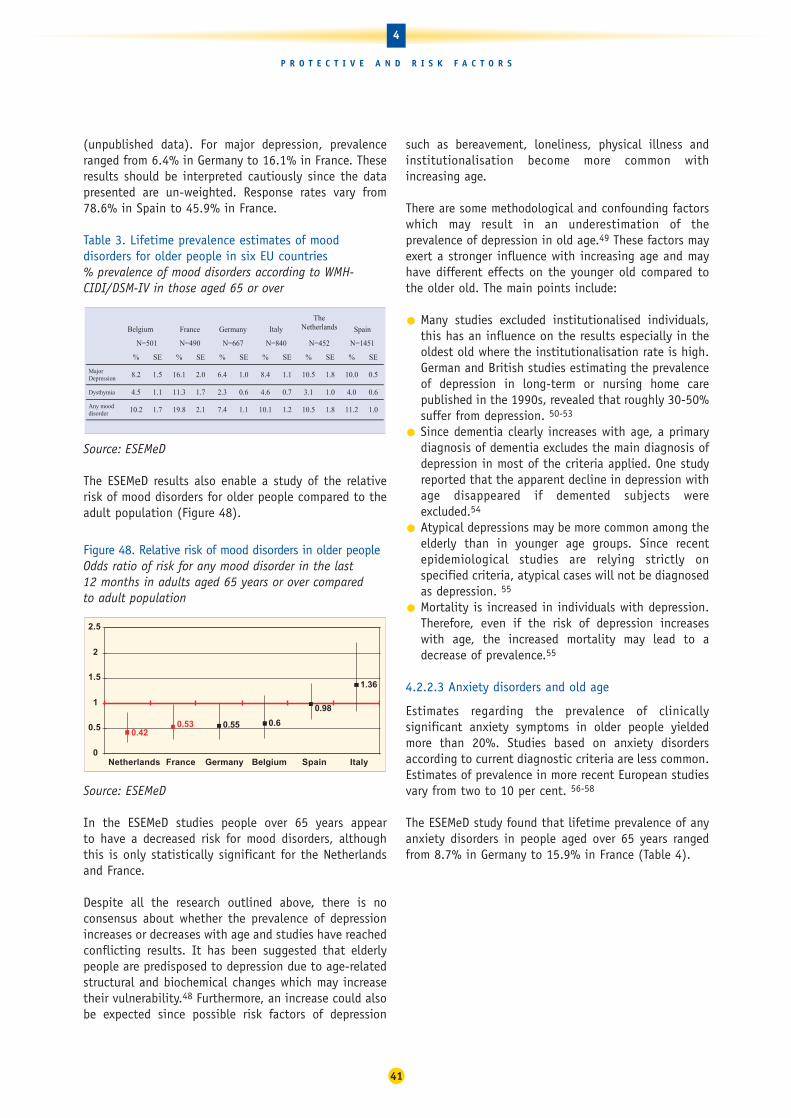
(unpublished data). For major depression, prevalenceranged from 6.4% in Germany to 16.1% in France. Theseresults should be interpreted cautiously since the datapresented are un-weighted. Response rates vary from78.6% in Spain to 45.9% in France.
Table 3. Lifetime prevalence estimates of mooddisorders for older people in six EU countries% prevalence of mood disorders according to WMH-CIDI/DSM-IV in those aged 65 or over
Source: ESEMeD
The ESEMeD results also enable a study of the relativerisk of mood disorders for older people compared to theadult population (Figure 48).
Figure 48. Relative risk of mood disorders in older peopleOdds ratio of risk for any mood disorder in the last 12 months in adults aged 65 years or over compared to adult population
Source: ESEMeD
In the ESEMeD studies people over 65 years appear to have a decreased risk for mood disorders, althoughthis is only statistically significant for the Netherlandsand France.
Despite all the research outlined above, there is noconsensus about whether the prevalence of depressionincreases or decreases with age and studies have reachedconflicting results. It has been suggested that elderlypeople are predisposed to depression due to age-relatedstructural and biochemical changes which may increasetheir vulnerability.48 Furthermore, an increase could alsobe expected since possible risk factors of depression
such as bereavement, loneliness, physical illness andinstitutionalisation become more common withincreasing age.
There are some methodological and confounding factorswhich may result in an underestimation of theprevalence of depression in old age.49 These factors mayexert a stronger influence with increasing age and mayhave different effects on the younger old compared tothe older old. The main points include:
• Many studies excluded institutionalised individuals,this has an influence on the results especially in theoldest old where the institutionalisation rate is high.German and British studies estimating the prevalenceof depression in long-term or nursing home carepublished in the 1990s, revealed that roughly 30-50%suffer from depression. 50-53
• Since dementia clearly increases with age, a primarydiagnosis of dementia excludes the main diagnosis ofdepression in most of the criteria applied. One studyreported that the apparent decline in depression withage disappeared if demented subjects wereexcluded.54
• Atypical depressions may be more common among theelderly than in younger age groups. Since recentepidemiological studies are relying strictly onspecified criteria, atypical cases will not be diagnosedas depression. 55
• Mortality is increased in individuals with depression.Therefore, even if the risk of depression increaseswith age, the increased mortality may lead to adecrease of prevalence.55
4.2.2.3 Anxiety disorders and old age
Estimates regarding the prevalence of clinicallysignificant anxiety symptoms in older people yieldedmore than 20%. Studies based on anxiety disordersaccording to current diagnostic criteria are less common.Estimates of prevalence in more recent European studiesvary from two to 10 per cent. 56-58
The ESEMeD study found that lifetime prevalence of anyanxiety disorders in people aged over 65 years rangedfrom 8.7% in Germany to 15.9% in France (Table 4).
0.420.53 0.55 0.6
0.98
1.36
0
0.5
1
1.5
2
2.5
Netherlands France Germany Belgium Spain Italy
Belgium France Germany Italy
TheNetherlands Spain
N=501 N=490 N=667 N=840 N=452 N=1451
% SE % SE % SE % SE % SE % SE
MajorDepression 8.2 1.5 16.1 2.0 6.4 1.0 8.4 1.1 10.5 1.8 10.0 0.5
Dysthymia 4.5 1.1 11.3 1.7 2.3 0.6 4.6 0.7 3.1 1.0 4.0 0.6
Any mooddisorder 10.2 1.7 19.8 2.1 7.4 1.1 10.1 1.2 10.5 1.8 11.2 1.0
41
4
P R O T E C T I V E A N D R I S K F A C T O R S

Table 4. Anxiety disorder in older people in sixEuropean countries% prevalence of anxiety disorders in people 65 years or over
Source: ESEMeD
ESEMeD results also enable comparison of the relativerisk of anxiety disorders for older people (Figure 49).
Figure 49. Relative risk of anxiety disorders in older peopleOdds ratio for relative risk of any anxiety disorder in thelast 12 months for people 65 years or over in six ESEMeDcountries, Reference adults 25-64
Source: ESEMeD
For anxiety disorders most of the countries have lowerrisk for those aged 65 and over for anxiety disordersexcept the two Southern European countries, Spain andItaly, where the risks was not significant.
4.2.2.4 Dementia and old age
Dementia presents an enormous challenge for Europe’shealth and social care systems. It is estimated that thenumber of dementia cases in Europe will rise from 7.1million in 2000 to about 16.2 million by 2050.
Dementia syndromes are among the most devastating ofall illnesses. Dementia is the most important age-relateddisorder. The prevalence is low among people under theage of 65 and increases exponentially with age.
The EURODEM research group pooled and re-analysedoriginal data of prevalence studies of dementia carriedout in some European countries between 1980 and 1990.From the 23 datasets of European surveys considered, 12were selected for comparison. The overall Europeanprevalence rates for the five-year age groups from 60 to94 years, were 1.0, 1.4, 4.1, 5.7, 13.0, 21.6 and 32.2%,respectively.59
Recent European studies, published from 1989/90onwards, suggest that age-specific prevalence rates fordementia still vary substantially.60-93 Variation amongstudies conducted in different European regions seemsto reflect methodological differences rather than realdifferences. Despite the fact that field studies in theelderly face special challenges which may reduceresponse rate (high mortality, functional dependency,sensory impairment, institutionalisation), littleattention has been paid to the discussion of recruitmentobstacles and sampling issues to date.94
To obtain more stable estimates of age- and sex-specificprevalence, 10 years after the EURODEM estimates, a studycompared prevalence of dementia across recent Europeanpopulation-based studies of persons 65 years and older.95 Thirteen studies completed in Europe during the1990s were pooled. A total of 2,346 cases of mild to severe dementia were identified in 11 cohorts. Age-standardized prevalence was 6.4% for dementia (all causes). The prevalence of dementia increasedcontinuously with age and was 0.8% in the group age 65to 69 years and 28.5% at age 90 years and older. The agepattern seems to be stable over time as there is a generalsimilarity between the findings of this study and theresults based on studies conducted in the previous decade.
4.2.2.5 Alcohol and drug problems and age
The subject of alcoholism in late life has receivedrelatively little attention in the literature. This is despitethe fact that elderly people are particularly vulnerable tothe adverse effects of alcohol. The prevalence of alcoholuse disorders in elderly people is generally accepted tobe lower than in younger people, but rates may beunderestimated because of non-detection.
Very few representative surveys conducted in Europereport on substance-related disorders, especially onalcoholism, in late life. The six-country ESEMeD studylooked at the lifetime prevalence of alcohol abuse andalcohol dependency. The results for the over 65 agegroup are shown in Table 5.
0.360.42 0.43
0.57
0.76 0.786
0
0.2
0.4
0.6
0.8
1
1.2
1.4
France Germany Belgium Netherlands Italy Spain
Belgium France Germany Italy
TheNetherlands Spain
N=501 N=490 N=667 N=840 N=452 N=1451
% SE % SE % SE % SE % SE % SE
GeneralizedAnxietyDisorder
2.2 0.9 4.6 1.2 0.4 0.2 1.9 0.5 0.9 0.4 1.7 0.3
Social Phobia 0.3 0.3 1.5 0.7 0.6 0.3 0.6 0.3 0.7 0.5 0.4 0.2
Specific Phobia 7.3 1.3 9.2 1.6 6.6 1.0 4.1 0.8 6.4 1.2 3.4 0.5
PTSD 2.0 0.8 2.6 1.1 0.9 0.4 2.2 0.7 1.4 0.7 1.2 0.4
Agoraphobia 0.5 0.4 0.7 0.4 0.4 0.3 0.7 0.3 0.1 0.1 0.4 0.2
Panic Disorder 0.4 0.4 1.5 0.7 0.5 0.2 1.1 0.4 1.5 0.7 1.1 0.3
Any anxietydisorder
10.1 1.6 15.9 2.1 8.7 1.1 8.9 1.1 10.5 1.5 7.0 0.8
42
4
P R O T E C T I V E A N D R I S K F A C T O R S

Table 5. Alcohol disorders in older people in six EU countriesLifetime prevalence estimates of WMH-CIDI / DSM-IValcohol use disorders in Europe for individuals aged 65+
Source: ESEMeD
Despite the inverse relationship between age andalcohol dependency, alcohol-related problems in old ageare a matter of concern. High rates of co-morbidity withphysical and psychiatric illness mean that older peoplewith alcohol disorders are liable to be frequent users ofhealth facilities.
In relation to drug dependency in older people, there isthe substantial body of literature which indicates thatpsychotropic drug use in the elderly is high.96-104
Prescription data are of limited use since an especiallylow compliance in old age is known. A substantialproportion of the drugs fall into the categories ofsedatives, hypnotics and anxiolytics. Especially long-term benzodiazepine use is a matter of concern.Generally, psychotropic drug use increases with age andstudies agree on the predominance of women users.Population surveys to determine the prevalence of drugdependency in old age are needed.
4.2.2.6 Psychosis and age
Psychotic symptoms are a familiar problem to thoseinvolved in medical and social services for the elderly.However, few field studies have reported on thiscondition. Psychotic syndromes in late life appear to bea heterogeneous group of disorders. As with youngerage groups, identification of psychotic syndromes infield studies faces major challenges such as non-reporting or selective drop out.105
Community prevalence estimates for schizophrenia inindividuals aged 65 years and older were found to below. However, if psychotic symptoms in general are thefocus of the study, the prevalence of psychotic symptomsin a non-demented elderly population was found to be10%.106 Psychotic syndromes are more common inwomen and they become more common with increasingage. Furthermore, they are associated with sensoryimpairment and social isolation and sometimes with adecline in cognitive performance.
4.3 Marital status and living arrangements
Studies have consistently found that living arrangementsor marital status are associated with mental healthstatus. In general, being married or living with someoneis associated with better mental health than beingdivorced, widowed or single without making theassumption of any causal effect.
Figure 50. Relative risk of psychological distress bymarital status across EuropeOdds ratio for divorced, separated compared with marriedor living with someone. Controlled for sex and age
Source: Eurobarometer, October 2002
In the Eurobarometer results, those divorced, separatedor widowed carry a higher risk of psychological distressin all the countries.
Figure 51. Mental health and living arrangements Psychological distress measured by SF-12 score in six EUcountries
Source: ESEMeD
In ESEMeD the interaction between country and maritalstatus is highly significant (0.00) for psychologicaldistress. In two countries – Germany and Belgium –there is no difference, while in the remaining countriesthe divorced, separated and widowed have higherdistress. Results from the UK (not presented) showidentical results when those living in a couple arecompared with those not living in a couple.
0.56
4.864.66
4.83
3.84
3.023.27
4.63
1.741.57
5.05
3.73
0
1
2
3
4
5
6
Germany Belgium Netherlands Spain France Italy
Living with Partner Previously Married
3.282.9 2.74 2.7 2.7
2.32 2.31 2.081.98 1.74
1.57
0
1
2
3
4
5
6
Nethe
rland
s
Spain
Portu
gal
Belgium
Luxe
mbo
urg
Germ
any (
New L
ande
r)
Germ
any (
Old La
nder
)
Sweden
Italia
Franc
e
Austri
a
Belgium France Germany Italy
TheNetherlands Spain
N=501 N=490 N=667 N=840 N=452 N=1451
% SE % SE % SE % SE % SE % SE
Alcohol Abuse 3.4 0.9 2.4 0.8 2.6 0.6 0.9 0.3 1.7 0.6 1.2 0.4
Alcohol Dependence 0.2 0.2 0.7 0.4 0.6 0.4 0.1 0.1 0.6 0.3 0.1 0.1
43
4
P R O T E C T I V E A N D R I S K F A C T O R S
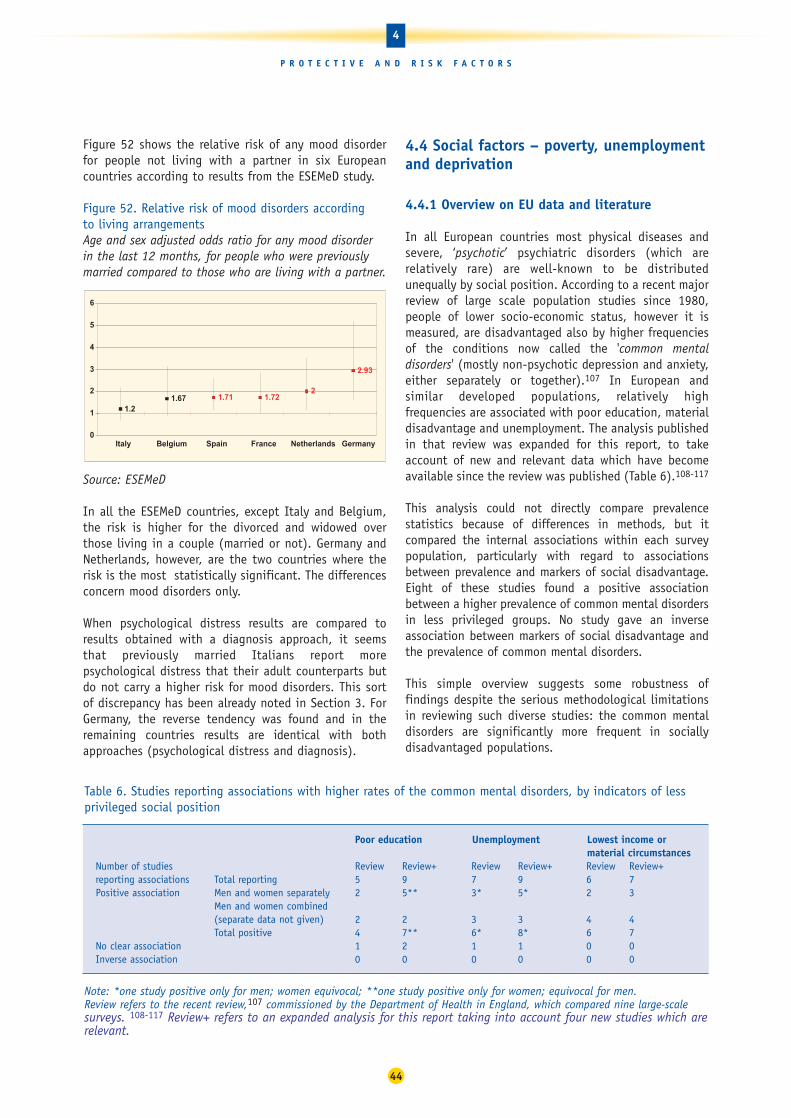
Figure 52 shows the relative risk of any mood disorderfor people not living with a partner in six Europeancountries according to results from the ESEMeD study.
Figure 52. Relative risk of mood disorders according to living arrangementsAge and sex adjusted odds ratio for any mood disorderin the last 12 months, for people who were previouslymarried compared to those who are living with a partner.
Source: ESEMeD
In all the ESEMeD countries, except Italy and Belgium,the risk is higher for the divorced and widowed overthose living in a couple (married or not). Germany andNetherlands, however, are the two countries where therisk is the most statistically significant. The differencesconcern mood disorders only.
When psychological distress results are compared toresults obtained with a diagnosis approach, it seemsthat previously married Italians report morepsychological distress that their adult counterparts butdo not carry a higher risk for mood disorders. This sortof discrepancy has been already noted in Section 3. ForGermany, the reverse tendency was found and in theremaining countries results are identical with bothapproaches (psychological distress and diagnosis).
4.4 Social factors – poverty, unemploymentand deprivation
4.4.1 Overview on EU data and literature
In all European countries most physical diseases andsevere, ‘psychotic’ psychiatric disorders (which arerelatively rare) are well-known to be distributedunequally by social position. According to a recent majorreview of large scale population studies since 1980,people of lower socio-economic status, however it ismeasured, are disadvantaged also by higher frequenciesof the conditions now called the 'common mentaldisorders' (mostly non-psychotic depression and anxiety,either separately or together).107 In European andsimilar developed populations, relatively highfrequencies are associated with poor education, materialdisadvantage and unemployment. The analysis publishedin that review was expanded for this report, to takeaccount of new and relevant data which have becomeavailable since the review was published (Table 6).108-117
This analysis could not directly compare prevalencestatistics because of differences in methods, but itcompared the internal associations within each surveypopulation, particularly with regard to associationsbetween prevalence and markers of social disadvantage.Eight of these studies found a positive associationbetween a higher prevalence of common mental disordersin less privileged groups. No study gave an inverseassociation between markers of social disadvantage andthe prevalence of common mental disorders.
This simple overview suggests some robustness offindings despite the serious methodological limitationsin reviewing such diverse studies: the common mentaldisorders are significantly more frequent in sociallydisadvantaged populations.
1.21.67 1.71 1.72
2
2.93
0
1
2
3
4
5
6
Italy Belgium Spain France Netherlands Germany
44
4
P R O T E C T I V E A N D R I S K F A C T O R S
Table 6. Studies reporting associations with higher rates of the common mental disorders, by indicators of lessprivileged social position
Note: *one study positive only for men; women equivocal; **one study positive only for women; equivocal for men.Review refers to the recent review,107 commissioned by the Department of Health in England, which compared nine large-scalesurveys. 108-117 Review+ refers to an expanded analysis for this report taking into account four new studies which arerelevant.
Poor education Unemployment Lowest income or material circumstances
Number of studies Review Review+ Review Review+ Review Review+reporting associations Total reporting 5 9 7 9 6 7Positive association Men and women separately 2 5** 3* 5* 2 3
Men and women combined (separate data not given) 2 2 3 3 4 4Total positive 4 7** 6* 8* 6 7
No clear association 1 2 1 1 0 0Inverse association 0 0 0 0 0 0
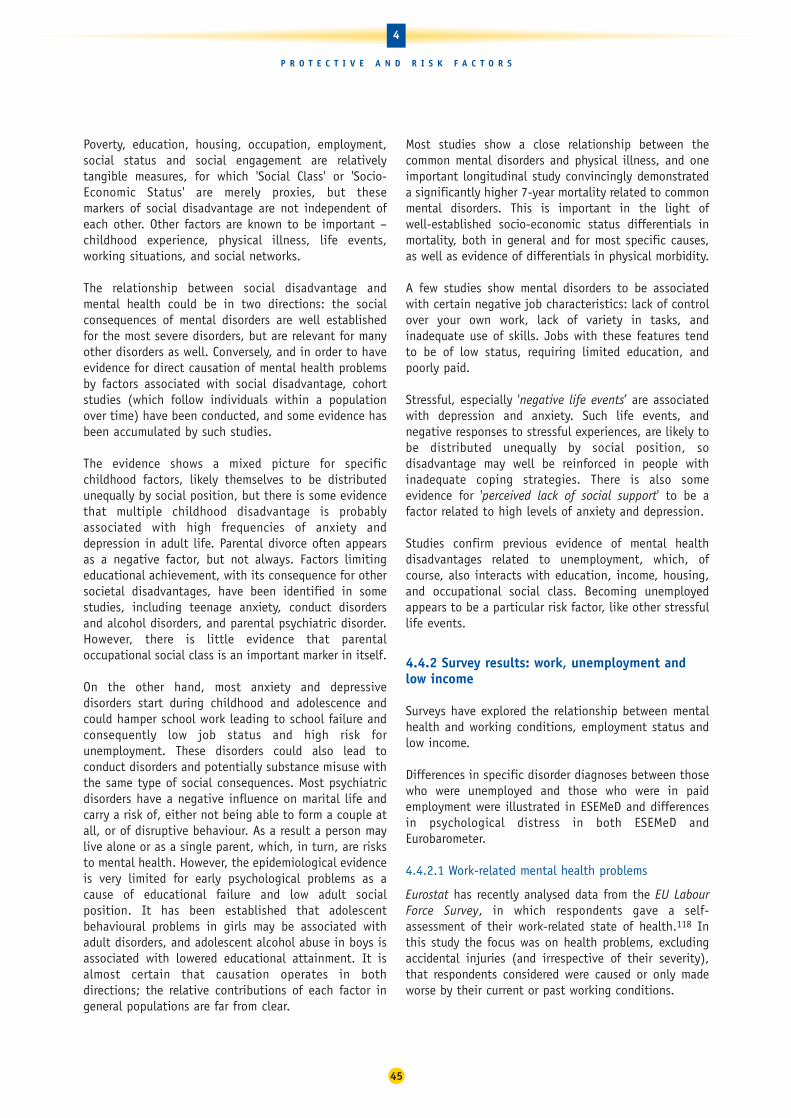
Poverty, education, housing, occupation, employment,social status and social engagement are relativelytangible measures, for which 'Social Class' or 'Socio-Economic Status' are merely proxies, but these markers of social disadvantage are not independent ofeach other. Other factors are known to be important –childhood experience, physical illness, life events,working situations, and social networks.
The relationship between social disadvantage andmental health could be in two directions: the socialconsequences of mental disorders are well establishedfor the most severe disorders, but are relevant for manyother disorders as well. Conversely, and in order to haveevidence for direct causation of mental health problemsby factors associated with social disadvantage, cohortstudies (which follow individuals within a populationover time) have been conducted, and some evidence hasbeen accumulated by such studies.
The evidence shows a mixed picture for specificchildhood factors, likely themselves to be distributedunequally by social position, but there is some evidencethat multiple childhood disadvantage is probablyassociated with high frequencies of anxiety anddepression in adult life. Parental divorce often appearsas a negative factor, but not always. Factors limitingeducational achievement, with its consequence for othersocietal disadvantages, have been identified in somestudies, including teenage anxiety, conduct disordersand alcohol disorders, and parental psychiatric disorder.However, there is little evidence that parentaloccupational social class is an important marker in itself.
On the other hand, most anxiety and depressivedisorders start during childhood and adolescence andcould hamper school work leading to school failure andconsequently low job status and high risk forunemployment. These disorders could also lead toconduct disorders and potentially substance misuse withthe same type of social consequences. Most psychiatricdisorders have a negative influence on marital life andcarry a risk of, either not being able to form a couple atall, or of disruptive behaviour. As a result a person maylive alone or as a single parent, which, in turn, are risksto mental health. However, the epidemiological evidenceis very limited for early psychological problems as acause of educational failure and low adult socialposition. It has been established that adolescentbehavioural problems in girls may be associated withadult disorders, and adolescent alcohol abuse in boys isassociated with lowered educational attainment. It isalmost certain that causation operates in bothdirections; the relative contributions of each factor ingeneral populations are far from clear.
Most studies show a close relationship between thecommon mental disorders and physical illness, and oneimportant longitudinal study convincingly demonstrateda significantly higher 7-year mortality related to commonmental disorders. This is important in the light of well-established socio-economic status differentials inmortality, both in general and for most specific causes,as well as evidence of differentials in physical morbidity.
A few studies show mental disorders to be associatedwith certain negative job characteristics: lack of controlover your own work, lack of variety in tasks, andinadequate use of skills. Jobs with these features tendto be of low status, requiring limited education, andpoorly paid.
Stressful, especially 'negative life events’ are associatedwith depression and anxiety. Such life events, andnegative responses to stressful experiences, are likely tobe distributed unequally by social position, sodisadvantage may well be reinforced in people withinadequate coping strategies. There is also someevidence for 'perceived lack of social support' to be afactor related to high levels of anxiety and depression.
Studies confirm previous evidence of mental healthdisadvantages related to unemployment, which, ofcourse, also interacts with education, income, housing,and occupational social class. Becoming unemployedappears to be a particular risk factor, like other stressfullife events.
4.4.2 Survey results: work, unemployment andlow income
Surveys have explored the relationship between mentalhealth and working conditions, employment status andlow income.
Differences in specific disorder diagnoses between thosewho were unemployed and those who were in paidemployment were illustrated in ESEMeD and differencesin psychological distress in both ESEMeD andEurobarometer.
4.4.2.1 Work-related mental health problems
Eurostat has recently analysed data from the EU LabourForce Survey, in which respondents gave a self-assessment of their work-related state of health.118 Inthis study the focus was on health problems, excludingaccidental injuries (and irrespective of their severity),that respondents considered were caused or only madeworse by their current or past working conditions.
45
4
P R O T E C T I V E A N D R I S K F A C T O R S

The 1999 EU Labour Force Survey included an ad hocmodule on work-related health problems. From this, thestandardised prevalence rate of work-related healthproblems per year by diagnosis group showed that1.18% of workers in the EU declared a problem ofdepression, anxiety or stress with or without any daysabsence from work. This study only covered eightMember States.
The results, presented in Table 7, show a wide range ofvalues with the highest prevalence in Nordic countriessuch as Finland (3.37%) and Sweden (2.05%), and thelowest in Italy (0.65%) and Spain (0.33%). For theseeight Member States of the EU, the prevalence is highestin the education sector (2.31), and in the health andsocial work sector (2.19). These groups include teachers,nurses, social workers and medical practitioners. It isimportant to bear in mind, however, that teachers, nursesand social workers are mainly women and anxiety ordepressive states are more frequent in women than inmales. Before attributing the difference to work, therefore,the results have to be analysed by gender and profession.
In the EU, 0.44 per cent of workers declared more than14 days lost (ie two or more weeks absence) for mental health related reasons. The highest prevalencewas among the 45-54 year-olds for the two types (1.5% with or without absence, and 0.6% with more than 14 days lost).
Table 7. Impact of work on mental healthStandardised prevalence rate of work-related healthproblems (stress, depression or anxiety) by diagnosisgroup and age. Percentage.
(1) Estimates for EU-15 have been drawn up on the basis of the dataavailable for the Member States covered by the module
Source: Eurostat (2004), Health statistics – Key data onhealth 2002 – Data 1970 – 2001, European Commission.
The prevalence rate of problems resulting in an absencefrom work of two weeks or more (cumulated over oneyear) is highest in the health and social work sector(0.83%), and in the education sector (0.83%). Currently,information to assess the trends over time of thesework-related conditions in the EU workforce is limited.
Surveys of work-related illness suggest an increase inthe reported prevalence rate of work-related stress,although such an increase could be caused by factors otherthan, or as well as, a genuine rise in work stress. Withrespect to long term restrictions, however, theInternational Labour Organization (ILO) states that mentalillness affects more human lives and gives rise to a greaterwaste of human resources than all other forms of disability,with mental disorders being one of the three leadingcauses of disability. In the EU mental health disorders area major reason for granting disability pensions.119
The European Foundation for the Improvement of Livingand Working Conditions has also conducted Europeansurveys. The Third European Survey on Working Conditionsin 2000, involved 1,500 workers in each of the MemberStates (21,703 face to face interviews in homes). Theaverage participation rate was 56% (Denmark, Greece,Italy and Netherlands were around 40% only).
Mental health pertinent questions were asked through thewording, ‘Does your work affect your health? If yes howdoes it affect your health?’ A list of reasons was presented,including, stress (28%), overall fatigue (23%), sleepingproblems (8%), anxiety (7%) and irritability (11%). All ofthese may be considered as mental health symptoms.
These frequencies underline the fact that many workersconsider that their work affects their health. Of course,this is different according to the occupation. Data arepresented on stress and show the highest rates amongprofessionals and lowest among elementary occupationsand agricultural workers. The level of stress is belowaverage for craft workers, clerks and service workers,while it is above average for technicians and managers.
Concerning stress at work Greek workers report high rates,followed by workers in Luxembourg, Sweden and Finland.Low rates are reported by Irish, Portuguese and Britishworkers. Sleeping problems due to work follow a similardistribution, except for Greece where the rate is average.
The rates are quite different in both surveys mainlybecause the first survey is focused on the last year and onwork-related health problems, while the second surveycited concerns an opinion about whether work affectshealth. In both surveys, it is hard to interpret these datafurther because we do not have any objective measure ofthe mental health status of these people.
46
4
P R O T E C T I V E A N D R I S K F A C T O R S
Age Total 15-24 25-34 35-44 45-54 55-64 65 & Over
With or without days absence from work
EU-151 1.18 0.54 0.89 1.36 1.53 1.34 0.42
More than 14 days lost (two weeks’ absence or more)
EU-151 0.44 0.22 0.31 0.50 0.60 0.53 0.18
With or without days absence from work
Denmark 0.84 0.53 0.63 0.77 1.3 0.92 –
Spain 0.33 – – 0.46 0.39 0.42 –
Ireland 0.65 0.31 0.49 0.85 0.81 0.48 0.41
Luxembourg 0.84 – 0.67 0.90 1.06 1.57 –
Portugal 0.85 0.31 0.97 1.05 0.72 0.70 0.61
Finland 3.37 0.91 2.21 4.16 4.30 4.76 1.88
Sweden 2.05 0.62 1.54 2.57 2.49 2.49 –
UK 1.48 0.68 1.14 1.84 1.81 1.41 0.36
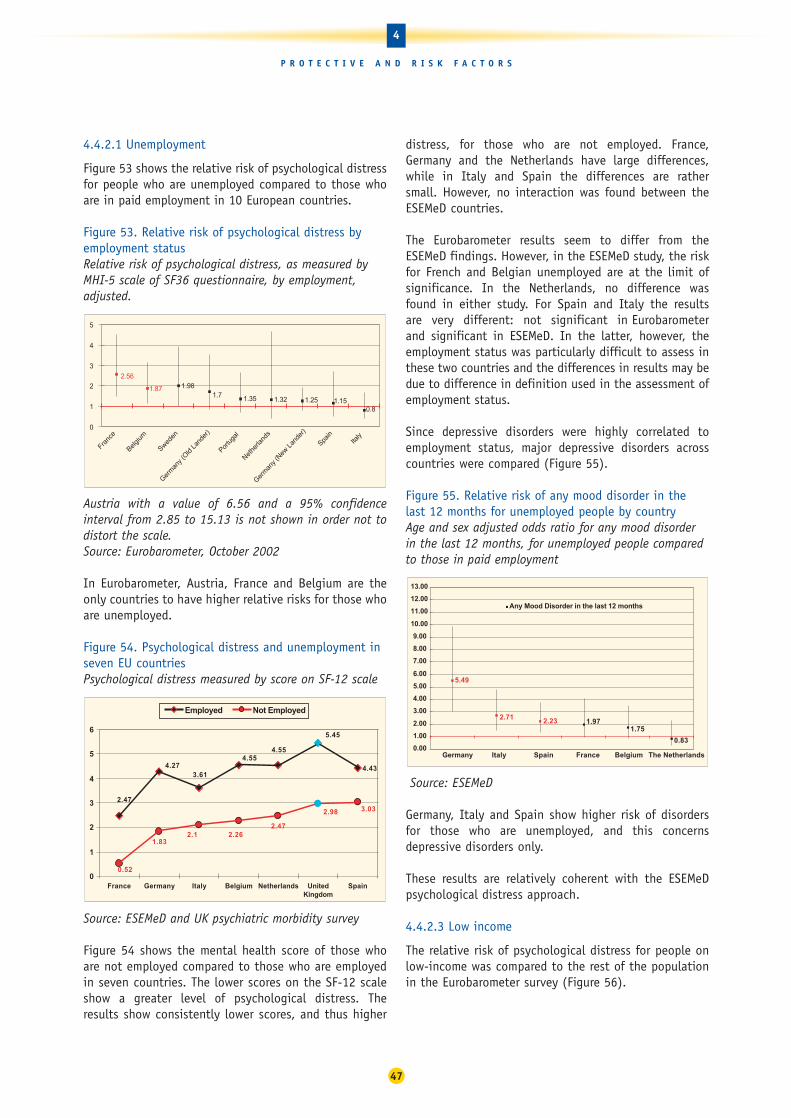
4.4.2.1 Unemployment
Figure 53 shows the relative risk of psychological distressfor people who are unemployed compared to those whoare in paid employment in 10 European countries.
Figure 53. Relative risk of psychological distress byemployment statusRelative risk of psychological distress, as measured byMHI-5 scale of SF36 questionnaire, by employment,adjusted.
Austria with a value of 6.56 and a 95% confidenceinterval from 2.85 to 15.13 is not shown in order not todistort the scale.Source: Eurobarometer, October 2002
In Eurobarometer, Austria, France and Belgium are theonly countries to have higher relative risks for those whoare unemployed.
Figure 54. Psychological distress and unemployment inseven EU countriesPsychological distress measured by score on SF-12 scale
Source: ESEMeD and UK psychiatric morbidity survey
Figure 54 shows the mental health score of those whoare not employed compared to those who are employedin seven countries. The lower scores on the SF-12 scaleshow a greater level of psychological distress. Theresults show consistently lower scores, and thus higher
distress, for those who are not employed. France,Germany and the Netherlands have large differences,while in Italy and Spain the differences are rather small. However, no interaction was found between theESEMeD countries.
The Eurobarometer results seem to differ from theESEMeD findings. However, in the ESEMeD study, the riskfor French and Belgian unemployed are at the limit ofsignificance. In the Netherlands, no difference wasfound in either study. For Spain and Italy the results are very different: not significant in Eurobarometerand significant in ESEMeD. In the latter, however, theemployment status was particularly difficult to assess inthese two countries and the differences in results may bedue to difference in definition used in the assessment ofemployment status.
Since depressive disorders were highly correlated toemployment status, major depressive disorders acrosscountries were compared (Figure 55).
Figure 55. Relative risk of any mood disorder in thelast 12 months for unemployed people by country Age and sex adjusted odds ratio for any mood disorderin the last 12 months, for unemployed people comparedto those in paid employment
Source: ESEMeD
Germany, Italy and Spain show higher risk of disordersfor those who are unemployed, and this concernsdepressive disorders only.
These results are relatively coherent with the ESEMeDpsychological distress approach.
4.4.2.3 Low income
The relative risk of psychological distress for people onlow-income was compared to the rest of the populationin the Eurobarometer survey (Figure 56).
5.49
1.972.71 2.23
0.83
1.75
0.00
1.00
2.00
3.00
4.00
5.00
6.00
7.00
8.00
9.00
10.00
11.00
12.00
13.00
Germany Italy Spain France Belgium The Netherlands
Any Mood Disorder in the last 12 months
4.43
5.45
4.554.55
3.614.27
2.473.03
2.26
0.52
1.832.1
2.47
2.98
0
1
2
3
4
5
6
France Germany Italy Belgium Netherlands UnitedKingdom
Spain
Employed Not Employed
1.321.35
0.81.15
2.56
1.87
1.251.7
1.98
0
1
2
3
4
5
Franc
e
Belgium
Sweden
Germ
any (
Old La
nder
)
Germ
any (
New L
ande
r)
Portu
gal
Nethe
rland
s
Spain
Italy
47
4
P R O T E C T I V E A N D R I S K F A C T O R S

Figure 56. Relative risk of psychological distress by low income Measured by MHI-5 scale of SF36 questionnaire, adjusted
Source: Eurobarometer survey, October 2002
All countries except Italy show a higher risk for thosewith low income. This risk, however, seems especiallyhigh for Portugal, where it is significantly higher thanSweden and Austria.
4.4.3 Conclusion
There can be no doubt now that disadvantaged groups inEuropean populations experience more anxiety anddepression than those who are more advantaged, despitethe difficulties in measuring mental health problems.This represents significant suffering for individuals andserious loss of production and social function, withimportant consequences for children, communities andwork-places.
The excess of the common mental disorders indisadvantaged people is well enough established tojustify health policy initiatives to ensure that access toeffective diagnosis and treatment is improved, especiallyat the primary health care level, and especially incommunities with high levels of social disadvantage.
4.5 Rural-urban differences in mental health
Comparing rural and urban differences in mentaldisorders has long been a subject of research. Definitionof urban/rural differences is a subject of concern sincemost of the studies looking into this issue use differentdefinitions which render comparisons even more difficult.
Most published studies claim that there is a higherprevalence of mental health problems, or at least ofdepression, in urban areas. The underlying reasons canbe summarised as:
• a higher risk of depression in urban areas than ruralareas because of the decline in communityrelationships and social isolation in the city120-121
• greater stresses with housing, work, marriage, child-rearing and with security in urban environments, ininteraction with the resources available to cope withthe stress of urban life and high levels of hostility 122-
123
• concentration of poverty in city centres;
• poor social integration and social withdrawal andsocio-cultural disintegration, including family andmarital disintegration which limits social networks;124
• rural and urban migration, which encompassesstressors, coping resources and cultural factors.125
However, findings regarding rural and urban differencesin depression from previous studies conducted indifferent regions have been inconsistent.
4.01
2.48 2.23 2.19 2.18 2.041.691.831.86
2.3
1.38
0
1
2
3
4
5
6
7
Portu
gal
Luxe
mbo
urg
Franc
e
Germ
any (
Old La
nder
)
Germ
any (
New L
ande
r)
Spain
Belgium
Nethe
rland
s
Austri
a
Sweden
Italy
48
4
P R O T E C T I V E A N D R I S K F A C T O R S
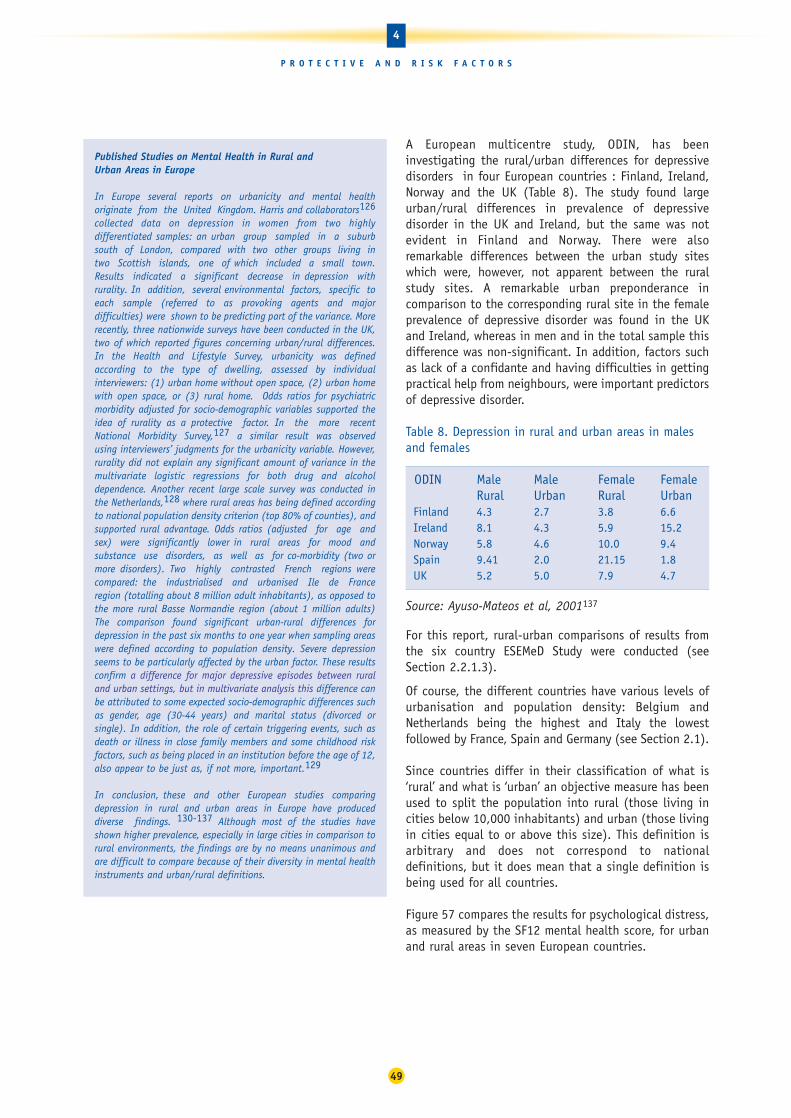
Published Studies on Mental Health in Rural and Urban Areas in Europe
In Europe several reports on urbanicity and mental healthoriginate from the United Kingdom. Harris and collaborators126
collected data on depression in women from two highlydifferentiated samples: an urban group sampled in a suburbsouth of London, compared with two other groups living intwo Scottish islands, one of which included a small town.Results indicated a significant decrease in depression withrurality. In addition, several environmental factors, specific toeach sample (referred to as provoking agents and majordifficulties) were shown to be predicting part of the variance. Morerecently, three nationwide surveys have been conducted in the UK,two of which reported figures concerning urban/rural differences.In the Health and Lifestyle Survey, urbanicity was definedaccording to the type of dwelling, assessed by individualinterviewers: (1) urban home without open space, (2) urban homewith open space, or (3) rural home. Odds ratios for psychiatricmorbidity adjusted for socio-demographic variables supported theidea of rurality as a protective factor. In the more recentNational Morbidity Survey,127 a similar result was observedusing interviewers’ judgments for the urbanicity variable. However,rurality did not explain any significant amount of variance in themultivariate logistic regressions for both drug and alcoholdependence. Another recent large scale survey was conducted inthe Netherlands,128 where rural areas has being defined accordingto national population density criterion (top 80% of counties), andsupported rural advantage. Odds ratios (adjusted for age andsex) were significantly lower in rural areas for mood andsubstance use disorders, as well as for co-morbidity (two ormore disorders). Two highly contrasted French regions werecompared: the industrialised and urbanised Ile de Franceregion (totalling about 8 million adult inhabitants), as opposed tothe more rural Basse Normandie region (about 1 million adults)The comparison found significant urban-rural differences fordepression in the past six months to one year when sampling areaswere defined according to population density. Severe depressionseems to be particularly affected by the urban factor. These resultsconfirm a difference for major depressive episodes between ruraland urban settings, but in multivariate analysis this difference canbe attributed to some expected socio-demographic differences suchas gender, age (30-44 years) and marital status (divorced orsingle). In addition, the role of certain triggering events, such asdeath or illness in close family members and some childhood riskfactors, such as being placed in an institution before the age of 12,also appear to be just as, if not more, important.129
In conclusion, these and other European studies comparingdepression in rural and urban areas in Europe have produceddiverse findings. 130-137 Although most of the studies haveshown higher prevalence, especially in large cities in comparison torural environments, the findings are by no means unanimous andare difficult to compare because of their diversity in mental healthinstruments and urban/rural definitions.
A European multicentre study, ODIN, has beeninvestigating the rural/urban differences for depressivedisorders in four European countries : Finland, Ireland,Norway and the UK (Table 8). The study found largeurban/rural differences in prevalence of depressivedisorder in the UK and Ireland, but the same was notevident in Finland and Norway. There were alsoremarkable differences between the urban study siteswhich were, however, not apparent between the ruralstudy sites. A remarkable urban preponderance incomparison to the corresponding rural site in the femaleprevalence of depressive disorder was found in the UKand Ireland, whereas in men and in the total sample thisdifference was non-significant. In addition, factors suchas lack of a confidante and having difficulties in gettingpractical help from neighbours, were important predictorsof depressive disorder.
Table 8. Depression in rural and urban areas in malesand females
ODIN Male Male Female FemaleRural Urban Rural Urban
Finland 4.3 2.7 3.8 6.6Ireland 8.1 4.3 5.9 15.2Norway 5.8 4.6 10.0 9.4Spain 9.41 2.0 21.15 1.8UK 5.2 5.0 7.9 4.7
Source: Ayuso-Mateos et al, 2001137
For this report, rural-urban comparisons of results fromthe six country ESEMeD Study were conducted (seeSection 2.2.1.3).
Of course, the different countries have various levels ofurbanisation and population density: Belgium andNetherlands being the highest and Italy the lowestfollowed by France, Spain and Germany (see Section 2.1).
Since countries differ in their classification of what is‘rural’ and what is ‘urban’ an objective measure has beenused to split the population into rural (those living incities below 10,000 inhabitants) and urban (those livingin cities equal to or above this size). This definition isarbitrary and does not correspond to nationaldefinitions, but it does mean that a single definition isbeing used for all countries.
Figure 57 compares the results for psychological distress,as measured by the SF12 mental health score, for urbanand rural areas in seven European countries.
49
4
P R O T E C T I V E A N D R I S K F A C T O R S

Figure 57. Psychological distress in rural and urban areasMeasure on SF-12 mental health score in seven EU countries
Source: ESEMeD and UK psychiatric morbidity survey
Interaction between ESEMeD countries and place ofliving is highly positive for psychological distress. It isworth noting that when analysing the data by gender,the difference remains in Netherlands for men only andin Germany it disappears.
These results with psychological distress parallel theresults obtained with the diagnosis approach (seebelow) for Belgium and France and add new informationabout Italy and the Netherlands, where scores differ infavour of the rural areas.
Figure 58. Comparison of any mental disorders in the last12 months for people living in urban and rural areasAny 12 month disorders by place of living: Rural/urban(<=10 000/>10 000 persons)
Source: ESEMeD
Figure 58 compares rates for any mental disorders in the last 12 months by place of living. In general,urbanicity seems be linked with a higher risk for mentalhealth disorders, except for Belgium. However, for thiscountry which urbanicity is subdivided into midsize
cities and metropolis, there is no difference betweenrural and metropolis and only those people living inmidsize cities show better mental health than the twoother categories.
The rural/urban differences are not uniform betweencountries. For any type of disorder, France and Germanyhave higher rates in urban areas than in rural areaswhereas for Belgium it is the reverse. The remainingcountries do not show differences. More specifically,mood disorders are higher in French and German urbanareas versus rural and urban/rural difference for anxietyappear in France only.
For those countries where demographics differ acrossrural/urban population (France, Germany and Spain),multiple regression analyses were carried out to controlfor these differences. These analyses enable evaluationof the ‘urban/rural ‘ effect independently of the countryeffect and by controlling for the main demographicvariables. These analyses demonstrated that living in anurban environment (urbanicity) is a risk factor for anydisorders, but is not found for specific disorders. Whenmarital status is controlled for, the risk disappears forGermany. However, the risk persists for France whereurban people have a higher risk than those in rural areasand in Belgium it is the reverse.
ESEMeD results confirm previous findings that thedifferences between rural and urban areas vary betweencountries. For mood disorders (which have been studiedthe most) ESEMeD found differences between rural andurban areas in three countries: two where the urban ratewas higher,one where it was lower and no difference inthree countries. This parallels the ODIN study whichfound large urban/rural differences in UK and Irelandand not in the Nordic countries (Finland and Norway).
The fact that most of the urban risk disappears whenmarital status is controlled for, may explain somedifferences in the findings since the specific rural/urbanrates of divorced/separated varies across countries. InESEMeD it was different in France and Germany only. Thesame applies for age, since in ESEMeD the older groupseems to have lower risk whereas the youngest categoryhas the highest.
To conclude, most European studies show a higher risk inurban areas, at least for mood disorders. This effect hasbeen repeatedly found in two different surveys in theNetherlands and France. and seems to exist in the UKand most of the ESEMeD countries, although differentmethods have been used. However, this effect seems tobe mainly mediated by the main sociodemographicvariables which are very different in rural and urban
11.15
15.5
7.96.54
16.03
12.08
10
8.637.06
9.59
7.58
9.59
0
2
4
6
8
10
12
14
16
18
France * Netherlands Belgium* Germany Spain Italy
RuralUrban
3.09
2.233.53
3.77
3.564.39
5.8
6.32
2.72
4.51 4.494.67 3.73
4.48
0
1
2
3
4
5
6
7
Belgium Netherlands UnitedKingdom
Germany Spain Italy France
Rural Urban
50
4
P R O T E C T I V E A N D R I S K F A C T O R S

settings. Whatever the reason for the differences, it seems that the urban population has different risks. Thisshould be taken into account when planning mentalhealth care resources.
4.6 Migration and mental health
The number of migrants in the world has more thandoubled since 1975 and more that 56 million migrantswere estimated to live in Europe in 2002.138 During the20th Century, Europe experienced three major periods ofmigration: around the time of the First and Second WorldWars and during the 1990s.
Figure 59. Migration rates across EuropeCrude rate of net migration including corrections
Source: Eurostat New Cronos databank
Within Europe there are very different patterns ofmigration (Figure 59). Northern European countries,such as the United Kingdom, the Netherlands, Germanyand Sweden, have had a long experience of immigrationthroughout history, and especially immediately after theSecond World War. In Southern European countries, suchas Spain or Portugal, the immigration phenomenon isrelatively recent. The composition of immigrantpopulations also varies from country to country.
Political and socio-economic instability in and aroundEurope has significantly increased the number ofrefugees and asylum seekers arriving in Europeancountries. The presence of undocumented migrants isalso a well-established fact in most European countrieswhere migrants come or are ‘called’ into Europe toperform badly paid, physically and psychologicallystressful jobs in highly qualified service economies andwelfare states. Moves to close borders to newimmigration have not prevented the increase inundocumented migrants in Europe. According to the lastofficial International Labour Office estimate, in 1991
there were around 2.6 million undocumented migrantsliving in Europe.139 More recent, unofficial, estimatessuggest there are now more than three millionundocumented migrants in Europe.140
Trends in migration in Europe began to change a fewdecades ago as a result of changes in the economic,political and social realms. EU Member States have beenpracticing a policy of closing borders throughout the1990s, a policy that has become tougher still in recentyears. However, the policy of closed borders does notstop migration, but instead seems to create a newunderclass of undocumented migrants who are – contraryto all declarations of human rights – inhumanelysuppressed and highly exploited.
Among all the changes a person can face during his or herlife, few are so wide and complex as those which takeplace during migration. Practically everything thatsurrounds the person who emigrates changes. The processof loss and change which a person who migratesexperience is seen as a grief process.141 More specifically,seven losses have been identified which cause anguishthat a person will experience with time: family andfriends, language, culture, homeland, loss of status, lossof contact with the ethnic group and exposure to physicalrisks. Difficulties in expressing grief can causepsychological problems. These difficulties are accentuatedwhen migration is accomplished under adverse conditions.The reception in the new country is crucial for thecomplete and successful development of the grief process.
In the case of refugees, who have to flee their countryfor fear of being persecuted, the grief process is morecomplex. War-related experiences and occupationalstatus before migration may also be related to differentmental health problems. A number of factors have beensuggested as affecting the health of immigrants in theirhost country. These include: labour and economicinstability, cultural and social marginalisation, familyestrangement, pressures to send money back to theirfamilies, racial discrimination and a lack of statutorydocumentation.
These differences, as described above, in migrationpatterns, the migration experience and the receptionthat immigrants receive as they try to settle mean thatit is not possible to consider migrants as onehomogeneous group with identical risks for poor mentalhealth. Further research is needed to identify factorswhich may lead to an increased risk of mental ill-healthor increased need for mental health services. Factors toexplore include reasons for migration, distance from host culture (including religion, language etc, ability to develop mediating structures and legal status as a resident).
0
2
4
6
8
10
12
1999
Luxem
bourg
Irela
nd
Spain
Portugal
Greec
e
Nether
lands
United K
ingdom
Germ
any
Austria
Italy
Denm
ark
Belgiu
m
Sweden
France
Finla
nd
51
4
P R O T E C T I V E A N D R I S K F A C T O R S

52
4
P R O T E C T I V E A N D R I S K F A C T O R S
Mental Health and Migration: Summary of epidemiological studies
Highest rates of schizophrenia in immigrants
Frequencies of schizophrenia is increased in several immigrantgroups: Morocco, Surinam and the Dutch Antilles in theNetherlands142; Caribbean, Ireland, India and Pakistan in UK144-147; East Africa in Sweden.148 But not all immigrant groupsshow higher risk than natives. The impact of migration itself produceshigh stress but rates of schizophrenia are even higher in the secondgeneration, suggesting that other social factors and geneticvulnerability may be responsible for the increase.149 The relative riskof schizophrenia in Surinam born immigrants against the Surinamborn resident population was 1.46 but Odegaard’s selectionhypothesis cannot solely explain the higher incidence ofschizophrenia.150 The developmental task for formulating the lifeplan challenges the young adult’s executive function abilities, whichmay be weaker in individuals vulnerable to schizophrenia.Formulating the life plan may be made more difficult by the position of disadvantaged ethnic minorities, raising the risk forschizophrenia.151
The African-Caribbean population in England is at increased risk ofboth schizophrenia and mania. African-Caribbean patients withschizophrenia show more affective symptoms, and more relapsingcourse with greater social disruption but fewer chronic negativesymptoms, than white patients. Studies152-153 have found that theelevated rate of schizophrenia among Turkish migrants was explainedin part by possible misdiagnosis. The same research group153 foundin a group of Turkish schizophrenic patients, a higher rate ofdepression and hostile excitement than in German schizophrenicpatients. Authors say that such a figure may be mainly due todiagnostic differences.
Suicide
In the UK, suicide rates of young female immigrants from the Indiansubcontinent are consistently higher than those of their malecounterparts and of young women in the indigenous populations ofthe countries to which they immigrated. Depression, anxiety anddomestic violence may contribute to the high rates but mental illnessis rarely cited as a cause. Authors suggest that affective disordersmay be under-diagnosed in this population.154-155 Also, in theNetherlands the suicide rate among children of immigrants wasconsiderably higher than that of the national population.156 A studyon psychiatric inpatients in Frankfurt in Germany found suicidalattempts more frequent among the Mediterranean girls than amongtheir German counterparts.157
Alcohol Abuse
Alcohol abuse among people of Indian descent is reflected in rates ofcirrhosis-related mortality, which are twice as high as among Englishmales.158 The alcohol related disorders in immigrants was studied inSweden by a register-based work on a national cohort of adults born1929-65.159 Authors found that patterns of alcohol abuse in thecountry of origin are strong determinants of alcohol-related disordersin first generation immigrants. The patterns in second generationimmigrants are influenced by parental countries of origin as well aspatterns in the majority of the population.
Drug Abuse
Reports to investigate the reasons for drug abuse among immigrantyouth have been carried out in Sweden160, France161 andGermany162 coming up with similar conclusions which suggest
that drug abuse was a consequence of difficult social integration. A 1996 WHO report noted that the consumption of tranquillisers andantidepressants by young immigrants across Europe is growing.
A recent review of the literature underlined that the associationbetween migration and addiction is very heterogeneous. More or lessdrug and alcohol dependence than native populations have beenreported in different migration phenomena across the world.163 Assuggested in some of the studies cited above on alcohol abuse, butprobably not with the same strong association, patterns of addictionabuse in the country of origin are determinants of alcohol-relateddisorders in first generation immigrants. In spite of the publicconcern about migration and drug problems, there is a lack of dataabout drug dependence in the migrant population in Europe.
Psychopathology expression and access to psychiatric facilities
A lower rate of recognized mental disorders in women of Indian originwas found by Jacob and colleagues164 in a general practice setting inWest London. Common mental disorders were similar in Indian womento those in other UK populations, individuals with common mentaldisorders had a higher frequency of consultation but were less likely tosee depression as an indicator for medical intervention. Incorrectdiagnosis by the GP was most likely to occur when patients did notdisclose all their complaints: differing conceptualisation of commonmental disorders may contribute to their under-recognition in womenof Indian origin. In Turkish immigrants in the Netherlands, theexpression of somatic complaints should alert physicians to furtherexplore symptoms of minor psychiatric disorders and to examinesources of distress.165 Surinamese, Antillean, Turkish and Moroccanwomen made considerably less use of mental health care services thannative born women in the Netherlands. Cultural and socio-economicfactors are largely responsible for such a difference: a care policy mayimprove the accessibility of mental health services for immigrantwomen.166 Turkish immigrant teachers reported high levels of anxietyand depression in immigrant Turkish children which go largelyundetected by their Dutch teachers.167Swedish born (but not Finnish)women and female refugees reported more psychosomatic complaintsin the 90s than in 80s.168 Similarly to the cited study on Sardinianimmigrants to Paris, the results do not appear to confirm the clinicalfindings of ‘somatization’ as a privileged ‘psychopathological course’ inlatin immigrants reported in the past.169
Turkish born migrant women in Sweden communicated distress byconcrete expression about the body, emotion, social and life situation.Pain was prominent and psychiatric attribution was rarely accepted.170
The results of this study point out the mutual need of exploring meaningin the clinical encounter to help patients, particularly migrants, makesense out of different perspectives of illness and healing.
Risk of anxiety and depression
Depressive disorders were the second cause of medical consultations in‘undocumented’ immigrants in a district of Madrid.171 Senegalesetravelling salesmen living in Sardinia, whose working conditionsfacilitate a community lifestyle, do not appear to be at risk fordepression when compared to Sardinian controls. Higher rates of anxietyand depressive disorders were shown in the few fellow-countrymen whohad managed to obtain a steady job with regular wages. In the lattercase, the onset of psychopathological disorders was closely associatedwith the loss of contact with fellow-countrymen. A sample of Moroccanemigrants employed in similar occupations was characterised by a higherrisk compared to natives. Elements of cultural cohesion, such as thoserepresented by the associations of Islamic confraternities, probably mayexert strong protective factors in immigrants from Senegal.172
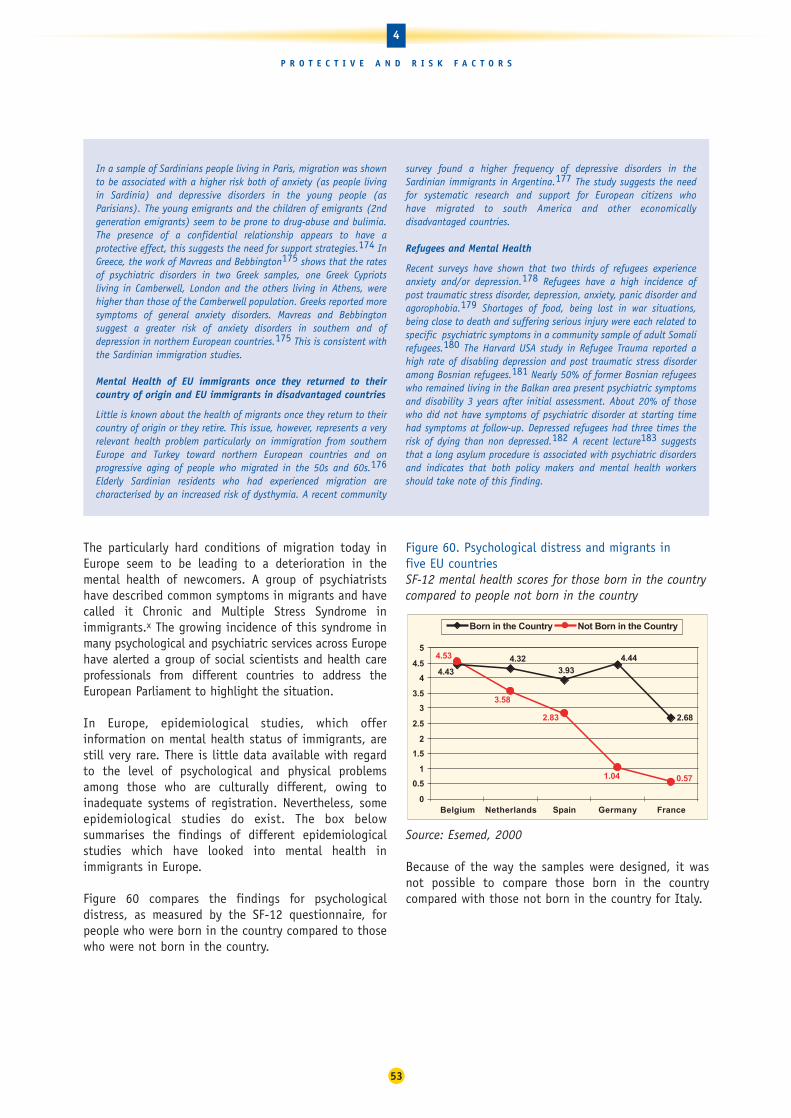
The particularly hard conditions of migration today inEurope seem to be leading to a deterioration in themental health of newcomers. A group of psychiatristshave described common symptoms in migrants and havecalled it Chronic and Multiple Stress Syndrome inimmigrants.x The growing incidence of this syndrome inmany psychological and psychiatric services across Europehave alerted a group of social scientists and health careprofessionals from different countries to address theEuropean Parliament to highlight the situation.
In Europe, epidemiological studies, which offerinformation on mental health status of immigrants, arestill very rare. There is little data available with regardto the level of psychological and physical problemsamong those who are culturally different, owing toinadequate systems of registration. Nevertheless, someepidemiological studies do exist. The box belowsummarises the findings of different epidemiologicalstudies which have looked into mental health inimmigrants in Europe.
Figure 60 compares the findings for psychologicaldistress, as measured by the SF-12 questionnaire, forpeople who were born in the country compared to thosewho were not born in the country.
Figure 60. Psychological distress and migrants in five EU countriesSF-12 mental health scores for those born in the countrycompared to people not born in the country
Source: Esemed, 2000
Because of the way the samples were designed, it wasnot possible to compare those born in the countrycompared with those not born in the country for Italy.
4.323.93
4.44
2.68
4.43
1.04 0.57
4.53
2.83
3.58
0
0.5
1
1.5
2
2.5
3
3.5
4
4.5
5
Belgium Netherlands Spain Germany France
Born in the Country Not Born in the Country
53
4
P R O T E C T I V E A N D R I S K F A C T O R S
In a sample of Sardinians people living in Paris, migration was shownto be associated with a higher risk both of anxiety (as people livingin Sardinia) and depressive disorders in the young people (asParisians). The young emigrants and the children of emigrants (2ndgeneration emigrants) seem to be prone to drug-abuse and bulimia.The presence of a confidential relationship appears to have aprotective effect, this suggests the need for support strategies.174 InGreece, the work of Mavreas and Bebbington175 shows that the ratesof psychiatric disorders in two Greek samples, one Greek Cypriotsliving in Camberwell, London and the others living in Athens, werehigher than those of the Camberwell population. Greeks reported moresymptoms of general anxiety disorders. Mavreas and Bebbingtonsuggest a greater risk of anxiety disorders in southern and ofdepression in northern European countries.175 This is consistent withthe Sardinian immigration studies.
Mental Health of EU immigrants once they returned to theircountry of origin and EU immigrants in disadvantaged countries
Little is known about the health of migrants once they return to theircountry of origin or they retire. This issue, however, represents a veryrelevant health problem particularly on immigration from southernEurope and Turkey toward northern European countries and onprogressive aging of people who migrated in the 50s and 60s.176
Elderly Sardinian residents who had experienced migration arecharacterised by an increased risk of dysthymia. A recent community
survey found a higher frequency of depressive disorders in theSardinian immigrants in Argentina.177 The study suggests the needfor systematic research and support for European citizens who have migrated to south America and other economicallydisadvantaged countries.
Refugees and Mental Health
Recent surveys have shown that two thirds of refugees experienceanxiety and/or depression.178 Refugees have a high incidence ofpost traumatic stress disorder, depression, anxiety, panic disorder andagorophobia.179 Shortages of food, being lost in war situations,being close to death and suffering serious injury were each related tospecific psychiatric symptoms in a community sample of adult Somalirefugees.180 The Harvard USA study in Refugee Trauma reported ahigh rate of disabling depression and post traumatic stress disorderamong Bosnian refugees.181 Nearly 50% of former Bosnian refugeeswho remained living in the Balkan area present psychiatric symptomsand disability 3 years after initial assessment. About 20% of thosewho did not have symptoms of psychiatric disorder at starting timehad symptoms at follow-up. Depressed refugees had three times therisk of dying than non depressed.182 A recent lecture183 suggeststhat a long asylum procedure is associated with psychiatric disordersand indicates that both policy makers and mental health workersshould take note of this finding.
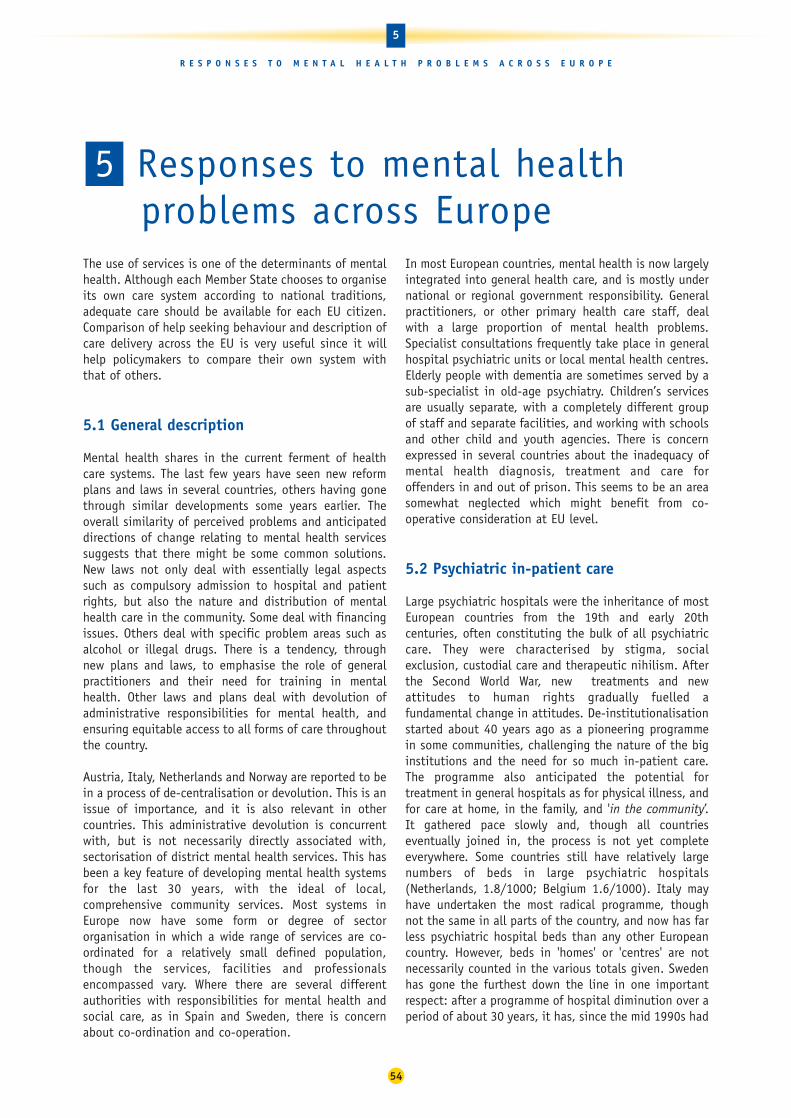
The use of services is one of the determinants of mentalhealth. Although each Member State chooses to organiseits own care system according to national traditions,adequate care should be available for each EU citizen.Comparison of help seeking behaviour and description ofcare delivery across the EU is very useful since it willhelp policymakers to compare their own system withthat of others.
5.1 General description
Mental health shares in the current ferment of healthcare systems. The last few years have seen new reformplans and laws in several countries, others having gonethrough similar developments some years earlier. Theoverall similarity of perceived problems and anticipateddirections of change relating to mental health servicessuggests that there might be some common solutions.New laws not only deal with essentially legal aspectssuch as compulsory admission to hospital and patientrights, but also the nature and distribution of mentalhealth care in the community. Some deal with financingissues. Others deal with specific problem areas such asalcohol or illegal drugs. There is a tendency, throughnew plans and laws, to emphasise the role of generalpractitioners and their need for training in mentalhealth. Other laws and plans deal with devolution ofadministrative responsibilities for mental health, andensuring equitable access to all forms of care throughoutthe country.
Austria, Italy, Netherlands and Norway are reported to bein a process of de-centralisation or devolution. This is anissue of importance, and it is also relevant in othercountries. This administrative devolution is concurrentwith, but is not necessarily directly associated with,sectorisation of district mental health services. This hasbeen a key feature of developing mental health systemsfor the last 30 years, with the ideal of local,comprehensive community services. Most systems inEurope now have some form or degree of sectororganisation in which a wide range of services are co-ordinated for a relatively small defined population,though the services, facilities and professionalsencompassed vary. Where there are several differentauthorities with responsibilities for mental health andsocial care, as in Spain and Sweden, there is concernabout co-ordination and co-operation.
In most European countries, mental health is now largelyintegrated into general health care, and is mostly undernational or regional government responsibility. Generalpractitioners, or other primary health care staff, dealwith a large proportion of mental health problems.Specialist consultations frequently take place in generalhospital psychiatric units or local mental health centres.Elderly people with dementia are sometimes served by asub-specialist in old-age psychiatry. Children’s servicesare usually separate, with a completely different groupof staff and separate facilities, and working with schoolsand other child and youth agencies. There is concernexpressed in several countries about the inadequacy ofmental health diagnosis, treatment and care foroffenders in and out of prison. This seems to be an areasomewhat neglected which might benefit from co-operative consideration at EU level.
5.2 Psychiatric in-patient care
Large psychiatric hospitals were the inheritance of mostEuropean countries from the 19th and early 20thcenturies, often constituting the bulk of all psychiatriccare. They were characterised by stigma, socialexclusion, custodial care and therapeutic nihilism. Afterthe Second World War, new treatments and newattitudes to human rights gradually fuelled afundamental change in attitudes. De-institutionalisationstarted about 40 years ago as a pioneering programmein some communities, challenging the nature of the biginstitutions and the need for so much in-patient care.The programme also anticipated the potential fortreatment in general hospitals as for physical illness, andfor care at home, in the family, and 'in the community’.It gathered pace slowly and, though all countrieseventually joined in, the process is not yet completeeverywhere. Some countries still have relatively largenumbers of beds in large psychiatric hospitals(Netherlands, 1.8/1000; Belgium 1.6/1000). Italy mayhave undertaken the most radical programme, thoughnot the same in all parts of the country, and now has farless psychiatric hospital beds than any other Europeancountry. However, beds in 'homes' or 'centres' are notnecessarily counted in the various totals given. Swedenhas gone the furthest down the line in one importantrespect: after a programme of hospital diminution over aperiod of about 30 years, it has, since the mid 1990s had
54
5
R E S P O N S E S T O M E N T A L H E A L T H P R O B L E M S A C R O S S E U R O P E
Responses to mental healthproblems across Europe
5

no psychiatric hospitals at all, and all its 0.6/1000psychiatric hospital beds are in psychiatric units ingeneral hospitals.
Figure 61. Psychiatric hospital beds in EuropeancountriesPsychiatric hospital beds per 100,000, 1997
Source: WHO Health for All database
Overall, it cannot be doubted that there have been verysignificant reductions in psychiatric beds in mostcountries in the last two decades, a process thatcontinues, usually with increased numbers of admissionsbut dramatic reductions in length of stay. Only longer-term hospital care and care of offenders with mentalillness are now normally provided in special psychiatrichospitals, although there are exceptions to this.
The counting of 'beds' has always been difficult andcontroversial. Is it a matter of places available or bedsoccupied at a particular point in time? What institutionsare included - large psychiatric hospitals, generalhospital psychiatric units, rehabilitation institutions,specialist nursing and residential homes, shelteredhousing? It certainly does not usually include prisons,though they contain large numbers of people withmental illness. Does it include elderly people withdementia, people with alcohol or other drug problems,and other special groups? So the high provision inBelgium of 2.5/1000 beds must be understood toinclude general hospital units and many in settingsother than psychiatric hospital. And to the extremelylow provision of 0.16 beds /1000 in Italy must be addedthe 0.3/1000 beds in specialist ‘homes’. Nevertheless,even this combined Italian provision of 0.46/1000 islower than any other country. Most countries figurescurrently fall between 0.5 and 1.3/1000, but it is notalways clear what is included. In addition, the numberof necessary beds is linked to the duration of stay whichis highly dependent on the community residentialalternatives as well as the non-psychiatric resourcesavailable for low cost housing and on the social benefits
provided to patients in order to enable them to livealone. It has to be stressed that residential resourceswill always be necessary for a certain number ofpsychiatric patients who could not be treated as out-patients only.
Most countries have retained some separate psychiatrichospitals, though they have been subjected to greatchanges. They have generally been very seriouslyreduced in size, provide a range of therapeutic settingsand regimes, and are part of community-based servicenetworks. Some, as in Austria, have been re-named tocombat stigma. Many have been closed and replaced bymodern alternatives. In most countries the mostcommon therapeutic alternative is the psychiatric unitin the general hospital, psychiatry having similar statusto any other medical specialty, but some have includedshort-term beds in 'mental health centres' providing awide range of services.
Long-term care and rehabilitation is now often innursing homes or residential homes, or even in shelteredhousing, where little supervision is needed. All these areusually easier to integrate into sectorised, communityservice networks, and co-ordination and co-operation isnow the common pattern. In some countries, privatehospitals remain, often run by religious orders such as inPortugal, or traditional specialist institutions, such asthe psycho-therapeutic/psycho-somatic rehabilitationhospitals in Germany, with variable integration into thestate service system.
All countries retain some legal powers of compulsoryadmission for people considered dangerous either tothemselves or others, though the use of such powers hasbecome relatively rare in most countries. Norway still hasrelatively high use and it is a stated priority to reducethis; compulsory treatment can now be given also as anout-patient, and it is now legally required that voluntarysolutions must be tried first. Denmark is also concernedabout high levels of coercion, and is examining ways ofreducing it. Protection of patient rights under compulsoryorders has often been the subject of recent legislation,with some interesting developments. For example,Austria has patient attorneys and solicitors to protecttheir rights and interests.
In most countries, specialist teams - psychiatrists andothers - work in and from hospitals and/or mental healthcentres, and out-patient (ambulatory) care may beprovided in either or both settings. Generally speaking,where general practitioners have a gate-keeper role inthe health care system, referral to such specialists andto the hospitals is through the GP, except inemergencies. In Spain the system is very heterogeneousbecause different organisational systems exist in
0
50
100
150
200
Austri
a
Belgium
Denm
ark
Finlan
dFra
nce
Germ
any
Greec
eIre
land
Italy
Luxe
mbo
urg
Nethe
rland
s
Norway
Portu
gal
SpainSwed
enUnit
ed K
ingdo
m
1997
55
5
R E S P O N S E S T O M E N T A L H E A L T H P R O B L E M S A C R O S S E U R O P E

different communities. In general, GPs must refer to acommunity psychiatric team, which provides initial out-patient care. They can then refer to a general orpsychiatric hospital for admission. Many generalhospitals may also provide out-patient psychiatric care,often focused on the treatment of specific disorders. Ingeneral hospitals, the same specialists may work in both in-patient and ambulatory centres, but usuallycommunity psychiatric teams are independent ofhospitals. In other countries, such as Germany, there canbe direct access by patients to specialists.
5.3 Community services, facilities and support
The corollary of closing or reducing hospitals andpsychiatric in-patient care, has been the development ofa wide range of community facilities. The danger hasbeen that hospital beds would be reduced or hospitalsclosed before alternative care in the community wasdeveloped, so it has to be done with careful planning toco-ordinate both developments. This care is emphasisedin the Netherlands, and in Norway, where Parliament hasforbidden more reductions in psychiatric hospital bedsuntil community alternatives are in place.
There is a problem of definition in mental health servicesrelating to social, as opposed to medical, care, and thecountry reports give very variable, and often very little,information. It is clear that there is almost always avariety of facilities that are provided by local authoritiesor government social agencies, insurance organisations,or voluntary associations (NGOs). These may or may not,however, be defined as ‘mental health’ facilities, and mayor may not be part of a co-ordinated network of servicestogether with the formal medical care agencies. Theclose connection between the social care system andhealth care system in Denmark is by no means auniversal situation. However defined, most countriesconsider that they do not yet have enough social care,or point to particular regions which are under-developedin this respect.
There are many functions and many different locations.Out-patients are seen in specialist hospitals and centres,general hospital units and in other general settings,such as primary health care centres. Out-patients may beseen by psychiatrists, psychologists, various therapists,specialist nurses and others. Day treatment and care isavailable in psychiatric and general hospitals, mentalhealth centres and special day centres. Patients mayreceive clinical treatment, nursing care, social andoccupational therapy and rehabilitation, and familiesget respite from home care. New services have been
developed to help people back into work or providesheltered work opportunities. Support for patients andfamilies in their own homes is available from specialistpsychiatric community nurses or nurses working from thehospital, social workers, local carers and others. InFinland, with widely dispersed rural populations, theyare experimenting with tele-counselling to supportpeople at home.
Each country has many of these facilities, but few wouldclaim to have all of them in every community, andparticular facilities may include only some of thepossible functions mentioned above. Almost all admit tovariable provision across the country. And almost alladmit to problems of co-ordination of these many and varied services. Co-ordination is indeed a hugechallenge, as the providers of these community servicesusually include state and local authorities, health andsocial welfare agencies, private organisations, nationaland local NGOs, and possibly professional associations,patient and family associations. Not all will be locatedwithin the same defined community or serving the samecatchment. Not all will necessarily share the sameservice ethos or aims of care. Relationships between allthese have to be constantly worked at, and managementof community service networks, whatever their formalconstitution, is always extremely demanding.
5.4 Mental health in primary health care
In some countries, primary medical care has been thefoundation of the health care system for a long time,and general medical practitioners have been the usualmode of access to other services, generally includingmental health services. This 'gate-keeper' function, isparticular strong in Denmark, Finland, Norway, Portugal,Spain and the UK. In the Netherlands, GPs share thisfunction with social workers, psychologists and somecompany doctors. In Austria and Ireland, GPs are said tobe the usual first point of contact for patients, while inBelgium and Luxembourg, mental health is said to befully integrated into primary health care. In Germany,GPs are officially not designated as 'gate-keepers', so, ina sense, compete with specialists; yet GPs are consideredto be very important and very involved in mental healthcare. In all countries they are much less likely toinfluence access to specialists in the private sector.
56
5
R E S P O N S E S T O M E N T A L H E A L T H P R O B L E M S A C R O S S E U R O P E

However, there are reports that GPs do not generallyfunction well as regards mental health needs of theirpatients, and that their training is less adequate inpsychiatry than in physical medicine. Several Europeancountries are actively engaged in improving thissituation. In the UK this has been a major concern forsome time and psychiatric training is now one of the six-month modules included in GP training. It is notmandatory, however, and only about half of new traineesinclude this module. In Austria, GP training is being re-organised to include mandatory psychiatric training.
Such basic training is very important, but in Belgiumand Luxembourg, GPs and all primary health care staffhave regular continuing training in mental health,equally important at a time of changing treatment,services and attitudes. And, of course, for the many olderGPs who had no basic psychiatric training beyondundergraduate experience, in-service training isessential. In Germany, there have been several efforts toimprove GPs' response to patients with mental healthproblems - they see as many patients as specialists -and, also important, to improve the status of familyphysicians in a specialist-dominated medical culture. InNorway, the specialist services have a specified role insupporting and educating primary health care staff.Perhaps GP training in mental health is an example of animportant common issue in which the countries ofEurope could usefully learn from each other.
In some systems, for example Austria and Germany, GPsare largely office-based, solo practitioners, but in mostcountries where primary health care (PHC) is aprominent part of the health care system, it includes farmore than just physicians, and several countriesspecifically report developments of mental health care ina PHC context. For example, in the new Finnish system,PHC is a broad concept including most social care forpeople with mental illness; in the Netherlands, PHC formental health includes social workers and psychologists.In most UK practices, as well as several physicians, thereare practice nurses, community nurses, health visitors,and increasingly counsellors and therapists working in orfrom the practice. Sometimes specialist psychiatriccommunity nurses, psychologists, social workers andhome carers are attached to the practice, though inmany areas, these work as part of a communitypsychiatry team with a psychiatrist from a mental healthcentre serving a larger population.
Norway similarly has District Psychiatric Centres; Finlandand Sweden have also been developing multi-disciplinary specialist mental health centres. There is anadministrative dilemma, faced in several countries, inproviding multi-disciplinary community psychiatry witha full range of skills, necessarily covering a larger
catchment than the PHC units which also provide mentalhealth care, while also ensuring close co-ordination withGPs and their PHC colleagues. Not all countries rely onprimary health care to provide mental health care. Analternative model was developed in Italy, based onCommunity Mental Health Centres providing local directaccess mental health services; in France, there areMedical Psychological Centres.
5.5 Staffing issues
In many countries there have also been significantincreases in both the number and variety of professionalstaff in mental health work, and in the degree to whichthey are fully trained. The only figures for staff generallyavailable are for psychiatrists, most countries fallingbetween 10 and 19/100,000 population. However, thesestatistics too must be viewed sceptically, becausedefinitions of what constitutes a particular professionalgroup vary. Where psychiatrists are also trained aspractising neurologists, as until recently in Austria, theyneed to be counted in a different way from full-timepsychiatrists. Some other physicians and psychologistsmay have similar functions to psychiatrists, asapparently in Germany.
Figure 62. Numbers of Psychiatrists in EU CountriesNumbers of Psychiatrists per million residents, 2000
Source: Eurostat New Cronos Databank
0
50
100
150
200
250
2000
Fran
ce
United
King
dom
*
Belgium
Sweden
Norway
Austri
a
Denm
ark
Nethe
rland
s
Greece
Germ
any
Portu
gal
Finlan
d
Spain
**
Irelan
d
57
5
R E S P O N S E S T O M E N T A L H E A L T H P R O B L E M S A C R O S S E U R O P E

Figure 63. Numbers of GPs in EU CountriesNumbers of general practitioners, per 100,000 population, 2000
Source: WHO Health for All Database
There are other professionals in psychiatry in mostcountries, but we do not know the numbers or the balance between them. These include psychologists,psycho-analysts, psycho-therapists, psychiatric nursepractitioners, trained counsellors, and perhaps others.Without a commonly agreed standard taxonomy ofmedical and social professional workers we will not beable to compare service provisions and patient experience.
Overall, we can say that there are more psychologistsnow available; psychiatric nurses have been given newtraining and new roles; social workers have beenaccepted into multi-disciplinary teams; psycho-therapists and counsellors have become more widelyavailable. We can also say that training has changedover the years, probably for all groups. Yet there is littleevidence of a common pattern except increasingdiversity of staff, and increasing numbers. Staffingprofiles have been very variable in the experience ofdifferent European countries, and the distribution ofstaff is also variable within most countries.
For example, in most places psychiatrists have beenrecognised and certified medical specialists for severaldecades, but a specialist exam has only recently beenintroduced in Austria, where Psychiatry and Neurologyremained as a single specialty until less than ten yearsago. Similarly, a specialist diploma in psychiatric nursingwas introduced only in 1997. On the other hand, Austriahas many psychologists, specialising as either HealthPsychologists or Clinical Psychologists, and active indiagnosis, treatment, research and prevention. And thereare even more psycho-therapists, professionallyindependent since 1991.
Similarly, in Germany the number of psychiatrists seemscomparatively very small, but there are other physicians,psychologists, therapists, and others in mental healthpractice which can multiply that number by about ten.In systems where the cost of consultations is reimbursedfrom an insurance fund, there is an issue of whichprofessionals are encompassed. In France, psychologistconsultations are not reimbursed; in Germanypsychologists have become members of the physiciansassociation and therefore can be reimbursed.
Apart from certification and licensing, governments havebeen generally reluctant to interfere directly with theprofessions, but there is some suggestion that this ischanging. For example, in Finland, municipalities arelegally bound to develop multi-disciplinary local caresystems. In the Netherlands, national policy is toimprove the logic and transparency of the structure ofprofessions in mental health practice, as well asrequiring changes in practice based on thorough reviewof scientific evidence, as also in the UK. In Germany, theFederal Directive on Staffing of 1991 was a prescriptivelaw requiring specified multi-disciplinary staffing levels;it resulted in a 25% increase in staff of all groups from1990-1995.
Governments can also influence professional numbers byincreasing - and funding - training places, but the lagtime is a huge problem, especially for specialistphysicians; it takes at least ten years to produce newpsychiatrists. Several countries, including particularlyDenmark, Portugal and the UK, report serious shortagesof professional staff. Denmark faces a particularlyserious shortage of psychiatrists which cannot be solvedby immigration because few non-Danes speak Danish.
5.6 Patient and family involvement
A key ethical principle of modern psychiatry is theinvolvement of the patient and family, as far as possible,in decisions relating to treatment and care. In allcountries, the various legal safeguards on compulsorytreatment recognise this. In Austria there are appointedpatient attorneys and solicitors to protect their rights,and other formal mechanisms elsewhere. In theNetherlands, incorporation of patient views andpreferences is now said to be a priority; in Finland it ismandatory. In Portugal, family burdens are very high,and increasingly patients and families are gettinginvolved with wider service issues of content, style andlocation. Most commonly this is through local andnational patient and family associations or wider mentalhealth NGOs, who have for a long time had strongcampaigning and advocacy roles in many countries. Insome places, patients - users of mental health services -
0
50
100
150
200
Austri
a
Belgium
Denm
ark
Finlan
d
Franc
e
Germ
any
Irelan
d
Italy
Luxe
mbo
urg
Nethe
rland
sNor
way
Portu
gal
Sweden
United
King
dom
2000
58
5
R E S P O N S E S T O M E N T A L H E A L T H P R O B L E M S A C R O S S E U R O P E

are brought onto policy and planning bodies, as inIreland, where they argue for less drug-oriented, andmore home-based treatments.
NGOs are also involved in many countries in the provisionof services beyond advocacy; in Luxembourg they are alsoinvolved in mental health promotion and prevention, andin treatment programmes. There is an increasingvoluntary sector, providing important and unpaid servicesadditional to government provisions. In France, muchambulatory care is provided by NGOs (CMPPs). It is notalways easy to co-ordinate care between statutory andvoluntary agencies, facilities and staff, and control ofquality of care can be a problem: in Germany long-termcare homes in the voluntary sector are said often to haveinadequate psychiatric supervision, and treatment maynot be appropriate or sufficient.
Carers of people with chronic psychiatric disorders, haveparticular needs. They are often spouses, elderly parents,or children of patients and they may carry the bulk ofthe burden of care for many years. In the UK there hasbeen a major improvement in recognition of carers'needs, and rather variable provision of relief in thehome, or respite admission of the patient, but there is along way to go. Developments have been greatlyassisted by the national and local carers' associations,and by the many NGOs dedicated to particular diseases,such as the Schizophrenia Fellowship, the Parkinson'sDisease Society and the Alzheimer's Association, as wellas NGOs with broader briefs, such as MIND. There arealso European associations such as the EuropeanFederation of Families of Mentally Ill People (EUFAMI)and the European Users and Survivors of PsychiatryNetwork (EUSPIN).
5.7 Use of psychotropic drugs
Psychotropic drugs, together with psychotherapies, areessential elements for treating most psychiatric disorders.
EU countries have different policies to deal with drugsexpenses and their budgets allocated to pharmaceuticaldrugs can vary considerably. They may also have verydifferent policies toward payment by individuals, prices and retailers.
Figure 64. Pharmaceutical expenditure across Europe Total pharmaceutical expenditure, purchasing powerparity dollars per capita, 1997
Source: WHO Health for All Database
This report compares two main classes of psychotropicdrugs: antidepressants and anxiolytics (Tables 9 and 10).Three approaches are used to present data: eurosspending per inhabitant, number of prescriptions perinhabitant and defined daily dose (DDD) per 1,000inhabitants (see Section 2.2). In addition, wherepossible trends are presented and these may be moreuseful to compare countries.
0
50
100
150
200
Austri
a
Belgium
Denm
ark
Finlan
dFra
nce
Germ
any
Greec
eIre
land
Italy
Luxe
mbo
urg
Nethe
rland
s
Norway
Portu
gal
SpainSwed
enUnit
ed K
ingdo
m
1997
59
5
R E S P O N S E S T O M E N T A L H E A L T H P R O B L E M S A C R O S S E U R O P E

Table 9. Consumption of antidepressants in 14 EU countriesThree indicators used: EURO/one habitant-calculatedusing a number of Euro by number of inhabitants of the country in one year; PRESCRIPTIONS/one habitant – number of prescriptions by physicians per number ofinhabitant of the country in one year; DDD/1000inhabit./day in one year. (France and Spain DDD-calculated using a box of drug, one box containsapproximately 14 day's treatment)
It is not easy to compare data on drug use since oftendata for one type is not available for the other one.However, there are high antidepressant use countries –Sweden, Belgium and UK – and low antidepressant usecountries such as Germany, Italy, Ireland, Austria and theNetherlands. The situation in France is doubtful since theapproximation by DDD puts France in the highest categorywhen France is at the middle with other indicators. Thesame applies for Spain, but in the reverse direction.
Trends show an increase between 2000 and 2002, mainlyin Portugal (which is high in relation to the per capitaprescriptions),the UK (one of the highest) and Italy,which is low.
Table10. Consumption of anxiolytics and hypnotics in14 EU countriesEURO/inhabitant-calculated using a number of Euro by number of inhabitants of the country in one year;PRESCRIPTIONS/inhabitant - number of prescriptions byphysicians per number of inhabitant of the country inone year; DDD/1000 inhabitant/day in one year (Franceand Spain DDD-calculated using a box of drug, one boxcontains approximately 14 day's treatment)
The situation concerning anxiolytics is rather differentthan for antidepressants. Italy and Portugal are in thehighest group with Belgium and UK plus some Nordiccountries such as Finland, Sweden and Denmark.Conversely, the lowest group contains Germany, Ireland,Austria and the Netherlands (being in the lowestcategory as they were for antidepressants).
France appears to have been in the high consumptiongroup, especially if an approximation made from thenumber of units sold is used. It is worthwhile to notethat many countries see their consumption decreasing,although Spain and Portugal have seen a mild increaseand France has a relatively high rate.
In conclusion, psychotropic drug use comparisons wouldhave been very useful since they reflect care in thedifferent countries. Antidepressant use shouldcorrespond to better care of depression and eventually adecrease in suicide while an increase in anxiolytics ismore questionable in terms of evaluating use of care.
However, the data at the present time are not reliableenough to allow comparisons. In addition, these datareflect general tendencies and do not provide informationabout adequacy of care since it is not possible to know ifthe drugs are prescribed to those in need. These aspectswill be explored in the following section.
Country
EURO/one habitant
YEAR 2002 - (IMS)
PRESCIPTIONS/one habitant
YEAR 2002 - (IMS) TREND/YEARAUSBEL 2,24 (III) 0,53 (II) -5.5%
+3.4%-3.7%
-6.2%-1.2%
+1.0%+0.6%
+2.1%
DNKFNLFRA 1,70 (IV) 0,38 (IV)GER 0,41 (VIII) 0,16 (VI)IRE ----ITA 2,87 (I) 0,20 (VII)NED 0,56 (VII) 0,27 (V)NORPOR 2,84 (II) 0,61 (I)SPA 1,26 (V) 0,51 (III)SWEUK 0,30 (IX) 0,10 (VIII)
ANXIOLYTICS & HYPNOTICS
DDD/1000 inhabit./day YEAR2000
(Finland Data Bank)
4.80 (X)
53.10 (IV)81.70 (II)124 (I)5.50 (IX)
13.50 (VIII)0.30 (XI)
50.80 (V)
20,99 (VII)
62.60 (III)31.80 (VI)
CountryEURO/ habitant
YEAR 2002 - (IMS)
PRESCRIPTIONS/ habitant YEAR 2002
- (IMS)
DDD/1000 inhabit./day YEAR
2000
AUS 6.2 (XI)
BEL 7,90 (II) 0,50 (I)DNK 30.3 (VI)
FNL 35.5 (V)
FRA 6,02 (V) 0,35 (V) 49,3 (I)
GER 3,32 (IX) 0,24 (VII) 12.6 (VII)
IRE 10.4 (VIII)
ITA 3,55 (VIII) 0,24 (VII) 9.7 (IX)
NED 5,33 (VII) 0,30 (VI)NOR 41.4 (III)
POR 5, 48 (VI) 0,42 (III)SPA 6,33 (IV) 0,41 (IV) 7,45 (X)
SWE 10, 70 (I) 48.8 (II)
UK 6, 77 (III) 0,50 (II) 22.0 (V)
TREND/YEAR2000–2002
+4.72%
+8.6%
+1.8%
+10.6%
+4.2%
+9.2%
+2.1%
+8.8%
ANTIDEPRESSANTS
60
5
R E S P O N S E S T O M E N T A L H E A L T H P R O B L E M S A C R O S S E U R O P E
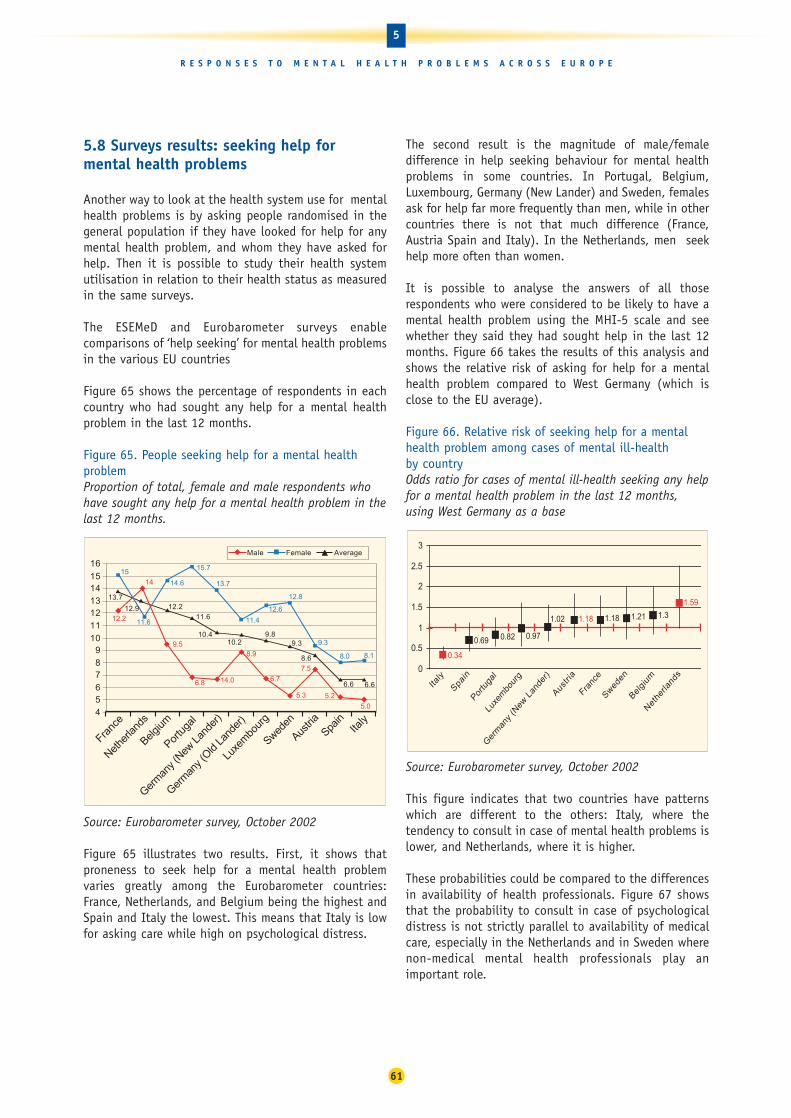
5.8 Surveys results: seeking help formental health problems
Another way to look at the health system use for mentalhealth problems is by asking people randomised in thegeneral population if they have looked for help for anymental health problem, and whom they have asked forhelp. Then it is possible to study their health systemutilisation in relation to their health status as measuredin the same surveys.
The ESEMeD and Eurobarometer surveys enablecomparisons of ‘help seeking’ for mental health problemsin the various EU countries
Figure 65 shows the percentage of respondents in eachcountry who had sought any help for a mental healthproblem in the last 12 months.
Figure 65. People seeking help for a mental healthproblem Proportion of total, female and male respondents whohave sought any help for a mental health problem in thelast 12 months.
Source: Eurobarometer survey, October 2002
Figure 65 illustrates two results. First, it shows thatproneness to seek help for a mental health problemvaries greatly among the Eurobarometer countries:France, Netherlands, and Belgium being the highest andSpain and Italy the lowest. This means that Italy is lowfor asking care while high on psychological distress.
The second result is the magnitude of male/femaledifference in help seeking behaviour for mental healthproblems in some countries. In Portugal, Belgium,Luxembourg, Germany (New Lander) and Sweden, femalesask for help far more frequently than men, while in othercountries there is not that much difference (France,Austria Spain and Italy). In the Netherlands, men seekhelp more often than women.
It is possible to analyse the answers of all thoserespondents who were considered to be likely to have amental health problem using the MHI-5 scale and seewhether they said they had sought help in the last 12months. Figure 66 takes the results of this analysis andshows the relative risk of asking for help for a mentalhealth problem compared to West Germany (which isclose to the EU average).
Figure 66. Relative risk of seeking help for a mentalhealth problem among cases of mental ill-health by countryOdds ratio for cases of mental ill-health seeking any helpfor a mental health problem in the last 12 months,using West Germany as a base
Source: Eurobarometer survey, October 2002
This figure indicates that two countries have patternswhich are different to the others: Italy, where thetendency to consult in case of mental health problems islower, and Netherlands, where it is higher.
These probabilities could be compared to the differencesin availability of health professionals. Figure 67 showsthat the probability to consult in case of psychologicaldistress is not strictly parallel to availability of medicalcare, especially in the Netherlands and in Sweden wherenon-medical mental health professionals play animportant role.
0.82 0.97
1.18
1.59
0.34
1.02 1.21 1.3
0.69
1.18
0
0.5
1
1.5
2
2.5
3
Italy
Spain
Portu
gal
Luxe
mbo
urg
Ger
man
y (N
ew L
ande
r)
Austri
a
Franc
e
Swed
en
Belgi
um
Net
herla
nds
12.2
14
9.5
6.8
8.9
6.7
7.5
15
14.6
12.6
12.8
9.3
13.712.2
11.6
10.410.2
9.89.3
8.6
6.6 6.6
5.2
14.0
5.3
5.0
8.18.0
11.4
13.7
15.7
11.6
456789
101112131415
16
Franc
e
Nethe
rland
s
Belgium
Portu
gal
Germ
any (
New L
ande
r)
Germ
any (
Old La
nder
)
Luxe
mbo
urg
Sweden
Austri
aSpa
inIta
ly
Male Female Average
12.9
61
5
R E S P O N S E S T O M E N T A L H E A L T H P R O B L E M S A C R O S S E U R O P E
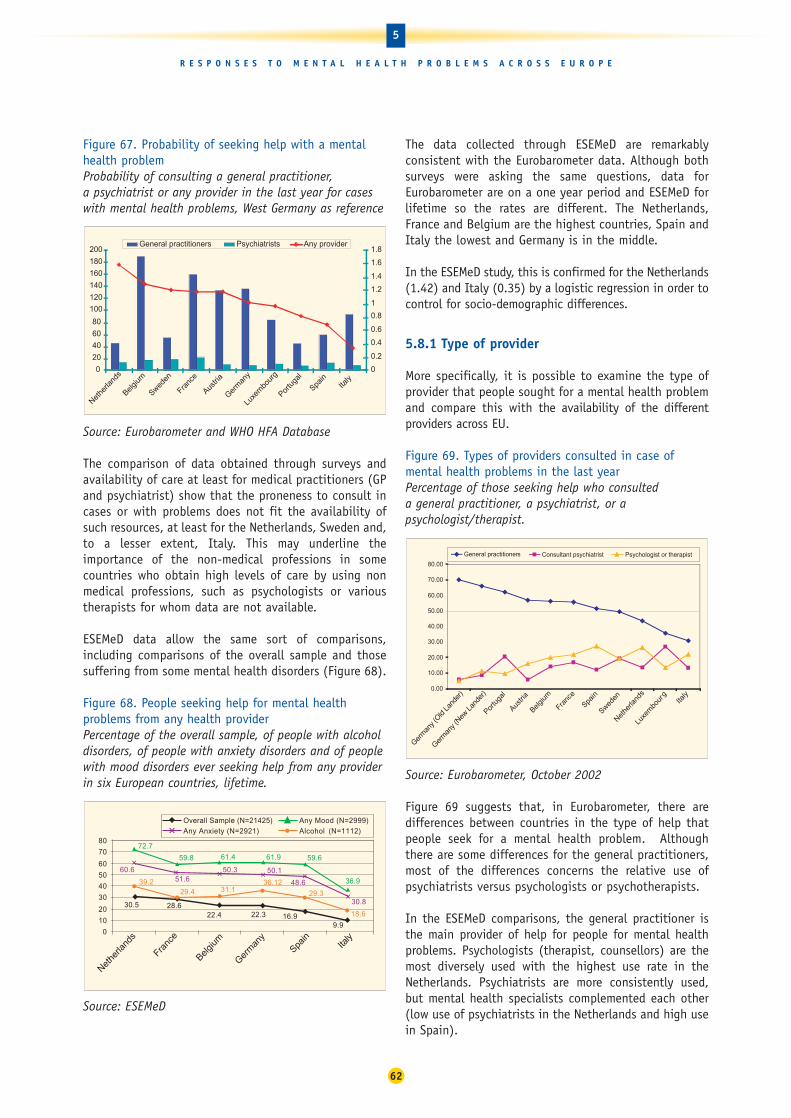
Figure 67. Probability of seeking help with a mentalhealth problem Probability of consulting a general practitioner, a psychiatrist or any provider in the last year for caseswith mental health problems, West Germany as reference
Source: Eurobarometer and WHO HFA Database
The comparison of data obtained through surveys andavailability of care at least for medical practitioners (GPand psychiatrist) show that the proneness to consult incases or with problems does not fit the availability ofsuch resources, at least for the Netherlands, Sweden and,to a lesser extent, Italy. This may underline theimportance of the non-medical professions in somecountries who obtain high levels of care by using nonmedical professions, such as psychologists or varioustherapists for whom data are not available.
ESEMeD data allow the same sort of comparisons,including comparisons of the overall sample and thosesuffering from some mental health disorders (Figure 68).
Figure 68. People seeking help for mental healthproblems from any health provider Percentage of the overall sample, of people with alcoholdisorders, of people with anxiety disorders and of peoplewith mood disorders ever seeking help from any providerin six European countries, lifetime.
Source: ESEMeD
The data collected through ESEMeD are remarkablyconsistent with the Eurobarometer data. Although bothsurveys were asking the same questions, data forEurobarometer are on a one year period and ESEMeD forlifetime so the rates are different. The Netherlands,France and Belgium are the highest countries, Spain andItaly the lowest and Germany is in the middle.
In the ESEMeD study, this is confirmed for the Netherlands(1.42) and Italy (0.35) by a logistic regression in order tocontrol for socio-demographic differences.
5.8.1 Type of provider
More specifically, it is possible to examine the type ofprovider that people sought for a mental health problemand compare this with the availability of the differentproviders across EU.
Figure 69. Types of providers consulted in case ofmental health problems in the last yearPercentage of those seeking help who consulted a general practitioner, a psychiatrist, or apsychologist/therapist.
Source: Eurobarometer, October 2002
Figure 69 suggests that, in Eurobarometer, there aredifferences between countries in the type of help thatpeople seek for a mental health problem. Althoughthere are some differences for the general practitioners,most of the differences concerns the relative use ofpsychiatrists versus psychologists or psychotherapists.
In the ESEMeD comparisons, the general practitioner isthe main provider of help for people for mental healthproblems. Psychologists (therapist, counsellors) are themost diversely used with the highest use rate in theNetherlands. Psychiatrists are more consistently used,but mental health specialists complemented each other(low use of psychiatrists in the Netherlands and high usein Spain).
0.00
10.00
20.00
30.00
40.00
50.00
60.00
70.00
80.00
Germ
any (
Old La
nder
)
Germ
any (
New Lan
der)
Portu
gal
Austri
a
Belgium
Franc
e
Spain
Sweden
Nethe
rland
s
Luxe
mbo
urg
Italy
Consultant psychiatrist Psychologist or therapistGeneral practitioners
9.9
72.7
48.6
30.8
18.616.922.322.428.630.5
36.9
59.661.961.459.8
50.150.351.6
60.6
29.3
36.1239.231.129.4
0
10
20
30
40
50
60
70
80
Nethe
rland
s
Franc
e
Belgium
Germ
any
Spain
Italy
Overall Sample (N=21425) Any Mood (N=2999)
Any Anxiety (N=2921) Alcohol (N=1112)
0
20
40
60
80
100
120
140
160
180
200
Nethe
rland
s
Belgium
Sweden
Franc
e
Austri
a
Germ
any
Luxe
mbo
urg
Portu
gal
Spain
Italy
0
0.2
0.4
0.6
0.8
1
1.2
1.4
1.6
1.8General practitioners Psychiatrists Any provider
62
5
R E S P O N S E S T O M E N T A L H E A L T H P R O B L E M S A C R O S S E U R O P E

Figure 70. People seeking help from different providersin six EU countriesPercentage seeking help from a general practitioner,psychologist, psychiatrist, other doctor, religious adviseror any healer, weighted
Source: ESEMeD
Comparisons with Eurobarometer results show someidentical results: lower level of consultations with GPs inItaly in case of mental health problems and theimportance of non-medical providers in the Netherlands.
The relationship between the primary care systems andthe specialist systems are different too, and may haveimportant consequences for care provision.
Figure 71. Referrals from a family doctor to a mentalhealth specialistReferrals from a family doctor to a mental healthspecialist among the overall sample, among people withany lifetime mood disorder, people with any lifetimeanxiety disorder and any lifetime alcohol disorder
Source: ESEMeD
In some countries, like France, there are few contactswhile in other countries, like the Netherlands or Italy,the referral is frequent. Interestingly, the relationshipholds whatever.
There are very diverse patterns of GP referral to mentalhealth specialists. The rates of referral are very high inItaly and the Netherlands but very low in France.
Ultimately the type of treatment received by the personwho suffered from mental health problems and, morespecifically, the drug prescribed, varies across countries.Figure 71 presents the rate of prescription bypsychiatrists and GPs in the ESEMeD countries. Germanyand the Netherlands show the lowest prescription trendsand this is coherent with the lowest drug consumptionin these two countries
It is noteworthy that in the two countries with the lowerrates of consultation in case of mental health problems,the GPs prescribe drugs more frequently. This maycorrespond to the fact that only very ill people seekmedical help.
Figure 71. Prescriptions of Drug for Individuals withany mental health disorder Percentage of people with any previous mental healthdisorder during their lifetime prescribed drugs by ageneral practitioner and by a psychiatrist;
Source: ESEMeD
56.8
67.463.2
93.5
64.3 64.2
45.5
92.0
51.948.1
38.3
63.2
0
10
20
30
40
50
60
70
80
90
100
Belgium France Germany Italy Netherlands Spain
Psychiatrist (N=1035)
General Practitioner
20
25
30
35
40
45
50
5560
65
70
Belgium France Germany I ta ly Netherlands Spain
Overall sample (N=2970) Any mood (N=1329) Any anxiety (N=1036) Alcohol (N=248)
05
101520253035404550556065707580
Belgium(N=552)
France(N=848)
Germany(N=815)
Italy(N=480)
Netherlands(N=754)
Spain(N=946)
Psychiatrist Psychologist therapist General practitioner
Other doctor Religious Any healer
63
5
R E S P O N S E S T O M E N T A L H E A L T H P R O B L E M S A C R O S S E U R O P E

6.1 Summary of findings
The European Union is very diverse. Member States are different in terms of population density, agingpopulations, poverty levels, cultural background andhabits, to quote some of the most notable differences.
All of these factors have been shown to have some linkswith mental health status and some of them have beenidentified as risk factors. Mental health promotion andprevention programmes are also implemented differentlythroughout the EU. This may mediate the effects of riskfactors, as well as having implications for theorganisation of mental health care and thus its efficacy.
All these make mental health differences betweencountries a high probability and render their studypotentially very promising. This should help MemberStates to design priorities and set up their own policieson promotion, prevention and care systems.
However, if mental health status is found to be differentin EU Member States, it is important to clarify whetherdifferences are due to the different levels of risk factors,the efficacy of various promotion and preventionpolicies, the efficiency of mental health care systems orall of these factors.
Unfortunately, these relationships are rather complex. Itis notable that those countries which had the highesteconomic increase - Luxembourg and Ireland - have seenan increase, over the same time, in negative mentalhealth indicators such as alcohol and drugs consumptionand that their suicide rates are increasing. Although itis important to note that low taxes on alcohol inLuxembourg, relative to neighbouring countries, meanthat the amount of alcohol purchased in Luxembourg islikely to be higher than the amount consumed.
A similar pattern can be observed, to a lesser extent, inNorway and Greece although these countries have notseen a trend towards increased alcohol consumption.Similarly, the level of poverty and the risk of poverty inthese countries are not decreasing.
To add to the complexity, mental health status acrosscountries is not easy to compare. This report showsclearly that mental health has to be multidimensionaland that each of the dimensions should be described:positive mental health, psychological distress and
psychiatric disorders (diagnoses approach). These threeapproaches are not parallel and complement each other,along with data on alcohol, tobacco and illicit drugs,suicide and psychotropic drug consumption.
Before summarising the major findings, some warningsare necessary:
• even though standardisation of most mental healthinstruments has been completed through manystudies, translation of mental health state is one ofthe most difficult tasks, so it is always difficult tointerpret any differences
• the countries which have done the most intensivepsychiatric epidemiology studies: the UK and, to alesser extent, Finland could hardly be used incomparisons because the instruments used weredifferent. However, psychological distress in the UK,as measured by a national survey, could be comparedto ESEMeD findings for psychological distress
• study design differences make it nearly impossible tocompare independent studies and even difficult to compare multi-country designed surveys. InEurobarometer, for example, many countries have hadto be omitted from the analysis because of the very low participation rates. Similarly, in ESEMeD thesampling design was not genuinely identical.However, comparisons of psychological distressbetween these two independent studies show nearidentical results. This gives confidence that, whenusing the same instrument on a representative sampleof a country, reproducible results can be obtained
• no comparative longitudinal studies were available.This renders it impossible to compare the evolutionof risk factors and to link them to mental health, aswell as to any promotion/prevention interventions.However, alcohol and suicide data are provided byWHO in a longitudinal manner. This enables thepresentation of some trends and inferences: in mostcountries a reduction in alcohol consumption isfollowed by a reduction in deaths from suicide butthis could also be due to better management ofdepression, increased use of antidepressants or both.
Some risk groups can be described:
• Women have consistently lower positive mentalhealth levels than men in all the countries where datawere available In all but three countries –Netherlands, Austria and Luxembourg – females have
64
6
C O N C L U S I O N S A N D R E C O M M E N D A T I O N S
Conclusions and recommendations6

higher risk for psychological distress than males.However, within the countries where the risk is higherfor females, Portugal shows a much larger risk forwomen than the other countries (except Sweden andItaly). In addition, in the six European countrieswhere we have morbidity data, women consistentlyscore higher than men for any 12-month mooddisorder. When all disorders are put together,including alcohol disorders, women still have a higherrisk, except in Belgium. Italy and Spain carry morerelative mental health risks for women than Germanyand Belgium.
• Age has been also regarded as a risk factor for youngpeople, as well as for older people, who will becomea large group in all the EU countries. In the ESEMeDcountries, young people have no higher risk that theadult population: except for France when anydisorders are considered. However, when the type ofdisorder is considered, it appears that the youngpopulation is more at risk of anxiety disorders inSpain and Germany. In the Eurobarometer, Swedenhas a lower risk for older people and three countrieshave higher risk: Austria, Germany and Portugal.Despite all the research reported by experts, there isno consensus about whether the prevalence ofdepression increases or decreases with age andstudies have reached conflicting results. This ispartially due to the fact that many studies excludedinstitutionalised individuals,where the oldest old aremost present. Studies on dementia conducted indifferent European regions seems to reflectmethodological differences rather than real differences.
• Marital status and living arrangements is another riskfactor. In the Eurobarometer results, those divorced,separated or widowed carry a higher risk ofpsychological distress in all the countries.
• Occupation and occupational status are also mentalhealth determinants. However, the few EU data whichexist on stress show the highest rates amongprofessionals and lowest among elementaryoccupations and agricultural workers, below averagefor craft workers, clerks and service workers, whileabove average for technicians and managers. Butthese data are hard to interpret further because theyare based on simple questions which assessed anopinion about the impact of work on health, but wedo not have any measure of the mental health statusof these people. In Eurobarometer, Austria, Franceand Belgium are the only countries to have higherrelative risks for those who are unemployed.
• Poverty has also been linked to poor mental health. Inthe data available for comparison, all countries exceptItaly show a higher risk for those with low income. Thisrisk, however, seems especially high for Portugal, whereit is significantly higher than Sweden and Austria.
• Environment is also influential for mental health andcomparing rural and urban differences in mentaldisorders is important for the organisation of careservices. However, definition of urban/rural differencesis a subject of concern since most of the studieslooking into this issue use different definitions whichrender comparisons difficult. Data reported here seemto show that there are differences, but that most ofthem may due to diverse sociodemographic factorssuch as the fact that there are more divorced people inurban areas and more older people in rural areas.
• Immigration has also be considered as carrying aspecial risk relating to mental health. In Europe,epidemiological studies, which offer information onmental health status of immigrants, are still very rare.There is little data available with regard to the levelof psychological and physical problems among thosewho are culturally different, owing to inadequatesystems of registration.
The use of services is also one of the determinants ofmental health. Although each Member State chooses toorganise its own care system according to nationaltraditions, adequate care should be available for eachEU citizen.
Resources can be compared across countries concerningGPs and psychiatrists, whose numbers are recordedrelatively precisely. However, the non-medical mentalheath professions, whose role is important is the caresystem for mental health disorders are poorly definedand recorded across the EU. The same applies to a lesserextent, to psychiatric beds, whose definitions are rathervaried, as well as to the availabilty of alternative socialresources across EU.
Among the care provided for mental health disorders,psychotropic drug use comparisons would have beenvery useful since they reflect care in different countries.Antidepressant use should correspond to better care ofdepression and eventually a decrease in suicide while anincrease in anxiolytics is more questionable in terms ofevaluating use of care. However, the data at the presenttime are not reliable enough to allow comparisons. Inaddition, these data reflect general tendencies and donot provide information about adequacy of care since itis not possible to know if the drugs are prescribed tothose in need.
65
6
C O N C L U S I O N S A N D R E C O M M E N D A T I O N S

Surveys provided data on use of care for those sufferingfrom mental health disorders. EU surveys show withoutambiguity that proneness to seek help for a mentalhealth problem varies greatly among the Eurobarometercountries: France, Netherlands, and Belgium being thehighest and Spain and Italy the lowest. There is also animportant difference between male and female pronenessto ask for help in case of psychological problems.
In Portugal, Belgium, Luxembourg, Germany (NewLander) and Sweden, females ask for help far morefrequently than men, while in other countries there is notthat much difference (France, Austria Spain and Italy). Inthe Netherlands, men seek help more often than women.
In case of mental health disorders, some countries havepatterns which are different from the others. When theseprobabilities are compared to the differences inavailability of health professionals, the probability toconsult in case of psychological distress is not strictlyparallel to availability of medical care, especially in theNetherlands and in Sweden where non-medical mentalhealth professionals play an important role.
When comparing the care providers, generalpractitioners are the most common. Most of thedifferences concern the relative use of psychiatristsversus psychologists or psychotherapists.
The relationships between the primary care systems andthe specialist systems are different too. This may haveimportant consequences for care provision, since insome countries general practitioners do not have muchcontact with the specialised professionals.
Thanks to ESMED and Eurobarometer six countries couldbe studied with a multi-dimensional approach. They canbe clustered into four profiles:
• France, which has concordant negative mental healthindicators: positive mental health is low, psychologicaldistress is also high and, in addition, the diagnostic approach shows high level of psychiatric disorders.Deaths from suicide and alcohol are still high, eventhough there is a tendency to decrease.
Young people seems to have a higher risk for mooddisorders than adults. Older people seem to have alower risk of mood disorders, but suicide rates in theolder population are higher. Unemployed people havea higher relative risk of psychological distress than inother countries.
Help seeking behaviour and psychotropic drug useshow high rates. The mental health system reliesheavily on general practitioners, with very low levelsof contact with the mental health specialist system
• Italy and Spain have concordance and somedifferences: both of them have low levels of diagnosisof psychiatric disorders, but relatively high levels ofpsychological distress (especially Italy). The positivemental health indicators are in opposite directions:low in Italy and high in Spain.
Both Italy and Spain have low levels of suicide,alcohol consumption and low levels of help seekingbehaviour. Spain has high illegal drug consumptionbut we have no data for Italy.
Interestingly, the high risk population groups seemsto be diverse. The young Spanish have higher ratesfor anxiety disorders than the whole Spanish adultpopulation and older Italian women seem to haverelatively high rates of psychological distress.
• The Netherlands and Belgium have common featuresand differences, as well. They both have low levels ofpsychological distress and high levels of psychiatricdisorders with the diagnostic approach along withhigh levels of positive mental health. This is thereverse of the situation in Italy. Both countries arehigh in health seeking behaviour and in theNetherlands there are important links betweengeneral practitioners and non-medical mental healthproviders. The Netherlands supports quite a lot ofmental health promotion/prevention programs . Bothcountries are relatively low in alcohol consumptionbut the Netherlands still has high levels of illegaldrug use (no data on Belgium). Suicide rates are highin Belgium and low in the Netherlands.
• Germany remains on its own and is at the mediumlevel for all indicators. This may be due to a ratherdiverse population especially between the ‘old’ and‘new’ Lander which show some differences. However,Germany seems to have some specific populations atrisk: young people have a higher risk for anxiousdisorders (as in Spain), those who were previouslymarried, those who are unemployed and migrantshave a higher risk for mood disorders.
Two other countries may be commented on:
• The UK, according to the few comparable data thatare available, seems to be in a good position: lowlevels for psychological distress and suicide rates,although the level of illegal drug use is high.
66
6
C O N C L U S I O N S A N D R E C O M M E N D A T I O N S

• Portugal seems to have higher risk for its femalepopulation which has the highest female/male ratio,for the Eurobarometer countries. The older populationis also at a higher risk than in the other countries, aswell as those with low income. Illegal drug use is alsoa risk; when deaths of undetermined intent are addedto the suicide rates, the position of Portugal is farworse than in appears in statistics for deaths bysuicide alone, where the rate is low.
Lack of pertinent data makes comments on othercountries unavailable and does not reflect their riskgroups and the mental health status of theirpopulations.
All these findings have to be interpreted with caution;they may reflect answer style rather than mental health state. Nonetheless, these findings illustrate thatcomparisons are feasible and it is up to the country tointerpret them and to act accordingly. At any rate, thisattempt to draw comparisons could support mentalhealth development for mental health promotion/prevention and care in different countries by underlyingsome risk groups or targeting problems. This analysiscan also stimulate inter-country exchange on diversepractices for promotion/prevention as well as healthcare organisational patterns.
It also hoped that this analysis will stimulate thenecessary steps to obtain fully reliable comparable datain the European Union (see conclusions).
6.2 Conclusions
Mental health is an essential part of health and itsburden is important quantitatively and qualitatively
Mental health is crucial to the overall well-being ofindividuals and societies throughout Europe. Mentalhealth problems place a heavy personal and emotionalburden on individuals and their families. There are alsofinancial costs for individuals and for societies – thecosts of mental health problems in the European Unionis estimated to be between 3% and 4% of Gross NationalProduct. Therefore, mental health should be monitoredby following and comparing mental health indicatorssuch as those proposed by the monitoring working groupon mental health.
Comparisons of mental health between EU MemberStates and of the socio-economic determinants ofmental health are essential and feasible, but suchcomparisons have to be interpreted with caution
When trying to compare population mental health acrossEurope, many indicators could be used that reflectdiverse aspects: positive mental health, psychologicaldistress, psychiatric morbidity, suicide and substancemisuse. Social and economic determinants could becompared. Access to care for mental health problems indifferent Member States and prevention/promotionpolicies could also be compared.
These comparisons could potentially make an importantcontribution towards advancing our understanding ofwhat can lead to mental ill-health and how to promotegood mental health. Because the social and healthsystems are different, inter-country comparisons willcontribute to discussions comparing the relativeefficiency of systems by looking at differences in theresilience of different groups who are at risk. Nationalhealthcare policy-makers are continuously looking forsuch comparative data to shape their reforms and to helpthem explain these reforms to the public. Comparisonsmay be one of the more compelling subsidiarity tools inthe EU but should be cautiously interpreted until thereare more successful efforts to collect data in acomparable manner across EU Member States.
Effective policies could have a major effect on mental health
This report has shown that a number of indicators, suchas alcohol consumption and suicide, have improved inmost countries over the last 20 years thanks to publichealth policies. This should encourage the remainingcountries, including the new Member States, tointroduce similar policies. Some countries have alsoachieved very good results in decreasing acute drug-related deaths and the consumption of many drugs. Moreover evidence-based promotion/preventioninterventions have been developed and should beimplemented at the country level: these concernchildren, adult and older populations.
6.3 Recommendations
Most of the recommendations need to be considered forimplementation at the EU, as well as at the country,level. However, these are presented separately at thedifferent levels for clarity.
67
6
C O N C L U S I O N S A N D R E C O M M E N D A T I O N S

6.3.1 EU level recommendations
Promoting good mental health should be a priority forpublic health in Europe
Given the importance of mental health for good health,and in light of the increasing burden of mental healthproblems, prevention and promotion in the field ofmental health deserve to be considered as a publichealth priority across Europe.
The development of health promotion strategies shouldbe implemented by the European Union, among others,through facilitating the exchange of best practice andproviding tools which can help Member States tounderstand their mental health situation and to promotegood mental health.
Mental health status comparisons will accompany thisby following positive mental health indicators.
Take mental health into account in public health andother policies in Europe
Given that there is no good health without good mentalhealth, it is clear that comprehensive strategies toenhance public health need to incorporate policies topromote good mental health.
In addition to specific health policies, there are manyother policy areas which could have an impact onmental health. The potential health consequences of awide range of policies was recognised in Article 152 ofthe Maastricht Treaty which states that ‘a high level ofhuman health protection shall be ensured in thedefinition and implementation of all Community policiesand activities’.
The evidence drawn from this report should bring inrelevant policies including those relating to gender,ageing, migration and rural/urban development. There isalso a wide range of policies which can affect socialdisadvantage – such as policies relating to the economy,social security, employment, and housing – and which,in turn, can have an impact on mental health. It isimportant to consider the potential mental healthimplications of any developments in these policy areas.
The potential health consequences of policydevelopments should be evaluated through the processof health impact assessment at the EU level. Methods toassess the potential mental health impact of policiesshould be developed and incorporated into EU healthimpact assessment processes and these comparisonswill be an important element of this.
Need for collection of information about mental healthacross the EU in an appropriate way to enable validcomparisons
A considerable volume of existing research into mentalhealth already exists throughout Europe. Data isgathered throughout Europe by collection of routinestatistics and through surveys at the regional, nationaland European levels. Although this research hasproduced valuable evidence, it is not often possible tomake general conclusions because of incompatiblemethods, measures and analyses.
The full potential of existing research and datacollection is currently not realised. Standardising andvalidating a small range of instruments and indicators,and closer collaboration between researchers, especiallyacross the EU, would both facilitate and economise onfuture studies.
Since most of the mental health morbidity data have tobe collected through population surveys:
• A common core of standardised instruments aboutmental health have to be included in specialist ormore general surveys across Europe;
• Data should be collected in a comparable manner.This should include ensuring that sample design, fieldtraining and quality control of the data collection arecarried out in the same way and that analyses areconducted on a common data bank in order to use thesame statistical tools and methods. Guidelines shouldbe issued and implemented to cover all these topicsand EU-level data collection should be stronglysupported by EU;
• Strict definitions and data collection guidelines, aswell as a quality control handbook, should also be issued for routinely collected statistical data. Thisshould include, for instance, suicide data,psychotropic drug use data and substance use data.
This collection and exchange of data needs to beencouraged and facilitated at the European level. Therole of the Commission in helping to standardiseindicators, developing infra-structure and mechanismsfor data exchange and supporting networks forinformation exchange and co-ordination has beenimportant and the mental health task force shouldcontinue this task.
68
6
C O N C L U S I O N S A N D R E C O M M E N D A T I O N S

6
C O N C L U S I O N S A N D R E C O M M E N D A T I O N S
69
However, there is a need for:
• Mechanisms to be set up to implement all this work ineach Member State,
• EU-level designed high quality surveys such as theLabour Force Survey to include basic mental healthquestions on a regular basis. General Health Surveys atthis level should include a mental health sectionfollowing the mental health monitoring grouprecommendations. This also applies to any EU health-related survey, such as those conducted on workingconditions. To obtain these results, health survey teamsshould integrate a mental health epidemiologist asconsultant in order to ensure psychometric properties ofthe questions.
• Translation, standardisation and clinical validation ofinstruments between different languages and cultures ispoorly researched: this ought to be a major priority forEuropean research and development,
• Long term longitudinal studies, including studies ofincidence and of long term outcome in the community.Lifetime incidence requires definitive study.
The experts strongly recommend the setting up of aEuropean cohort study on health, with a mental healthpart developed according to the recommendations ofthe monitoring group experts and with carefulattention to transnational validation of instruments.
Need to produce on a regular basis, such as five years, areport on mental health which collects and compares datafrom all sources and which includes the enlarged Europe
The data collection effort should be accompanied by aneffort to synthesise data from all sources with consideredconclusions about their differences and careful attentionto their comparability as has been done in this report. Itis important that this report includes data collected aboutthe mental health of children, adolescents, older peopleand immigrants.
A fixed interval for such a report will underline theimprovements in standardisation and the places wheremore effort are needed. This follow up will strengthen thenecessity of, and interest in, co-operation in the collectionof comparable and good quality data across the EU.Hopefully this will help enable more solid conclusionsabout differences which can be seen.
This process will help to create a stable group of EU mentalhealth scientists aware of international comparisons inthis field and able to produce EU knowledge and skills.
Need to make a bridge between scientific results andpolicy development through dissemination of evidence-based practice for policy makers
Of course the comparative exercise described above shouldbring concrete results for EU policymakers. Research relatingmental ill-health to risk factors such as age, gender ordisadvantage has already produced a wealth of usefulevidence. It is often difficult, however, to draw on thesefindings to make evidence-based conclusions relevant topolicy because the research is not designed in ways that canbe useful to policymakers by using definitions, which aremeaningful in a policy context.
Multidisciplinary team where scientists and policymakersfrom the EU work together to produce readable and validdocuments for policy makers, should continue with theenlarged EU, as in the ENMPRO network.
6.3.2 At the country level
Importance of policies to tackle social disadvantage toaddress inequalities in health
In each EU country the data shows very marked socialinequalities in mental health. People of lower socio-economic status, however it is measured, aredisadvantaged,and this includes higher frequencies ofcommon mental health problems, such as depression andanxiety. In Europe, relatively high frequencies of mentalhealth problems are associated with poor education,material disadvantage and unemployment. Their largecontribution to morbidity and disability, and the socialconsequences in working age adults, would justifysubstantial priority being given to addressing mentalhealth inequalities, and deprivation in general, withinnational and European social and economic policy.
Setting up intersectorial mental health structures topromote mental health vision in each relevant policy sector.
Importance of developing promotion and prevention andfurther development of mental health services
Although this report has focused on mental health, ratherthan mental illness, some common themes emerge relatingto mental health promotion, care and services. Thesethemes reflect consultation with national expertsthroughout the European Union.
• The development of practical strategies to prevent alcoholand drug abuse should be continued and implemented inthe countries where this is not the case. Mental healthpromotion projects for children and parents should bedeveloped and evaluated across the diverse cultural,educational and economic contexts of Europe.

• Inequitable access to mental health care for somedisadvantaged groups is a concern for many Europeancountries. Some Member States face considerablechallenges in addressing geographical inequalities ofdistribution and access to care. A number of specialgroups have been identified as of particular concern:children, the very old, homeless people, prisoners andmigrants. All Member States are aware of the futureburden of dementia with the ageing population.
Each EU country should develop specific approachesfor bringing care available to the most disadvantagedpeople and make specific plans for mental caredelivery to older people.
• The development of mental health services should beguided by the evidence base. To achieve this, rigorousevaluation of services and good management ofinformation about services should be implemented ineach EU Member State and inter-country comparisonsshould be supported by the EU.
Implement EU data collection guidelines andinstruments in each health-related survey and conductmental health surveys accordingly at regular periods(every 7 years minimum)
Each Member State should commit itself to implementingEU guidelines on instrument and survey design.
Each Member State should also undertake to introducethese elements into any health-related survey
In addition, each Member State should undertake toconduct a national general mental health survey, usingthe guidelines described above, on a regular basis and tomake these databanks available for EU mental healthepidemiologists in order to conduct comparative analyses.
70
6
C O N C L U S I O N S A N D R E C O M M E N D A T I O N S

71
A N N E X
ANNEX 1 Principal Characteristics of surveys selected for meta analysis
Country Year & title of study Measures Age Sample (Reference number) (& diag. System) range size (N)
1. Austria: national 1991 Attitudes of Austrian GHQ-12 14+ 1,278 pop to mental illness & psychiatry
2. Belgium: Bruxelles-Capitale 1997 Belgian National Health Survey GHQ-12; SF-36 15+ 2,397
3. Belgium: Flandre Region 1997 Belgian National Health Survey GHQ-12; SF-36 15+ 2,914
4. Belgium: Wallonie Region 1997 Belgian National Health Survey GHQ-12; SF-36 15+ 2,901
5. Belgium: Province of Liege 1997 Epidemiology of psychiatric CIDI 2.1; SF-36 15+ 1,040 problems in Province of Liege (DSM IV)
6. Belgium: Pr of Luxembourg 1997 Epidemiology of psychiatric CIDI 2.1 (DSM IV) 18–54 1,244problems in Prov. Luxembourg
7. Finland: national 1978-80 Mini Finland Health Survey GHQ-36 30+ 7,217
8. Finland: national 2000 'Health 2000' CIDI; GHQ-12 30+ 8,028
9. France: Paris 1994-96 Comparative study Paris, CIDI-S; (ICD 10) 18+ 2,260Sardinia & migrants
10 France: Normandy 1996 Santé des bas Normands CIDI-S; (DSM-IV) 18+ 1,445
11. France: Ile de France 1991 Santé des Franciliens CIDI-S; (DSM-IIIR) 18+ 1,183
12. Germany: national 1999 German Health Survey, M-CIDI; SF-36 18–65 4,181 Mental Health Supplement (DSM IV)
13. Germany: Lubeck & region 2000 TACOS M-CIDI; (DSM IV) 18–64 4,075
14. Italy: Sardinia 1994-96 Comparative study Paris, CIDI-S; (ICD 10) 18+ 1,040Sardinia & migrants
15. Netherlands: national 1996 NEMESIS CIDI 1.1; SF-36; 18–64 7,076 GHQ-12 (DSM IIIR)
16. Spain: Catalonia <1994 Mental disorders in the gen. GHQ-12 14+ 8,400population of Catalonia
17. UK: England 1995 Health Surveys of England GHQ-12 16+ 15,553for 1993 and 1995
18. UK: England, Wales 1987 The Health and Lifestyle Survey GHQ-30 18+ 9,003 & Scotland
19. UK: Northern Ireland 1997 The First Northern Ireland GHQ-12; SF-36 16+ 2,093 Health and Well-being Survey
Notes: M-CIDI is the Munich version of the German CIDI. Only CIDI gives a 'probable diagnosis', so only in these surveys is a taxonomic system given. Sample sizes are with respect only to the particular measures under analysis.
72
ReferencesIntroduction
1 Decision No 1786/2002/EC of the European Parliament andof the Council of 23 September 2002 adopting a programme ofCommunity action in the field of public health (2003-2008) –Commission Statements Official Journal L 271, 09/10/2002,P0001 – 00122 World Health Organization (2003). Investing in MentalHealth. Geneva, World Health Organization.3 Korkelia, JA, Lehtinen, V, Bijl, RV, Dalgard, OS, Kovess, V,Morgan, A and Salize, HJ (2003) Establishing a set of mentalhealth indicators for Europe. Scand J Public Health, 31: 1-84 Ayuso-Mateos, JL, Vazquez-Barquero, JL, Dowrick, C,Lehtinen, V, Dalgard, OS, Casey, P, Wilkinson, C, Lasa, L, Page,H, Dunn, G, Wilkinson G and the ODIN group. Depressivedisorders in Europe: prevalence figures from the ODIN study.(2001) Brit J Psychiatry, 179, 308-316.5 The ESEMeD/MHEDEA 2000 Investigators. Acta PsychiatrScandin 2004; 109 (Suppl 420): 1-64.6 The European Opinion Research Group (2002) The MentalHealth Status of the European Population. Eurobarometer 58.2Public Health Approach on Mental Health in Europe
Comparing Mental Health in Europe
1 World Health Organization, Regional Office for Europe Healthfor All Databasewww.who.dk/hfadb2 Organisation for Economic Co-operation and Developmentwww.oecd.org/statsportal/3 Eurostat’s Newcronos reference databankwww.europa.eu.int/newcronos/4 World Health Organization Global Alcohol Database5 European Monitoring Centre for Drugs and Drug Addiction.Annual Reports on the state of the drug problem in theEuropean Union and Norway. Lisbon, EMCDDA.6 The ESEMeD/MHEDEA 2000 Investigators. Acta PsychiatrScandin 2004; 109 (Suppl 420): 1-64.7 Singleton, N., Bumpstead, R., O'Brien, M., Lee, A., and Meltzer,H. Psychiatric Morbidity Among Adults Living in Private Households.National Statistics. 154. 2001. London, The Stationery Office.
Mental Health Status in Europe
1 The European Opinion Research Group (2002) The MentalHealth Status of the European Population. Eurobarometer 58.2Public Health Approach on Mental Health in Europe2 The ESEMeD/MHEDEA 2000 Investigators. Acta PsychiatrScandin 20004; 109 (Suppl 420): 1-64.
3 Lehtinen V, 2003. Personal communication.4 Kovess, V., Alonso, J., de Graaf, R., Demyttenaere, K., AnEuropean approach of Rural-urban differences in MentalHealth: the ESeMED comparative study. Acta PsychiatricaScandinavia (submitted) 5 Meyer et al, 2001. Transitions in Alcohol Consumption andSmoking (TACOS). Neurology, Psychiatry & Brain Research.6 Wittchen H -Ul, Carter RM, Pfister H, Montgomery SA &Kessler RC, 2000. Disabilities and quality of life in pure and co-morbid generalized anxiety disorder and major depression in anational survey. International Clinical Psycho-pharmacology, 15(6): 319-328.7 Bijl RV, van Zessen G & Ravelli A, (1998) Prevalence ofpsychiatric disorder in the general population: results of theNetherlands Mental Health Survey and Incidence Study(NEMESIS). Soc Psychiatry Psychiatr Epidemiol 33: 587-595.8 Carta MG, Kovess V, Hardoy MC, Morosini PL, Murgia S &Carpiniello B, 2002. Psychiatric disorders in Sardinianemigrants in Paris: a comparison with Parisians and Sardiniansresident in Sardinia. Social Psychiatry and PsychiatricEpidemiology 37: 112-117.9 Kovess V & Mouchiroud C, 2000. Defining urbanicity and itseffect on mood: comparisons between two French regions. Paris,MGEN Foundation.10 Jenkins, R., Lewis, G., Bebbington, P., et al (1997) Thenational psychiatric morbidity surveys of great Britain – initialfindings from the household survey. Psychological Medicine,27, 775-789.11 Singleton, N., Bumpstead, R., O'Brien, M., Lee, A., andMeltzer, H. Psychiatric Morbidity Among Adults Living in PrivateHouseholds. National Statistics. 154. 2001. London, TheStationary Office.12 Paykel ES, Brugha T, Fryers T (2004) Size and burden ofdepressive disorders in Europe. In: European Review on Sizeand Burden of Mental Disorders. To be published in EuropeanNeuropsychopharmacology.13 Torrey EF. Prevalence studies in schizophrenia. Br JPsychiatry 1987:150:598-608. 14 Häfner H, an der Heiden W. Epidemiology of schizophrenia.Can J Psychiatry 1997:42:139-151.15 Lehtinen V, Joukamaa M, Lahtela K, Raitasalo R, JyrkinenE, Maatela J, Aromaa A. Prevalence of mental disorders amongadults in Finland: basic results from the Mini Finland HealthSurvey. Acta Psychiatr Scand 1990:81:418-425.16 Hovatta I, Terwilliger JD, Lichtermann D, Mäkikyrö T,Peltonen L, Lönnqvist J. Schizophrenia in the genetic isolateof Finland. Am J Med Genetics 1997:74:353-360.17 Böök JA. (1953) A genetic and neuropsychiatricinvestigation of a North-Swedish population. Acta Genet(Basel) 4:345-414.18 Jablensky, A., McGrath, J. J., Herrman, H., Castle, D. J.,Gureje, O., Morgan, V., and Korten, A. People Living withPsychotic Illness: An Australian Study 1997-98. 4, 103. 1999.Canberra, Commonwealth of Australia. National Survey ofMental Health and Wellbeing.
R E F E R E N C E S

R E F E R E N C E S
73
Suicide19 Christi P, Stone DH, Corcoran P, Williamson E, Petridou E.(2003) EUROSAVE Working Group. Suicide mortality in theEuropean Union. Eur J Public Health, 13: 108-14.20 Murray CJL, Lopez AD. (1997) Mortality by cause foreight reasons of the world: Global Burden of Disease Study.Lancet, 349:1269-1276.21 McIntosh, JL. Epidemiology of suicide in the elderly.Suicide Life Threat Behav, 1992; 22: 15-35.22 Pelknonen M, Marttunen M. (2003) Child and adolescentsuicide: epidemiology, risk factors and approaches toprevention. Paediatr Drugs, 5(4): 243-265.
Alcohol, tobacco and drugs23 Murray CJL, Lopez AD. The global burden of disease. Acomprehensive assessment of mortality and disability fromdisease, injuries and risk factors in 1990 and projected to 2020.Cambridge, MA: Harvard University Press, 199624 World Health Organization (2000) European Alcohol Action Plan2000-5. Copenhagen, WHO Regional Office for Europe25 European Monitoring Centre for Drugs and Drug Abuse(EMCDDA). Annual Report 2003: The state of the drugs problemin the European Union and Norway26 European Monitoring Centre for Drugs and Drug Abuse(EMCDDA). Annual Report 2001: The state of the drugs problemin the European Union and Norway
Protective and Risk Factors
Gender1 Kahn R.S., Wise P.H., Kennedy B.P., Kawachi I. State incomeinequality, household income, and maternal mental andphysical health : Cross-sectional national survey. BritishMedical Journal; 321(7272): 1311-5; 2000.2 Emslie C., Hunt K., Macintyre S. (1999) Problematizinggender, work and health: the relationship between gender,occupational grade, working conditions and minor morbidity infull-time bank employees. Social Science and Medicine. 48: 33-483 World Health Organization (2002). World report on violenceand health, Geneva: WHO.4 Schmidtke, A., Bille-Brahe, U. DeLeo, D; Kerkhof, A; Bjerke, T; Crepet, P; Haring, C; Hawton, K; Lonnqvist, J; Michel, K; Pommereau, X; Querejeta, I; Phillipe, I; Salander-Renberg, E; Temesvary, B; Wasserman, D; Fricke, S; Weinacker,B; Sampaio-Faria, JG. Attempted suicide in Europe: rates,trends and sociodemographic charcateristics of suicideattempters during the period 1989-1992. Results from theWHO/EURO Multicentre study on parasuicide. Acta PsychiatricaScandinavica. 93: 327-338; 1996
Age5 European Commission (2000). Report on the state of youngpeople’s health in the European Union. Luxembourg: Office forOfficial Publications of the European Communities.
6 Lutz W, Scherbov S. First probabilistic population projectionsfor the European Union. In: Lutz W, editor. Kompendium derFamilienforschung in Österreich 1999. Vienna: Schriftenreihedes ÖIF Nr.7, 1999: 123-139.7 Dunham NC, Sager MA. Functional status, symptoms ofdepression, and the outcomes of hospitalization incommunity-dwelling elderly patients. Arch Fam Med 1994;3(8):676-80; discussion 681.8 Wells KB, Stewart A, Hays RD, Burnam MA, Rogers W, DanielsM, Berry S, Greenfield S, Ware J. The functioning and well-being of depressed patients. Results from the MedicalOutcomes Study. JAMA 1989; 262(7):914-919.9 Conwell Y, Duberstein PR, Cox C, Herrmann JH, Forbes NT,Caine ED. Relationships of age and axis I diagnoses in victims of completed suicide: a psychological autopsy study.Am J Psychiatry 1996; 153(8):1001-1008.10 Rovner BW, German PS, Brant LJ, Clark R, Burton L, FolsteinMF. Depression and mortality in nursing homes. JAMA 1991;265(8):993-996.11 Ganzini L, Smith DM, Fenn DS, Lee MA. Depression andmortality in medically ill older adults. J Am Geriatr Soc 1997;45(3):307-312.12 Aguero-Torres H, Fratiglioni L, Guo Z, Viitanen M, WinbladB. Prognostic factors in very old demented adults: a seven-yearfollow-up from a population-based survey in Stockholm. J Am Geriatr Soc 1998; 46(4):444-452.13 Morgan K, Dallosso HM, Arie T, Byrne EJ, Jones R, Waite J.Mental health and psychological well-being among the old andthe very old living at home. Br J Psychiatry 1987; 150:801-807.14 Lindesay J, Briggs K, Murphy E. The Guy's/Age Concernsurvey. Prevalence rates of cognitive impairment, depressionand anxiety in an urban elderly community. Br J Psychiatry1989; 155:317-329.15 Livingston G, Hawkins A, Graham N, Blizard B. The GospelOak Study: Prevalence rates of dementia, depression andactivity limitation among elderly residents in Inner London.Psychological Medicine 1990; 20(1):137-146.16 Prince MJ, Harwood RH, Blizard RA, Thomas A, Mann AH.Impairment, disability and handicap as risk factors fordepression in old age. The Gospel Oak Project V. Psychol Med1997; 27(2):311-321.17 Osborn DP, Fletcher AE, Smeeth L, Stirling S, Bulpitt CJ,Breeze E, Ng ES, Nunes M, Jones D, Tulloch A. Factorsassociated with depression in a representative sample of 14217 people aged 75 and over in the United Kingdom: resultsfrom the MRC trial of assessment and management of olderpeople in the community. Int J Geriatr Psychiatry 2003;18(7):623-63018 Beekman AT, Deeg DJ, van Tilburg T, Smit JH, Hooijer C,van Tilburg W. Major and minor depression in later life: a study of prevalence and risk factors. J Affect Disord 1995; 36(1-2):65-75.19 Madianos MG, Gournas G, Stefanis CN. Depressive symptomsand depression among elderly people in Athens. Acta PsychiatrScand 1992; 86:320-326.

20 Fuhrer R, Antonucci TC, Gagnon M, Dartigues JF, Barberger-Gateau P, Alperovitch A. Depressive symptomatology andcognitive functioning: an epidemiological survey in an elderlycommunity sample in France. Psychol Med 1992; 22:159-172.21 Schwarz R, Gunzelmann T, Hinz A, Brähler E. Anxiety anddepression in the general population over 60 years old. DtschMed Wochenschr 2001; 126(21):611-615.22 Gostynski M, Ajdacic-Gross V, Gutzwiller F, Michel JP,Herrmann F. Depression among the elderly in Switzerland.Nervenarzt 2002; 73(9):851-860.23 Copeland JR, Dewey ME, wood n, Searle R, Davidson IA,McWilliam C. Range of mental illness among the elderly in thecommunity. Prevalence in Liverpool using the GMS-AGECATpackage. Br J Psychiatry 1987; 150:815-823.24 Copeland JR, Gurland BJ, Dewey ME, Kelleher MJ, SmithAM, Davidson IA. Is there more dementia, depression andneurosis in New York? A comparative study of the elderly inNew York and London using the computer diagnosis AGECAT. BrJ Psychiatry 1987; 151:466-473.25 Saunders PA, Copeland JR, Dewey ME, Gilmore C, Larkin BA,Phaterpekar H, Scott A. The prevalence of dementia,depression and neurosis in later life: the Liverpool MRC-ALPHAStudy. Int J Epidemiol 1993; 22(5):838-847.26 Beekman AT, Deeg DJ, van Tilburg T, Smit JH, Hooijer C,van Tilburg W. Major and minor depression in later life: a study of prevalence and risk factors. J Affect Disord 1995; 36(1-2):65-75.27 van Ojen R, Hooijer C, Bezemer D, Jonker C, Lindeboom J,van Tilburg W. Late-life depressive disorder in the community.I. The relationship between MMSE score and depression insubjects with and without psychiatric history. Br J Psychiatry1995; 166(3):311-5,319.28 Lobo A, Saz P, Marcos G, Dia JL, De la Camara C. Theprevalence of dementia and depression in the elderlycommunity in a southern European population. The Zaragozastudy. Arch Gen Psychiatry 1995; 52(6):497-506.29 Madianos MG, Gournas G, Stefanis CN. Depressive symptomsand depression among elderly people in Athens. Acta PsychiatrScand 1992; 86:320-326.30 Lauritzen LU, Korner EA. Occurrence of dementia anddepression in an elderly Danish population. 1996;158(39):5453-5456.31 Kivela SL, Pahkala K, Laippala P. Prevalence of depressionin an elderly population in Finland. Acta Psychiatr Scand 1988;78(4):401-413.32 Pahkala K, Kesti E, Kongas-Saviaro P, Laippala P, Kivela SL.Prevalence of depression in an aged population in Finland. SocPsychiatry Psychiatr Epidemiol 1995; 30(3):99-106.33 Paivarinta A, Verkkoniemi A, Niinisto L, Kivela SL, SulkavaR. The prevalence and associates of depressive disorders in theoldest-old Finns. Soc Psychiatry Psychiatr Epidemiol 1999;34(7):352-359.34 Palsson S, Larsson L, Tengelin E, Waern M, Samuelsson S,Hallstro T, Skoog I. The prevalence of depression in relation tocerebral atrophy and cognitive performance in 70- and 74-year-old women in Gothenburg. The Women's Health Study.Psychol Med 2001; 31(1):39-49.
35 Skoog I, Nilsson L, Landahl S, Steen B. Mental disordersand the use of psychotropic drugs in an 85-year-old urbanpopulation. Int Psychogeriatr 1993; 5(1):33-48.36 Copeland JR, Gurland BJ, Dewey ME, Kelleher MJ, SmithAM, Davidson IA. Is there more dementia, depression anddiagnosis in New York? A comparative study of the elderly inNew York and London using the computer diagnosis AGECAT.Br J Psychiatry 1987; 151:466-473. 37 Linden M, Kurtz G, Baltes MM, Geiselmann B, Lang FR,Reischies FM, Helmchen H. Depression in the very elderly.Nervenarzt 1998; 69(1):27-37.38 Fichter MM, Bruce ML, Schröppel H, Meller I, Merikangas K.Cognitive impairment and depression in the oldest old in aGerman and in U.S. communities. Eur Arch Psychiatry ClinNeurosci 1995; 245(6):319-325.39 Meller I, Fichter MM, Schröppel H. Depression and dementiain the community- results of the Munich Age Study. TWNeurologie Psychiatrie 1999; 12(10):912-921.40 Meller I, Fichter MM, Schröppel H. Depression und Demenzin der Altenbevölkerung. TW Neurologie Psychiatrie 1996;10:912-921.41 Carpiniello B, Carta MG, Rudas N. Depression among elderlypeople. A psychosocial study of urban and rural populations.Acta Psychiatr Scand 1989; 80(5):445-450.42 Turrina C, Perdona G, Bianchi L. Disturbi psichici (DSM-III-R) viella popolazone anziana del quartiere di Verona-Sud. Datipriliminare riv. Sper Freniat 1991; 64:1006-1013.Nordic studies (14 –17)43 Magnusson H. Mental health of octogenarians in Iceland.An epidemiological study. Acta Psychiatr Scand Suppl 1989;349:1-112.44 Lawlor B, Bruce I, Swanwick G. Prevalence of mental illnessin an elderly community dwelling population using AGECAT.Journal of Psychol Med 1994; 11:157-159.45 Lawlor B, Bruce I, Swanwick G. Prevalence of mental illnessin an elderly community dwelling population using AGECAT.Journal of Psychol Med 1994; 11:157-159.46 Beekman AT, Copeland JR, Prince MJ. Review of communityprevalence of depression in later life. Br J Psychiatry 1999;174:307-311.47 Copeland JR, Beekman AT, Dewey ME, Hooijer C, Jordan A,Lawlor BA, Lobo A, Magnusson H, Mann AH, Meller I, PrinceMJ, Reischies F, Turrina C, deVries MW, Wilson KC. Depressionin Europe. Geographical distribution among older people. Br J Psychiatry 1999; 174:312-321.48 Veith RC, Raskind MA. The neurobiology of aging: does itpredispose to depression? Neurobiol Aging 1988; 9(1):101-117.49 Palsson S, Skoog I. The epidemiology of affective disordersin the elderly: a review. Int Clin Psychopharmacol 1997; 12Suppl 7:S3-13:S3-13.50 Mönking HS, Hornung WP. Prevalence and treatment ofdepressive syndromes in homes for the aged. Survey of a ruralcatchment area. Psychiat Prax 1998; 25(4):183-185.51 Schumacher J, Zedlick D, Frenzel G. Depressive mood andcognitive impairment in results of old age nursing homes. Z Gerontol Geriatr 1997; 30(1):46-53.52 Weyerer S, Mann AH, Ames D. Prevalence of depression and
74
R E F E R E N C E S

dementia in residents of old age homes in Mannheim andCamden (London). Z Gerontol Geriatr 1995; 28(3):169-178.53 Harrison R, Savla N, Kafetz K. Dementia, depression andphysical disability in a London borough: a survey of elderlypeople in and out of residential care and implications forfuture developments. Age Ageing 1990; 19(2):97-103.54 Saunders PA, Copeland JR, Dewey ME, Gilmore C, Larkin BA,Phaterpekar H, Scott A. The prevalence of dementia,depression and neurosis in later life: the Liverpool MRC-ALPHAStudy. Int J Epidemiol 1993; 22(5):838-847.55 Ernst C, Angst J. Depression in old age. Is there a realdecrease in prevalence? A review. Eur Arch Psychiatry ClinNeurosci 1995; 245(6):272-287.56 Lindesay J, Briggs K, Murphy E. The Guy's/Age Concernsurvey. Prevalence rates of cognitive impairment, depressionand anxiety in an urban elderly community. Br J Psychiatry1989; 155:317-329.57 Lehtinen V, Joukamaa M, Lahtela K, Raitasalo R, JyrkinenE, Maatela J, Aromaa A. Prevalence of mental disorders amongadults in Finland: basic results from the Mini Finland HealthSurvey. Acta Psychiatr Scand 1990; 81(5):418-425.58 Flint AJ. Epidemiology and comorbidity of anxiety disordersin the elderly. Am J Psychiatry 1994; 151(5):640-649.59 Lobo A, Launer LJ, Fratiglioni L, Andersen K, Di Carlo A,Breteler MM, Copeland JR, Dartigues JF, Jagger C, Martinez-Lage J, Soininen H, Hofman A. Prevalence of dementia andmajor subtypes in Europe: A collaborative study of population-based cohorts. Neurologic Diseases in the Elderly ResearchGroup. Neurology 2000; 54(11 Suppl 5):S4-S9.60 Heeren TJ, Lagaay AM, Hijmans W, Rooymans HG.Prevalence of dementia in the ‘oldest old’ of a Dutchcommunity. J Am Geriatr Soc 1991; 39:755-759.61 Ott A, Breteler MM, van Harskamp F, Claus JJ, van derCammen TJ, Grobbee DE, Hofman A. Prevalence of Alzheimer'sdisease and vascular dementia: association with education.The Rotterdam study [see comments]. BMJ 1995;310(6985):970-973.62 Boersma F, Eefsting JA, van den Brink W, Koeter M, vanTilburg W. Prevalence of dementia in a rural Netherlandspopulation and the influence of DSM-III-R and CAMDEX criteriafor the prevalence of mild and more severe forms. J ClinEpidemiol 1998; 51(3):189-197.93 Thomassen R, van Schaick HW, Blansjaar BA. Prevalence ofdementia over age 100. Neurology 1998; 50(1):283-286.64 Brayne C, Calloway P. An epidemiological study of dementiain a rural population of elderly women. Br J Psychiatry 1989;155:214-219.65 O'Connor DW, Pollitt PA, Hyde JB, Fellows JL, et al. Theprevalence of dementia as measured by the Cambridge Mental Disorders of the Elderly Examination. Acta PsychiatricaScandinavica 1989; 79(2):190-198.66 Livingston G (1990) to find67 Clarke M, Jagger C, Anderson J, Battcock T, Kelly F, Stern MC. The prevalence of dementia in a total population: a comparison of two screening instruments. Age Ageing 1991;20(6):396-403.
68 Cognitive function and dementia in six areas of Englandand Wales: the distribution of MMSE and prevalence of GMSorganicity level in the MRC CFA Study. The Medical ResearchCouncil Cognitive Function and Ageing Study (MRC CFAS)Psychol Med 1998; 28(2):319-335.69 Coria F, Gomez de Caso JA, Minguez L, Rodriguez-Artalejo F, Claveria LE. Prevalence of age-associated memoryimpairment and dementia in a rural community [see comments].J Neurol Neurosurg Psychiatry 1993; 56(9):973-976.70 Lopez Pousa S, Llinas Regla J, Vilalta Franch J, LozanoFernandez de Pinedo L. The prevalence of dementia in Girona.Neurologia 1995; 10(5):189-193.71 Lobo A, Saz P, Marcos G, Dia JL, De la Camara C. Theprevalence of dementia and depression in the elderlycommunity in a southern European population. The Zaragozastudy. Arch Gen Psychiatry 1995; 52(6):497-506.72 Pi J, Olive JM, Roca J, Masana L. Prevalence of dementia ina semi-rural population of Catalunya, Spain. Neuroepidemiology1996; 15(1):33-41.73 Gournas G, Madianos MG, Stefanis CN. Psychologicalfunctioning and psychiatric morbidity in an elderly urbanpopulation in Greece. Eur Arch Psychiatry Clin Neurosci 1992;242(2-3):127-134.74 Letenneur L, Jacqmin H, Commenges D, Barberger-GateauP, Dartigues JF, Salamon R. Cerebral and functional aging: firstresults on prevalence and incidence of the Paquid cohort.Methods Inf Med 1993; 32(3):249-251.75 Obadia Y, Rotily M, Degrand-Guillaud A, Guelain J, CeccaldiM, Severo C, Poncet M, Alperovitch A. The PREMAP Study:prevalence and risk factors of dementia and clinicallydiagnosed Alzheimer's disease in Provence, France. Prevalenceof Alzheimer's Disease in Provence. Eur J Epidemiol 1997;13(3):247-253.76 Roelands M, Wostyn P, Dom H, Baro F. The prevalence ofdementia in Belgium: a population-based door- to-door surveyin a rural community. Neuroepidemiology 1994; 13(4):155-161.77 Rocca WA, Bonaiuto S, Lippi A, Luciani P. Prevalence ofclinically diagnosed Alzheimer's disease and other dementingdisorders: A door-to-door survey in Appignano, MacerataProvince, Italy. Neurology 1990; 40(4):626-631.78 Corso EA, Campo G, Triglio A, Napoli A, Reggio A, Lanaia F.Prevalence of moderate and severe Alzheimer dementia andmulti- infarct dementia in the population of southeasternSicily. Ital J Neurol Sci 1992; 13(3):215-219.79 Prencipe M, Casini AR, Ferretti C, Lattanzio MT, Fiorelli M,Culasso F. Prevalence of dementia in an elderly ruralpopulation: effects of age, sex, and education. J NeurolNeurosurg Psychiatry 1996; 60(6):628-633.80 D'Alessandro R, Pandolfo G, Azzimondi G, Feruglio FS.Prevalence of dementia among elderly people in Troina, Sicily.Eur J Epidemiol 1996; 12(6):595-599.81 Ferini-Strambi L, Marcone A, Garancini P, Danelon F,Zamboni M, Massussi P, Tedesi B, Smirne S. Dementingdisorders in north Italy: prevalence study in Vescovato,Cremona Province. Eur J Epidemiol 1997; 13(2):201-204.
75
R E F E R E N C E S

82 De Ronchi D, Fratiglioni L, Rucci P, Paternico A, Graziani S,Dalmonte E. The effect of education on dementia occurrence inan Italian population with middle to high socioeconomicstatus. Neurology 1998; 50(5):1231-1238.83 Andersen K, Lolk A, Nielsen H, Andersen J, Olsen C, Kragh-Sorensen P. Prevalence of very mild to severe dementia inDenmark. Acta Neurol Scand 1997; 96(2):82-87.85 Engedal K, Haugen PK. The prevalence of dementia in asample of elderly Norwegians. International Journal of GeriatricPsychiatry 1993; 8:565-570.86 Juva K, Sulkava R, Erkinjuntti T, Valvanne J, Tilvis R.Prevalence of dementia in the city of Helsinki. Acta NeurolScand 1993; 87(2):106-110.87 Skoog I, Nilsson L, Palmertz B, Andreasson LA. A population-based study of dementia in 85-year-olds. N Engl J Med 1993; 328(3):153-158.88 Fratiglioni L, Forsell Y, Aguero-Torres H, Winblad B. Severityof dementia and institutionalization in the elderly: prevalencedata from an urban area in Sweden. Neuroepidemiology 1994;13(3):79-88.89 von Strauss E, Viitanen M, De Ronchi D, Winblad B,Fratiglioni L. Aging and the occurrence of dementia: findingsfrom a population- based cohort with a large sample ofnonagenarians. Arch Neurol 1999; 56(5):587-592.90 Cooper B, Bickel H. Prävalenz und Inzidenz vonDemenzerkrankungen in der Altenbevölkerung: Prevalence andincidence of dementing illness in the elderly population:Findings of a longitudinal study in Mannheim. Nervenarzt1989; 60(8):472-482.91 Fichter MM, Meller I, Schroppel H, Steinkirchner R.Dementia and cognitive impairment in the oldest old in thecommunity. Prevalence and comorbidity. Br J Psychiatry 1995;166(5):621-629.92 Reischies FM, Geiselmann B, Gessner R, Kanowski S, WagnerM, Wernicke F, Helmchen H. Demenz bei Hochbetagten.Ergebnisse der Berliner Altersstudie. Nervenarzt 1997;68(9):719-729.93 Riedel-Heller SG, Busse A, Aurich C, Matschinger H,Angermeyer MC. Prevalence of dementia according to DSM-III-R and ICD-10. British Journal of Psychiatry 2001; 179:250-254.94 Riedel-Heller SG, Busse A, Angermeyer MC. Are cognitivelyimpaired individuals adequately represented in communitysurveys? Recruitment challenges and strategies to facilitateparticipation in community surveys of older adults. A review.Eur J Epidemiol 2000; 16:827-83595 Lobo A, Launer LJ, Fratiglioni L, Andersen K, Di Carlo A,Breteler MM, Copeland JR, Dartigues JF, Jagger C, Martinez-Lage J, Soininen H, Hofman A. Prevalence of dementia andmajor subtypes in Europe: A collaborative study of population-based cohorts. Neurologic Diseases in the Elderly ResearchGroup. Neurology 2000; 54(11 Suppl 5):S4-S9.96 Murray, J., Dunn, G. Williams, P. Tarnopolsky, A. Factorsaffecting the consumption of psychotropic drugs. Psychol Med1981: 11: 551-560
97 Riska, E. Klaukka, T. Use of psychotropic drugs in Finland.Soc Sci Med 1984: 19; 983-98998 Siciliana, O, Bellantuono, C, Williams P, Tansella M. Selfreported use of psychotropic drugs and alcohol abuse in south-verona. Psychol Med 1985: 15: 821-82699 Pakesch, G. Loimer, N., Rasinger, E., Tutsch, G., Katschnig, H.The prevalence of psychoactive drug intake in a metropolitanpopulation. Pharmacopsychiat 1989; 22: 61-65100 Weyerer, S, Dilling, H. Psychiatric and physical illness,sociodemographic characteristics, and the use of psychotropicdrugs in the community: results from the upper Bavarian fieldstudy. J Clin Epidemiol 1991; 44: 303-311101 Helmchen H, Baltes MM, Geiselmann, B, Kanowski, S,Linden, M, Reishcies, FM, Wagner, M, Wilms H-U, PsychischeErkankungen im Alter. In Mayer KU, Baltes, B, editors, BerlinerAltersstudie Berlin: Akademischer Verlag, 1996: 185-219102 Ohayon, MM, Caulet, M, Psychotropic medication andinsomnia complaints in two epidemiological studies. Can JPsychiatry 1996; 41: 457 – 464103 Paternetti, S, Bisserbe JC, Alperovitch, A. Psychotropicdrugs, anxiety and depression in the elderly population. TheEVA study. Rev Epidemiol Sante Publique 1998; 46:253-362104 Forsell, Y, Winblad, B, Psychiatric disturbances and theuse of psychotropic drugs in a population of nonagenarians.Int J Geriatr Psychiatry 1997; 12: 533-536105 Copeland, JR, Davidson IA, Dewey, ME, Gilmore C, LarkinBA, McWilliam C., Range of mental illness among the elderly inthe community. Prevalence in Liverpool using the GMS-AGECATpackage. Br J Psychiatry 1987: 150:815-823106 Ostling, S, Skoog, I. Psychotic symptoms and paranoidideation in a nondemented population-based sample of thevery old. Arch Gen Psychiatry 2002; 59: 53-59
Social inequalities107 Melzer D; Fryers T; Jenkins R. Social Inequalities and theDistribution of the Common Mental Disorders. MaudsleyMonograph 44, Psychology Press, Hove & New York, 2004108 Acheson D. Independent Inquiry into Inequalities inHealth. London: The Stationery Office, 1998.109 Marmot M, Wilkinson R. Social Determinants of Health.Oxford: Oxford University Press, 1999.110 Annual Health Surveys for England (HSE), annually from 1993 111 National Psychiatric Morbidity Survey of Great Britain(household sample), 1993112 Health and Life-style Survey (HLS), 1984-85 and follow-up, 1991-92. British Household Panel Survey (BHPS),1991-92113 Netherlands Mental Health Survey and Incidence Study(NEMESIS), 1996114 Edmonton Survey of Psychiatric Disorders (Canada), 1983-86115 Australian National Survey, 1997116 USA Epidemiologic Catchment Area Program (ECA), 1980-83117 USA National Co-morbidity Study (NCS), 1990-92
76
R E F E R E N C E S

Work, unemployment and low-income119 Dupré D (2001), 'Work-related health problems in the EU1998-1999, European Commission Statistics in Focus, Theme 3- 17/2001.120 International Labour Office website www.ilo.org
Rural – Urban120 Dohrenwend BP,Dohrenwend BS (1974) Psychiatricdisorders in urban setting. In: Caplan G (ed) Americanhandbook of psychiatry. Basic Book Inc, New York,Vol 2: Childand Adolescent Psychiatry: Sociocultural and CommunityPsychiatry, pp 424–449121 Mueller D (1981) The current status of urban/ruraldifferences in psychosocial disorder: an emerging trend ofdepression. J Nerv Ment Dis 169:18–27122 Marsella AJ (1992) Urbanization and mental disorders: anoverview of theory and research, and recommendations forinterventions and research. Mental Health Division, WorldHealth Organization, Geneva123 Leighton DC,Harding JS,Macklin DB,MacMillan AM,Leighton AH (1963) The character of danger: psychiatricsymptoms in selected communities. Basic Books Inc,New York124 Leighton AH (1959) My name is legion: foundations for atheory of man in relation to culture. Basic Books Inc, New York125 Gaviria FM, Richman J, Flaherty JA,Wintrob RM, MartinexH,Pacheco CG, Pathak DS (1986) Migration and mental health in Peruvian society: toward a psychosocial model. Soc Psychiatry 21:193–199126 Brown GW,Prudo R (1981) Psychiatric disorder in a ruraland an urban population: 1. Aetiology of depression. PsycholMed 11:581–589127 Paykel ES,Abbott R, Jenkins R, Brugha TS,Meltzer H(2000) Urban- rural mental health differences in Great Britain:findings from the National Morbidity Survey. Psychol Med30:269–280128 Bijl RV,Ravelli A, van Zerssen G (1998) Prevalence ofpsychiatric disorder in the general population: results of theNetherlands Mental Health Survey and Incidence Study(NEMESIS). Soc Psychiatry Psychiatr Epidemiol 33:587–595129 Kovess-Masfety, V. Lecoutour X, Delavelle S., Urbanicityand mood disorders: Comparisons between two French regions.Social Psychiatry and Psychiatric Epidemiology (SPPE)(submitted) 130 Väisänen E (1975) Mielenterveyden häiriöt Suomessa.Erityisesti maantieteellisiin ja sosiaalisiin tekijöihin kohdistuvatutkimus (English summary: Psychiatric disorders in Finland. Acomparative study with special reference to geographical andsocial factors). Kansaneläkelaitoksen julkaisuja AL: 2, Helsinki131 Brown GW,Prudo R (1981) Psychiatric disorder in a ruraland an urban population: 1. Aetiology of depression. PsycholMed 11:581–589132 Sievewright H, Tyrer P, Casey P, et al. (1991) A three yearfollowup of psychiatric morbidity in urban and rural primarycare. Psychol Med 21:495–503
133 Madianos MG, Stefanis CN (1992) Changes in the prevalenceof symptoms of depression and depression across Greece. SocPsychiatry Psychiatr Epidemiol 27:211–219134 Lehtinen V, Joukamaa M (1994) Epidemiology of depression:prevalence, risk factors and treatment situation. Acta PsychiatrScand, suppl 377:7–10135 Meltzer H,Gill B,Petticrew M,et al. (1995) The prevalenceof psychiatric morbidity among adults aged 16–64 living inprivate households. OPCS Surveys of Psychiatric Morbidity inGreat Britain. Report 1. OPCS Social Survey Division, London136 Bijl RV,Ravelli A, van Zerssen G (1998) Prevalence ofpsychiatric disorder in the general population: results of theNetherlands Mental Health Survey and Incidence Study(NEMESIS). Soc Psychiatry Psychiatr Epidemiol 33:587–595137 Ayuso-Mateos JL,Vázquez-Barquero JL, Dowrick C, et al.(2001) Depressive disorders in Europe: prevalence figures fromthe ODIN study. Br J Psychiatry 175.
Immigration138 UN (2002). Press Release POP/844. Number of world’smigrants reaches 175 million mark. www.un.org139 Salt (2001). Current trends in international migration inEurope. Council of Europe.140 El País Journal, 06-08-01/11-11-2003. www.elpais.es 141 Lurbe i Puerto, K. (2002). Incursión sociológica sobre laenajenación de l@s otr@s. Estudio sobre el tratamiento de ladiferencia étnica en la salud mental. Trabajo de investigación.Dir: Dra. Carlota Solé. Universitat Autónoma de Barcelona.142 Selten, J.P. & Sijben, N. (1994). First admission rates for schizophrenia in immigrants to the Netherlands. The Dutch National Register. Social Psychiatry and Psychiatric Review, 29 (2). 143 Schrier, AC., van de Wetering, BJ., Mulder, PJ., Selten, GP.(2001). Point prevalence of Schizophrenia in immigrantsgroups in Rotterdam: data from outpatients facilities. EurPsychiatry 16:162-6. 144 London, MM. (1986). Mental Illness among immigrantminorities in the United Kingdom. British Journal of Psychiatry,149.145 Cochrane, R & Bal, S.S. (1987). Migration andschizophrenia: an examination of five hypotheses. SocialPsychiatry, 22.146 Dean et al (1981). First Admissions of native-born andimmigrants to psychiatric hospitals in south-east England.British Journal of Psychiatry, 139.147 Littlewood, R. & Lipsedge, M. (1988). Psychiatric illnessamong British Afro-Caribbeans. British Medical Journal, 296.148 Zolkowska, K., Cantor-Grae, E., Mc Neil, TF. (2001).Increased rates of psychosis among immigrants to Sweden: ismigration a risk factor for psychosis? Psychol Med 31:669-78.149 Bhugra, D. (2000). Migration and Schizophrenia, ActaPsychiatrica Scandinavica Suppl. 102:68-73.150 Selten, JP., Veen, N., Feller, W. (2001). Incidence ofpsychotic disorders in immigrants groups to the Netherlands.Br J Psychiatry 179:269.
77
R E F E R E N C E S

151 Eaton W, Harrison G. (2000). Ethnic disadvantage andschizophrenia, Acta Psychiatrica Scandinavica, Supp 102:38-43.152 Sharpley, M., Hutchinson, G., Mc Kenzie, K., Murray, RM.(2001). Understanding the excess of psychosis among theAfrican-Caribbean population in England. Review of currenthypotheses, Br J Psychiatry Suppl 40:60-8.153 Hansen, C., Yagdiran, O., Mass, R., Krausz, M. (2001).Schizophrenic disorders among Turkish migrants in Germany .A controlled study. Psychopathology, 34: 203-8.154 Karmi, G. (1997). Migration and Health in UK. In: A.Huismann, C. Weilandt and Greiger, (eds), Country Reports onMigration and Health in Europe. Bonn: WissenschaftlichesInstitut der Ärzte Deutschlands e.V.155 Patel SP and Gaw AC. (1996). Suicide among immigrants fromthe Indian subcontinent: a review. Psychiatr Serv 47:517-21.156 de Jong J, The plight and relisience of refugees, Lecture atthe DTGPP Satellite Conference, Ethnicity & Mental Health inEurope, Essen Germany, September 2003157 Storch, G. and Poutska, F. (2000). Prax KinderpsycholKinderpsychiatr 49:199-208.158 Balajaran, R., Busulu, L., Adelstein, A.M. and Shukla, V.(1984). Patterns of mortality among immigrants to Englandand Wales from the Indian subcontinent. British MedicalJournal, 289.159 Hjem, A. and Allebeck, P. (2004). Alcohol relateddisorders in first and second generation immigrants in Sweden:a national cohort study. Addiction. In press160 Giannopoulou, I. (1988). Patterns of alcohol and drug useand indicators of psychological distress among migrant greekadolescents. In: Congrès International sur l’alcoolisme et lestoxicomanies. Oslo, Vol 2.161 Bendahman, H. (1993). Cultures marginalité et déviance:de l’inquiétante étrangeté de l’autre à l’exclusion sociale.Thionville: Espace Ressource.162 Akbiyik, O. (1990). Un centre d’accueil pour toxicomanesmigrants. Bull:Liaison CNDT.16.163 Caballero, L. (2003). Addiction disorders among migrants.Lecture at the DTGPP Satellite Conference, Ethnicity & MentalHealth in Europe, Essen Germany, September 2003.164 Jacob, KS., Bhugra, D., Lloyd, KR., Mann, AH. (1998).Common mental disorders, explanatory models andconsultation behaviour among Indian women living in the UK.J R Soc Med 91:66-71.165 Bengi-Arslan, L., Verhulst, FC., Crijnen, AA. (2002).Prevalence and determinats of minor psychiatric disorder inTurkish immigrants living in The Netherlands. Soc PsychiatryPsychiatr Epidemiol 37:118-24.166 ten Have, ML., Bijl, RV. (2002). Inequalities in mentalhealth care and social services utilisation by immigrantwomen. The European Journal of Public Health 9:45-51.167 Crijnen, AA., Bengi Arslan, L., Verhulst, FC. (2000).Teacher-reported problem behaviour in Turkish immigrant andDutch children: a cross cultural comparison. Acta PsychiatricaScandinavica 102:439-44.
168 Iglesia, E., Robertson, E., Johansonn, SE., Engfeld, P.,Sundquist, J. (2003). Women, International migration andself-reported health. A population based study of women ofreproductive age. Soc Sci Med 56:111-24.169 Garrone, G. (1988). Migration and Mental Health inEurope. Antropologia Medica 4:23-31.170 Baarnhiem, S., Ekblad, S. (2000). Turkish migrant womenencountering health care in Stockolm: a qualitative study ofsomatization and illness meaning. Cult Med Psychiatry 24:431-54.171 Esteban y Pena, MM. (2001). Motives for consultation anddemographic characteristics of a community of ‘undocumented’immigrants in the district of Usera-Villaverde (Madrid). AtenPrimaria, 27:25-8.172 Carta, MG., Carpiniello, B. and Rudas, N. (1991).L’èmigration senegalaise et marocaine en Sardaigne.Psychopathologie Africaine XXIII, 3, 329-352.173 Carta, MG, Kovess, V, Hardoy, MC, Morosini, PL, Murgia,S, Carpiniello, B (2002). Psychiatric disorders in Sardinianimmmigrants in Paris: A comparison with Parisians andSardinians resident in Sardinia. Social Psychiatry andPsychiatric Epidemiology 37:112-117.174 Mavreas, VR. and Bebbington, PE. (1988). Greeks, BrtihGreek Cipriots and Londoners: a comparison of morbidity.Psychol Med 18:433-42.175 Emmenegegger, T. (1988). Illness and migration:problems of adjustment of the return migrant. Studi Emigr.25:127-36.176 Carta, MG, Hardoy MC, Chectovik-Backmans M, Consul ME,Carpniello B (2004). Depressive disorders in sardinian emigrantsin argentina: Why are women more at risk for depression?University of Cagliari. In press.177 Carey-Wood, J., K. Duke (1995). The settlement ofrefugees in Britain: Home Office Research Study 141. London,Home Office.178 Brent and Harrow Health Agency, Brent and HarrowRefugee Groups, Northwest London Training and EnterpriseCouncil (1995) Brent and Harrow Refugee Survey. London:Brent and Harrow Health Agency.179 Bhui, K, Abdi, A, Abdi, M, Pereira, S, Dualeh, M,Robertson, D, Sathyamoorthy, G, Ismail, H. (2003). Traumaticevents, migration characteristics and psychiatric symptomsamong Somali refugees-preliminary communication. SocialPsychiatry Epidemiology, 38:35-43.180 Mollicca, RF, McInnes, K, Sarajlic, N, Lavelle, J, Sarajlic, I,Massagli, M (1999). Disability associated with psychiatriccomorbidity and health status in Bosnian refugees living inCroatia. JAMA, 282(5): 433-9.181 Mollica, RF., Sarajlic, N., Chernoff, M., Lavelle, J., Vukovic,IS. Massagli, MP. (2001). Longitudinal study of psychiatricsymptoms, disability, mortality, and emigration amongBosnian refugees. JAMA, 286(5): 546-54.182 de Jong J, The plight and resilience of refugees, Lecture atthe DTGPP Satellite Conference, Ethnicity & Mental Health inEurope, Essen Germany, September 2003
78
R E F E R E N C E S

Responses to mental health problems across Europe
1 Kovess-Masfety V, Alonso J, Brugha T, Capuano F, Mentalhealth services utilisation in six European countries: Belgium,France, Germany, Italy, the Netherlands and Spain, BritishJournal of Psychiatry (submitted)
Annex 1 Survey of surveys
1 Jorm AF, Angermeyer MC & Katschnig H, 1993. Publicknowledge and attitudes about mental disorders. Report to theAustrian Research Fund 1993.2 Kittel F, Ribourdouille M & Dramaix M, 2001. Mental healthdata analysis from the National Health Survey, Belgium 1997.Archives of Public Health , 50 (5 & 6): 347-3573Ansseau M & Reggers J, 1999. Epidémiologie des troublespsychiatriques dans la province de Liège et leur prise en charge.Plate-forme Psychiatrique Liégeoise. (Report) 4 Ansseau M & Reggers J,1999. Epidemiologie des troublespsychiatriques dans la Province de Luxembourg, Plate-forme deConcertation Psychiatrique de la Province de Luxembourg.(Brochure)5 Lehtinen V, Joukamaa M, et al., 1990. Prevalence of mentaldisorders among adults in Finland: basic results from the MiniFinland Health Survey. Acta Psychiatr Scand: 81: 418-4256 Lehtinen V, 2003. Personal communication. 7 Carta MG, Kovess V, Hardoy MC, Morosini PL, Murgia S &Carpiniello B, 2002. Psychiatric disorders in Sardinianemigrants in Paris: a comparison with Parisians and Sardiniansresident in Sardinia. Social Psychiatry and PsychiatricEpidemiology 37: 112-117.8 Kovess-Masfety, V. Lecoutour X, Delavelle S., Urbanicity andmood disorders: Comparisons between two French regions.Social Psychiatry and Psychiatric Epidemiology (SPPE)(submitted) 9 Wittchen H -Ul, Carter RM, Pfister H, Montgomery SA &Kessler RC, 2000. Disabilities and quality of life in pure and co-morbid generalized anxiety disorder and major depression in anational survey. International Clinical Psycho-pharmacology, 15(6): 319-328.10 Meyer et al, 2001. Transitions in Alcohol Consumption andSmoking (TACOS). Neurology, Psychiatry & Brain Research.11 Bijl RV, van Zessen G & Ravelli A, (1998) Prevalence ofpsychiatric disorder in the general population: results of theNetherlands Mental Health Survey and Incidence Study(NEMESIS). Soc Psychiatry Psychiatr Epidemiol 33: 587-595.12 Rajmil L, Magarolas RG; Gamisnas MR, Rodríguez P-EM &Benedicto AS, 1998. Prevalencia de trastornos mentales en lapoblacion general de Catalunya: Gaceta Sanitaria, Miercoles,12, 4,153-159.13 Bennett N, Dodd T, Flatley J, Freeth S & Bolling K. (1995)Health Survey for England 1993. London: HMSO. 14 Bost L, Dong W, Hedges B, Primatesta P, Prior G, Purdon S &di Salvo P. (1997) Health Survey for England 1995. Volume I:Findings (eds. P Prescott-Clarke & P Primatesta). London: HMSO.
15 Cox BD, Blaxter M, Buckle ALJ, Fenner NP, Golding JF, GoreM, et al.,1987. The Health and Lifestyle Survey. Preliminaryreport of a nationwide survey of the physical and mental health,attitudes and lifestyle of a random sample of 9,003 Britishadults. Health Promotion Research Trust. 16 O’Reilly D & Browne S, 2001. Health and Health Service Use in Northern Ireland: Social Variations. A report from the Health and Social Well-being Survey 1997. Belfast; The Queen’s University
79
R E F E R E N C E S


European Commission
Directorate General for Health and Consumer Protection Directorate C2 – Health Information
Jean-Monnet building, L – 2920 LUXEMBOURG
Internet address: http://europa.eu.int/comm/health/ph_information/information_en.htm

ISBN : 92-894-8320-2