the state of food and agriculture, 1974 · in addition to the usual review of the recent world food...
TRANSCRIPT

AF 99
r ?
FOOD AND AGRICULTURE ORGANIZATION OF THE UNITED NATIONS

SPECIAL CHAPTERS
In addition to the usual review of the recent world food and agriculture situation, eachissue of this report from 1957 has included one or more special studies of problems oflonger term interest. Special chapters in earlier issues have covered the following subjects:
Factors influencing the trend of food consumptionPostwar changes in some institutional factors affecting agriculture
Food and agricultural developments in Africa south of the SaharaThe growth of forest industries and their impact on the world's forests
Agricultural incomes and levels of living in countries at different stagesof economic development
Some general problems of agricultural development in less developedcountries in the light of postwar experience
Programing for agricultural development
Land reform and institutional changeAgricultural exetension, education and research in Africa, Asia and LatinAmerica
The role of forest industries in the attack on economic underdevelopmentThe livestock industry in less developed countries
Basic factors affecting the growth of productivity in agricultureFertilizer use: spearhead of agricultural development
Protein nutrition: needs and prospectsSynthetics and their effects on international trade
Agriculture and industrializationRice in the world food economy
Incentives and disincentives for farmers in developing countriesThe management of fishery resou. rces
Raising agricultural productivity in developing countries through techno-logical improvementImproved storage and its contribution to world food supplies
Agricultural marketing improvement programmes: some lessons fromrecent experienceModernization of institutions to promote development
Agriculture at the threshold of the Second Development Decade
Water pollution and its effects on living aquatic resources and fisheries
Education and training for developmentAccelerating agricultural research in the developing countries
Agricultural employment in developing countries

STATE OF FOOD AND AGRICULTURE 1974

WORLD REVIEW
REVIEW BY REGIONS
POPULATION, FOOD SUPPLY AND AGRICULTURAL DEVELOPMENT
FOOD AND AGRICULTURE ORGANIZATION OF THE UNITED NATIONSRome, 1975

The statistical material in this publication hasbeen prepared from the information availableto FAO up to 1 November 1974
The designations employed and the presentationof the material in this publication do not implythe expression of any opinion whatsoever on thepart of the Food and Agriculture Organizatiotzof the United Nations concerning the legalstatus of any country, territory, city or area,or of its authorities, or concerning the delimi-tation of its frontiers or boundaries.
© FAO 1975
Printed in Italy

Foreword VII FISHERIES 33
1. World review
Production 1973
Production 1974The influence of weather and climate on food
production
AGRICULTURAL TRADE
Trade in 1973
Trade outlook for 1974/75
STOCKS OF AGRICULTURAL PRODUCTS
CONSUMER FOOD PRICES 222. Review by regions 51
DEVELOPMENT ASSISTANCE 23 WESTERN EUROPE 51
The flow of aidTerms of assistanceRepayment burdenThe World Bank Group and the financing
of agricultureRegional development banks and new sources
of aidFood aid
AGRICULTURAL PRODUCTION REQUISITES . . . . 28
NORTH AMERICA
CONTENTS
Production and trade 33
Policies and other issues 35
Outlook 36
57
The energy crisis 28
Fertilizers 30 Agricultural prices and farm incomes 57
Pesticides 32 Problems, policies and programmes 58
27 Production and trade 38
11Forest policies 41
UNITED NATIONS CONFERENCES AND SPECIAL16 SESSION 43
16 World Food Conference 43
18 Sixth Special Session of the United NationsGeneral Assembly 46
World Population Conference 4720 Conference on the Law of the Sea 48
23 Agricultural policies and problems 51
24 Prices 1974/75 5325
25 EASTERN EUROPE AND THE U.S S R 54
25 Investment and current inputs 54
27 Farm incomes, prices and policies 55
Plans and policies 56
AGRICULTURAL PRODUCTION 2
FORESTRY 38

OCEANIA
Agricultural prices and farm incomesProblems, policies and programmes
LATIN AMERICA
Development plans and policiesIntegrated rural developmentRegional economic integration
FAR EAST
Development plans and policiesTechnological innovation and its policy im-
plicationsRegional economic cooperation
China 80
Japan 81
NEAR EAST 82
Development plans and policies 82Country perspective studies 84
Development plans and policiesRegional economic integration
3. Population, food supply and agriculturaldevelopment
65
POPULATION AND FOOD SUPPLY 93
Food production 93Production resources 96Rural institutions and services 98Development assistance 100
World trade in food 100
vi
Food demand projections 116
Extrapolated food production trends 119
The demand/production balance 121
Supplementary needs to meet nutritionalstandards 124
Production fluctuations 125
Outlook for rural poverty 126
Methodological note 127
MAJOR POLICY IMPLICATIONS 136
ANNEX TO CHAPTER 3 139
AFRICA 88 POSSIBILITIES FOR INCREASING PRODUCTION ... 130
DIMENSIONS AND CAUSES OF HUNGER AND MAL- BIBLIOGRAPHY TO CHAPTER 3 154
NUTRITION 103
Assessment of undernutrition and malnutri-tion 103 Annex tables 155
63 Food availability 104
Distribution of food by income and social63 group 106
63 Other indicators of the incidence of food defi-ciency 107
The decline in breast-feeding 109
Other nutritional deficiencies 110
Causes of inadequate nutrition 110
65
69
72 THE DEMAND FOR FOOD I I 1
Patterns of food expenditure73 Food in family expenditure 111
Other factors influencing long-term food73 demand 114
7679 THE FOOD PROBLEM OF THE FUTURE 116
88 Agricultural inputs 130
90 Water and land resources 132
Livestock 132
Fisheries 134
Post-harvest losses 135
Incentives and services 13593 Mobilizing the rural population 136

FOREWORD
As I reminded the World Food Conference when I addressed it on 5 November, it is 110Walmost thirty years since John Boyd-Orr, the first Director-General of FAO, evoked the ideaof "a great world food scheme, which will bring freedom from want of food to all men."Yet the governments of the day were unable to rise to this challenge, so that now, a wholegeneration later, the world food problem ig still unsolved and is worsening, and there aremore people in want of food than at any time since then.
For the third consecutive year the world food and agricultural situation must be viewedwith grave concern. During 122uch of 1974 there were high hopes that this year would bringthe bountiful harvests so badly needed for the world to beghz to emerge from the food crisisthat started with the widespread bad weather and poor crops of 1972. Although there was asubstantial recovery in production in 1973, very large harvests were needed in 1974 if a begin-ning was to be made in returning to any reasonable degree of security in world food supplies.
It is llOW clear that these hopes were not realized in 1974. In many countries the expan-sion ill acreage and other special efforts ¡nade to increase production were defeated by theweather. Any easing of the world food situation has thus been put offfor at least another year.
Although bad weather was much less widespread in 1974 than in 1972, it affected produc-tion with particular severity in two vitally important regions of the world: North America,the largest food exporter, and the Far East, where the majority of the world's malnourishedpeople are to be found. The final outcome of the cereal crops in son2e parts of the Far Eastis still unknown, but it is already certain that in both of these regions there has been a dropin cereal production and in total food and agricultural production.
World cereal production thus declined in 1974 for the second time in three years. FAO'searly estimates indicate a fall of between 40 and 50 million tons. The gravity of this largedrop in production, superimposed on the already precarious situation, is readily apparentwhen it is recalled that an increase of more than 20 million tons of cereals is needed merelyto keep ul»vith the annual growth of population at present average consuinption levels. It is/IOW likely that the total carry-over stocks of cereals (outside China and the U.S.S.R., forwhich there is as yet no information) will full below 100 million tons by mid-1975. This wouldbe less than half their 1970 volume and only 11 % of world consumption, as compared withthe 17-18 % estimated by FAO to be the minimum required for world food security.
Any increase in total world food and agricultural production in 1974 is likely to have beenvery small. If 1974 production does turn out to have matched the 1973 kvel, this will mainlybe the result of the unusually large upsurge in livestock slaughterings, especially, in westernEurope, and will thus bring no relief to the countries where food shortages are most critical.What is more, the big increase in livestocic production reflects very serious difficulties in thissector and has benefited neither producers nor consumers.
Side by side with the continued general shortage of food, especially of staple cereals, thesituation is critical for several of the main inputs essential for food production. The sYliortageand high price of chemical fertilizers show no sign of abating .for some time to come. Someimportant pesticides are running short, and this niay soon become a serious problem. Anumber of developing countries face shortages of fuel and power for irrigation pumping andother essential agricultural purposes.
In the face of these dual shortages of food and the means of producing it, there is anobvious need for urgent, immediate action if widespread starvation is to be avoided.
First, it is necessary to ensure an equitable distribution of the exportable food suppliesthat are available until next year's harvests begin to come in, with special attention to needsof the most seriously affected countries, some of which cannot be fully known until later. To
this end, I have been engaged in special consultations with the main exporting and importingcountries.
vii

Second, in order to obtain the biggest possible harvests in 1975, it is necessary to securea balanced distribution of the scarce means of production as well. Here FAO's InternationalFertilizer Supply Scheme is of particular importance.
Third, in the case of both food and inputs, it is 770i sufficient to earmark supplies. Manydeveloping countries are very hard hit by the huge increases that have occurred in the pricesof the food, fertilizers, fuel and many other essential items they have to import, and they facevery serious balance-of-payments difficulties. Even if the necessary supplies can be set aside,these countries will ¡leed substantial financial assistance in order to pay for them. An impor-tant instrument in this regard is the United Nations Emergency Operation, with ivhich FAOis cooperating actively.
I have dwelt at some length on the immediate aspects of the food crisis and the measuresneeded to cleat with them. These are extremely serious and are the main subjects of the firsttwo chapters of this issue of The state of food and agriculture. However, the longer iel'117dimensions of the world food problem must not be neglected. Two or three years of goodweather and good harvests are 1701V 1170S1 urgently needed; but it would be tragic if, oncethey are achieved, the world should again lapse hito complacency about its longer term foodproblems.
When the World Food Conference met in Romefrom 5 to 16 November 1974, it was underthe shadow of a firther worsening in the immediate situation becctuse qf the disappointingperformance of food production during the year. However, the inain objective of the Con-ference was to tackle the longstanding, underlying ills in the world's food and agriculturalsector, and to agree on the necessary action to ensure that such short-term crises can 17eVeroccur again. It focused mainly on the medium-term period of the next ten years or so.
The main decisions of the World Food Conference are sunitnarized in Chapter 1 qf thiseport. The Conference achieved a very encouraging degree of consensus OH the nature and
dimensions of the world food problem and on the national and international action neededto overcome it. It called for the establishment of a munber of neiv bodies that could have adecisive role in mounting the necessary concerted action. It resolved that all governmentsshould "accept the goal that within a decade no child will go to bed hungry, that no familywill fear for its next day's bread, and that no human being's fieture and capacities will bestunted by malnutrition." Much will depend 017 how speedily the world's governments matchthese impressive goals with the action that they agree is necessary.
There is also a further time dimension to the 3vorld food problem. In looking inainlyat the next ten years or so, the World Food Conference was concerned with a period duringwhich the rate of population growth is virtually predetermined. Its task was therefore toconsider the measures needed to meet an already inevitable growth of population. Lookingfarther ahead, however, the rate of population growth is far from inevitable. According tothe United Nations population projections, the world's population in the year 2000 could heanywhere between 5 900 million and 7 200 nfillion. This huge difference of 1 300 millionwould greatly affect the magnitude ,of the friture challenge to the world's food and agriculturalsector. Provided that the action agreed to by the World Food Conference is begun in2-mediately, it should be possible to meet the expected increase in the demand for food up to 1985and for some years beyond that date; but the action that has to be taken will need to be plannedas a crash programme. It is therefore essential to take parallel action 770W to ensure thatiii the more distant future the rate of population growth and thus the increctse in the demandfor food are substantially reduced.
In these circumstances it is particularly appropriate that Chapter 3 of The state of foodand agriculture is this year devoted to a study of population, food supply and agriculturaldevelopment. This study was prepared with financial support from the United Nations Fundfor Population Activities. Its findings have afready formed the basis of part of FAO's docu-mentary contribution to the World Food Conference and to the preceding World PopulationConference, held from 19 to 30 August in Bucharest. The link between these two inzportantUnited Nations conferences is seljlevident. They in turn are linked with a series of importantmeetings, including the Conference 077 Human Environment, the Sixth Special Session of theUnited Nations General Assembly, and the forthcoming conferences on the role of 1VOMC17,human settlemenm, and water, all of which concern different aspects of the interlocking setof problems with which the world is now confronted. For, as FAO has always stressed, the
food problem is not a problem of agriculture alone, but part of the whole complex problemof economic and social developnient and improving the quality of life.
A niain feature of Chapter 3 of this report is FAO's new appraisal of the extent of hungerand malnutrition in the ivorld. It is 1701V estimated that the awesome number of at least460 million of our fellow human beings are suffering from severe malnutrition. What
viii

worse, this estimate is based on the peak level of per caput food supplies before the situationbegan lo deteriorate so seriously in 1972; since then, the number of severely malnourishedpeople must have greatly increased. .Hany die at an early age from a combination of mal-nutrition ancl other related causes without being recorded as deaths by starvation. There isrecent evidence in a number of developing countries of an ominous increase in death ¡'ates, towhich there is little doubt the worsening of the nutritional situation has contributed significantly.
The challenge to the world's governments and to the international community could not beclearer. I. was acknowledged by all at the World Food Conference. Time efforts to meet thechallenge will be watched anxiously in the coming months. There is no time to lose if theseefforts are not to be too late to save the situation.
A.H. BOERMADirector-General
ix

The following symbols are used in statistical tables:
none or negligible
not available1971/72 signifies a crop, marketing or fiscal year
running from one calendar year to the next; 1971-72signifies the average for two calendar years.
Figures in statistical tables may not add up be-cause of rounding. Percent changes from one yearto another have been calculated from unroundedfigures. Unless otherwise indicated, the metric sys-tem is used throughout.
Production index numbers '
The indices of agricultural production are calcu-lated by applying regional weights, based on 1961-65farm price relationships, to the production figures,which are adjusted to allow for quantities used forfeed and seed. The indices for food products excludetobacco, inedible oilseeds, animal and vegetable fibres,and rubber. They are on a calendar year basis andare therefore not comparable with the indices for cropyears published in the 1966 and prior issues of thisreport.
For fishery production, quantities are weighted bythe average unit values of fishermen's landings in1961-65. For forest production, roundwood produc-tion is weighted by 1961-65 prices.
Trade index numbers 2
In calculating trade index numbers of agriculturalproduction for the present issue, both commodityand country coverages include all the commoditiesand countries shown in the 1973 issue of the FAOTrade yearbook.
All the different indices are calculated indepen-dently for the value, volume and unit value of exportsand of imports.
1 For full details, including a list of weights, see FAO, Productionyearbook 1973, Rome, 1974.
2 For full details see FAO, Trade yearbook 1973, Rome, 1974.
EXPLANATORY NOTE
xi
Value indices represent the current values of ex-ports (f.o.b.) and imports (c.i.f.), all expressed in U.S.dollars. If some countries report imports valued atf.o.b., these are adjusted to approximate c.i.f. values.This method of estimation shows an error wheneverthe trend of insurance and freight diverges from thecommodity unit values at export level.
Volume and unit value indices represent thechanges in the price-weighted sum of quantities andof the quantity-weighted values of products tradedbetween countries. The weights are respectively theprice and quantity averages of 1961-65, which is thebase reference period used for all the index numberseries currently computed by FAO. The Laspeyresformulas were used in the construction of the indexnumbers.
Regional coverage
The regional grouping used in this publicationfollows the recently adopted "FAo country classifi-cation for statistical purposes." The coverage ofthe groupings is in most cases self-explanatory. Itshould be noted, however, that in line with the deci-sion to divide countries into three broad economiccategories (developed market economies, developingmarket economies, and centrally planned economies)japan, Israel and South Africa have been removedfrom Far East, Near East and Africa respectivelyand are presented under "Developed market econ-omies." For this reason, tables for the three regionsare not always comparable with those shown inearlier issues.
The trade index numbers of a country group arebased on the total trade of each country includedin the group irrespective of destination, and in con-sequence generally do not represent the net tradeof the group.
Among other regions, it should be noted thatwestern Europe is defined as including Yugoslavia,and the Near East as extending from Cyprus andTurkey in the northwest to Afghanistan in the east,and including from the African continent Egypt, theLibyan Arab Republic and the Sudan.
HIGHLIGHTS
World agricultural production is likely to have increased little in 1974 compared with1973, when there had been a good recovery from the poor 1972 results. Performance inboth developed and developing regions in 1974 was discouraging.
Per caput food production in the developing countries as a whole in 1974 remainedlower than in 1970, in Africa and the Far East very substantially so.
Cereal production fell sharply in several regions in 1974, especially in the Far East,North America, and the U.S.S.R. Drought was again a principal cause. Livestock productionexpanded, especially in western Europe, but this sector faces serious problems.
Total cereal stocks in all countries (excluding China and the U.S.S.R.) have droppedbelow minimum levels for world food security.
The world fisheries catch again failed to expand in 1973.
World roundwood production increased in 1973 at a higher rate than in recent years.
The value of world trade in agricultural, fishery and forest products in 1973 increasedabout 26% in real terms. This large rise came from exceptional prices as trade volumeonly increased by 6%.
Sharply rising food prices have been a major factor in high rates of inflation since1973 in most countries.
Population, food supply and agricultural development are examined in Chapter 3.Malnutrition affects around 460 million people, a conservative estimate. It is stronglycorrelated with poverty. The world food situation will remain perilous until a much higher,sustained rate of increase in food production is attained in the developing countries.
xii
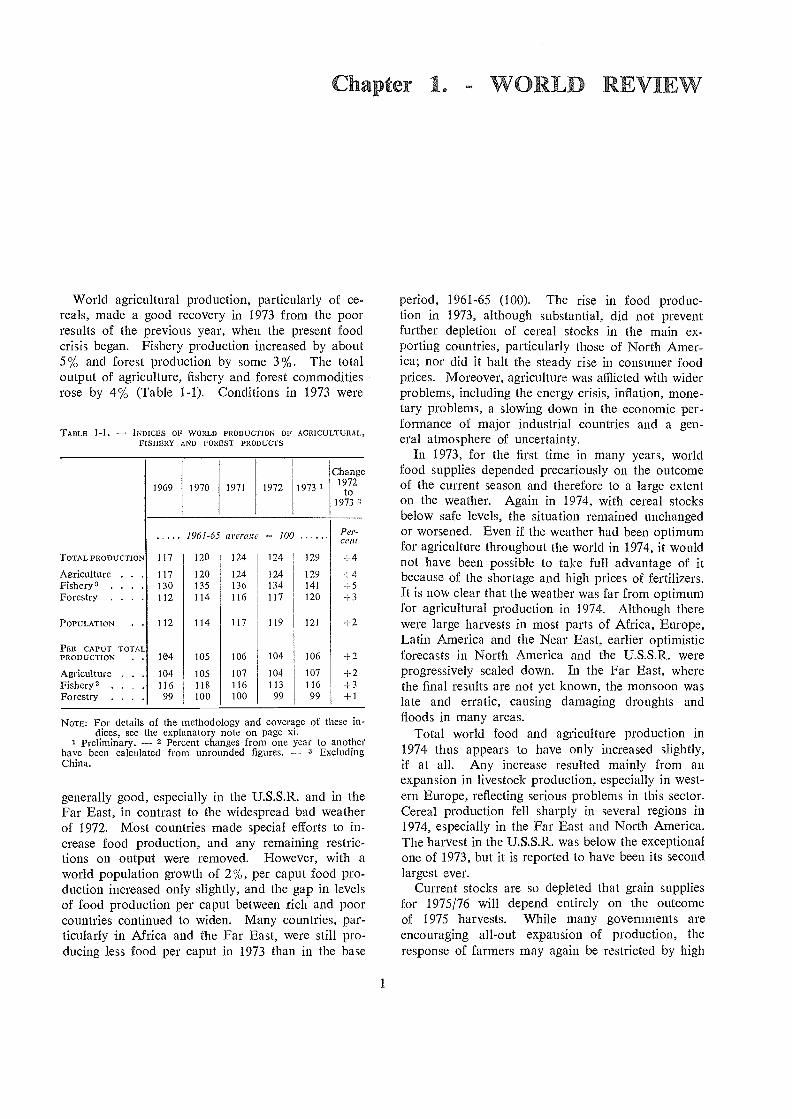
World agricultural production, particularly of ce-reals, made a good recovery in 1973 from the poorresults of the previous year, when the present foodcrisis began. Fishery production increased by about5% and forest production by some 3%. The totaloutput of agriculture, fishery and forest commoditiesrose by 4% (Table 1-1). Conditions in 1973 were
TABLE I-1. - INDICES OF WORLD PRODUCTION OF AGRICULTURAL,FISHERY AND FOREST PRODUCTS
Ciater 1. WORLD REVIEW
NOTE: For details of the methodology and coverage of these in-dices, sec the explanatory note on page xi.
Preliminary. 2 Percent changes from one year to anotherhave been calculated from unrounded figures. 3 ExcludingChina.
generally good, especially in the U.S.S.R. and in theFar East, in contrast to the widespread bad weatherof 1972. Most countries made special efforts to in-crease food production, and any remaining restric-tions on output were removed. However, with aworld population growth of 2%, per caput food pro-duction increased only slightly, and the gap in levelsof food production per caput between rich and poorcountries continued to widen. Many countries, par-ticularly in Africa and the Far East, were still pro-ducing less food per caput in 1973 than in the base
period, 1961-65 (100). The rise in food produc-tion in 1973, although substantial, did not preventfurther depletion of cereal stocks in the main ex-porting countries, particularly those of North Amer-ica; nor did it halt the steady rise in consumer foodprices. Moreover, agriculture was afflicted with widerproblems, including the energy crisis, inflation, mone-tary problems, a slowing down in the economic per-formance of major industrial countries and a gen-eral atmosphere of uncertainty.
In 1973, for the first time in many years, worldfood supplies depended precariously on the outcomeof the current season and therefore to a large extenton the weather. Again in 1974, with cereal stocksbelow safe levels, the situation remained unchangedor worsened. Even if the weather had been optimumfor agriculture throughout the world in 1974, it wouldnot have been possible to take full advantage of itbecause of the shortage and high prices of fertilizers.It is now clear that the weather was far from optimumfor agricultural production in 1974. Although therewere large harvests in most parts of Africa, Europe,Latin America and the Near East, earlier optimisticforecasts in North America and the U.S.S.R. wereprogressively scaled down. In the Far East, wherethe final results are not yet known, the monsoon waslate and erratic, causing damaging droughts andfloods in many areas.
Total world food and agriculture production in1974 thus appears to have only increased slightly,if at all. Any increase resulted mainly from anexpansion in livestock production, especially in west-ern Europe, reflecting serious problems in this sector.Cereal production fell sharply in several regions in1974, especially in the Far East and North America.The harvest in the U.S.S.R. was below the exceptionalone of 1973, but it is reported to have been its secondlargest ever.
Current stocks are so depleted that grain suppliesfor 1975/76 will depend entirely on the outcomeof 1975 harvests. While many governments areencouraging all-out expansion of production, theresponse of farmers may again be restricted by high
1969 1970 1971 1972 1973 1
Change1972to
1973 2
1961-65 average 100 Per-cent
TOTAL PRODUCTION 117 120 124 124 129 -I 4
Agriculture . . 117 120 124 124 129 +4Fishery 3 . . . . 130 135 136 134 141 +5Forestry 112 114 116 117 120 +3
POPULATION . . 112 114 117 119 121 +2
PER CAPLJT TOTALPRODUCTION . . 104 105 106 104 106 +2
Agriculture . . . 104 105 107 104 107 +2Fishery 3 . . . 116 118 116 113 116 +3Forestry . . . 99 100 100 99 99 +1

production costs and shortages of fertilizers and otherinputs. Individual farmers in many regions have alsobeen increasingly affected by inflation and by thecost/price squeeze in the livestock sector. There hasbeen no easing of the fertilizer shortage, but pricesmay be reaching a peak as demand is discouraged bytheir present very- high level. Some important pes-ticides will also be in short supply during 1975. Theweather, of course, is an unknown factor. On theother hand, the world demand for foodgrains willprobably continue to increase, while the short-termoutlook for animal feedstuffs is very uncertain inview of the state of the livestock industry.
World production of cereals in 1974/75 will proba-
Agricultural production
Production 19731
Both world food and agricultural production areestimated to have increased in 1973 by 4% in totaland by 2% per caput (see Table 1-2), a good recoveryfrom the 1972 setback. Food production rose by 5%in the developed regions and by 4% in the developingregions; it fell by 4% in two regions, Africa andthe Near East. The most serious situation arose inAfrica, where per caput food production in 1973 wassome 7% below that of 1961-65, mainly because ofdrought, not only in the Sahelian zone, but also inother countries of west Africa and in east and south-ern Africa. The 1973 drop in the Near East fol-lowed a year in which there was an exceptionallylarge increase, but not all of the 1972 increase waslost, so production was still higher than in 1971.
The best result in the developing regions was inthe Far East (up 8 to 9% for both food and agri-cultural production), where favourable monsoon con-ditions led to excellent paddy crops. In Latin Amer-ica, food production rose by 3%, which contrastsfavourably with the near-stagnancy of the two pre-vious years.
There was a 5% gain in China, where the recordgrain harvest of slightly more than 250 million tonshelped to overcome the setback caused by droughtin 1972.
The best result in the developed regions was shownby eastern Europe and the U.S.S.R., where both foodand agricultural production increased by 10%, amajor factor being the record U.S.S.R. grain harvest
1. See also Food and agricultural production in 1973, by regionsand countries, in rno, Monthly Bulletin of Agricultural Economicsand Statistics, 23, March 1974.
2
bly be below requirements for the third successiveyear. There are virtually no reserves left in export-ing countries, and despite the efforts to expand pro-duction in 1974, stocks cannot be replenished until1976, at the earliest. There is no assurance .that thedeveloping countries will be able to finance their in-creased food import bills. Food aid has already fallensharply, and unless aid budgets are increased tooffset inflated costs, its volume will shrink evenfurther. The world food situation will remain perilouS'.until a much higher and sustained rate of increasein food production is attained in the developingcountries and cereal stocks are rebuilt to saferlevels.
of 222 million tons, one third larger than in 1972.Also Oceania, with gains of 3% in agricultural
production and 10% in food production, made anexcellent recovery from the drought-stricken level ofthe previous year. Harvests were generally good toexcellent in western Europe and North America, andproduction increased by 3% and 2% respectively.
The marked improvement in world food produc-tion in 1973 as compared with the very difficultsituation in 1972 is further indicated in Table 1-3,which shows comparative results for ninety-sevendeveloping countries in 1972 and 1973, using 1961-65as the base period (100). Table 1-3 shows thatforty-seven of the countries included produced lessfood per caput in 1972 than in the base period, andthat per caput output in fifteen countries was downby more than 15% and in four others by more than10%. The combined populations of those countrieswhere food production per caput was lower than in1961-65 about 1 200 million represent some46% of the total population covered. Two maingroups of countries were involved: in the Indiansubcontinent and in west and central Africa. Onthe brighter side of the 1972 situation, as many asthirty-eight countries were producing at least 5%more food per caput than in 1961-65, seventeen ofthese as much as 15% and more. The change for thebetter in the world food situation in 1973 is indicatedby the sharp fall, from about 1 200 million to 470million, in the total populations of countries whereper caput food production was still below 1961-65;the proportion of population affected thus droppedfrom about 46% to 17%. The number of countrieswith per caput production levels below the 1961-65average fell slightly, the worst-affected area becom-ing concentrated largely in west, central and southern

TABLE 1-2. INDICES OF WORLD AND REGIONAL FOOD AND AGRICULTURAL PRODUCTION
Total
3
1 Preliminary. 2 Including countries in other regions not specified.
Africa. Conditions in the Far East improved sig- growing areas. The U.S.S.R. had a record crop ofnificantly, particularly in such heavily populated 110 million tons, about 30% larger than the disas-countries as India, Indonesia and the Philippines. trous 1972 crop. Production was also substantially
higher in the United States, encouraged by changesin government policy, as well as in Canada; it almost
PRODUCTION OF MAIN COMMODITIES 2 doubled in Australia. However, output fell in manydeveloping countries, including Argentina, Brazil,
World wheat production in 1973 reached a new India and several Near East countries, as well as inrecord, estimated at 377 million tons, with crop north Africa, and in the developing countries as aconditions good to excellent in the most important group. The gains were thus concentrated in the
U.S.S.R. and the developed exporting countries, whiletotal production in wheat-importing countries declined
2 For a more detailed review of the commodity situation, sccFAO Commodity review and outlook 1973-1974, Rome, 1974. slightly. Shipments to developing countries in 1973/
1973 I 1969 1970
Per caput
1971 1972 1973 1
Change1972
to1973
Food production
1961-65 aI'eragr 100 Per-cent 1961-65 averagc 100 Per-
cent
DEVELOPED MARKET ECONOMIES2 116 116 123 122 125 -I- 2 109 108 113 112 113 +2Western Europc 115 117 121 121 124 -I- 3 109 111 114 113 115 +2North America 115 113 124 122 125 +2 107 104 113 110 1 I I +1Oceania 121 121 127 127 139 +10 108 107 109 107 115 +8
EASTERN EUROPE AND TUE U.S.S.R. 125 132 134 134 148 +10 117 123 124 123 135 +9Total developed countries 119 121 127 126 132 + 5 111 112 117 115 120 +4
DEVELOPING MARKET ECONOMIES2 119 124 125 125 129 + 3 102 103 101 99 99 +1
Latin America 120 125 125 128 131 4- 3 101 102 100 99 99 oFar East 118 124 124 120 130 + 9 102 104 102 96 101 +6Near East 122 125 127 139 134 4 104 103 102 108 101 6Africa 117 119 122 124 119 102 101 101 99 93 7ASIAN CENTRALLY PLANNED ECONOMIES 116 122 125 123 129 +5 104 107 108 105 108 +3
Total developing countries 118 123 125 124 129 +4 103 104 104 101 102 +1
World 118 122 126 125 131 +4 105 106 108 105 108 +2
Agricultural production
DEVELOPED MARKET ECONOMIFS2 113 113 120 120 122 +2 106 105 110 109 110 + I
Western Europe 114 117 121 120 123 +3 109 110 113 112 114 +2North America 110 109 119 118 120 +2 103 100 108 106 107 +1Oceania 119 121 123 123 127 -I- 3 107 106 107 104 105 +1
EASTERN EUROPE AND THE U.S.S.R. 124 131 134 134 147 +10 117 123 124 123 134 +9
Total developed countries 116 119 124 124 130 -I- 5 109 111 115 114 118 +4
DEVELOPING MARKET ECONOMIES 2 119 123 124 124 128 + 3 I 102 102 101 99 99 o
Latin America 119 122 122 125 128 + 2 100 101 98 97 97 1Far East 118 123 124 120 130 + 8 102 104 102 96 101 +6Near East 122 124 128 139 133 4 104 103 102 108 100 7Africa 117 119 122 124 119 4 102 101 100 99 93 7ASIAN CENTRALLY PLANNED ECONOMIES 116 122 126 124 129 5 104 108 109 105 108 +3
Total developing countries 118 122 124 124 129 +4 103 104 103 101 102 +1
World 117 120 124 124 129 +4 104 105 107 104 107 +2

TABLE 1-3. FOOD l'RODUCTION PER CA PUT IN DEVELOPINGCOUNTRIES, 1972 AND 1973 (1961-65 AVERAGE = MO)
SOURCE: Annex table 2.
1974 rose by almost 30%, and larger amounts alsowent to China and eastern Europe, despite the factthat 1973 production had actually increased in theseareas.
World production of coarse grains increased toapproximately 675 million tons in 1973, 7% abovethe previous season and almost 4% above the recordlevel of 1971. The increase was due mainly to thelarge crop in the U.S.S.R., as output in the rest ofthe world rose by only 2%. Some increase in pro-duction occurred in most areas, but not in Africa,the Near East and eastern Europe. All grains con-tributed to the increase in world production. Barleyrecorded the largest rise in both absolute and relativeterms, almost exclusively owing to the record cropin the U.S.S.R.; in most other regions output de-creased or remained relatively stable. World pro-duction of maize resumed its upward trend followingrecovery in Argentina and larger crops in westernEurope, the United States and the U.S.S.R. Therewere larger crops of sorghum and millet in Argentina,India, the United States and to a lesser extent theU.S.S.R. Recovery in oats and rye production wasmainly a result of larger harvests in the U.S.S.R.
The 1973 world paddy crop (most of which wasavailable for consumption and trade in 1974) is esti-mated at 321 million tons, 4% above the previousrecord of 309 million tons (1971) and well above thelow 1972 crop of 294 million tons. There were biggercrops in most countries, although the recovery wasmost marked in the developing countries of the FarEast, where the 1972 setback had been more serious.The larger harvests were due not only to betterweather conditions, especially in the Far East, but
4
also to the response of farmers to sharply higherprices and other incentives.
Total world output of pulses increased by about4% in 1973, largely because of a sharp rise of 2 mil-lion tons (25%) in eastern Europe and the U.S.S.R.Output continued its downward trend in India, theworld's largest producer.
Expansion of world meat production came to ahall in 1973 after a slowdown in 1972. Red meatoutput in the developed countries actually declined,with production falling sharply in North America andremaining virtually unchanged elsewhere. Small gainswere reported in eastern Europe and the U.S.S.R.,and a substantial expansion took place in Latin Amer-ica, which accounted for the moderately higher totalproduction of the developing countries in 1973. Poul-try meat production continued to rise, although therate of increase in 1973 was probably one of thelowest in the past two decades. There was a slightreduction in North America. World egg productionmaintained its steady upward trend. World pigmeatproduction remained practically unchanged in 1973.Output fell by about 6% in North America, while forthe third consecutive year it showed no significantincrease in western Europe. Faced with an increasingcost/price squeeze and growing uncertainty aboutmarket conditions, many producers have apparentlyabandoned plans to expand output. World sheepnumbers continued to decline. The major reductionsoccurred in Oceania, where adverse weather resultedin lower lambing rates and slaughterings remainedhigh even some time after the marked rise in woolprices. The slow downward trend in numbers con-tinued in the United States and in most western Euro-pean countries, exceptions being France, the FederalRepublic of Germany and the United Kingdom. Thedecline in flocks led to a further drop in world muttonand lamb production, and the wool clip also declinedmarginally.
World milk production again increased slightly, butat roughly half the rate of 1972. There was signifi-cant expansion in eastern Europe and the U.S.S.R.,but output fell in Japan, North America and Oceania.There was only a marginal gain in western Europe.Both cow numbers and fodder production increasedin eastern Europe and the U.S.S.R., in contrast toconditions in most other developed regions, wherefeed conditions were unfavourable. In addition todrought in some areas, particularly severe in NewZealand, prices of concentrate feeds reached unprece-dented levels. Both cow numbers and milk yieldswere down in North America and New Zealand,although yields improved in Australia. In westernEurope lower milk yields offset an increase in cownumbers.
Although world sugar production in 1973/74 isestimated to llave reached a record total of about
Index offood production
per caput
1972 1973
Numberof
countries
Popu-lation(X)
Numberof
countries
Popo-lation(%)
84 and below . . 15 6.1 18 5.135-89 4 2.6 9 5.3)0-94 13 5.1 12 4.3)5-99 15 32.0 6 2.6
47 45.8 45 17.3
100-104 . . . . 12 6.0 19 37.4105-109 . . . . 14 37.1 9 34.8110-114 . . . . 7 7.2 12 9.0115 and above . 17 3.9 12 1.5
50 54.2 52 82.7
97 100.0 97 100.0

80 million tons, raw sugar equivalent, demand waseven greater, and world market prices more thandoubled between September 1973 and April 1974.World stocks were insufficient to ensure the continuityof supplies, especially after the beginning of 1974.The decline in stocks was widespread in both import-ing and exporting countries. Beet sugar productionis estimated to have reached nearly 32 million tonsraw sugar equivalent, about 3% more than in thePast two seasons. There was a substantial improve-ment in production in the U.S.S.R., mainly becauseof better weather conditions and yields. In westernEurope output did not fully recover to the recordlevel achieved with good weather in 1971/72, despitefurther expansions in the total area under beet.Production in the United States fell sharply and wasthe lowest for several years, owing to poor weatherat planting time and competition from grains andsoybeans. Output in eastern Europe was slightlydown. Cane sugar production in 1973/74 increasedby 6%, raising its share in total world sugar produc-tion to 60% as compared with 57% in the late 1960s.The increase came from developing countries, withproduction down in both Australia and South Africa.The largest increase, of about 1 million tons, camefrom Brazil; Cuba had another recovery and therewere record crops in Argentina, Colombia and Peru.The secular decline in output of some of the Carib-bean islands was reinforced by drought, notably inPuerto Rico, Barbados, Trinidad and Guadeloupe. Inthe Far East there was further recovery in India, andthe expansion in Indonesia and Thailand is expectedto continue. The upward trend of production in theAfrican and Near East regions continued, with recordcrops in Mauritius and Egypt.
Output of citrus fruit is estimated to have fallenslightly in 1973/74, after five years of uninterruptedgrowth. There were smaller harvests of oranges andtangerines in most main producing areas in the north-ern hemisphere, especially in the Mediterranean zoneand the United States. Exceptions are Italy andEgypt, where output rose by 5% and 10% respec-tively. Production of oranges and tangerines formarketing during the summer of 1973, consisting ofthe harvest in the southern hemisphere and the Va-lencia Late crop in California, fell by about 5%,mainly because of reductions in Australia and Brazil.Lemon supplies were also slightly down in 1973/74,as a 20% fall in United States production was notquite offset by an excellent Italian crop. World pro-duction of grapefruit was less, owing to poorer cropsin Israel and the United States. In Cyprus and SouthAfrica production was at the 1972/73 levels, whileoutput continued to expand in Argentina.
World output of oils and fats decreased in 1973for the first time in ten years. Production fell 0.6million tons below the previous year's record of
5
46.7 'pillion tons, and the drop was in sharp contrastlo the average long-term increase of some 1 1 milliontons annually. Production remained practically un-changed in developed countries but fell elsewhere.The fall by 3% in exports of oils and fats from de-veloping countries led to a resumption, after a re-versal in 1972, of the long-term decline in the relativeimportance of these countries in world trade. Amongthe soft oils the largest absolute drop in output wasin groundnut oil, primarily because the Indian cropwas drastically cut by drought, which also affectedproduction in west Africa. An increase in worldoutput of soybean oil largely offset the lower outputof groundnut oil, mostly reflecting increased produc-tion in Brazil and the United States. Both produc-tion and trade of cottonseed oil expanded, mainly onaccount of developments in the United States, andthere was a significant increase in exports of rapeseedoil despite a smaller world production. Sunflower-seed oil output and trade are estimated to have fallenslightly. For the fourth consecutive year there wasa smaller crop in the U.S.S.R., the world's largestproducer and exporter, owing to unfavourableweather. World output of olive oil was slightly down.Sharply lower production in Italy led to high imports,mainly from Spain, to maintain consumption levels.World exports of palm oil continued to expand,largely because of another expansion of output inMalaysia. Fish oil production, still drastically af-fected by low catches of anchoveta off South Amer-ica, fell below the already reduced level of 1972.
The 1973/74 world coffee crop was about 15%lower than in 1972/73, mainly because of frost inBrazil and drought in Africa. Total carryover inproducing countries was again sharply reduced, aftertending to stabilize in the last two crop years. Thefinal official estimate for Brazil places the crop at855 000 tons, as compared with 1.4 million tons in1972/73. The most serious losses were in the Stateof Paraná, but production was also down in SaoPaulo and other states. The African drought reducedcrops in many countries, including the arabica cropsof Ethiopia and Kenya and the robusta crops ofCameroon and Ivory Coast; the latter's outputmay be 40% lower. Colombia, on the other hand,is expected to have a record crop for the second yearrunning, owing to good weather and the high yieldsbeing obtained from the recent and increasing plant-ings of Caturra varieties. Elsewhere in Latin Amer-ica production was generally lower, notably in Mexicoand El Salvador. Output in the main Far Easternproducers, India, Indonesia and the Philippines, isagain at a high level.
Cocoa bean production in 1973/74, at some 1.4million tons, was close to the previous season's levelbut about 10% down from 1971/72. The 1973/74crops in the main west African producing countries

were again badly affected by drought, and the worldsupply situation continued very tight in spite ofrecord production in Latin America. The very dryweather in west Africa came during the period ofpod development, and most crops were thereforeabnormally late. Decreases in the Ghana and Nigeriacrops were only partially offset by better results inCameroon and Ivory Coast, where the 1973/74crops (at some 210 000 tons) were the second largeston record despite the dry weather. The good LatinAmerican results are primarily due to increased out-put in Brazil, where there was a record Bahia maincrop and a recovery in the tempordo crop from thedrought-affected 1972/73 level. A return to morenormal weather conditions could result in improvedworld output next season, but the problem of thelonger-term potential is one of increasing urgency.
World tea production reached another record in1973, but the 2% increase over 1972 was less thanexpected. Production recovered sharply in Bangla-desh (up 16%), and in India a good northern croplargely accounted for a 3% increase. Output wasunchanged in Indonesia but fell sharply in Sri Lanka.Kenya had an 8% increase compared to less than3% for Africa. Production fell sharply in Argentina,discouraged by higher costs and adverse weather.
World tobacco production continued to increase,by some 2%, in 1973, but in contrast to the previousyear developing countries as a group did not sharein this increase. Production gains in western Europederived from a revival of output in Greece andcontinued increase in Yugoslavia. The tobacco cropin the U.S.S.R. made a good recovery, and Chinahad a record crop of nearly 1 million tons. Lowertotal output in the developing countries stemmedmainly from a sharp reduction in India and smallercrops in Cuba, the Republic of Korea, Pakistan,Rhodesia and Turkey. World output of light cigaretteleaf rose again in 1973, with notable increases influe-cured leaf in Canada, China, Japan and theUnited States. Burley production, however, was farbelow the 1972 record even if it was the secondhighest reached.
World production of cotton remained unchangedin 1973/74 after substantial increases in the previoustwo years. There was a shift in cultivation fromcotton to more remunerative crops in some areas,but this was balanced by high yields and the highquality of the fibre harvested. The United Statescrop was drastically reduced following extensiveflooding in the Delta region, while shifts away fromcotton led to lower production in western Europe,the Near and Far East, Mexico, Colombia and someAfrican countries. There were increases in theU.S.S.R., where production reached its third consec-utive record, and in China, where it staged a partialrecovery from last season's setback. Total output
6
in the developing countries was slightly below thehigh 1972 level.
Output of jute rose by about 10% over 1972/73.India liad an exceptionally large crop resulting froma combination of favourable weather and higheryields on its intensive cultivation schemes. Produc-tion rose by about 25% in Thailand. However,the crop in Bangladesh was about 9% smaller, as aresult of both floods and reduced sowings in favouror paddy cultivation because of the more favourablerice prices.
World production of sisal and henequen in 1973,still affected by the droughts of 1970-72 and thereduced replantings of the previous years, remainedat about the same low levels as in 1972. Althoughweather conditions in east Africa returned lo normalfor a large part of the year, output in Tanzaniadeclined slightly again; an increase of about 40% wasobtained in Kenya, largely from hedge sisal on smallfarms, and because of the new government policyencouraging resumption of output on estates whichhad gone out of production during the previouslow-price period. Production also continued torecover in Haiti, encouraged by better prices. Nochanges were reported from Brazil, now the majorworld sisal producer, or from Madagascar, Mozam-bique and other minor producing countries. Thedecline of more than 20% in Angola's output repre-sented a return to more normal levels after the largeincrease obtained in 1972 by heavy cutting-out ofold plantations. In Indonesia, production appearsto have eased completely in 1973. Mexican Ilene-quen declined marginally.
World output of natural rubber rose considerablyin 1973, as higher prices brought increased tappingin all producing countries. Demand was strong,partly as a result of uncertain supply conditions forsynthetic rubber. The increase in output from Ma-laysian smallholdings, where tapping was reduced in1972 because of low prices, was one third higher.Output in India and Thailand also rose substantially.Even in Indonesia, where the possibility of raisingproduction is limited because of the low rate ofreplanting over the last decade, and in Sri Lanka,where political difficulties have discouraged produc-tion, output increased as a result of excessive tapping,as well as of chemical stimulation in some areas.The increase in African production was largely dueto higher output in Nigeria.
After two years of reduced output, 1973 wine pro-duction expanded to record levels as a result of verylarge increases in most important produciug coun-tries. World output, estimated at 349 million hec-tolitres, was about 25% above the 1972 level, whenproduction was adversely influenced by weather.Output in western Europe was more than 30%greater, and the harvest was also excellent in quality.

In eastern Europe the harvest increased by about10%, with production higher in every country, par-ticularly in Hungary and Romania. The U.S.S.R.harvest was for the first time above 30 million hec-tolitres. Production rose by 15% in Algeria despitefurther reductions in planted arca. Good results wereobtained in Morocco and Tunisia. Wine productionin the United Sta tes was sharply up on the reduced1972 crop as a result of excellent weather duringspring and summer. In the southern hemispherethe crop harvested early in 1973 was aboutnormal.
Production 1974
FAO'S first tentative world and regional indices offood and agricultural production for 1974 reveal thatthe year failed to bring the very large harvests thatare so urgently needed for replenishment of stocksand reestablishment of a reasonable degree of securityin world food supplies. Thus, for the third year,the world continues to face a situation of shortage,uncertainty and crisis.
In 1973, and this should be emphasized, worldfood supplies depended precariously on the outcomeof the current season and therefore to a large extenton the weather. Fortunately the weather was gen-erally favourable in 1973, and there was a consid-erable increase in world food production, especiallycereals. But a very large part of this increase wasin eastern Europe and the U.S.S.R. (about 10%)and in the Far East (about 8%), so it did notlead to the necessary rebuilding of cereal stocks inthe main exporting countries, in particular those ofNorth America. These stocks were in fact stillfurther reduced by mid-I974, the end of the 1973/74crop season.
Therefore, again in 1974, world food supplies de-pended to an extreme degree on the current year'sproduction of cereals. There were however additionaldifficulties because of the shortage and high priceof fertilizers. While the difficult fertilizer situationbegan earlier because of cyclical conditions in theindustry, it was exacerbated by the increase in theprice of petroleum that began in October 1973 andreached a fourfold level by December 1973. Therise in petroleum prices caused shortages of fuel andpower for irrigation pumping in many countries.Thus, even if the weather had been optimum for agri-culture throughout the world in 1974, it would nothave been possible to take full advantage of it.
It became increasingly clear in the last few monthsof 1974 that the weather had been very far from theoptimum during the year. This particularly affectedthe production of cereals, the staple food of most ofthe world's poorest people. Cereal production fell
7
sharply in several regions in 1974, but especially inthe Far East and North America. The Far East isthe most heavily populated region in the world andalso the region where most of the world's malnour-ished people are concentrated. North America is theregion on which world food security must greatlydepend until the increase in food production can besufficiently stepped up elsewhere, particularly in theneedy, developing countries themselves.
World cereal production fell in 1974 for the secondtime in three years. In North America earlier opti-mistic expectations of record cereal harvests weregradually scaled down as a result of drought in theMidwest and early frost. Among the other developedregions, tbere were record wheat crops in westernEurope. But in the U.S.S.R. cereal crops fell furtherbelow the very high record levels of 1973 than wasearlier expected, and there was also a decline inOceania. In Africa, Latin America and the NearEast substantial gains were registered over the gen-erally poor results of 1973. In the crucial Far Eastregion, however, the monsoon was late and erratic,and although the fl-aal outcome is not yet known,cereal production appears to have been considerablybelow the high levels of 1973. The extent to whichthe fertilizer shortage contributed to the widespreadfailure of cereal harvests in 1974 cannot be deter-mined at present, since its effects have been largelymasked by those of the weather.
With the disappointing harvests of 1974, priceshave started to rise again (Table 1-4). United Statesexport prices for wheat and maize remain almostthree times higher than in mid-1972, and Thai riceprices, although continuing to fall slightly, almostfour times as high. These high prices, combined withthe limited availability of food aid, continue to ag-gravate the balance of payments problems of themany developing countries requiring large importsof cereals. The rapid inflation of retail food pricesalso continues to bring hardship to the poorer con-sumers, although nonfood items have recently takenthe lead in price increases in most countries.
The supplies of cereals available to the world forthe 1974/75 season should be sufficient to meet allessential requirements for human consumption. How-ever, the low level of these supplies makes theirorderly management and equitable distribution anurgent matter. If they are allocated purely by priceand cash purchase, many of the hardest-hit countrieswill be unable to obtain the imports they need. More-over, some of these needs are still not fully known.For example, in India, where the immediate situationis in the words of the Prime Minister "extremelydifficult," the outcome still depends largely on theresults of the winter crops, which will not be knownuntil March 1975. Thus it is necessary to earmarksome supplies now, while they are still available in

TABLE 1-4. - RECENT CHANGES IN EXPOR1 ERICES OF SELECTED AGRICULTURAL COMMODITIES
I March (first week). - 2 Three weeks. - 3 Thai rice, as well as rice from most other regions, was not quoted regularly on the worldmarket from the second week of March to November 1973; this average is estimated on the basis of the few quotations that are availableand is only indicative of the change that has taken place in prices.
the market, for emergency needs that may arise untilJuly to October 1975, when the next main crops inthe northern hemisphere are harvested. The Director-General of FAO has therefore urged that the maincereal-exporting countries should take concertedaction to set aside for emergency use a minimum of8 to 12 million tons of cereals, in addition to importsalready contracted for and quantities committed asfood aid, for the group of most severely affectedcountries. He has also called for special measures,such as deferred payments and other concessions, toassist the developing countries in paying for the im-ports they require and for a continuing monthlyreview of the cereals situation as a basis for con-sultations among the major exporting and consumingcountries. Other related contingency measures alreadyunder way include the United Nations EmergencyOperation and the International Fertilizer SupplyScheme, both of which are still short of re-sources.
The world food situation at mid-October 1974 musttherefore be viewed with considerable concern. Theavailable supplies must be carefully managed duringthe subsequent nine to twelve months. Lookingbeyond this critical period, the outcome of the 1975harvests will be decisive. The poor results of 1974have postponed the replenishment of stocks for atleast another year, and 1975 will be the successivethird year in which food supplies depend perilously
8
on current harvests. In addition to weather, fertilizersupplies will again be a crucial factor, underliningthe importance of the International Fertilizer Scheme.While the shortage of fertilizer has not eased, pricesmay be reaching a peak, demand being discouragedby their present very high level. Some importantpesticides will also be in short supply during 1975.The concern aroused by this fact is heightened by theconsideration that prospects for increasing productionin future years appear dim.
The close interconnection of cereals and livestockproduction remains a major element in the world foodsituation. In addition to any other possible policyimplications, more cereals will have to be used fordirect human consumption and less for meat pro-duction; the cost/price squeeze is already leading tothis result.
Despite the decline in cereal production in 1974,total world food and agricultural production appearslikely to have increased slightly (Table 1-5). Thedata available in mid-October, which are incompleteand highly tentative, indicate an increase of no morethan 1%. This increase has resulted in the mainfrom a sharp expansion in livestock production,especially in western Europe, and thus has not greatlybenefited the food supplies of the countries whereshortages are most critical.
In the developed countries as a whole, total foodproduction in 1974 is estimated at about the same
U.S. dollarslinetric ton U.S. centslpound1972: January 60 131 51 125 7.90 44.80
June 60 136 53 138 6.33 47.76December 104 186 69 174 9.15 55.12
1973: January 108 179 79 214 9.40 57.03June 106 1205 102 470 9.38 62.78December 199 521 113 254 11.85 65.11
1974: January 214 538 122 261 15.40 66.24February 220 575 131 271 21.10 70.77March 191 603 126 265 21.10 72.04April 162 630 114 235 21.60 72.89May 142 625 114 229 23.63June 156 596 117 228 23.51July 169 519 132 276 25.03August 167 521 146 320 31.10September 2 170 516 143 34.15
AVERAGE: 1971 62 129 58 126 4.50 44.661972 70 151 56 140 7.27 50.341973 139 1368 98 290 9.45 62.16
SugarWhen t
(U.S. No. 2Hard Winter,
Ordinary,f.o.b. Gulf)
Rice
(Thai whiterice 5%, f.o.b.
-Bangkok)
Maize
(Yellow No. 2,f.o.b. Gulf)
Soybeans
(U.S., c.i.f.Rotterdam)
(isn compositeprice, world
market, f.o.b.and stowedCaribbean
ports)
Coffee
(Leo compositeprice
New Yorkca-warchouse)

TABLE l-5. --- ANNUAL CHANGES IN WORLD AND REGIONALAGRICULTURAL PRODUCTION I
I While these figures refer to total agricultural production,changes in food production are likely in most cases to have beenof a similar order of magnitude; the slightly different figures forfood production in 1974 in North America and Oceania are notedseparately. 2 Preliminary. 3 Including Japan, Israel andSouth Africa. 4 Food production: 5 to 4%. 5 Foodproduction: +1 to +2%. 6 Excluding Japan. 7 ExcludingIsrael. -- s Excluding South Africa.
level as last year. A decline of 4 to 5% inNorth America and a possible slight fall in easternEurope and the U.S.S.R. have been roughly balancedby increases in western Europe and Oceania. In thedeveloping countries, for which the data are evenmore tentative, there appears to have been a slightrise in food production in 1974, but almost certainlyless than the population growth. In Latin Americathe increase of 3 to 4% would, if confirmed, bethe largest since 1969. There were large increasesin Africa and the Near East, the two regions wherefood production had declined in 1973. In the NearEast this recovery probably raised production abovethe very high record level of 1972, but in Africaproduction in 1974 was only 3 or 4% more thanin 1970. The serious drop in food production in theFar East in 1974, tentatively estimated at 2 to3%, and thus comparable to the 1972 decline, alsoimplies a level of production only 3 to 4% above1970. Food production in China probably increasedby 1 or 2% in 1974. Per caput food productionin the developing countries as a whole remains lower
9
Iban in 1970 in Africa and the Far East very!-iubstantially so.
PRODUCTION OF MAIN COMMODITIES
As cereals and livestock products have been themain determinants of the overall level of food andagricultural production in 1974, they will be discussedin more detail below. First, however, some othermain commodities must be mentioned.
Although total production of vegetable oils andoilseeds (in oil equivalent) is estimated to havedecreased by about 2% in 1974, there were sub-stantial variations in the production of certain. prod-ucts. Groundnut production rose by about 3%, witha large mercase in Africa (30%) and declines in LatinAmerica (16%) and the Far East (10%). Soybeanproduction dropped by 9%, with a fall of 19% in theUnited States, the world's major producer, and anincrease of 40% in Brazil; soybean prices have there-fore begun to rise again. Although fishing has beenresumed in the Peruvian anchoveta fishery, fishmealproduction remains sharply reduced and prices high.Thus the general shortage of other concentrates be-sides grains for livestock feeding continues.
World sugar production increased by about 2%in 1974 but fell by 21/2% in developed countries.Prices continued to rise steeply and by Septemberwere more than twice as high as in January 1974and more than four times as high as in January 1972.The 1974 cocoa output is estimated to be 5% higherthan in 1973.
Among the other main crops, coffee productionincreased by 16%. Brazil, where production recov-ered by about 50%, accounted for about 500 000 tonsof the 700 000-ton increase. Cotton production roseby about 1%, probably reaching a new high, anda record crop is reported in the U.S.S.R. A drop ofsome 20% in the production of jute and kenaf couldhave serious consequences for the export earningsof Bangladesh and India. The production of naturalrubber appears to have increased slightly to a newrecord level.
Preliminary estimates of world cereal productionindicate a decline of between 2 and 3% in 1974 fromthe previous year's record level (Table 1-6). Pro-duction fell particularly sharply in North America,Oceania, the U.S.S.R. and the Far East.
There is likely to have been only a moderatedecline in world wheat production in 1974 from the1973 record level, with a reduced but still largevolume of trade in the trading year 1974/75 (1 July-30 June) and little or no prospect of stock replenish-ment at the end of the season. The incentives pro-vided by higher prices, together with favourableweather in some regions, contributed to larger bar-
1961-63to
1971_73(an-
1970to
1971to
1972to
1973to
nual 1971 1972 1973 1974 2aver-age)
Percent
DEVELOPED MARKETECONOMIES 3 +2.1 +6 0 + 2 O
Western Europe . +2.1 +3 I + 3 +3 to +4North America . +2.0 +9 1 + 4-4 to 3Oceania +2.6 +2 0 -F 3 5+2 to +3Eastern Europe
the U.S.S R +1.6 +2 0 +10 5-1 to 0
Total develo pedcountries +2.6 +4 0 + 5 0
DEVELOPING MARKETECONOMIES +2.6 0 + 3 +1 to +2
Latin America +2.6 0 +2 + 2 +3 to +4Far East 6 +2.4 +I 3 + 8 3 to 2Near East 7 +3.3 +3 +8 4 +5 to +6Africa 5 +2.3 +2 +1 4 +4 to +5Asian centrally plan-
ned economies . +2.8 +3 --2 -I- 5 -i-1 to +2
Total developingcountries +2.6 +-", 0 + 4 +1 to +2
World +2.6 +3 0 + 4 0 to +1

TABLE 1-6. ANNUAL CHANGES IN WORLD AND REGIONAL CEREALAND LIVESTOCK PRODUCTION 1973 TO 1974 1
1 Preliminary. 2 Including Japan, Israel, South Africa. -3 Excluding Japan. Excluding Israel. 5 Excluding SouthAfrica.
vests in many importing countries; however, drought,rain and early frost restricted wheat production to48.5 million tons in the United States and 14.2 mil-lion tons in Canada, a total of about 15 million tonsless than earlier predictions for the North Americanharvest. The U.S.S.R. wheat crop is currently esti-mated at around 90 million to 95 million tons, down15 million to 20 million tons from the 1973 recordcrop. Excluding the U.S.S.R., total wheat produc-tion in 1974 was actually higher than in 1973, withrecord crops in both the United States and westernEurope. Total production in developing countriesincreased in 1974. Estimates issued by the Inter-national Wheat Council (twc) on 28 November 1974forecast exportable supplies for 1974/75 of between65.8 million and 69.1 million tons, compared withestimated imports of 65 million to 66.5 million tonsand actual imports of 62.1 million tons in 1973/74.Thus the global supply and demand situation forwheat remains very delicately balanced.
Production of coarse grains is estimated to haveincreased or at least remained at the 1973 level inall regions except North America, the major exporter,and the Far East, where production declined sub-stantially. United States maize production fell by18% from the 1973 record. On the basis of pres-ent production forecasts, total exportable suppliesof coarse grains will be much lower for 1974/75.More coarse grains are available for export in Ar-gentina, Australia, South Africa and Thailand, butthe increased supplies of these and some smallerexporting countries are far from sufficient to offset
10
the heavy decline in the United States, where exportsupplies are currently estimated at about 28 milliontons as compared with actual exports of almost40 million tons in 1973/74. This implies that ex-ports on the scale of 1973 can take place only byfurther reducing carryover stocks which were al-ready at minimum operating levels at the beginningof the season and with a substantial reductionin dom-stic feedgrain use in the United States.There are however many uncertainties connected withthe forecasting of export availabilities and import re-quirements for coarse grains in 1974/75. It is par-ticularly difficult to make a reliable forecast of thelikely demand for grains as animal feed, in bothexporting and importing countries, because of thesevere cost/price squeeze affecting the livestock in-dustry and the slowdown in economic activity in manydeveloped countries. Demand for coarse grains asfeed may also be reduced because the poor qualityof part of the wheat crop in some areas may necessi-tate its use for feed. Nevertheless, on the whole, itseems highly probable that the world supply anddemand situation for coarse grains will remain verytight in 1974/75.
The tight grain situation has recently caused theUnited States to halt certain shipments of grain tothe U.S.S.R. and Iran, and to introduce guidelinesfor export sales which are "intended to assure anadequate but not excessive flow of grain to traditionalcus':omers." The introduction of these guidelinesfollowed closely on the United States Department ofAgriculture's crop estimates, based on conditions asof 1 October, which showed that estimated totalwheat and maize production had dropped by I and6% respectively from the September estimates.
It is still too early for definite figures on the ricecrop harvested in the Far East at the end of the year.Some countries, including China, Indonesia, Japan,the Republic of Korea and Malaysia, liad or expectedgood harvests. In others, however, the monsoon,after a late start, seems to have departed early fromsome areas, and consequently the kharif crops (mainlyrice) in India may not exceed 60 million tons, com-pared with 67 million tons in 1973 and the targetof 69 million tons for 1974. On the basis of presentindications the world's paddy crop is likely to beabout 317 million tons, some 2% below 1973, andtherefore the supply and demand situation for ricein 1974/75 is likely to remain very difficult, withsharply depleted stocks (except in China) and acontinued increase in demand.
Livestock producers almost everywhere weatheredthe first year (1972/73) of the upsurge in grain pricesremarkably well thanks to buoyant meat markets.Beef and, to some extent, sheep producers foundthemselves benefiting from a worldwide shortage asgrowing demand from a more prosperous world econ-
Cereals Livestock
Percent
DEVELOPED MARKET ECONOMIES 2 4 to 3 +3 to +4Western Europe + 4 to + 5 +5 to +6North America 11 to 10 +1 to +2Oceania 6 to 5 +3 to +4Eastern Europe and the U.S.S.R 6,to 5 +3 to +4
Total developed countries . 5 to 4 +3 to +4
DEVELOPING MARKET ECONOMIES 0 to + 1 +1 to
Latin America + 9 to +10 1 to 0Far East3 6 to 5 +2 to +3Near East 4 +12 to +13 +2 to +3Africa 5 +15 to +16 1 to 0Asian centrally planned economies 0 to + 1 +2 to +3
Total developing countries . . O to + 1 +1 to +2
World 3 to 2 +3 to +4

only outstripped available supplies. This, in turn,encouraged the holding back of cattle to build upherds and increase production capacity -- - which fora time served only to make the shortage even worseand push prices still higher. It is true that most ofthe world's heel is produced off grass and is thereforerelatively independent of grain market developments;but expensive beef provoked an analogous rise in theprice ceiling on livestock products based almostwholly on grains and oilseeds (i.e., pigs, poultry andeggs). The producers concerned found they couldstill operate profitably despite the sharp rise in theprice of their biggest single input, feedgrains.
In 1973/74, however, the expansion in livestockproduction encouraged by the high prices ran aheadof demand, the growth of which had already beenreduced in many developed countries by high retailprices and consumer resistance in the face of fallingreal incomes. Livestock producers in developedcountries are now severely affected by the cost/pricesqueeze, and many developing and other countrieswhich depend on livestock exports are also facinggreat difficulties, while consumers have hardly bene-fited from these developments. The sudden changein demand has led in several countries to a sharpfall in producer prices and to various import re-strictions.
The expected 2 to 3% increase in world meatproduction in 1974 reflects both the record cattleinventories built up in 1973 and earlier in response
Annual fluctuations in production are a majorfeature of the world food situation. Often they tendto offset one another to some extent at the regionalor global level, but when, as in 1972, there are simul-taneous drops in production (or increases short ofthe trend rate) in a large number of major countriesand regions, the implications for the world food situ-ation are serious. Therefore, in assessing the longer-term trends in food production, it is necessary toexamine the annual fluctuations above and belowthese trends and to attempt to determine whetherthere has been any cyclical pattern in their magnitudeor frequency which has affected the longer-termtrends.
Variations in seasonal rainfall, temperature, andother climatic factors are generally the principalcauses of fluctuations in food production; but iso-lating their effects from those of other factors involvedis difficult, having been effected for only a few cropsin some developed countries. Fluctuations in pro-duction lead to changes in price, employment, income,
to high meat prices and the heavy slaughterings inwestern European countries (up 10 to 20% in mostof them) and in the United States from mid-yearonward as an immediate consequence of the droughtin the Midwest and the western ranges and theresulting high prices for maize, soybeans and otherfeeds. Beef consumption in nearly all major beef-importing countries failed to increase, as the de-cline in producer prices for cattle and calves wasnot reflected in consumer prices. From 16 July 1974import licences were suspended for all products cov-ered by the EEC beef regulations (with the exceptionof the GATT quotas for frozen beef) until the situationin the EEC markets improved, and imports from thirdcountries were stopped. Imports of beef into Japanwere temporarily suspended. In the United Statesthe weakening of demand from feedlots for replace-ment cattle is keeping feeder cattle prices low. Pig-meat and poultry prices have come under strongpressure in recent months in western Europe andNorth America owing to difficulties in finding outletsfor increased production. Sharp rises in costs anduncertainties about the future of the market in viewof consumer resistance to high prices will in thecoming months almost certainly discourage furtherexpansion in the production of beef and other meats.Stagnant demand and the building up of livestockherds, in addition to the substantial stocks of meatin cold storage, may prevent any improvement inlivestock prices until late in 1975.
The influence of weather and climate on food production
11
and demand, which in turn influence the course ofproduction, generally- accentuating the fluctuationscaused by the weather. Changes in price and otheragricultural policies can cause production to varysharply from the trend. Civil disturbances, hostilities,natural disasters unrelated to weather, and pests anddiseases (sometimes linked with weather) are othersignificant contributors.
Climatic variations over quite short periods arenow generally recognized. For example, in theSahelian zone of Africa, where from the 1920s to the1960s the rainy season extended well to the north,the seasonal rainfall for the past six years has beenfar below average. On the basis of recorded changesof this kind over the last few decades, the WorldMeteorological Organization (wmo) concludes thatthe main overall changes appear to be a trend towardcooler conditions in parts of the northern hemisphere(at least until the beginning of the 1970s) and morefrequent extreme weather conditions such as floods,droughts, and cold and warm spells in widely scat-

tered areas. Nevertheless, except for the coolingnoted in parts of the northern hemisphere, theredoes not appear to be any overall trend toward drier,wetter, colder, or warmer weather; rather, it seemsthat certain areas have become more subject todrought and flood and to temperature extremes.Although the basic causes of these changes are un-known, they are associated with changes in the atmo-spheric circulation in the northern hemisphere.
While such changes have, of course, substantiallyaffected fluctuations in food production in particularareas, there is no evidence that any of the globalclimatic trends have had any significant influence oneither their magnitude or frequency. According towmo, the numbers of countries where yields perhectare of wheat and rice fell in any year during theperiod 1962-72 are distributed at random, showing nounusual or significant trend. An FAo analysis givesno evidence of significant change in the distributionof the "instability indices" of total food productionin 125 countries between the periods 1952-62 and1962-72.3 Although neither of these analyses dealswith the effect of climate as a separate factor, theyindicate that all the factors affecting variability, suchas expanded or more effective irrigation, extension ofcultivation into marginal land, other positive andnegative effects of technological change, pest anddisease outbreaks, policy changes, hostilities, andearthquakes, as well as changes in the weather, tendedto balance one another at the global level during theperiods considered; it is even possible that the effectsof changes in the weather were offset by changes inother factors. In the future, however, the balancecould change, and it is therefore necessary to givegreater attention to studying the effects of weatheranomalies on agricultural production.
The instability indices calculated by FAO for totalfood production in individual countries for the period1952-72 range from less than 2 to 37. Because onecountry offsets another, the indices are smaller forbroad zones and regions. In the main regions theindices for cereal production (for which the index ishigher than that for food production as a whole)range from 4 in the Asian centrally planned econ-omies through 6 to 8 in most regions, to 10 in NorthAmerica, 13 in eastern Europe and the U.S.S.R., and42 in Oceania. The overall index for the developedcountries is 6, as compared with 3 in the developingcountries, reflecting the effect of changes in agri-cultural policies as well as climatic conditions.
The worldwide instability index for cereal pro-duction in 1952-72 is 4, indicating that normal fluc-tuations can be expected to lie within the limits of
3 The instability index is defined as the percentage standarddeviation of the annual change in production from the trend rate;e.g., an index of 4 means a fluctuation of 4% above or belowthe trend.
12
8%; in fact, the 1972 shortfall in crop productionlay within these fluctuation limits.
Seasonal fluctuations in harvests can also be mea-sured as the amount by which a particular harvestfalls below that of the preceding year (instead ofbelow the trend). This deviation may be larger thanthat given by the instability index because quite oftena poor year follows a very good one. This deviationis extremely relevant for most developing countriesbecause, lacking storage, they tend to use up mostof the good crop in the year of reaping and aredefenceless against the hunger experienced by theirpeople and animals when a harvest turns out badly.A survey of the yearly cereal output in thirty-ninecountries over an eleven-year period showed thatone fifth of the declines were in the range of 20%or more. Large declines were most frequent incountries of northern Africa and the Near East whichare subject to droughts; declines of more than 30%occurred in as many as three of the eleven years inAlgeria, Senegal and the Syrian Arab Republic.
Although there is no evidence that fluctuations inproduction have worsened at the global level inrecent years, there is little doubt that the effects arenow much greater and more widely felt. Formerly,lower production was to a large extent counteracteddomestically in many countries by reductions in con-sumption or by the slaughter of livestock in years ofshortage. At present, because of widespread reluc-tance to counteract fluctuations in this way, there isan increasing tendency, most recently in the U.S.S.R.,to attempt lo maintain consumption levels by recourseto imports. Since the volume of international tradeis so much smaller than that of domestic production,fluctuations in trade are even more pronounced.
A recent analysis of the relative roles of improvedtechnology and weather in determining crop yieldsin the United States has underlined the usefulnessof this type of work. By statistical means the spe-cific weather factors that contribute to high or lowyields of several crops in the various grain-producingregions are also evaluated. The conclusions of thisanalysis are particularly relevant in view of thedrought-affected 1974 U.S. harvests, as the report(published in December 1973) indicates that "theprobabilities of one or more drought years in the nextthree years are 7% for soybeans, 26% for corn[maize], and 29% for wheat."
Drought is defined as a lack of rainfall that re-sults in yields 10% or more below normal. Thisaccurate assessment is dramatically illustrated in theseries of maps in Figure 1-1, showing the spread of
4 The influence of weather and climate on United States grainyields: bumper crops or droughts. The Associate Administratorfor Environmental Monitoring and Prediction, National Oceanicand Atmospheric Administration, U.S. Dept. of Commerce.December, 1973, p. 29.

FIGURE I-1. Tu E SPREAD OF DROUGHT IN THE UNITED STATES, I APRIL.-1 Acmus-r 1974 (COMPARED WITH I AUGUST 1973) '
CiJ Good to excellentM Poor to feu
VerY PoorWI Severe drought
Extreme drought
ED Good to excellentFM Poor to lair
VetY pOotSevere drought
ED Not osttmated
FTjGood to excellent172,:t Poor to (air[= Very poor
St.te droughtF=-, Extreme drought
1 APRIL 1974
Good to excellentI'M Poor to la,(113 Very poorCO Severe drought(Z1 Extreme drought
1 JUNE 1974
1 AUGUST 1973
CO Good to excoltentMt Poor to PauMI Very poorMI Severe drought133 Extreme drought
1 MAY 1974
1 JULY 1974
ca Good to excellentMt Poor to (air
ttery POO!EZI Severe droughtMg Extreme drought
1 AUGUST 1974
Sounti: U.S. Department of Agriculture, Crop Reporting Board, S atistical Reporting Service, Crop production, issues of 108 May, 10 June, 11 July and 12 August 1974.
I Based on correspondents' reports on current supply of feed for grazing on nonirrigated pastures and ranges relative to expectationsfrom existing stands under very favourable weather conditions.
April,

drought into the grain areas of the United States fromApril through August 1974. The study points outthat "in recent years there has been a remarkablerun of near-normal weather or even that relativelyunusual weather that produces even higher yields.The reliability of the grain yields in recent years isdue to an extraordinary sequence of favourable grow-ing seasons. This cannot be expected to continue.-[italics added]. Apparently, preliminary estimatesof the 1974 U.S. wheat and maize crops did not takethis warning into account.
AGRO METEOROLOGY.
Agrometeorology is the application of meteorologi-cal knowledge to agricultural development. Untilrecently relatively neglected, it has become the subjectof a new collective effort in belated recognition ofits immense potential importance. The main objec-tives of agrorneteorology in relation to the knowledgeof climates are the following:
I. Appraisal of the climatological and agroclimato-logical characteristics of various natural regionsof a country.Agricultural and livestock diversification, and theintroduction of new species, varieties, and breedsbased on thorough agroclimatological investiga-tions. This can be achieved in particular bytesting crop and animal performances in variousagroclim a tological conditions.
Preparation of cropping calendars by region andsmaller areas so as to make the best use of theseasonal agroclimatic cycles.
Adjustment of cropping methods to compensatefor harmful aspects of climates or microclimatesin relation to an ecophysiological optimum.
The carrying out of special investigations on cropwater requirements through experimentation inlysimetric tanks, in order to define standards forrational irrigation of these crops.The undertaking of study or research on anyquestions of specific interest with regard to agri-cultural development and conservation of the en-vironment.
Study of the problem of the effects of climaticvariations on world food production, in order toorganize the latter on the basis of logical deduc-tions and conclusions.
Agrometeorological activities related to weatherforecasting can provide the following:
I. Regular information to farmers on weather evo-lution, and the broadcasting of special bulletinsbased on the regional cropping calendar.
14
Special advice concerning the risk of crop diseasesand insect outbreaks related to weather evolution,and the forecasting of the movements of locustswarms.
Special vigilance in the forecasting of crop-destroying phenomena, such as droughts, tropicalhurricanes and typhoons, hailstorms, floods, andfrosts.
Regional crop forecasts based on present cropconditions, past weather since the start of thecropping season, and probable weather until theend of the vegetative cycle.Meteorological advice concerning the drying ofharvested crops and their conservation.
Special meteorological forecasts of forest firehazards, and the broadcasting of adequatewarnings.
1f agrometeorology were well organized at national,regional and world levels to carry out daily operationsin the above activities, world agricultural and foodproduction would clearly reach a much higher level,nearer its potential, and would at the same timepresent much smaller fluctuations.
Currently there are many inadequacies in this field.There is, for example, the absence in the developingcountries of valid agrometeorological forecasts andof adequate agricultural extension services to ensurethe implementation of broadcasted warnings andadvice. This is particularly regrettable as the WorldWeather Watch (www) has been operating since1968 and medium-term forecasts (two to seven days)may reasonably be expected for the whole worldwithin the next decade. Furthermore, meteorologicaland ERT satelhies will provide even more sophisti-cated tools for observations of weather and cropstatus on a planetary scale; but there is as yet nomeans of correlating the results of this dual seriesof observations for agrometeorological purposes. Indeveloping countries, weather forecasts are seldomdirected toward agriculture owing to a lack of agro-meteorological divisions and agrometeorologists.Moreover, implementation of forecasts at the farmerlevel through adequate extension services poses theproblem of agrometeorological training at all levels.
Besides, agrorneteorology, being the field applica-tion of meteorology to agriculture and thereby de-riving its objectives from the two broad sciences ofmicrometeorology and agricultural ecophysiology, hasa general weakness. The real problem of agrome-teorology is to establish laws of growth and produc-tion in the light of meteorological factors as theyfluctuate in the field during the vegetative. cycle. Thisis a more difficult problem than those encounteredby micrometeorology and ecophysiology, which gen-erally take into consideration short periods of time

with meteorological conditions that are assumed lobe stable or with controlled environments. Thisproblem calls for a specific methodology of investi-gation, such as the study of yields of a given varietygrown on similar soils under various climatic con-di tions.
So far, because of the lack of real agrometeoro-logical investigation programmes, the agrometeoro-logical laws remain little known. Broad knowledgeof ecophysiology and agronomy on the one hand andof meteorology and climatology on the other is oflittle use in agrometeorology, as such knowledgeconsists of the juxtaposition of fragmentary lawswhich are quite separate from agrometeorologicalreality. In this connection the scarcity of specificagrometeorological investigations in the numerouspublications dealing with agricultural ecophysiologyand micrometeorology is noticeable.
The international lack of field agrometeorologists,especially in the tropical and subtropical regions ofthe developing world, is also a major deficiency.Agrometeorologists may come from very diversescientific backgrounds: agronomy or ecology, geog-raphy or meteorology. They are to be found in theagrometeorological divisions of national meteorologi-cal services, in agricultural research institutes, inagricultural services, and in the research divisions ofuniversities.
The precise number of active meteorologiststhroughout the world is not known. However, aninvestigation on the organization of the meteorologi-cal services, carried out by wmo in 1971, gives someinformation on the agrometeorologists employed bysuch agencies. Of an estimated total of 19 000class I ancl II meteorologists working throughout theworld, 620, or nearly 3.5%, are agrometeorologists.In developing countries, of a total of 5 100 class Iand II meteorologists, only 305, or 6%, are agro-meteorologists. In developed countries, of 13 900class I and II meteorologists, only 315, or 2%, areagrometeorologists. These figures indicate that thereare 17 agrometeorologists per 10 million inhabitantsfor developed countries and only 5 per 10 millioninhabitants for developing countries. Southeast Asia,where food problems are most critical, has only oneagrometeorologist for every 20 million inhabitants.
These figures dramatically show the lack of agro-meteorologists, particularly in developing countries,where their action could be the most effective. Thisscarcity can be attributed to the lack of interest ofmany agronomists in agrometeorology, which belongstoo much to the physical sciences. Likewise, meteo-rologists are mainly uninterested in agronomy, whichbelongs too much to the biological sciences. Con-sequently there is a lack of effective collaborationbetween meteorologists and agronomists.
To remedy the scarcity of agrometeorologists, so-
15
lutions for each aspect of the problem must be con-sidered: definition of programmes at national, re-gional, and international levels; appraisal of thepersonnel required to carry out these programmes;training of agrometeorologists by means of specificallytailored courses; and establishment of career schemes,especially in developing countries. In connectionwith this last point, another serious deficiency ofagrometeorology at the institutional level is the lackof coordination at a national level between servicesand institutions with complementary responsibilitiesfor the success of agrometeorology: the meteorologi-cal service, agricultural research, and the agriculturalservice.
The practical value of agrorneteorology lies in itsthree complementary extensive and intensive aspects:(I) the meteorological study of weather and climateon a country-wide basis and the broadcasting of in-formation; (2) research into crop yield/weather re-lations; and (3) its effect on the organization of activi-ties throughout the farming community as a resultof the broadcast information. In many developingcountries the influence of agrometeorology with regardto each of the above aspects is weak or nonexistent;moreover, there is generally a lack of coordinationbetween such activities.
At the meteorological service level the agrometeo-rological divisions or sections are generally eitherweak or nonexistent, and agrometeoroloeical stationsare few and poorly equipped with instruments.
At the agricultural research level the interest ofagronomists is more often oriented toward the rela-tions between crops and soils. Investigations con-cerned with the influence of climatic factors are moreoften directed toward bioclimatology, rather thanagrometeorology, which explains crop yields in ternasof the influence of meteorological factors.
Finally, international coordination at the opera-tional level remains poor. The Interagency Groupon Agricultural Biometeorology in Aid to WorldFood Production, established by the Fifth Congressof wmo in 1967, has the task of coordinating theagrometeorological activities of FAO, wmo, andUnesco; however, because of the lack of adequatefunds, activities are limited to the preparation ofregional agroclimatology surveys.
Surprisingly, in the specialized agencies of theUnited Nations concerned with agricultural meteorol-ogy FAO and wmo --- only three agrometeorologistsare occupied on a permanent basis with the relatedworldwide problems of agrometeorology. The or-ganizational charts do not show any agrometeoro-logical subdivision ranked at a level appropriate tothe importance of the world food problem.
Against this unfortunate background, the WorldAgrometeorological Watch is being conceived, Itwould be a worldwide system of agrometeorological

forecasts and a permanent watch over crop conditionsbased on a network of regional and world centresand a direct application of the forecast-broadcastsystem of the World Weather Watch combined withthe use of ERT satellites. The weather forecastsbroadcast by the world and regional meteorologicalcentres of the www would be analysed systematicallyfrom the agrometeorological point of view by spe-cialized centres, which would then broadcast appro-priate information and emergency warnings tofarmers.
The system would consist of world and regionalcentres. National centres would be based in suitablystrengthened agrometeorological divisions of nationalmeteorological services, thus enabling continuous col-laboration between forecasting agrometeorologists andagronomists belonging lo the agricultural servicesresponsible for the transmission of information tofarmers.
Seven regional centres could be established accord-ing to broad ecological zones: two for the temperatezone of the northern hemisphere (North Americaand Europe); one for South America; one for thesemi-arid climates of north Africa and the Near East;
Agricultural trade 5
Trade in 1973
During 1973 the value of world trade in agricul-tural, fishery, and forest products rose by 43%, ascompared with a 14% increase in 1972. Growth inthe value of agricultural exports accounted for aboutthree fourths of the increase, but earnings from bothfishery and forestry exports also expanded rapidly(by 24% and 39% respectively). The value of worldexports of major agricultural commodities G rose bya record 46%, from US$41 000 million in 1972 toabout US$60 000 million in 1973. This increase wasmore than treble the rate of 1972 and nine times theaverage annual growth during the 1960s.
A large part of the enormous increase in the valueof agricultural trade was the result of exceptionalcommodity prices, as voltune of trade increased byonly about 6%. The United Nations Export PricesIndex for all primary agricultural commodities roseby 48% in 1973, almost four times the rate of in-crease in the previous year. Prices accelerated from
5 For detailed review, see FAO Commodity review and outlook1973-1974, Chapter 1, Rome, 1974.
cl Excluding most processed commodities and wool, hides andskins, for which data were not available at the time of writing.
16
one for intertropical Africa south of the Sahara; onefor the humid region of southeast Asia; and one forthe southwest Pacific. Two world centres could beselected from the regional ones to centralize dataconcerning temperate and tropical agriculture, re-spectively.
Crop forecasts and the regular publication of worldagrometeorological conditions, in close collaborationwith the World Food Programme, would be one ofthe main objectives of the system.
By ensuring a continuous global view of theagrometeorological evolution through the centraliza-tion of information and the broadcasting of emer-gency warnings on a national, regional, and worldscale, the system would, in particular, detect theonset of meteorological disasters and make possiblethe timely launching of any measures required toprotect agriculture and livestock.
This proposed world system of agrometeorologicalforecasting, the central purpose of the World Agrome-teorological Watch, would require complementaryprogrammes of research, training, and aid to thedeveloping countries.
a 9% annual increase rate in the first quarter of1972 to 61'%, in the third quarter of 1973, after whichthere was a slight fall in the rate. For the first timesince 1966, the Index of Agricultural Export Pricesstood far above that for manufactured goods. Therowas a radical change in the rate of improvement inprimary prices in relation to the unit value of manu-factures, despite the fact that the rate of increase inunit value of manufactures also accelerated. (Therise in unit value of manufactures in 1973 wasnearly the same as for the entire decade of the 1950sand somewhat above that of the 1960s, but the rateof acceleration was less than that in primary prices.)However, this comparison between export prices ofagricultural and of manufactured goods takes noaccount of the major changes in prices of oil products.Countries relying heavily on imports of food and oilwere at a serious disadvantage.
Large price increases took place in both food andnonfood agricultural commodities (by 47% and 51%respectively), but prices of temperate zone food prod-ucts rose considerably more (by 50%) than thoseof tropical products (32%). The largest increaseswere in prices of cereals, oilcakes and meals, fatsand oils and agricultural raw materials. Rice, wheat,oilcakes and meals, wool (64's) and sisal more than

doubled in price over 1972. There were increasesof between 70 and 80% for maize and barley, fatsand oils, cocoa, cotton, rubber and wool (46's). Rela-tively much lower price increases occurred for meat,particularly beef (25%). The few commodities notsharing in the extraordinary price increases includedbananas and tea, which remained virtually unchanged,while prices fell for butter, jute and lemons. Anoticeable feature of the 1973 price movements wasthe relatively greater rise for products used in feedinglivestock or as inputs in other activities. For instance,prices of feedgrains and oilcakes and meals rosemuch more than the prices of meat and dairy prod-ucts, with a resulting narrowing in the cost/priceratios of the livestock industry. Prices of agriculturalraw materials, except for jute, also had increases farabove average.
Inflation sharply reduced the increase in the realvalue of agricultural exports in 1973. The UN Indexof Export Unit Values of Manufactures rose by 16%in 1973; using this indicator alone, the real increasein the value of agricultural exports was about 26%.But this particular deflator no longer means verymuch, since trading patterns of most developingcountries have now shifted from a simple exchangeof agricultural commodities and raw materials formanufactured goods to a more complex relationship.The effect of changing currency exchange rates doesnot substantially affect this estimate of a 26% increasein the real value of agricultural exports, as both thevalue of exports and the UN export unit value indexare calculated in U.S. dollars.
Volume of agricultural exports increased by about6% in 1973, or roughly as in 1972, but well abovethe trend of the 1960s. This increase in volume,compared with about a 38% increase in the averageunit value of agricultural exports, indicates clearlythe major impact of price rises in the boom inagricultural trade. There were significant increasesin the volume of exports of coarse grains, particularlymaize, oilcakes, cotton, jute and rubber, while thevolume traded in wheat, rice, fishmeal, mutton andlamb, cocoa and sisal actually fell in 1973.
The exceptional increase in the volume of worldagricultural trade was widely shared, but as in recentyears the major part of the total increase went tothe developed countries. Their gain of 56% above1972 trade increased the developed countries' shareof world agricultural exports to about 64%, comparedwith 61% in 1972 and 59% in 1971. Although thevalue of exports from developing countries rose byabout 36% in 1973, their share of the world totalfell to 29%, compared with 32% in 1972. Similarly,the share of centrally planned countries droppedmarginally lo 7%, although export earnings also in-creased by about 36%. Cereals, oilcakes and meatmade the largest gains for developed countries, but
17
(here were also substantial increases in fats and oils,cotton and wine. A wide range of commodities,including, cereals, coffee, cotton, fats and oils, oil-cakes and meals, sugar and rubber, contributed tothe increase in export earnings from the developingcountries. Availability of supplies for export ap--pears to have been of key importance in the relativeperformance of these two groups of countries. Thecommodity composition of their exports was lessimportant: the developed countries, for example, didwell in cotton and rice, in which the developingcountries enjoy a major share of the world market.Again, the volume of exports from developing coun-tries actually fell for rice, cotton, fats and oils,oilcakes, beef and veal and tobacco, while the devel-oped countries increased their volume of exports ofthese commodities, except for rice and tobacco. Forsugar, however, the volume traded increased fromdeveloping and decreased from developed countries,a reverse situation.
The benefits from the boom in agricultural tradevaried widely by individual countries, depending onthe pattern of exports and supplies available. Thecommodity boom bypassed such products as ba-nanas, citrus fruits, jute and tea, with severe conse-quences for the countries that were heavily dependent011 them such as Sri Lanka (tea) and Bangladesh(jute). The largest gain was made by the UnitedStates, the world's biggest exporter of agriculturalcommodities, whose earnings rose from US$9 400million in 1972 to $17 655 million in 1973, or by88%. This increase in U.S. farm exports wasabout 40% of the total increase in world agriculturaltrade in 1973.
Several factors underlay the dramatic increase inprices and trade values in 1973. Agricultural pro-duction failures in major producing and consumingcountries in 1972 had led to sharp expansion in im-port demand, and in 1973 there were an accelerationof demand and inflationary expectations. Exportablesupplies did not keep pace with the increased importdemand. The reduced output of most agriculturalcommodities in 1972 was largely met by withdrawalsfrom carryover stocks, and this moderated the in-crease in prices. Although world agricultural pro-duction increased by 4% in 1973, the gap betweensupply and demand widened because stocks werealready low; only sharply rising prices could closethis gap. The high level of demand for agric-ulturalcommodities in 1973 largely resulted from excep-tionally high rates of GNP growth in industrializedcountries in that year. All the major industrial coun-tries achieved peak rates of growth simultaneously.In OECD member countries the real rate of growthof GNP averaged 6.6%, the highest rate since 1955.As the greater part of import demand for agriculturalcommodities comes from developed countries, the

impact of their high levels of economic activity oncommodity markets is self-evident. _High rates ofeconomic growth were mainly attributable to ex-pansionary government policies in 1972 and 1973,following the economic slowdown of 1970-71. Withsuch rapid expansion occurring simultaneously in theindustrial countries, imports could only relieve de-mand pressure to a small extent. Price levels cameunder great pressure and the rate of inflation rosesharply. High rates of inflation, together with con-tinuing uncertainty in the international monetary situ-ation, lowered confidence in the value of holdingmoney and encouraged the movement from cashliquidity into commodity markets. Large-scale spec-ulation took place in many commodities, particu-larly cocoa, coffee, cotton, pepper and sugar, and inthe major currencies, as shown by the extraordinaryrise in the market price of gold during the sameperiod. Inflationary expectations also fuelled in-creases in commodity prices. The world energycrisis, which suddenly flared up in October 1973, onlyadded to these difficulties, one of its immediate effectsbeing to introduce a new element of uncertainty inthe outlook for international trade.
Higher export prices and earnings have their coun-terpart in greatly inflated import bills, which haveled to serious balance of payments problems, par-ticularly for developing countries. The cost of theircommercial cereal imports (i.e., excluding food aid)rose from US$3 000 million in [971/72 to US$4 000million in 1972/73 and is estimated at US$9-10 000million in 1973/74. The problem of finding foreignexchange to meet such bills has been made vastlymore difficult by the rise in the cost of oil, fertilizersand freight. The developing countries face probableincreases in their import bill for basic foods thisyear over 1972, comparable to the increase in theiroutlays for oil. Some sixteen countries, accountingfor more than 40% of the developing world's totalfood consumption, have been identified by UNCTADas belonging to the "food trade problem" group,where the increase in the food import bill between1972 and 1974 would be more than 30% of theirgross earnings. These sixteen countries would haveto spend more than 50% of their gross export earn-ings at the 1972 level to pay for the costlier foodimports in 1974 if their food production does notincrease. However, total export earnings of thesecountries are likely to rise, thus easing somewhat theproblem of buying food at high prices. Even so,some developing countries, particularly the heavilypopulated countries in south Asia and the least devel-oped countries, face serious problems in paying fortheir food imports.
The sixth Special Session of the United NationsGeneral Assembly requested that the Secretary-General "launch an emergency operation to pro-
18
vide timely relief to the most seriously affected de-veloping countries with the aim of maintaining un-impaired essential imports for the duration of thecoming 12 months." Industrial countries and otherpotential contributors were invited to announce theircontributions to the Emergency Operation by 15 June.Relief and assistance measures by contributing coun-tries are to be provided to the maximum possibleextent on a grant basis and, where this is not pos-sible, on soft terms, either bilaterally or multilaterally.The General Assembly also decided to establish aspecial fund under United Nations auspices for emer-gency relief and development assistance, to beginoperations by 1 January 1975 at the latest. Studiesof the needs of the most seriously affected countrieswere also begun, and have subsequently been esti-mated at US$4 600 million for the years 1974 and1975.
A target of US$3-4 000 million has been set forthe Emergency Operation over a 12-month period.Commitments of $2 400 million for bilateral andmultilateral emergency assistance were announcedat the second meeting of contributors and potentialcontributors held on 27 September; however, this sumdid not include the $500 million in conditional com-mitments by the EEC and the additional food aidannounced by President Ford of the United Stateson 18 September. Subsequently, on 3 October, theEEC Council of Ministers agreed to an initial alloca-cation of $150 million, of which $30 million are togo to the emergency fund and the remaining $120million are to be granted directly to such countriesas Bangladesh, Sri Lanka and several smaller Africannations. Of the total sum of about $2 400 millionpledged by 27 September, $1 825 million representedpledges by oil-exporting countries, $373 million bythe industrial countries, $80 million by the ArabFund for Economic and Social Development, and$100 million prospective assistance by the WorldBank. The concessions included in commitments byoil-exporting countries were more than $450 millionand by industrial countries more than $300 million.'
Trade outlook for 1974/75
It is more difficult than usual to judge the outlookfor world agricultural commodity markets for 1974/1975 as economic growth prospects are uncertain.There are, however, certain broad tendencies whichwill influence the situation in the short run. It isalmost certain that 1974 will have been a year of lowrates of economic growth in the industrialized coun-
7 These amounts committed are from Note No. 3876, 27 Sep-tember 1974, issued by the Press Section of the United Nations.

tries. After the decline in real output in OECD coun-tries in the first half of 1974, a moderate recovery of3 to 31/2,% is forecast over the succeeding twelvemonths. The decline in total OECD output in thefirst six months of 1974 was largely caused by themarked fall in output in the United States, Japanand the United Kingdom, and the recovery expectedfor the second half of the year reflects to a greatextent the reversal of these exceptional fluctuations.Inflation has recently further accelerated and is nowrunning at an unprecedented and alarming rate.
A continuation of inflation at such very highrates is likely as the price rises for oil and othercommodities continue to permeate industrialized econ-omies. The sudden swing in the balance of paymentsof oEcn countries will give them a total deficit of asmuch as $40 000 million in 1974. The distribution ofthe total deficit among countries is very lopsided.Although some progress toward redistributing thedeficit among countries can be expected by the firsthalf of 1975, this is a problem which cannot besolved quickly. A series of national competitive re-actions of a trade-restricting, or deflationary, kindcould markedly increase the risk of world recessionwithout, in all probability, having much effect onredistributing the deficits.
Current account deficits will prove acceptable onlyif they can be financed. So far the strains connectedwith financing have been limited, but the problem is acumulative one. To date much of the oil moneyhas gone into very short-term money market instru-ments, whereas the demand for funds by countriesneeding to finance current account deficits is relativelylong term, thus posing a problem of intermediation.Though changes in the structure of interest rates mayhelp somewhat in solving the problems, official re-cycling arrangements are also desirable as a safetynet. Special financing arrangements may be neededon short notice for some of the harder-hit poorcountries.
Failure to finance the deficits could have wide-spread repercussions, not only in its likely effects onpolicy action. There is an implicit assumption inthe OECD and other forecasts that confidence factorswill be reasonably favourable. If confidence amongconsumers and investors were to collapse because ofdifficulties arising from national or international mon-etary developments, cumulative contractional forceswhich would be difficult to arrest could be set loose.
'f he cumulative effects of government policies orbusiness decisions moving simultaneously in the samedirection in many countries can easily be under-estimated. This was indeed the case in the generalboom of 1972/73. It is essential that excessive andmutually reinforcing impulses, either deflationary orinflationary, be avoided in the coming year. It istherefore of the greatest importance that governments
19
consult closely aud frequently about developmentsin one another's countries.
Against this uncertain background the demand foragricultural commodities in 1974 is likely to havegrown only moderately, much less than in the lasttwo years. Purchases by the U.S.S.R. and China haverecently been a major factor in the buoyancy of worldimport demand, but preliminary indications suggestthat the U.S.S.R., at least, has not entered worldmarkets on a similar scale in 1974. Speculative in-terest in agricultural commodities has probably de-creased with the increasing cost of financing theseactivities. Interest rates in most industrialized coun-tries rose sharply in 1973 and reached record levelsin the first quarter of 1974, thus raising the costs ofspeculative holdings. A positive demand factorduring 1974/75 is likely lo be the replenishment ofnormal working stocks, but restocking will be limiteduntil prices have moderated, although some stock-building for strategic and security purposes may occureven at the current high level of prices.
Since mid-1974 the prices of some agriculturalcommodities have moved downward from the un-usually high peak levels reached by the end of 1973and in the early months of 1974. But the extent ofthe decline has been generally modest and has variedbetween commodities. For some commodities thedownward movement of prices continued steadilysince the beginning of the year because of eitherslackening demand or improvement in prospects ofsupplies, even though the level of prices has remainedhigher than in 1973. Agricultural raw materials inparticular, except those for which supply difficultiesare acule, have experienced a decline in demand dueto the slowdown of economic activity in mostcountries. With prospects of larger output the pricesof tropical beverage commodities such as coffee andtea have also gradually gone down, causing concernamong exporting countries, which are faced withheavy import costs of food, fertilizer, and fuel.
However, for some major food and feed commodi-ties, coarse grains and sugar in particular, priceshave further increased, even beyond the peak levelsreached earlier, as a result of crop prospects in recentmonths having become unfavourable, with reports ofadverse weather and natural calamities in severalmajor producing and consuming countries. Conse-quently, the outlook for overall world food suppliesin 1974/75 has worsened. The improvement insupplies and carryover stocks of principal food com-modities hoped for at mid-1974 is now not likely tomaterialize.
In general, prices have not advanced much beyondthe peaks touched earlier in 1974. The United Na-tions Export Prices Index for all primary commoditieshad shown a continuing acceleration in prices fromthe first quarter of 1972; but from the first to the

second quarter of 1974, as the rate of increase ofprices declined, the index increased by only 1%.
The most striking divergence in price movementsn the latter part of 1974 has occurred between feed-
grains, prices of which have risen sharply, and meat,especially beef, prices of which have fallen withincreases of domestic supplies in nearly all majorbeef-importing countries; this decline is not, how-ever, reflected as yet in retail prices. The divergenceis all the more striking in the context of the dete-rioration in the world food situation: while prices ofcereals have remained high and beyond the reachof many poor people, livestock products, mainly con-sumed by the rich, have become relatively cheaper.This divergence is also ominous inasmuch as low re-turns to livestock producers, owing to low meat pricesand high feed costs, could discourage production.
Despite the modest decline in prices and a relativeimprovement in market supplies of some commodi-ties, the overall outlook is that world commodity
Stocks of agrie ltural products
The recent disappearance of surplus grain stocks,the tight supply/demand situation and the dramaticchanges in world grain prices in the last two yearshave led many governments, in both importing andexporting countries, to reassess their national grainpolicies. Many importing countries, concerned aboutthe availability and import costs of basic foods, arereconsidering their production and stockpiling poli-cies, while governments in several of the majorexporting countries are giving farmers incentives forincreasing their wheat production to a level thatwill allow some replenishment of stocks. While ex-panding production in response to these incentivesand to record world market prices, farmers are con-cerned about the possible effect on export prices ifworld grain (particularly wheat) production shouldexpand beyond immediate consumption requirementsin 1974/75. Producers and consumers, exporters andimporters, are in basic agreement that long-lasting,large-scale instability in world supplies and priceswould be detrimental to all. Unremunerative pro-ducer prices in times of glut pose the threat ofunderproduction in the future, and periodic shortagesand high prices cause hardship to consumers andalso increase pressures for greater self-sufficiency incountries where production costs are comparativelyhigh.
There exists however the danger that uncoordi-nated national action on production and stock policiescould introduce a new element of instability into
20
tnarkets in 1974/75 will remain under the shadow ofshortages and severe instability due to the inadequacyof carryover stocks and the uncertainties of outputand import demand in the coming months. For com-modities of which markets are currently oversupplied,greater instability ---- steep increases in costs, togetherwith shortages of inputs and deficiency of demand ----may lead to adverse repercussions on output in thecoming year. For the other commodities with limitedpossibilities of a further drawing down of carryoverstocks, exportable supplies in 1974/75 will be criti-cally dependent on 1974 crops, which for some majorfood and feed products are likely to be below theharvests of 1973. Even though a slackening in thepressure of demand due to reduced levels of eco-nomic activity may ease the extent of shortagessomewhat as compared with those experienced in1973, the inadequacy of supplies, especially of grainsand sugar, is likely to be severe; if so, markets willremain highly unstable.
world markets and encourage uneconomic productionto the detriment of consumers and efficient producersalike. National stock policies could, however, makea substantial contribution to world food security,if they were undertaken in consultation with othercountries on the basis of the fullest possible infor-mation and understanding of policy actions, inten-tions, and requirements elsewhere, and if they re-spected certain guidelines and safeguards, to ensurethat food security stocks would not depress pricesor in any other way endanger the necessary long-term world production growth.
It is in this context that the Director-General ofrAo proposed international action to coordinate stockpolicies. The FAO Conference in 1973 endorsed hisinitiative in drawing up proposals for a world foodsecurity policy. It also examined a draft InternationalUndertaking on World Food Security and requestedthat the Director-General convene a special workinggroup, open to all governments substantially inter-ested in cereals production, consumption, and trade,to revise it. In accordance with this request an adhoc Working Party on World Food Security metin May 1974 at FAO headquarters, Rome, to preparea revised text for consideration by the Committee onCommodity Problems (ccr) and the Council and foradoption by governments. While preparing a revisedundertaking, the group observed that a number ofunresolved problems relating to stockpiling policiesrequired further study; at the same time it agreed,

however, that international action on world food se-curity is urgently needed.
Opening stocks of wheat in the main exportingcountries (Argentina, Australia, Canada, EEC, and theU.S.A.) fell by more than 20 million tons in 1973and are estimated to have dropped by an additional3 million tons in 1974. By the opening of the 1974/1975 season, wheat stocks, at 24 million tons, werethe lowest since 1951/52 and represented barely amonth of world consumption. Stocks of wheat in-nporting countries were also reported to be abnor-
mally small. A replenishment of worli wheat stocksappears unlikely to occur in the near future. The fallin the stocks of coarse grains of the major exporters(Argentina, Australia, Callada, and the U.S.A.) was15 million tons in 1972/73, and a further dropof roughly 11 million tons to a level of only28 million tons was estimated for the 1973/74 season.The much smaller stocks of the major exporters ofrice (Pakistan, the U.S.A., and Japan; no recent in-formation on Thailand's stocks is available) fell fromapproximately 6 million tons in 1972 to about 4 mil-lion tons at the opening of 1973.
Stocks of most other storable agricultural com-modities were substantially reduced in 1973. Butterstocks, in particular, fell considerably in western Eu-rope as a combined result of the levelling off of milkoutput, measures to stimulate domestic consumption,and large exports (at heavily subsidized prices) to theU.S.S.R. EEC butter stocks were about 290 000 tonson 1 December 1973, about one third less than ayear earlier. However, stocks of skim milk powderincreased in the EEC, as exportation was curbed inorder to safeguard domestic supplies of proteinfoodstuffs.
Stocks of sugar on 1 September 1974 declinedfurther from the already low levels reached theprevious year, having fallen to 15.7 million tons, thelowest level since 1965. Stocks of other commoditiessuch as cocoa and tea were sharply reduced, whilethose of coffee levelled off during 1972 and 1973,but probably declined in 1974.s
While the stock levels of most agricultural com-modities decreased considerably in absolute terms in1973/74, their decline in relation to annual outputwas even more marked; this was especially true ofcereals (Table 1-7).
The world's cereal stocks (excluding China andthe U.S.S.R.) are forecast to fall to less than 100million tons by the end of the 1974/75 season(30 'June). This amount would be sharply belowminimum levels for world food sccurity, some 16million tons below the previous year's total and lessthan half the 1970 reserves. Stocks of 100 million
Stocks of selected agricultural commodities are given inAnnex table 10.
21
TABLE 1-7.-- STOCKS OF CEREALS AND DAIRY PRODUCTS IN SELECTEDCOUNTRIES i AS PERCENT OF WORLD PRODUCTION,
1961-65, 1972 AND 1973
Wheat: Argent'na, Australia, Canada, EEC, United States.Coarse grains: Argentina, Australia, Canada, South Africa,
United States.Rice: Japan, Pakistan, Thailand.Butter: 15 selected countries.Skim milk powder: 10 selected countries.
tons would represent only 11% of consumption ascompared with an estimated "safe" minimum ratioof about 17-18% for assuring world food security(Table 1-8).
TABLE 1-8. -- WORLD CEREAL STOCKS, 1970-75 2
Crop year beginning in:
Million n etric tons
SouRcE: FAO (prel'minary estimates compiled from official andunofficial sources).
Excluding China and thc U.S.S.R. 2 Stocks at the openingof the countries' respective crop seasons. 3 Argentina, Canada,EEc and the United States. 4 Argentina, Australia, Canada,South Africa and the United States.
Commodity
1961-65 1972 1973
Stock level aspercent of
average worldproduction
in the sameperiod
Stock level aspercent of
average worldproductionduring the
period1970-72
Stock level aspercent of
average worldproductionduring the
period1971-73
All cereals . .
WheatCoarse grains .
Rice (paddy) .
ButterSkim milk powder
11
1913
1
9
68739
14
2
5
5
1
214
65 50 49 27 24 20
9 11 13 10 8 7
13 11 12 11 10 9
87 72 74 48 42 36
25 24 21 13 14 13
54 39 54 39 28 20
12 11 12 12 12 11
23 21 22 20 18 18
89 71 88 71 58 49
201 167 183 132 114 98
26 19 22 14 13 11
1974 19751970 1971 1972 1973 (esti- (fore-
mated) cast)
VVHEAT
Main exportingcountries3 . .
Main importingcountries . .
Others
Total
RICE
Total
COARSE GRAINS
Main exportingcountries
Main importingcountries . .
Others
Total
Total cereal stocks
As percent of con-sumption . . .

Consumer food prices
Sharply rising world food prices (Table 1-9) havebeen a major factor in the high rates of price inflationsince 1973 in most developed and developing coun-tries. Food prices generally rose faster than otherprices in 1973, but by about mid-1974 they werefalling behind other prices, and this trend has con-tinued. During 1973 and the first half of 1974many food commodities were strongly affected bythe price boom. Of these, wheat, maize, cocoa, sugar,edible fats and oils showed particularly sharp priceincreases on the world market, seriously affecting thebalance of payments situation in numerous import-dependent countries. Although the rate of price ac-celeration has recently slowed down, there are fewindications as yet that the upward trend will be re-versed or that food prices will return again to theirformer levels. In all countries affected, rising foodprices have inevitably hardest hit the poorest people,particularly those of the developing countries, wherethe margin for coping with higher prices and foodshortages is most limited.
Consumer prices in the OECD area rose on theaverage by over 14% in the twelve months prior toSeptember 1974. After a relative slowdown in thesummer months, the average increase for the area asa whole accelerated again. Although the differentimpact of energy price rises and seasonal movementsin food prices somewhat obscured the global picture,the divergence in underlying national inflation ratesbecame increasingly confirmed. Two groups of coun-tries emerged clearly. In one group, including Aus-tria, the Federal Republic of Germany, the Nether-lands, Norway, Sweden and Switzerland, the rateof inflation was significantly below the OECD average.At the other extreme, countries such as Australia,Belgium, Italy and Japan continued to experienceabove-average rates of inflation. Experiences in mostother OECD countries were rather erratic, reflectingpartly the timing of changes in government-controlledprices, indirect taxes and differing behaviour of foodprices.
During 1974, food price increases have remainedhigh, reflecting tight stock positions, uncertaintyabout some major food crops and, in some coun-tries, revision of government price control policies.Rising food prices are still a major component ofthe general inflationary process, having accountedin 1973 for about half the inflation in westernEurope and the United States. Little informationis available about food prices in eastern Europe andthe U.S.S.R., but official figures suggest, in general,a fairly stable price front.
In developing countries, also, the price situationhas deteriorated sharply. The most severe price in-
22
creases were recorded in the countries with a traditionof heavy inflation in Latin America and the Far East,Chile and the Khmer Republic representing the ex-treme examples. in the year ending September 1974several countries recorded increases of from 50%to more than 100% (Argentina, Uruguay, Bangladesh,the Republic of Viet-Nam), while rates of 30 to 50%
TABLE 1-9. CHANGES IN CONSUMER FOOD PRICES
SOURCE: Annex table 11.
were far from exceptional. Densely populated coun-tries such as India, Indonesia, Pakistan and westernMalaysia have suffered heavily from rising costs ofliving, particularly food prices. Inflation was, ingeneral, comparatively moderate in Africa (5 to25%), except for Ivory Coast, the Sudan and Zaire,where food prices rose by 30 to 50%.
Despite some apprehension concerning the 1974/1975 crop outlook, a slight easing in the commoditymarket situation is expected; however, this marketimprovement is likely to be offset by the increasinglydangerous wage/price spiral. The normal inflationaryprocess arising from stronger economic activity andbetter wages has been aggravated by monetary in-stability and a number of factors generally relatedto the adoption of indiscriminate expansionary poli-cies in many countries. The recent energy crisis,with the quadrupling of oil prices late in 1973 andearly in 1974, has been a major element in the steepcosts of transport, machinery and a wide range ofpetrochemical components of agricultural inputs. Ithas contributed to a deterioration in the terms oftrade for manufactured goods, thus affecting domesticprices of food in most developed countries which arefood importers, particularly Japan and the UnitedKingdom. Many food-importing countries in the de-veloping world also suffered from the higher inter-
1970-71 ro 1972-73
Price increase 1970/71 1971/72 1972/73
Percent Number of countries
DEVELOPED COUNTRIES (25)0-5 11 5 --5-10 11 17 9
10-15 2 1 815 and above 1 2 8
DEVELOPING COUNTRIES (29)0-5 14 7 3
5-10 6 10 7
10-15 2 6 415 and above 7 6 15

national prices of foodstuffs, to an extent which de-pended on their degree of self-sufficiency. Large im-porters such as India, Nigeria, Sri Lanka and Tan-zania are in this category, as is Bangladesh, whichhad to import large quantities of high-priced cerealsafter independence had been achieved. Furthermore,food-exporting countries in Latin America, suchas Argentina, Brazil and Colombia, also reportedbooming food prices, demonstrating the prevalence ofchronic inflationary tendencies in this part of theworld.
Government policy measures have generally beenunable to prevent acceleration of the inflationary pro-cess. Fiscal and monetary restrictions have oftenresulted in a fall in the rate of economic growthwithout any real effect on prices. The need for co-ordinated action at the international level has beenrecognized among OECD countries, particularly withinthe EEC, but the results of such efforts have beendisappointing; for instance, the 1973 target price in-crease of 4% set by the EEC Council of Ministers hasproved to be totally unrealistic.
To curb increases in food prices, a larger numberof countries adopted intervention policies, such assubsidies and price control measures. France intro-duced a system of guidelines on incomes and pricescombined with a compulsory review procedure forprices. In the Netherlands, advance notification of
The flow of aid
The flow of financial aid to developing countriesremains well below Second United Nations Develop-ment Decade and other targets. Total official andprivate financial flows from the seventeen-countryDevelopment Assistance Committee (nAc) of theoEcu which in 1973 provided about 95% of suchassistance increased from US$9 200 million in 1961to $19 860 million in 1972 and to $24 150 million in1973.0 Allowing for inflation and currency changes,however, the real increase has been only 6%. Officialaid rose from $8 670 million in 1972 to $9 415 mil-
0 Only small amounts of Eurocurrency borrowing by devel-oping countries are included in these totals. In 1973 their Euro-currency borrowing may have reached some USS9 000 million(gross), compared with $5 000 million (gross) in 1972. While nofigures are available for individual countries, it is known thatmac members accounted for a major part of these funds. Thusthe total net flow of financial resources to developing countriesincreased substantially in 1973. The target of 1% of GNPrecommended by the United Nations and accepted by all DACmembers would probably have been reached and possibly ex-ceeded in 1973 if all lending were included.
23
price increases is required. Under the new anti-inflationary programme for 1974, the Spanish Gov-ernment has set up a system of price surveillance. InSweden, a law passed in July 1973 gives the Gov-ernment power to freeze prices and to require notifi-cation of price increases. Price control of basic fooditems has also been adopted, in varying degrees, incountries such as Ireland, Italy, Luxembourg, NewZealand and Sweden.
The Federal Republic of Germany and Japan areamong the few countries with government regulatoryaction that does not include direct price control;another is Australia, where in December 1973 theelectorate rejected a referendum vesting the Gov-ernment with powers of price control. Some coun-tries for example, Canada, Denmark, Sweden andthe United Kingdom have created special sub-sidiary funds intended to protect consumers againstrising prices. Many developing countries have alsointroduced price control measures. Such policy mea-sures have been relatively successful in a numberof countries; but, clearly, they tend to mitigate theeffects rather than to eliminate the causes of foodprice increases. Moreover, they are generally onerousto the governments, difficult lo implement and oftena cause of serious market disturbances. There is noquick or easy solution to high and rising consumerfood prices.
Developnaent assistance
lion in 1973 (Table 1-10), a record level, but fell inreal terms by about 6%. The level of aid is alsodwarfed by the recent increases in the oil importbills of both recipient and donor countries. In 1973the flow of official aid as a percentage of the collectiveGNP of DAC countries declined marginally to 0.30%,less than half of the 1975 target of 0.7%." (See Fig-ure 1-2 for the DAC countries' individual perfor-mances.)
Only approximate data are available on the amountof total development assistance going to agriculture(see Table 1-11), although efforts are being made toimprove the available information. It may be roughlyestimated however that in 1970/72 the commitmentof DAC and multilateral assistance to agriculture (ex-cluding food aid and the technical assistance com-
10 nAc members have taken various positions with regard tothis target. Four (the Netherlands, Belgium, Sweden and Norway)have accepted it without reservation; eight (Australia, Denmark,France, Canada, the Federal Republic of Germany, Japan, NewZealand and the United Kingdom) have accepted a date after1975; and five have not subscribed to it at all.

CABLE -- INgT FLOW OE FINANCIAL RESOURCES 1 FRON4 DAC,COUNTRIES, 1969-73
OFFICIAL DEVELOPMENT AS-SISTANCE3
Bilateral grants . .
Bilateral developmentloans on concessionalterms
Contributions to multilat-eral institutions . . .
TOTAL ABOVE . .
OTFIER OFFICIAL FLOWS
BilateralMultilateral
TOTAL ABOVE
PRIVATE FLOWS
Direct investment . .
Bilateral portfolio . .
Multilateral portfolio .
Export credits . . .
TOTAL ABOVE .
GRANTS BY PRIVATEVOLUNTARY AGENCIES
Total official and priva
1969 1970 1971 1972 1973 2
3 251 3 323 3 634 4 370 4 482
2 320 2384 2 786 2 396 2 684
1 050 1 124 1 339 1 904 2 249
6 621 6 832 7 759 8 670 9 415
586 879 1 004 1 204 2 11915 273 267 375 400
571 1 152 1 271 1 579 2 519
TOTAL OFFICIAL FLOWS 7 192 7 984 9 030 10 249 11 934
2 919 3 563 3 874 4 411 5 8671 201 726 760 2 067 3 167
419 474 771 667 2592 047 2 185 2 810 1 430 1 575
6 586 6 949 8 215 8 575 10 868
858 913 1 033 1 348
3 778 41 5 791 41 8 158 ,19 857 '24 150
SOURCE: Organisation fot Economic Co-operation and Devel-opment.
1 Data refer to gross disbursements minus amortization receiptson earlier lending. 2 Preliminary. 3 Flows which arc in-tended primarily to promote the cconomic development andwelfare of developing countries, and which are intended lo beconcessional in character. 4 Including grants by private volun-tary agencies.
ponent of DAC bilateral aid) ran to approximately$1 000 million a year. In 1973 these commitmentsrose sharply to about $1 500 million, almost entirelybecause of an increase in World Bank/InternationalDevelopment Association commitments from $436million in 1971/72 to $938 million in 1972/73.
There was a slight decline in the share of grantsin official development assistance (oun) (includinggrants to multilateral agencies), which slipped fromthe record level of 72 % in 1972 to 71 °/ in 1973.Bilateral grants increased by only 2.6% in nominalterms and fell to less than half the total outflow ofODA; their relative stagnation was due mainly tolower expenditures on bilateral food and programmeaid.
As for the other main components of ODA, con-tributions to multilateral agencies (24% of ODA in1973) rose in nominal terms by 18%, an increase of3% in real terms. Bilateral loans roughly maintainedtheir share of 28% in total ODA.
24
FIGURE 1-2. -- OFFICIAL DEVELOPMENT ASSISTANCE OF DACNIEMBER COUNTRIES IN RELATION TO GROSS NATIONAL
PRODUCT, 1973
V
/0"/770,./e47/1/../f/M
SWITZERLAND
ITALY
AUSTRIA
APAN
Percent of GNP
CANA DA
UNITED IONGDOM
GERMANY
NEW ZEALAND
UNITED' STATES
FRANCE
SWEDEN
NETHERLANDS
BELGIUM
DENMARIC
NORWAY
AUSTRALIA
Bilateral
SOURCE: The OECD Observer, 71, August 1974, Paris.
Terms of assistance
The terms of official development assistance (am),which have been improving over recent years, con-tinued to do so in 1973, as the grant element increasedto 87% from 84% in 1972 (the share of grants innew commitments rose and loan terms softened). Themain provision of the Recommendations on Termqand Conditions of Aid adopted by DAC in 1972 isthat members should exert their best efforts to reachand maintain an average grant element of at least84% in their ODA programmes. In 1973, thirteen ofthe seventeen DAC countries complied with this generalterms objective. Of these thirteen, eight raised theirgrant element above the levels of 1972: Denmark,France, the Federal Republic of Germany, the Neth-erlands, New Zealand, Sweden, the United Kingdomand the United States. Australia, Belgium, Canadaand Norway roughly maintained the already highconcessional levels of their ODA programmes. Swit-zerland's commitments were considered too low tomeet the terms target. Of the remaining four coun-
PORTUGAL
Multilateral
Million U.S. dollars 0.10 0.20 0.30 0.40 0.50 0.60 0.70 0.80 0.90

tries, japan, whose End programme is relatively recent,raised its ODA grant element from 61 to 68%;Italy softened the terms of its small programme; andinformation for Austria and Portugal is incomplete.
No information is published by the centrally plan-ned economies on the terms of their official aid.
Repayment burden
The publicly guaranteed debt of the developingcountries has continued to increase rapidly in recentyears. Analysis by the World Bank " indicates thatby the end of 1972 the total debts of eighty-six de-veloping countries had nearly doubled over 1967.Bilateral debts accounted for half the total, comparedwit-h 55% in 1967, while the share of private debtsincreased from 27 to 31%. Total debt servicepayments (amortization plus interest) rose to nearly20% in 1972 from 17% in 1971 and 13% in 1970.The gradual hardening of the composition of flowsto the developing countries and the expiration ofgrace periods on concessional loans of the early1960s are the main causes for this deterioration indebt position. The ratio of debt service to foreignexchange earnings, although by itself only a roughindicator of the seriousness of a country's debt prob-lem, has been rising persistently and in 1972 averagedaround 10%; for some countries, including Argen-tina, Egypt-, India and Pakistan, it exceeds 20%.
The World Bank Group and the financing of agriculture
Another considerable expansion took place during1973/74 in the financial and technical operations ofthe World Bank Group. The Group as a wholeapproved lendings and commitments amounting toUSS4 517 million, a 21% increase over the previousyear's total. Of this, the World Bank accounted for$3 218 million, its soft-loan affiliate, the InternationalDevelopment Association (IDA), for $1 095 million,and the International Finance Corporation (iFc) for$203 million. The resources available to IDA for soft-term development projects, including those providedby the third replenishment, were almost totally com-mitted by mid-1974. Also, the amount of IDA loansand credits in 1973/74 was 19% smaller than in 1972/1973. A fourth replenishment of resources, agreedupon in September 1973, is expected lo provide IDAwith an additional $4 500 million for fiscal years1975-77. Agriculture gets proportionally more sup-port from IDA credits than from World Bank loans.
The World Bank Group attaches particular im-portance to the agricultural sector as a primary sourceof food, export earnings and government revenues in
11 See International Bank for Reconstruction and Development,Annual Report, World Bank and IDA, 1974, p. 84, Washington,D.C.
25
TA liLE I-11 - REGIONAL DEVELOPMENT BANK LOANS TO TI-IRAGRICULTURAL SECTOR
SOURCE: FAO, InVeStMeni Ceo tre .1 One unit of account (un) = 1 prcdevaluation U.S. dollar.
developing countries (Figure 1-3). Therefore a largeand increasing share of total World Bank Grouploans is being channelled toward agriculture. Oftotal World Bank loans and IDA credits approved in1973/74, 22% went to agriculture as compared withabout 10% in the early 1960s. However, IDA soft-term credits to agriculture declined by $127 million toa total of $309 million in 1973/74. The Bank Groupis expected to continue playing an important rolein external funding for agriculture, particularly byhelping small farmers improve their productivity andby supporting land reform efforts in developing coun-tries. Substantial assistance is also being given toagricultural research, as the Bank, together with FAOand UNDP, is a sponsor of the Consultative Group onInternational Agricultural Research.
Regional development banks and new sources of aid
The loan and credit operations of regional develop-ment banks expanded considerably in the period1973/74, and a number of new development and relieffunds, operating on a regional basis, were createdpartly as a consequence of the energy crisis. Loansfrom regional banks to agriculture continue to in-crease (Table (1-11).
Total loans approved by the Asian DevelopmentBank rose to a record US$421 million in 1973 ascompared with $316 million in 1972. During thesame period the number of loan projects increasedfrom thirty lo thirty-nine. Loans to agriculture in1973 were the largest since loan operations startedin 1968, amounting to $47 million, sorne 45% above1972. The Bank's ability to meet the needs of itsdeveloping member countries has been considerablyenlarged by the Asian Development Fund, createdin 1973 to finance the Bank's concessional loans.
Asian Develop-ment Bank
Inter-AmericanDevelopment
Bank
African Devel-opment Bank
Million U.S. dolíais ... Million unitsof account
1961 44.61962 71.01963 99.91964 53.21965 32.81965 104.61967 143.61963 2.0 83.1 2.81969 27.3 202.91970 35.3 216.51971 27.3 115.3 1.51972 32.8 130.4 6.11973 47.3 182.2 9.2

FIGURE 1-3. WORLD BANK LENDING FOR AGRICULTURE BYFISCAL YEAR, 1964-74
I; SS
0 100 200 300 400 500 600 700 BOO 900 1000
1971
rj 1970
og 1969za,
1968te,
1966
1964
SOURCE: World Bank.
Contributions to the Fund by developed membercountries are to be made available lo the Bank undera two-stage programme. During the first stage anaggregate amount of $350 million was to be com-mitted by June 1974; commitments to the secondstage, to total $175 million, are expected by June1975 or at any later date determined by the board ofdirectors.
Following the measures increasing the authorizedcapital of the Inter-American Development Bank(um), the number of loans approved in 1973 roseto fifty-seven, and a new record was achieved inlending operations, which amounted to $884 million.The IDB Fund for Special Operations (Fso), whichfinances most of the Bank's agricultural loans, alsoincreased its disbursements to $312 million in 1973.IDB'S agricultural loans, which account for nearly onequarter of its total loan authorizations, totalled $182million in 1973. The Central American Bank forEconomic Integration (cm:IF° had granted more thanfive hundred loans amounting to CA$108.8 millionby mid-1973, of which CA$2.6 million liad been dis-bursed for agriculture. Although these amounts re-main relatively modest, CABEI'S credit operations areexpected to triple between 1973 and 1980 according
4.M,..tc.;,"; '4;17glee,Sfjte,
Ft.*/
74,.1
1967 Loans foragriculture
Excludingagricultureeducationi.;
Loans for projectsidentified/Preparedby the FAO/WorldBank Cooperative
1965 Programme
to the development plan drawn up for this period.The Caribbean Development Bank and the AndeanDevelopment Corporation are other relatively newinstitutions which have already provided substantialcontributions to development in their respective areasof operation. The Andean Development Corporationhas an authorized capital of US$100 million, of which$25 million are being expended in 1974.
Loans approved by the African Development Bankin 1973 increased sharply to 35.75 million units ofaccount (1 UA = 1 predevaluation U.S. dollar), about40% above 1972. Agriculture's share, which wasabout 15% in the period 1967-72, rose to about. 9million un in 1973, or nearly 25% of the total. How-ever, the Bank's activities still remain far from ade-quate in view of the large development needs of theregion. The newly established African DevelopmentFund is an encouraging step toward broadening theBank's activities. African countries are also servedby the European Development Fund (EDF), the maininstrument of financial and technical cooperation be-tween the European Economic Community and theassociated countries and territories. The EuropeanInvestment Bank (Fts) supplements EDE activities withloans on normal terms. During the period coveredby the Second Yaoundé Convention (1969-75), thecombined total of EDF resources and EIB loans willamount to i million UA. Other financial resourcesfor Africa are being made available through theAfrican Development Fund and the Special ReliefFund, both of which were in operation by mid-1973.
High prices of oil, fertilizers and food imports haveconsiderably worsened the balance of payments of alarge number of developing countries and have createdthe need for new, expanded forms of internationalaid. In view of this situation, a number of construc-tive efforts are being undertaken at the national andinternational level to help overcome the financial prob-lems of the countries hit by the crisis. Internationalorganizations such as the World Bank, the Interna-tional Monetary Fund (ImF), and various UnitedNations agencies are taking positive action to provideand coordinate supplementary aid resources.
At the sixth Special Session of the United NationsGeneral Assembly, an Emergency Operation wascreated to provide bilateral or multilateral assistanceon a grant basis or on soft terms (see p. 18). As ofOctober 1974, US$29 million had been allocated underthe Emergency Operation to ten countries in southAsia and Africa, including $14 million to Bangladeshand India. The General Assembly also approved theestablishment, by January 1975, of a special fund,which should serve as central monitor for bilateraland multilateral assistance and, in general, as a focalpoint for emergency relief and development assistanceto the countries most seriously affected by the crisis.The IMF focused on the possibility of coordinating
1974
1973
1972

the transfer of surplus oil revenues from oil-exportingcountries to those facing balance of payments diffi-culties. The IMF "Oil Facility," created in June 1974,provides a means of payment in the form of specialdrawing rights (son) to all member countries withbalance of payments problems caused by high oilprices. The initial contributions to the Oil Facility,provided by seven oil-producing countries amountedto US$3 400 million. As of October 1974, purchaseshad been made by eighteen countries and alreadyamounted to SDR 526 million; however, Italy, a de-veloped member country, accounted for a major partof these purchases. The World Bank has also signeda number of investment agreements with oil-exportingcountries for concessional loans.
At the national level, substantial new forms ofbilateral aid are being provided by oil-producingstates, which are building up large surpluses fromhigh oil prices. Assistance from Arab states SaudiArabia, the Libyan Arab Republic and the UnitedArab Emirates is being provided mainly throughdevelopment banks and emergency funds. Financialassistance is directed particularly to poorer Arab andfriendly African and Asian countries, through theKuwait, Abu Dhabi and Saudi Arabia funds forArab economic development. By the beginning of1973, commitments amounted to US$309 million andgrants to $23 million. The Arab Fund for Economicand Social Development, created in 1972, approvedthree concessional loans totalling US$22 million in1973.
The Arab oil producing and exporting countries(opEc) established a US$200 million fund in August1974 to help certain African countries (Ethiopia,Morocco, the Sudan, Tanzania, Uganda, Zaire andZambia) meet higher oil costs. The fund will be ad-ministered by the African Development Bank. Thechoice of countries was influenced by such factors asdrought conditions, the state of being landlocked andthe individual country's balance of payments position.
Food aid
Between 1963 and 1972 mu:: members' bilateral andmultilateral food aid amounted on the average to
$1 300 million a year (15% of total ODA). For manyyears the purchasing power of these funds was re-latively stable. This situation changed abruptly in1973 following large increases in food prices (Table1-12). Deliveries of cereals, the principal commoditiessupplied under food aid, which had ranged between10 and 16 million tons annually in the years 1963-72,dropped to almost 6 million tons in 1973.
The sources of food aid --- formerly extended onlyby the United States, which remains the principaldonor -- have gradually become diversified and in-clude most oAc member countries. Between 1963and 1973, out of a total average yearly flow of foodand funds of about $1 300 million, the United Statesshare was 82%. In 1973, total food aid of $1 100million was divided between the United States (55%),the EEC (23%), Canada (9%), and other countries(13%). The share of food aid in each country's totalODA varies considerably: for the United States about25%, for Canada around 19% and for the EEC some
In the last ten years the proportion of food aidextended multilaterally has grown from practicallynone to 25%, but the major part is still providedunder bilateral programmes and projects. The largestmultilateral institution for food aid is the World FoodProgramme (wFP) created in 1963 under the aegisof the United Nations and FAO which receivedpledges of $841 million between 1963 and 1972,principally from DAC member countries. Three quar-ters of the contributions to WFP are given in kindand one quarter in cash and services. Some DAC
countries, such as Denmark, Norway and Sweden,have channelled the bulk of their food aid contri-butions through WFP. Total shipments under theprogramme fell from 632 000 tons in 1972 to 524 000tons in 1973. Another important multilateral pro-gramme is that of EEC, started in 1969; its disburse-ments rose from $20 million in 1969 to $144 millionin 1973. The World Health Organization (wHo) andthe United Nations Relief and Works Agency forPalestine Refugees in the Near East (UNRWA) havesmall programmes of their own, and in 1972 a partof U.S. food aid to the Sahel was extended throughthe UNDP.
TABLE 1-12. TOTAL FOOD AID OF DAC COUNTRIES AT 130TH CURE AND 1967 PRICES
SOURCE: DAC and United Nations, Month y bulletin of statistics, August 1974.1, Based on export price of U.S. wheat.
27
1964 1965 1966 1967 1968 19(» 1970 1971 1972 1973
Food aid at current prices(million U.S. dollars) 1 529.1 1 311.3 1 329.2 1124.8 1159.2 1174.0 1257.3 1 217.1 1 276.0 1129.7
Food price index 1(1968 100) 110 97 104 105 100 95 93 101 113 231
Food aid at 1968 prices(million U.S. dollars) 1 390.1 1351.9 1 278.1 1 071.2 1159.2 1 235.8 1 351.9 1 205.1 1129.2 489.0

The following pattern (Table 1-13) emerges froman analysis of food aid distribution among coun-tries with relatively low, medium and high per caputincome in 1972 and 1973.
TABLE 1-13. DISTRIBUTION OF FOOD AID AMONG DEVELOPEDCOUNTRIES ACCORDING TO LEVELS OF PER cAPuT INCOME
1972 mo 1973
Per caput income1972 1973
Million U.S.dollars
Food aid
1972 1973
.... Percent ....
Agricultural production requisites
The energy crisis
The vital role of energy in food and agriculturalproduction and the consequent importance of ade-quate energy supplies for the functioning of existingfood systems are obvious. For example, it is esti-mated that about 12% of the total energy consumedin the United States is used, directly or indirectly,in the production, processing, transportation, distri-bution and cooking of food," and that farm produc-tion accounts for 24%, food processing industries(including transportation) for 39%, and refrigerationand cooking for 37% of the total food-related energyconsumption in the United States."
Energy from almost all conceivable sources isconsumed at different stages in the functioning ofexisting food systems. It would indeed be fancifulto imagine that these systems could continue tofunction if any one of the major sources were to beeliminated. Although the input of energy providedby the am, which is crucially important for the plantsupon which the entire food supply depends, is fargreater than that from any other source," it is not in-
12 J.S. and C.E. Steinhart, Energy use in the U.S. food system.Science, 183, April 1974; and E. Hirst, Food-related energy re-quirements, ibid.
13 Steinhart, op. cit. The allocation of United States food-related energy consumption estimated by Hirst is farm produc-tion: 17 %; food processing including transportation: 36 %"trade and households": 47 %.
11 Of the total energy used in maize production in the UnitedStates in 1970, it is estimated that the input of solar energy rep-resented about nine times that from petroleum and other fossilfuels. D. Pimentel, Food production and the energy crisis.Science, 182, November 1973.
Bangladesh, the Khmer Republic, Indonesia andPakistan accounted for four fifths of the total aid
28
received by low-income countries. Among middle-income countries, the Republic of Viet-Nam and theRepublic of Korea were heavily favoured. The prin-cipal high-income recipients were Israel, Iran andSpain.
Although food aid has played an important rolein helping developing countries meet their urgent andessential food needs as well as their domestic andexternal financing difficulties, it raises a number ofproblems which are now receiving more attention.These relate to the adverse effects such aid may haveon domestic agricultural production and internationaltrade, as well as to proper management of food aid.Other food aid problems concern fluctuations inavailable supplies, the composition of commitments,whether it should be given within the framework ofprojects or programmes and efficient transportation,storage and distribution. The importance of the lastitem was clearly demonstrated by relief operationsin the Sahel.
volved in the present crisis, since the supply of solarenergy is steadily renewed. Nor are inputs of energy inthe form of animal and man power directly involved,although the crisis may have implications for themsince they are to some extent substitutes for mechan-ical and electrical power. Thus, with respect tofood and agricultural production, the present energycrisis relates almost entirely to production requisitesderived from petroleum, including that consumed inthe form of electrical power. (Energy from othersources may however assume additional relevancewhen the longer term is taken into account).
The major short-term effects of the energy crisison food and other agricultural production are tolimit supplies and raise prices of major farm produc-tion requisites: fertilizers, fuels and pesticides. Farmproduction costs rise, and incentives for increasedproduction that would otherwise be provided bythe current, relatively high, prices of most agriculturalcommodities are reduced. On the farm, limitedsupplies of requisites make the farmers unable torespond fully to price incentives for increased pro-duction, and higher prices for the requisites in anycase make it less profitable for them to do so. For thenation, limited supplies of and higher prices for theserequisites increase the amount of foreign exchangerequired to pay for the increased cost of importingthe requisites or additional agricultural commodities,or both.
Prices of both fuels and fertilizers have risen sharplyduring the last year. Fertilizer prices have morethan doubled, and export prices for petroleum have
Low (less than $200) . 339 - 577 33 57Medium ($200 to $375) . 477 411 47 41High (more than $375) 202 22 20 2
quadrupled. The disruption of petroleum suppliesfrom the Near East in October 1973 created short-ages in the fuel available for use in connection withthe 1974 harvest (for tractors, irrigation and drain-age pumps, driers, etc.) in many of the importingcountries, particularly those that lack foreign ex-change. Supplies of nitrogen and phosphate fertil-izers have also fallen short of requirements, not asa consequence of the oil crisis but primarily becauseproduction capacity in major exporting countriesfailed to keep pace with increasing demand duringrecent years.
Disruption of petroleum supplies from the NearEast has however been but one of the factors thathave contributed to significant changes in the leveland structure of farm production costs and theirrelationships to agricultural commodity prices forthe 1974 season. Strong inflationary pressures havepersisted generally. Petroleum prices had in anyevent been rising even before October 1973. Worldreserves of most major agricultural commodities weredepleted during 1972 and 1973, and market pricesrose to record levels. Fertilizers were in shortsupply. Higher prices for fuel and other sourcesof power have increased food processing and distri-bution costs, thus widening the margin betweenprices received by farmers and those paid by con-sumers. As the impact of higher prices for petroleumand other sources of power come to be fully reflectedin the costs of producing the full array of farm pro-duction requisites, the upward pressure of the energycrisis on the prices of farm production requisiteswill spread to other items, and ultimately the costsof practically all requisites are likely to be affectedlo some extent. The increasing control over petro-leum and natural gas production in some of themajor exporting countries promises to have far-reaching implications for the future expansion andlocation of fertilizer production capacity, particularlyof nitrogen fertilizers.
The impact on production of higher prices for thesepurchased requisites is, of course, not spread evenlyamong agricultural commodities or among countries.The impact on individual farms also varies widely,according to the commodities produced, the technol-ogies employed, the efficiency of production, andother factors. Higher prices for fuel directly increasethe costs to producers using mechanical or electricalpower but have little if any effect on those to pro-ducers relying on animal or man power. Similarly,higher prices for chemical fertilizers have no directeffect on the costs to producers relying on manuresand other organic fertilizers. Higher prices for fer-tilizers have little direct effect OB livestock produc-tion, although their indirect effect, as a result ofhigher feed prices, can be expected to be almostimmediate. Again, since soybeans show a limited
29
response to applications of nitrogen fertilizers, ap-plications are relatively light, so that higher pricesfor nitrogen fertilizers have limited effects on soy-be.an production.
The relative position of agriculture in the nationalconsumption of power of course varies widely be-tween countries. Available data on this subject arefragmentary and can serve only to provide somegeneral notions.
The relative importance of fertilizers, fuels, andpesticides among total energy inputs varies widelyamong countries and commodities and also amongindividual farms producing the same commoditiesin the same country. Available data in the formof national averages, or of averages derived fromfarm accounting records for sample farms, servehowever to provide some general indication of rele-vant ranges. An analysis of energy inputs (exclud-ing solar energy) in United States maize productionestimates that fertilizers account for 36% of thetotal (of which nitrogen fertilizers account for 32%),petrol 29%, production and maintenance of ma-chinery 14%, electricity 11%, pesticides 1%, etc."Although irrigation accounts for relatively little ofthe total energy input for United States maize pro-duction, since less than 4% of the maize area isirrigated, the energy input for irrigation on the areairrigated is estimated to approach that for fertilizers.A World Bank study 1G reports recent motor fuel andpower costs on farms in developing countries to havevaried from zero to 20% of total farm cash costs.A United States Department of Agriculture studybased on 1971 records f-rom a sample of midwesternfarms indicates that total expenditures for fuel andelectricity represented about 6% of total cash expen-ditures for dairy farms and grain farms, 3% for pigfarms and 2% for beef cattle farms. If fuel andelectricity prices had doubled, the increase in thesepercentages would have been somewhat more thanproportional, in view of the effects of fuel andelectricity prices on the costs of other purchasedinputs.
Production on farms that make the greatest useof fuel and fertilizers is obviously the most vulnerableto higher prices for these items. Such farms accountfor a far larger part of total agricultural productionin developed market and centrally planned economiesthan in developing countries. Total agriculturalproduction in developing countries therefore appears
15 Pimentel, op. cit. Maize was selected for this analysis sinceit generally typifies the energy inputs in United States crop pro-duction, being intermediate in energy inputs between the extremesof high-energy fruit production and low-energy hay and smallgrain production.
11' Fertilizer and fuel supply effects on agriculture. Provisionaldocument prepared by the International Bank for Reconstructionand Development, February 1974.
17 The fuel cost of food, Marketing and Transportation Situa-tion, February 1974, mTs-192.

likely lo be less seriously affected by higher pricesfor these inputs than in the developed market andcentral 'y planned economies. Within developingcountries, however, the production from areas thathave moved farthest in adopting modern technologiesis most vulnerable to higher prices for these inputs.Generally these tend to include irrigated lands, areasspecializing in export crops (particularly cotton andsugar), and areas in which high-yielding varietiesof cereals have been widely adopted. Thus the im-pact in developing countries is likely to be concen-trated in areas that lave tended to provide "successstories" under past and current development efforts.
On the fartn, higher prices for fuel and fertilizershave the effect of reducing the volume of these inputs,which, all other factors unchanged, it will provemost profitable to apply. For example, as additionalfertilizer is applied, the yield response per additionalincrement declines. One study 's shows a yield re-sponse to nitrogen fertilizer on continuous maizeof about 44 bushels per acre for the first 60 poundsof nitrogen applied, 33 bushels for the next 60pounds, but only 9 bushels for the third 60 pounds.Thus farms on which heavy applications of fertilizershave become usual may find it profitable to "movebackward on the response curve" in order that thevalue of the increment of production will compensatefor the higher cost of the marginal increment offertilizer applied. Meanwhile, the fertilizer savedin this way is that which should be transferred todeveloping countries, where the marginal incrementof production is much higher. It is much cheaperand involves less bulk (about one eighth) to transferfertilizer rather than grain. With respect to fueluse, field operations have demonstrated that tractorfuel requirements can be sharply reduced (by from40 to 80%) by switching from conventional culturalmethods (plough-disc, harrow, plant, cultivate) to oneof the systems of minimum or no tillage. Higherprices for fuel provide distinct incentives for farmerslo make such a change in cultivation methods inareas where it is feasible to do so.
In the more modern agricultural systems, suchas that of the United States, the amount of energynow used to produce food exceeds by several timesthe amount of food energy the crops themselves yield.Additional inputs of energy in countries like theUnited States and Japan are bringing rapidly dimin-ishing returns in food production. In most devel-oping countries, by contrast, additional energy inputsto operate irrigation pumps and in the fortn offertilizers yield increasing returns and are an essentialkey to exploitating their potential food producfion.
13 Reported in Technology and use of inputs, H. Owens at U.S.Department of Agriculture National Agricultural Outlook Con-ference, Washington, D.C., 18 'December 1973.
30
The manner in which national governments act,individually or jointly, to deal with the energy crisiswill obviously have profound implications for thesupply and, perhaps even more important, the pricesof farm production requisites during the 1970s andbeyond. Increased use of fertilizers will be a majormeans of realizing the expansion of food productionthat is needed if food consumption levels for theincreasing world population are to be improved oreven maintained. It has been estimated that worlddemand for fertilizers in 1980 will be almost 50%above 1973 consumption. The additional energyrequirements for the production, transportation, andapplication of fertilizers will likely be of similarproportions. The extent to which 1980 fertilizerrequirements are covered and their cost will of coursebe important elements in determining the 1980 levelof food prices. Although similar projections of 1980fuel requirements for agricultural production are notavailable, the increase will undoubtedly be relativelylarge, since it must be anticipated that replacementof animal and man power by mechanical and elec-trical power will proceed, perhaps at an acceleratedpace.
Fertilizers
Since mid-1973, and more particularly in recentmonths, there have been shortfalls in supplies ofsome fertilizer products to a number of markets,especially in developing countries. The tight supply,accentuated by inflation, the energy crisis and risingfreight costs, has led to a rapid increase in marketprices of all fertilizer products as well as of fertilizerraw materials and intermediates.
The dominant factor in the present supply situa-tion has been the severe restraint on new investmentin production facilities for fertilizers, intermediatesand raw materials, coupled with the hnpact on pro-duction capacity of the closure of obsolescent plantsduring the five-year period to 1972, when over-capacity and oversupply were reflected in low fer-tilizer and fertilizer raw materials prices and a dropin profit margins. These developments affected thefertilizer industry primarily in the western industrialcountries, mostly in the private sector. Althoughthe need for new investment was recognized in manyquarters, a variety of factors held up new construc-tion. Probably the main factor hindering expansionwas the low priority given to fertilizer productswithin the investment budgets of the chemical andrtiinerals industry. Cost inflation required constantupward revision of costs, there was uncertainty about
fl) Documentation presented at first session, FAO Commissionon Fertilizers, 1-5 July 1974, Rome,

[he availability and relative cost of energy supplies,and the problem of pollution became more impor-tant. Another discouraging factor for new invest-ment was that existing plants w:.a.re often workinglar below capacity owing to serious malfunctioningof manufacturing plants, in particular large-capacityammonia plants. Starting dates for new plants wereoften delayed, and their completion was often fol-lowed by prolonged periods of operation at a frac-tion of design capacity, especially in developingcountries. The change from relative plenty to scar-city of fertilizers became evident quite suddenly, asferti]izer demand continued to grow and carryoverstocks were exhausted.
Nitrogen fertilizer prices have risen rapidly sinceearly in 1972 under the combined pressure of greaterdemand and limited supply. By early 1974, f.o.b.prices for bagged urea were quoted at US$250-310per ton (equivalent to US$443-673 per ton of plantnutrient) and ammonium sulphate at US$70-100per ton (equivalent to $333-476 per ton of plantnutrient), as compared with US$120-140 per tonof plant nutrient in 1972. The price situation hasremained unchanged since then, as demand continueshigh and supply tight. World market prices attheir peak reached about US$700 per ton of plantnutrient, but these prices generally applied to "dis-tress purchases," and the bulk of deliveries weremade at substantially lower prices. Prices of nitrogenare expected to remain firm and may harden furtherduring the next two or three years, as little expan-sion in supply is expected before 1975/76.
Prices of phosphate fertilizer also rose sharply asa result of heavy increases in the prices of phosphaterock and sulphur. Early in 1974 triple superphos-phate was quoted at US$150 per ton f.o.b. (equiva-lent to US$326 per ton of plant nutrient) in com-parison with US$140-150 per ton of plant nutrient in1972. Prices went up as high as US$800 per tonof plant nutrient for some "distress purchases" ofphosphate fertilizers. However, prevailing worldprices for phosphate fertilizers are between US$240-420 per ton of plant nutrient. The short- andmedium-term outlook for prices of phosphate fer-tilizers depends on the cost of raw materials as wellas of energy and freight. Morocco, the world'slargest exporter of phosphates, trebled the exportprice of phosphate rock to US$42 per ton f.o.b.from 1 January 1974, thus virtually doubling thecost of manufactured phosphate fertilizers for manyproducers. Other rock producers aligned with Mo-rocco's price. A further increase to about US$63per ton f.o.b. took effect on 1 July 1974.
Before 1973, potash prices were largely determinedby the floor prices set by the Government of Sas-katchewan, Canada, at Can$33.75 per short ton (UnitK20 ex mine). In the 'second half of 1973, follow-
31
ing the conclusion of a number of major exportcontracts at Can$45-50 (f.o.b. Vancouver), theavailability of Canadian potash for export has beensubstantially reduced and prices have risen accord-ingly, with C...ta$60 being quoted for small spotdeals. Currently Canadian potash is supplied toexport markets at about Can$50 per ton (f.o.b.Vancouver), while European potash is priced atCan$65-70 per ton f.o.b. A further increase inpotash prices can be expected in the short term asa result of continuing cost inflation and pressureon supplies. Freight rates, which affect the landedcosts of all fertilizer inputs, have been rising, withmost rates at least twice and often three times thosereported at the end of 1972.
In summarizing the fertilizer situation, it appearsthat the current shortage, particularly of nitrogenousfertilizers but also of phosphatic fertilizers, is likelyto persist and possibly worsen during 1974/75 and1975/76. There is no way of bridging the gap be-tween expected demand and supply in the short run.Capacity in addition to that already planned cannotbe brought into use before 1977 (and probably 1978),so the world has to live with a worsening short-age in the meantime. Most fertilizer consumershave no alternative but to economize. Major im-porters in the developing countries are likely to beaffected by the shortage far more than the others.The physical shortage of material itself and, moreimportant, the contraction of exportable surpluses inwestern Europe and North America are, unlessinternational action can be agreed upon, likely toresult in government insistence on priority for do-mestic supplies and in competition among developingcountries for limited export supplies. The importerswho will suffer most, unless some action is taken,are countries in southeast Asia, parts of Latin Amer-ica and Africa.
The difficult fertilizer situation led the SeventeenthSession of the FAO Conference in November 1973 toendorse a recommendation of the FAO Council toestablish the Commission on Fertilizers, which heldits first session in July 1974, attended by sixtymembers of the Commission, by representatives ofthe EEC, the United Nations and Specialized Agen-cies, and by twenty-one observers from the fer-tilizer industry. The Commission gave detailed con-sideration to the FAO Director-General's proposalsfor setting up an international fertilizer supply schemein view of the extremely tight fertilizer supply/dernandsituation. Earlier, on 14 May 1974, a resolutionadopted by ECOSOC had requested that the Director-General draw up an emergency plan of operationsfor increasing the supply of fertilizers to developingcountries, including the establishment of a fertilizerpool, and call an emergency session of the FAOCouncil (held July 1974) to approve the plan of

operations and put it into effect. In preparation forthis emergency session an FAO working party esti-mated the 1973/74 shortfall in fertilizers for develop-ing countries (excluding China) at about 1.5 milliontons of plant nutrients, consisting roughly of 70%in nitrogen (N) and 30% in phosphorus (P205)."This is equivalent to about 15% of the total con-sumption of fertilizer plant nutrients of developingcountries. Since a ton of plant nutrients is requiredto produce about 8 tons of foodgrains, this shortfallmay result in a reduction of some 12 million tonsin the foodgrains production of developing coun-tries. The working party estimated that the deficitin supplies of fertilizer plant nutrients would againbe at least 1.5 million tons in 1974/75 unless remedialaction was taken by the international community.Since this mid-1974 assessment the supply of allfertilizers has continued to remain tight and priceshave risen further.
The FAO Council noted that the Director-General'sproposal was a comprehensive framework withinwhich urgent action could be initiated bilaterally andmultilaterally, and that an important element in thescheme was an information system. This systernwould receive and make available a regular flow ofinformation on the requirements of the developingcountries, on supply availability, and on possiblesources of finance. Contacts would be establishedwith governments of both fertilizer producing andconsuming countries, with governments having bilat-eral aid programmes, and with industry regardingthe supply situation. There would also be constantliaison with the UN Emergency Operation, the World.Bank, and other international and national sources offinance. Thus, as a "clearinghouse," FAO wouldplay an active role with a view to reallocating partof current fertilizer production to needy countries.With reference to the ECOSOC resolution the Councilauthorized the establishment of a fertilizer pool, towhich contributions are to be made either in fertilizeror in cash. The pool is not intended to meet theoverall fertilizer needs of developing countries, butis meant to fill gaps when an otherwise insolubleproblem arises in the present emergency situation.Fertilizers would be supplied on a grant or subsidybasis. Cash contributions would be used to supplyfertilizers to countries with balance of payments dif-ficulties, to meet shipping costs, and to improve theefficiency and output of plants in developing coun-tries.
The Director-General proposed that targets of theinternational fertilizer supply scheme should relate
20 In terms of urea (46% nitrogen) and triple superphosphate(46% phosphorus), this is equivalent to 3.25 million tons offertilizer in product weight.
32
to individual developing countries, and that 110
developing country should have a lower aggregatesupply of fertilizer in 1974/75 than it did in 1973/74,ami increment of at least 12% to be achieved whereverfeasible. This would result in an increase in totalfertilizer imports by developing countries of 1 mil-lion tons of nutrients over 1973/74. Priority shoulcibe given to those countries which qualify for assistancefrom the United Nations Emergency Operation ---that is, developing countries most seriously affectedby the present situation, bearing in mind the par-ticular problems of the least developed and land-locked countries.
The criteria adopted for allocating fertilizers shouldrelate to the objective assessment of all factors thatdetermine the real need for importing fertilizers; thecriteria would be reviewed by the Commission onFertilizers. A number of members pointed out theircountries' efforts in supplying fertilizers to developingcountries on a bilateral basis. The Council notedthat this form of aid could be an important elementof international solidarity and should be taken intoaccount in the international fertilizer supply scheme.It was agreed that priorities for the allocation offertilizer or cash from the pool should be the re-sponsibility of the Director-General, who would applythese same priorities in directing requests fromdeveloping countries for consideration by countriesoffering bilateral aid. The Council agreed that theCommission on Fertilizers be designated as the bodyresponsible for overall surveillance of the schemeand requested that the Director-General report pro-gress on the operation of the scheme in time forconsideration by the World Food Conference, theNovember 1974 Council session, and any other ap-propriate body.
The Council expressed general interest in the prin-ciples underlying the Sri Lanka proposal for theestablishment of a world fertilizer fund and supportedits consideration at the World Food Conference.
Pesticides
The pesticide situation is extremely serious, andthe outlook for developing countries is perhaps evenworse than that concerning fertilizers. During 1973/1974 there seems to have been an increase of about25% in worldwide orders for pesticides, while pro-duction decreased slightly. Since the inventory policyof the pesticide industry allocates current productionfor use in the following crop season, the increase indemand for 1973/74 has so far largely been met bydrawing on current production. In other words,stocks for 1974/75 have been sold in 1974, and theresult is expected to be a deficit of 20 to 30% ofpesticide requirements in 1974/75. The basic feed-

stocks are manufactured almost entirely in developedcountries, which are likely to give themselves priorityin satisfying their own needs. Thus, unless a systemof international allocation is agreed upon soon, theglobal shortfall could mean that developing coun-tries will have very little pesticides in 1974/75.
The medium-term outlook is also most disquiet-ing, as the pesticide industry has recently been under
Production and trade 21
World fishery production again failed to expandin 1973, and preliminary estimates indicate thatlandings were similar to those of 1972, when theworld catch was some 5 million tons less than in1970 and 1971 (Table 1-14). The sharp decline inyields from Peruvian stocks, used mainly for fishmeal,is causing world production to fall in the 1970s, incontrast to the 1960s when the rapid increase inworld output came largely from expansion in Peruviancatches. A further drop in Peruvian production was
21 For a detailed account of the fisheries situation, see FAO,Yearbook of fishery statistics, 1973, Vol. 35, Rome, 1974.
TABLE 1-14. ESTIMATED WORLD CATC OF FISH, CRUS TACEANS AND MOLLUSCS
33
public pressure because of the environmental effectsof pesticides. Legislative obstacles have greatlyincreased the amount of time and money needed todevelop new products. There are, however, someprospects for poorer countries in increased produc-tion of a limited number of components which donot require the basic feedstocks produced in devel-oped countries.
again the main reason for stagnant world output.Landings for direct human consumption continuedto rise despite the drop in all landings, and suppliesof fish entering markets for direct human consumptionin 1973 increased by more than a million tons over1972.
In western Europe and North America the catchin 1973 was virtually unchanged from the previousyear. Most members of the EEC attained somewhathigher levels of production, and for the first timetheir combined catches may well have exceeded 5tnillion tons. Iceland attained its highest landingssince 1967 (mainly increased catches of capelin), butNorway's recent recovery was not maintained. Japan,to the contrary, increased its landings by an esti-
Fisheries
NOTE: Figures refer to the weight of the catch in metric tons The annual changes in percentage terms may therefore differ considerablyfrom those in Table 1-15 where the quantities of production are weighted by the unit values, as indicated in the explanatory note on page xi.
"1. Preliminary. 2 Israel, Japan, South Africa. 3 Excluding Japan. 4 F_xcluding Israel. 5 Excluding South Africa.
1969 1970 1971 1972 1973 1Change1972 to
1973
T1 ousand metric tons Percent ..
DEVELOPED MARKET ECONOMIES 24 990 26 260 26 480 26 680 27 450 + 3
Western EuropeNorth America
10 4403 900
11 0004 170
11 0804 080
11 2303 820
11 3603 820
-I- i
OceaniaOther developed market economies"
14010 510
16010 930
18011 140
18011 450
19012 080
-F 6-I- 6
EASTERN EUROPE AND THE U.S.S.R. . 7 400 8 240 8 410 8 880 9 820 +11
Total developed countries 32 390 34 500 34 890 35 560 37 270 +5
DEVELOPING MARKET ECONOMIES 23 080 27 010 26 240 20 610 18 980 8Latin AmericaFar East'Near East 4Africa 5Other developing market economies
11 9608 140
5702 330
80
15 5208 430
5502 410
100
14 0009 010
5602 430
240
7 6309 390
5602 770
260
5 20010 010
6402 840
290
32+ 7+14+ 3+11
ASIAN CENTRALLY PLANNED COUNTRIES . . 7 200 7 970 8 630 8 670 8 700
Total developing countries 30 280 34 980 34 870 29 280 27 680 5World 62 670 69 480 69 760 64 840 64 950

1 Excluding China and other Asian centrally planned economies. 2 Preliminary.
mated 10%, largely from greater catches of skipjackand Alaska pollack; and South Africa's landings alsorose markedly, by some 18%. Landings by thedeveloped market economies continued to expandsteadily, totalling more than 27 million tons ascompared with an annual catch of 23 million tonsin the mid-1960s.
A very considerable increase in catch, sot le 850 000tons, was reported by the U.S.S.R. A number ofimportant fishing nations in Asia and Africa alsoincreased their catches, including the Republic ofKorea, Malaysia, the Philippines, Morocco and Sene-gal; the rise in the latter country was due to morefishing by the national fleet. The catches of Ghanaand Angola fell appreciably. Total landings in LatinAmerica were of course sharply influenced by thefurther drop in output of Chile, Peru and Brazil.Higher landings were maintained however by Mexicoand Cuba, the latter having almost quadrupled itsfish catch during the last ten years.
A dominant feature of world fisheries in 1973was the widespread and very marked acceleration inthe upswing of prices, partly as a result of supplydifficulties, but also in consequence of the mainte-nance of very firm demand for most fishery products(Table 1-15). Increases of 25% and more in theunit value of landings were typical. In the UnitedKingdom, for example, values at first-hand sale rose
34
by well over a third with a fall of 5% in the amountof cod, haddock and other demersal species avail-able. Landing prices and values of processed prod-ucts rose to unprecedented levels in many othercountries.
Stagnant production combined with relatively lowinventory levels caused a reduction in the total volumeof world trade in fish and fishery products. Thereduction derived almost entirely from a severe short-age of fishmeal supplies, as trade in fish and fisheryproducts for direct human consumption remainedvirtually unchanged in volume and reached recordlevels of value. These trends were especially markedin such major markets as the United States andJapan. Supplies of edible fish products in the UnitedStates were maintained only by meaL_; of increasedimports, domestic production being lower than in1972. In Japan the constantly rising domestic de-mand for marine products led to a rise in value offishery commodity imports of about 50% during thefirst nine months of the year over the correspondingperiod in 1972. The increased value of internationaltrade, up 28%, was again influenced by the con-tinuing series of currency realignments (Table 1-16).
Markets for fishmeal were characterized throughout1973 by severe shortages in supply and rapidly risingprices. While a number of western European coun-tries and South Africa succeeded in achieving some-
Preliminary. 2 Israel, Japan, South Africa. 3 Excluding Japan. 4 Excluding Israel. 3 Excluding South Africa.
TABLE 1-16. -- INDICES OF THE VALUE OF FISHERY EXPORTS BY REGION
1969 1970 1971 1972 1973 .1Change1972 to
1973
1961-65 average 100 Percent ...
Western Europe 143 171 198 244 339 +39North America 164 178 195 230 361 +57Oceania 311 314 392 527 611 +16Other developed market economies" 114 125 135 176 212 -1-20
Latin America 169 228 249 225 178 21Far East3 229 284 349 479 678 +41Near East4 114 156 169 211 293 +39Africa 5 137 154 173 204 297 -1-45Other developing market economies 198 235 344 406 450 +11Eastern Europe and the U.S.S.R. . 177 195 203 211 262 +24
TABLE 1-15. -- INDICES OF VOLUME, UNIT VALUE AND TOTAL V kLUE OF VVORLD TRADE IN FISHERY PRODUC1S I
Change1909 1970 1971 1972 1973 2 1972 to
1973
1961-65 average 100 Percent . . .
Volume 122 130 134 144 141 2Average unit value 110 118 154 169 231 + 37Value 152 179 204 244 312 + 28

what higher fishmeal outputs in 1973, these wereinsufficient lo compensate for the sharp fall in Peru-vian production. Trade in fishmeal in 1972 wasmaintained roughly at previous levels largely bydrawing on record stocks. These had to a largeextent been liquidated by the beginning of 1973, anda serious shortage developed because other meal-producing countries were unable to fill the gap leftby Peru and Chile. Moreover, the concurrent short-age of soybean meal and other alternative sourcesof high-protein feedstuffs made it difficult for com-pounders to reconstitute feed formulas. Prices forfishmeal, which during 1972 liad averaged even alittle below 1971, rose spectacularly, reaching someUS$450 per ton by the end of September 1973, com-pared with US$180 per ton a year earlier. Thepressure lifted a little toward the end of the year,but prices equivalent to US$420 per ton (c.i.f. westEuropean ports) were being quoted early in 1974.
The first half of 1974 saw a significant change inthe market for a number of fishery commodities,whose prices fell sharply from previous record levels.FIowever, this seems to be a short-term phenomenoncaused partly by large stocks and consumer resistanceto high fish prices. With interest rates an increasinglyheavy burden, many traders in the key North Amer-ican and European markets for ground fish havetended to work with as low a level of stocks as pos-sible. Thus, with stocks still high in relation to thefirst half of 1973, with below-normal landings insome areas and with declining market prices, anumber of producers have been facing a severecost/price squeeze. Nevertheless, no further severedrop in prices seems likAy in the immediate future,and the likelihood of increased prices for meat maywell bring at least stability and possibly a recov-er), in fish prices and consumption. Considering thelimited opportunities for further increases in theproduction of these commodities, it seems unlikelythat the present situation denotes any significantchange in the secular trend of fish prices.
There has been an improvement in the yield fromthe southeastern Pacific anchoveta fishery in 1974.The quota of 2 million tons of anchoveta establishedby Peru for the period March-September liad alreadybeen taken by May, and catches from the end-of-the-year fishing season are likely to affirm this improve-ment; but it is as yet too early to express optimismthat the fishery is returning to previous levels of pro-duction and that consequently the current high pricesof fishmeal will fall.
Policies and other issues
A number of events during 1973, including thepoor performance of several major fisheries, served
35
to concentrate attention on the need for more effectivemanagement of the world's fishery resources. Amongthese was the Technical Conference on Fishery Man-agement and Development, convened by FAO in Van-couver in February 1973 and attended by delegatesfrom nearly seventy nations and international bodies.The Conference recognized that the world's fisheryresources are not unlimited, noted that managementto protect resources and maintain yield is alreadyoverdue in many instances and recommended that,even where comprehensive scientific and economicdata are lacking, management systems should beintroduced at the earliest possible stage in the develop-ment of a fishery.
However, it remains difficult to obtain internationalagreement for implementing effective measures.Nevertheless, significant progress was made during1973 toward fishery conservation by agreement withinthe International Commission for the NorthwestAtlantic Fisheries (icNAF) on measures affording bet-ter protection for commercially important fisheriesoff the North American coast. The new regulationsprovide for a two-tier system of national quotasdesigned to control not only the catches of particularspecies but also the overall catch level, so that by1976 the biomass being exploited will have recoveredto a level that will produce the maximum sustainableyield. Negotiations elsewhere have been less success-ful however.
Progress has been slow in the northeast Atlantic,where many valuable stocks are either seriouslydepleted or in danger of becoming so. Among theseare the North Sea sole and plaice and the west ofScotland and North Sea herring, which together sup-port fisheries worth some US$125 million annually.Agreement on a catch-restriction scheme for 1975has so far been possible only for North Sea herring,and then only at a level which offers little possibilityof long-run improvement in total yield. Much of thedifficulty in reaching agreement on these mattersstems from the fact that many coastal communities,and often entire economies, are heavily dependent onfishing for their livelihood. The need for regulationand the consequences of failure are, in general, wellunderstood; the main problem is how to impose arestriction on growth, and in some areas a reductionin the level of activity, in a major sector of the econ-omy. The problem can be solved in the long runonly by industrial diversification which will benecessary in any event, since continuing economicgrowth cannot possibly be based on a single, finiteresource.
Areas other than the north Atlantic have seen aquickening of interest in international collaborationfor the conservation of fishery resources. The GeneralFisheries Council for the Mediterranean has recentlytaken steps that will permit it to play a more positive

role in the management of the fishery resources ofthe area sonie of which, particularly the westernMediterranean, are now very heavily fished. TheInternational Commission for the Western CentralAtlantic, the only part of the Atlantic not previouslycovered by a formal regional body, was establishedin 1973, and it is due to hold its first session duringthe first half of 1975. In the Pacific, the Inter-American Tropical Tuna Commission has continuedto implement management measures, but it encoun-tered difficulties concerning the international distri-bution of the allowable catch, which prevented agree-ment on a management régime for the 1974 fisheryuntil the season was well advanced.
A number of countries also took steps to con-elude bilateral agreements or to introduce manage-ment measures under national jurisdiction. Norway,for example, enforced new measures to conserve thestocks of mackerel, capelin and North Sea herringat the national level. The United Kingdom and theU.S.S.R. also joined Norway in fixing quotas forArcto-Norwegian cod. Moreover, a modus vivendiwas finally reached late in 1973 which permittedresolution of the long dispute between Iceland andthe United Kingdom regarding fishing activities inthe waters around Iceland. Other specific agree-ments were negotiated between Italy and Yugo-slavia, settling licences to fish off the latter's coastduring 1974-76, and between Japan and New Zealand.Agreements governing major fisheries in the Pacificand the central and south Atlantic were also reached.A number of joint fisheries ventures were concludedbetween developing nations and countries with greatertechnical experience. A high degree of risk attendssuch projects, and many have failed for such reasonsas inadequate preinvestment study and changes inpolitical and economic situations. Steps have alreadybeen taken to improve the manner of instituting jointventures, thus increasing their chances of success.Notwithstanding the many difficulties, a further ex-pansion of such ventures can confidently be expected.
Further impetus is being given lo joint ventureagreements by the trend of extending national juris-diction over the exploitation of living resources.More than thirty countries now claim areas rangingfrom 15 to 200 miles offshore; many others favouran extension of national jurisdiction, but considerthat this should be agreed upon under the proposedlaw of the sea. At the national level, substantialincreases in gross earnings by fishing enterprises inmany developed countries have in a number ofinstances led to government reappraisals of financialsupport for the fishing industry. The United KingdomGovernment, for example, in June 1973 discontinuedthe system of granting inshore vessels subsidies forevery voyage made, and operational subsidies werelater withdrawn for long-range trawlers. Vessel-
36
building grants and loans are also under scrutiny,partly as a result of uncertainty concerning access totraditional fishing grounds, but also because of theindustry's relative prosperity.
The world's fleet of fishing craft of over 100 grossregistered tons (GRT) has been growing at an annualrate of about 6% in number of units and approxi-mately 10% per annum in total GRT, with new vesselstending to be bigger and more powerful. If factoryships and carrier vessels are also included, the ex-pansion is even more pronounced: the aggregate GRTof the combined global fleet in mid-1973 was some43% larger than in 1969. As an example of nationalefforts to promote more orderly development offishing fleets in relation to fish resources, the CanadianGovernment in August 1973 imposed a three-monthfreeze on new building subsidies for Atlantic coastalvessels and announced a new scheme to restrict entryto the fishery. Few governments, however, feel itappropriate to check the expansion of their nationalfleets while the activities of foreign competitors con-tinue unabated. In Europe this situation shouldlogically be a matter for joint policy decision at theEEC level, but so far there have been few signs ofany emerging consensus.
However the impressive evidence of rising grossearnings has to be weighed against rising fuel prices,higher wages and increasing costs of materials andequipment. In the third quarter of 1973 and theearly part of 1974 the international energy crisiscreated serious problems of fuel shortages and ac-celerating fuel costs. Many vessels, especially long-range units, encountered difficulties in refuelling awayfrom and, in some instances, even at their base ports.The supply situation has now improved, but undoubt-edly the long-term profitability of many fisherysectors will be seriously affected by increased costsof fuelling. A number of countries have introducedfuel subsidies for fishing fleets in an attempt to miti-gate the burden of the three- to fourfold increasein oil prices.
Fishing operations in some countries were alsohampered by the continuing gradual decline in manpower. Sectors of the industry which necessitaterelatively long absences from home have, in particu-lar, been finding it harder to attract crews despitethe opportunities for higher earnings. There is com-petition not only from the rewarding and sociallypreferable coastal fisheries but also, in certain areas,from the urgent demands of the seabed oil industry,which in some instances is being superimposed upontraditional fishery facilities.
Outlook
With fish production lagging behind growing de-mand, increasing attention is being directed not only

to conserving already heavily exploited, traditionalfisheries, but also to presently underutilized speciesand the waste of fish in catching, processing anddistribution. The greater contribution which couldbe made by inland water fisheries and particularlyby aquaculture is also receiving more recognition.The unrealized potential of inland water fisheries isof particular importance to many of the world'sdeveloping nations. Whereas freshwater fish, espe-cially cultivated species, are mainly for luxury mar-kets in most developed countries, in developingregions the produce of inland and brackish waterbodies tends to consist of species which are mainlystaple, traditional food items. World output offinfish, crustaceans and molluscs from inland watersis about 10 million tons per annum, of which abouthalf is from aquaculture. Asia notably China(whose extensive inland water resources yield a totalapproaching 5 million tons annually), Bangladesh,India and Indonesia and the lakes of Africa arethe major producers. Output from "wild" fisherieson large lakes, rivers and marshes could undoubtedlybe considerably increased by introducing improvedfishing techniques, more effectively controlling fishingefforts and improving natural stocks through arti-ficial recruitment and transplantation; but the mostexciting possibilities rest with the further develop-ment of aquaculture operations.
The rate at which output from aquaculture can beincreased will depend upon the progress made inbringing additional inland and brackish water areasunder cultivation, the extent to which technicalresearch findings can be translated into practicalapplication and the priorities given by governmentsand industry to the investment of money and effortin the expansion of this form of food production.An important factor will be the attention given tothe supply and distribution of sufficient quantities offry.
No comprehensive information is available aboutpotential sites for aquaculture, but preliminarystudies, indicating that at least 2.2 million hectaresare now under pond culture for finfish, suggest thatonly a small percentage of potentially usable areasare being cultivated. In the Philippines, for exam-ple, an additional 500 000 hectares of fresh andbrackish water, with a potential estimated as highas 2 tons of fish per hectare per year, await develop-ment. Plans to exploit the extensive water resourcesof the vast Mekong basin offer a great opportunityfor rational expansion of fish culture in Laos, theKhmer Republic, Thailand and the Republic ofViet-Nam. Other studies indicate that potential pro-duction from expanded coastal aquaculture in south-east Asia alone might be more than 2.5 million tonsper annum.
Aquaculture is already significantly contributing to
37
the food production and the economies of a numberof countries, and the economic viability of manytypes of culture has been demonstrated under suit-able conditions. In addition, many new technicaldevelopments leading to higher yields and lower pro-duction costs have resulted from experimental work,and further advances can confidently be expectedin the future. Thus, while an accelerated researchprogramme is needed to solve some of the outstand-ing problems, particularly in new types of aquacul-ture such as shrimp and marine fish culture, thereis already enough knowlege to permit expansion ofactivities in many parts of the world. Such expansionrequires well-prepared aquaculture programmes withinnational fishery development plans which make ade-quate provision for financial and technical support.
Closer interaction between agricultural and aqua-cultural food production is necessary. The potentialoutput from aquaculture is likely to be restrictednot so much by physical limitations (e.g., availablewater area) as by supplies and costs of energy,fertilizers and feedstuff s that is, by alternative-useconsiderations. Conflicts are at present arising inconnection with the use of flood plains and swampareas.
A very significant expansion in fish output frominland waters and especially aquaculture ope.rationsis feasible once these problems are solved. Estimatesprepared by FAO for the Vancouver Conference sug-gest that production may reasonably be expected toreach some 17 million tons by 1980; in the opinionof the TAC Working Group on Aquaculture (Spoleto,July 1973), by the year 2000 an annual world pro-duction of 50 rnillion tons could be achieved, providedthat the necessary research and development measuresare undertaken. Moreover, aquaculture, in particular,can play an important potential socioeconomic rolein addition to its contribution to food and proteinsupplies. Both subsistence and commercial fishfarming can help to improve the rural economy ofdeveloping countries by providing employment andearning foreign exchange through the cultivation andexport of high-value species. Its employment poten-tial is especially significant. While aquaculture can bemechanized if labour is scarce, where it is plentifuland jobs scarce a 20-hectare pond can give fullemployment to four or five workers plus casualemployment during harvesting or when repairs haveto be undertaken. Already, for example, in theRepublic of Korea 130 000 full-time and some 300 000part-time workers are engaged in aquaculture, in thePhilippines a total of more than 170 000 and inIndonesia over 500 000.
Although aquaculture and other fishery activitieson inland waters undoubtedly have very great po-tential, the majority of the world's fish supplies willcontinue to come from marine resources. Moreover,

the larger part of future increases in the world de-mand for fish will inevitably have to be supplied bymarine resources which at present are only lightlyexploited, either because they are located in watersdistant from today's major markets or because theyconsist of species which present serious marketingproblems.
Thus there is the paramount need for new productdevelopment, which must convert unfamiliar speciesinto foods that are consistent with market needs, so-cial habits and consumer preferences and incomes.Considerable interest is currently being shown incompounded, comminuted and otherwise mincedproducts, particularly of species which in whole-fishform are unattractive in appearance or which cannotconveniently be converted into other more traditionaltypes of products. Encouraging results have alsobeen obtained with the introduction of dry-powderedfish (fish protein concentrate) into human nutrition,mainly as an additive or condiment for staple foods;considerable technical marketing difficulties remainto be resolved before consumption of such concen-trates can become widespread.
An associated and significant problem is the needto reduce the waste of fish in catching, processing
Forestry
Production and trade
The high level of economic activity in 1973 resultedin exceptionally favourable market conditions inmost regions of the world for the sale of forest prod-ucts. Production reached peak levels and pricesrose sharply. Total removals of industrial round-wood increased by as much as 3% over 1972 (Tables1-17 and 1-18) and possibly more. The volume oftrade in coniferous roundwood increased by 16% andits value by 84%. Trade in tropical hardwood logs,among the most important timber exports of develop-ing countries, increased by 20% in volume and 98%in value. Production of sawn softwood increasedby 3% and of sawn hardwood by 5%. The trade inthese commodities increased by 16% and 20% re-spectively in volume and by about 50% in value.Pulp and paper output increased to an amount whichfully used available capacity, so that further increaseswill be restricted to the rate at which new capacitycan be brought into production.
The situation in forest products markets in 1974has been influenced by the oil crisis and governmentpolicies to overcome inflation; however, the productshave not been uniformly affected.
38
and distribution. This is particularly important inmany developing parts of the world, regarding notonly marine fish but also production from inlandwaters, especially those remote from centres of con-sumption. So-called "trash fish" results from alltypes of fishing operations. It is not an exclusiveproblem of major-unit fisheries, but also occurs on alarger scale than is generally realized in the artisanalfisheries of developing countries. However, it is aparticularly prominent feature of shrimp trawling,where for every pound of shrimp brought on deckas much as 6 to 10 pounds of various fish are usuallydiscarded; this suggests that more than 5 milliontons of such fish may be discarded annually.
Losses on a similar scale are probably incurredthrough poor methods of preservation and distri-bution. Spoilage and weight losses caused by defi-ciencies in processing, storage and transport are esti-mated to be equivalent to one quarter or more of thelanded catch in some regions. Low standards ofpreservation and hygiene together with inefficientdistribution and marketing are indeed believed tobe the major obstruction to the achievement of higherlevels of fish consumption in many parts of Asia,Africa and Latin America.
TABLE 1-17. INDICES OF WORLD ROUNDWOOD PRODUCTION,BY MAIN COMMODITY GROUPS
1- Preliminary.
In many countries restricted access to credit hasaffected construction activities, resulting in a sharpdecline in the number of dwellings started and com-pleted. This drop has been especially marked inthe United Kingdom, the United States and Japan.Nevertheless, considering that the production andtrade of forest products reached exceptionally highlevels in 1973, the consumption of sawnwood andwood-based panels appears not to have declined ap-
Logs 110 113 117 120 125 +4Pulpwood 131 141 138 137 142 -1-4Pitprops 83 85 81 75 70 7Other industrial wood . 125 122 124 121 119 --2ALL INDUSTRIAL WOOD 114 118 120 122 127 +4Fuelwood 105 106 107 107 108 +
TOTAL ROUNDWOOD . 112 114 116 117 120 +3
Change1969 970 1971 1972 1973, 1972 to
1973
... 1961-65 average 100 .. Percent

TABLE 1-18. -- INDICES OF TOTAL WORLD ROUNDWOODPRODUCTION, BY REGION
1 Preliminary. 2 Israel, Japan, South Mica. 3 Ex-cluding Japan and Asian centrally planned countries. 4 Ex-cluding Israel. 5 Excluding South Africa.
preciably in relation to their long-term trend. Thenew situation seemed to be evidenced more in theprice levels: after the sharp price increases for mostforest products during 1973, which reflected a par-ticularly vigorous demand, prices tended to stabilizeat the end-of-year level, showing some decline in afew cases.
On the other hand, the log market situation earlyin 1974 seemed to suggest that the strong demandof 1973 had apparently not only satisfied the highlevel of consumption, but had also replenished thestocks in the distributive systems. This may explainthe present low level of activity, particularly notice-able in the market for tropical hardwood logs.
Despite economic developments since the beginningof 1974, activity in the pulp and paper industry hasremained very close to full capacity utilization in themain producing countries, and prices for most prod-ucts have continued to rise. As a result, demandhas been very high for all types of raw material forpulping. This has particularly affected pulpwoodproduction, which had previously been depressed bylow profitability conditions. The shortage of fibreshas led to an increasing use of wastepaper as rawmaterial and to higher prices for pulpwood.
Prospects for the forest products market will bestrongly affected by future developments in thegeneral economic situation, which at present appearsvery uncertain.
39
ROUND WOOD
World production of industrial roundwood in-creased by 3 to 4% in 1973, an appreciably higherrate than in recent years. Growth in the total pro-duction and consumption of roundwood has beenreflected in sharp trade increases in industrial round-wood.
Trade in broadleaved logs increased by about 20%in 1973, reaching 52 million cubic metres. As in1972, most of the trade originated in the PacificBasin, mainly in southeast Asia, exports from Malay-sia, Sabah, and the Philippines, not only to Japanbut also to Europe, showing a marked increase.Exports of tropical hardwood logs from west Africaalso rose, but several countries limited exports ofsome major commercial species in order to ensurethe supply of roundwood for domestic industriesand to encourage the export of semiprocessed prod-ucts such as sawnwood. Efforts were also madein some major importing countries lo promote theuse of lesser known species. Demand for all broad-leaved logs was strong throughout 1973, and pricesrose sharply for both tropical and temperate species.By the end of the year demand and supply seemedto be in better balance, although supplies were af-fected by the energy crisis and the scarcity and in-creased cost of freight.
About 12% of the value of world trade in forestproducts is from trade in logs, more than half ofwhich are hardwood logs from developing coun-tries. Substantial price increases are reported forlogs in all regions, resulting in a considerably greaterincrease in the value of trade than in the volume.The value of trade increased by 84%, while the vol-ume of trade in coniferous logs increased by 16%to a total of 30 million cubic metres.
International trade in pulpwood accounts for onlyabout 2% of the total value of trade in forest prod-ucts and is mainly between western developed coun-tries and eastern Europe and the U.S.S.R. During1972 there was a strong recovery of the pulpwood-using industries and a consequent increase in con-sumption of this raw material over 1971. Theexpansion continued in 1973, by some 20%, and themarket for pulpwood developed strongly in responseto increased demand. Stocks of pulpwood at the endof 1973 were very low, in sharp contrast with theprevious year.
There are few reliable indicators to show howproduction of fuelwood changed in 1973. It seems,however, that any tendency for fuelwood produc-tion to fall in the developed countries is likely tohave been more than offset by increases in the useof fuelwood in developing countries, which willhave gained impetus from the rise in cost of alter-native fuels. Wood is important as a domestic and
1969 1970 1971 1972 19731Change1972 to
1973
1961-65 average 100 .. Percent
DEVELOPED MARKETECONOMIES 110 112 114 116 119 +3
Western Europe . . . . 106 113 113 109 112 +3North America . . . 115 115 118 124 129 +3Oceania, developed . . 115 116 118 120 124 +3Other developed market
economies2 95 92 90 88 91 13
DEVELOPING MARKETECONOMIES 121 125 129 129 139 +8
Latin America 115 120 123 124 134 +8.Far East 3 127 131 134 138 149 +8Near East 4 122 118 118 116 117 +1Africa 5 119 122 126 123 133 +8
Eastern Europe and theU.S.S.R. 103 107 107 107 108 +1
Asian centrally plannedeconomics 115 118 120 125 126 +1
WorIcl 112 114 116 117 120 +3

industrial fuel in developing countries, and recentdifficulties in obtaining alternative fuels have ledthem to show increased interest in the possibil-ity of both using and growing more wood for fuel.
SAWNWOOD
World production of sawn softwood increased byabout 3% in 1973, reaching 345 million cubic metres,mainly as a result of greater production in westernEurope. There were significant increases in produc-tion in Finland and Sweden, and some growth alsooccurred in Austria, the Federal Republic of Ger-many, and Poland. Production of sawn softwoodin North America was 109 million cubic metres,compared with 106 million cubic metres in 1972,owing to an increase in Canadian production.United States production remained unchanged, asdemand for sawn softwood eased slightly. Theoutstanding feature of the sawn softwood marketin 1973 was the rapid rise in prices in all regions ofthe world; prices more than doubled in many in-stances. The volume of trade increased by about9%, while its value grew by about half. Exports fromthe main exporting regions, North America andwestern Europe, reached a peak level of 48 millioncubic metres. The increase from western Europewas exceptionally high, total exports rising by 2.4million cubic metres to reach 20.3 million cubicmetres, 13% above 1972. Imports into westernEuropean countries also increased by 10% to reacha record level of 28 million cubic metres, resultingin a slight increase in net imports, which had beendeclining since the mid-1960s.
World sawn hardwood production increased bynearly 5% in 1973, reaching an estimated recordlevel of 98 million cubic metres. Production rosein western Europe by 7% and in developing coun-tries by nearly 9%. Demand was notably strong inmost importing countries during the first half of theyear, owing to the low level of stocks at the end of1972 and to the vigorous activity prevailing inconsuming sectors such as furniture manufacture. Atthe end of 1973, supply and demand appeared in mostcountries to have reached an equilibrium, with stockswell replenished and demand continuing relativelyhigh. Exporting countries of southeast Asia seemto have strengthened their trading position, supply-ing most of the increased demand for tropical hard-woods, at least until the freight situation createddifficulties. In 1973 imports in North America roseby 14% and in western Europe by 40%.
Prices on international markets, especially for trop-ical species, increased sharply, reflecting the prevail-ing demand. Prices for temperate hardwoods fol-lowed the same trend after some delay and rose sub-
40
stantially toward the end of the year. The overallincrease of 15% in the volume of trade was asso-ciated with an increase in value of 47%. For trop-ical hardwoods from developing countries, volumeincreased by 7% and value by 52%.
WOOD-BASED PANEL PRODUCTS
Wood-based panels had a very good year in 1973for all three groups of products particle board,plywood, and fibreboard. World production of par-ticle board continued to expand at a higher rate thanother wood-based panels. As in preceding years,and owing to the heavy demand, the expansion tookplace mainly in the developed countries of NorthAmerica and in Europe, where a rate of growth ofmore than 18% was reported in the productionof Austria, Belgium, Finland, Spain and Sweden.During the second half of 1973, however, therewas some difficulty in the procurement of thewood raw material in several countries because ofcompeting demand for small-sized wood from thepulp and sawmilling industries. Certain types ofglue were also in short supply. The strong demandfor particle board was also reflected in a vigorousexpansion of trade, largely confined to Europe.Increases in exports of more than 40% were re-corded in Austria, Finland, the Federal Republicof Germany and Sweden, while imports into theUnited Kingdom increased by 14%. The fasterexpansion of the particle board trade in 1973 is atleast partly explained by the high level of activityin the building and furniture sectors and by thefact that price increases of other forest productswere greater than those of particle board.
In western Europe imports of plywood grew by26% in 1973, while production and exports increasedby only 8%; as a result, apparent consumption ofplywood rose by 17% to 5.7 million cubic metresand net imports by 47%. As the United Kingdomalone accounted for more than half of the totalEuropean increase, the importance of this countryas a major importer is clear. Southeast Asia strength-ened its position in international trade in plywood,increasing its exports to the United Kingdom bynearly 90%. Japan's plywood production increasedby nearly 10% while imports grew by 20%, bothstimulated by the boom in the construction industry.Demand eased at the end of 1973, however, as houseconstruction seemed to level off. The Japaneseplywood industry has been growing at a much lowerrate since 1970 despite the high rate of building, andit is expected that the increase in demand will bemet mainly by imports from Indonesia, Malaysiaand the Philippines, where plywood industries areexpanding vigorously. There were substantial price

increases on international markets, especially duringthe first half of the year, followed later on by increasesin domestic prices in the major consuming countriesin response to rises in the cost of imported plywoodlogs. Wholesale price indices rose in 1973 by 20%for okoumé plywood in France, and by 18% fordomestic plywood in the Federal Republic of Ger-many.
World production of fibreboard increased by 8%in 1973, a higher rate than the long-term rate ofgrowth. This expansion came from an increase inoutput of hardboard panels, as production of non-compressed panels remained stable or tended to de-cline in all regions. Prices of fibreboard also tendedto rise, although more moderately.
PULP AND PAPER
Production of wood pulp increased by 4% in 1973as a result of the strong demand, in all regions ofthe world. This was still not sufficient to meet thedemand from the paper-making industry, which hadto make increasing use of wastepaper. The recoveryof the pulp and paper sector in North America tookplace in 1972, and major increases in wood pulpproduction were reported for that year. Productionreached 60 million tons in 1973. Meanwhile therewere increases of 10% in western Europe and 7%in Japan. Trade in wood pulp also increased byapproximately 10% and its value rose by 29%.Japan's imports of wood pulp reached 1.1 milliontons, an increase of 37% over 1972.
World production of paper and paperboard in-creased by 6% in 1973, with expansion of all typesof paper and board except newsprint. Output ofnewsprint remained stable, and this led to a wors-ened supply/demand imbalance. Major increases inproduction took place in western Europe (9%) andin Japan (20%). Capacity was in full use almosteverywhere at the end of 1973, and the industrywas unable to meet further increases in requirementsfor many products and in most regions.
The price of pulp increased by about half betweenJuly 1973 and July 1974. Similiar rises were recordedfor paper and paperboard. Great difficulty in ob-taining pulp and paper supplies has been experiencedin countries which have not entered into long-termcontracts with suppliers, and spot market priceshave often risen to very high levels. Improved priceshave substantially modified the prospects for theseindustries, which have had to face rising costs notonly in normal production items but also for environ-mental protection and energy conservation, whilethe capital requirements for new investment havebeen growing sharply. The current improved returnsand buoyant demand may prove sufficient incentives
41
for the pulp and paper industry to make new tnvest-ments to expand its production capacity.
Forest policies
DEVELOPED COUNTRIES
Forestry in the developed countries has continuedto be affected by the heightened impact of environ-mental considerations on forest policies and inter-pretation of them. The oil shortage and the greatlyincreased cost of oil also introduced a significant newelement into forestry in many countries.
In the United States there have appeared a numberof important studies which reflect growing publicinterest and involvement in the formulation of forestpolicy and illuminate the main areas of concern.Principal among these is the need for more balancedmanagement of forests to improve non-timber bene-fits, such as amenity and recreation, and more in-tensive management within this framework to ensurea continued flow of timber products to meet thenations' physical needs for wood-based buildingmaterials and other products. Among, these studiesare a new review of the outlook for wood and woodproducts in the United States, a report of the Presi-dent's Advisory Panel on Timber and the Environ-ment, and a draft long-term forestry plan, entitledEnvironmental programme for the future. The re-ports conclude that growing demands for timber andother services of the forest can be met in the decadesahead without substantial increases in the prices ofwood and wood products and without jeopardizingenvironmental quality, through intensified manage-ment of all forest lands. Emerging features of thepublic planning and management process are moredirect contact between forest land managers and thepublic and the growing practice of preparing "en-vironmental impact" statements for practically anyaction which might disturb the forest.
In Canada, as a result of environmental aware-ness, the Lands, Forests and Wildlife Service hasevolved into an Environmental Management Servicewithin the Department of the Environment. In ad-dition to its responsibilities for research and develop-ment in relation to federal interests in forests, lands,wildlife and inland waters, the Service has been givenresponsibility for environmental impact assessmentof major new developments. Concern for more ef-ficient and effective management of forests was evi-dent in a number of studies and developments atthe provincial level. For example, in New Bruns-wick, enabling legislation has been passed to cancelall licences on Crown forest lands in favour of sell-ing wood to the mills without giving up rights tothe land. Furthermore, new legislation enables theformation of a Crown corporation to harvest and

distribute wood from Crown lands if efficient distri-bution cannot be achieved in the private sector.
Also in Europe the role of forestry in improvedland use and as a tool for rural development hasreceived attention. The EEC Commission has sub-mitted a proposal designed to encourage in itsmember countries afforestation of marginal farm-lands and improvement of less productive and un-productive forest areas. A major element in thereformulation of forest policy in the United Kingdomhas been the role of forestry in creating jobs morejobs than agriculture in areas subject to undesir-able depopulation.
Another element has been the recreational role offorests and the need to tailor new planting to criteriaof amenity. Increasing recreational demands havealso resulted in the establishment of new parks,notably in Hungary and Poland. The Council ofEurope has initiated a chain of protection areas alongthe main migration routes of birds through Europe.In Europe there is now a tendency, reinforced bylegislation, to reduce the use of chemicals in forestryto the absolute possible minimum; fertilization, whichhas been a means of improving timber growth andrevenues, is being reduced as a result.
The Forestry and Wood-based Industries Develop-ment Conference (FoRwooD) held in Australia was ajoint initiative of State and Federal governments,research bodies, and forestry and wood industries.Eight widely representative panels had worked forabout two years to prepare reports which wouldenable FORWOOD to consider the place of the forestand the forest products industry in the economic andcommunity life of Australia. The Conference wasconcerned with the whole range of topics related tothe forest and forestry: recreation, soil protection,watershed management, wildlife and conservation, aswell as wood. Environmental issues loomed large inthe discussions. Conservationist concern was focusedon certain large export chipping operations in natu-ral eucalypt forests and on the pine planting pro-gramme, as man-made forests of exotic pine speciesrepresent a rapidly growing share of Australia's in-digenous wood supply. Discussions at FORWOOD wentfar toward allaying conservationist criticism, as someStates were able to show model examples of multi-purpose forestry.
As regards productive forestry the dramatic rise inthe price of oil has introduced an important newelement into the pattern and level of wood use. InEurope, for example, wood has in many areas becomemore competitive as a fuel, thus creating outlets forwood qualities and sizes which could not be disposedof earlier. This situation has also tended to divert tofuel use some wood processing residues which wereearlier used as raw material for the pulp and boardindustries.
42
DEVELOPING COUNTRIES
The energy crisis is likely to prove lo have a farmore fundamental effect on forestry in developingcountries. By far the greater part of all wood pro-duced and consumed in developing countries is usedas fuel. In many areas this demand exceeds localforest supplies, leading to the progressive removalof all woody cover to the detriment of soil stabilityand protection against water and wind erosion. Themajor increases in oil prices will inevitably retard,if not reverse, the substitution of kerosene for woodfuel and therefore increase these detrimental pressureson the environment. In many countries a renewedeffort is probably going to be needed to meet acontinuing and possibly rising demand for woodfuel through afforestation and a greater use ofcharcoal.
The protective and rural role of forestry was em-phasized by the Sahelian drought, which affectedUpper Volta, Mali, Mauritania, Niger, Chad and theGambia and extended into Ethiopia. During theOuagadougou Ministerial Meeting, 7-10 September1973, the first six countries named above proposedthe creation of a Sahelian "green front" by large-scale reforestation to change the macroclimate andslow down the advance of the desert. While thereexist doubts as to the favourable effects of reforesta-tion on more than the local ecological conditions andas to the technical feasibility of and financial re-sources for such a large-scale programme, it is evidentthat improved and expanded forest management mustconstitute an integral part of rehabilitation of theSahel. The national forestry services in the countriesconcerned are committed to undertake a major for-estry programme in collaboration with the UnitedNations and its Specialized Agencies; it is part of thiscommitment to determine more precisely the possi-bilities and limitations of forestry in the area.
The widespread conditions for exceptionally effi-cient and rapid production of wood for industryprovided by man-made forests of quick-growing spe-cies continued to be reflected in expanding afforesta-tion programmes in many developing countries. Inthe past year an increasing number of such plantationdevelopments reached the stage at which work couldcommence on the planning or implementation of theprocessing phase. In Africa, for example, suchstudies were carried out or initiated in Kenya,Malawi, Madagascar, Nigeria, Tanzania and Zambia.In Asia, industrial afforestation efforts have beenintensified in India and the Republic of Korea aswell as in other countries. In Latin America, Brazilis continuing its massive programme both of plantingand of the construction of pulp and paper manufac-turing capacity to process wood from its man-madeforests.

Interest in plantation-grown pulpable woods washeightened during the year by the acute world shortageof pulp, in particular for cultural papers. The short-age, along with the exceptional rise in prices, hasparticularly affected developing countries, most ofwhich heavily depend on imports for their suppliesof pulp and paper. This situation, which is likely topersist for several years unless global demand slack-ens, has reinforced the need for expansion of pulpmanufacturing capacity in developing countries.
The pulp shortage has also heightened interest innatural tropical forests as a potential source ofpulpable fibre; at present these forests are very sel-dom used for this purpose. The harvesting of tropicalforests for lumber and other products continued ona massive scale. There was also a further hugereduction in the area of productive tropical highforest due to agricultural encroachments of varioussorts. Rising concern about the rate at which theseforests are being destroyed or depleted and thepossible economic, social and environmental implica-tions has led FAO to organize a worldwide technicalconference on tropical moist forests, which will beheld in Brazil from 22 September to 3 October 1975.
In the Far East, the principal tropical hardwoodproducing area, a noticeable development has beenthe move toward implementing earlier policy deci-sions to increase the amount of timber diverted todomestic processors as opposed to exportation inlog form. The creation of various timber industryboards is a step in this direction, whereas the Philip-pines adopted a comprehensive forestry reform code
The World Food Conference, held in Rome from5 to 16 November 1974, was one of several majorrecent actions within the United Nations system toreorient the approach to economic and social devel-opment and to review international economic relation-ships with the principal objectives of securing betteruse of the world's resources and the attainment ofsocial justice. The stated aims of the Food Con-ference included possible action programmes to in-crease food production in the developing world,improve the consumption and distribution of food,achieve a better system of world food security andbring about a more orderly system of agriculturaltrade and adjustment. The themes of the other twoUnited Nations Conferences held in 1974 were popu-lation and the law of the sea. All three Conferencesplaced emphasis on selected aspects of the inter-locking set of social and economic problems with
43
to accomplish this and other objectives. Similarly,efforts have been intensified to exert greater controlover concessionaires.
Continued efforts to strengthen overall administra-tive capacity for forestry development have been evi-dent in many countries, particularly in Latin America.An interesting example of forceful institutional re-form in a small country well-endowed with forestresources is the Corporación Hondureña de Desa-rrollo Forestal (Honduran Forestry DevelopmentAgency), a semiautonomous state agency establishedin January 1974. The purpose of this agency is toensure optimum utilization, protection and improve-rnent of public and private forest resources and theircontribution toward accelerating the country's socialand economic development. A similar agency estab-lished in Guatemala in June 1974 is the InstitutoNacional Forestal (National Forestry Institute).
In Chile, the Corporación Nacional Forestal isactively involved in regional planning and has in-troduced a programming manual. In Ecuador, theForest Service has been experimenting with an ad-vanced system of programming, budgeting and con-trol and emphasizes public relations. In Colombia,sectoral planning for forestry and its links with na-tional planning has been successfully developed. InMexico, the "organization and methods" approach toadministrative efficiency is being applied to the For-est Service with far-reaching goals and considerableskill. In Peru, forestry personnel development, in-cluding continuing education and systematic evalua-tion, is receiving great attention.
The United Nations World Food Conference and Other SpecialUN Conferences, 1974
which the world is faced. In addition, the SixthSpecial Session of the United Nations General As-sembly, held from 9 April to 2 May 1974, was spe-cifically concerned with control, production and ex-change of the world's raw material resources andadopted a Declaration governing their future use.Earlier there had been United Nations Conferenceson human rights (Tehran, 1968) and on human en-vironment (Stockholm, 1972); in the future there areto be Conferences on the status of women (Bogotá,1975), human settlements (Vancouver, 1976) andwater (Buenos Aires, 1977).
World Food Conference
The convening of a world meeting on food wasdiscussed at the Conference of Non-Aligned Countries

44
A detailed review of the world food situation,present and future, was drafted for the secretariat ofthe World Food Conference by its Preparatory Com-mittee, together with proposals for national and in-ternational action to resolve the world food problem.The proposed action programmes kept in view thewider framework of development and the goals andobjectives agreed upon by governments in the contextsof the Second United Nations Development Decadeand the Declaration on the establishment of a NewInternational Economic Order adopted at the SixthSpecial Session of the United Nations General As-sembly. Special importance was attached to effectiveimplementation and follow-up of the action pro-grammes. The first major resolution approved by theWorld Food Conference declared that "all govern-ments should accept the removal of the scourge ofhunger and malnutrition ... within a decade," andthat "highest priority should be given to policies andprogrammes for increasing food production and im-proving food utilization in developing countries, soas to achieve a minimum agricultural growth rate of4% per annum." The Conference called for fivemain initiatives:
A World Food Council to coordinate the activitiesof various international agencies in the agricul-tural field. The Council would be establishedat the ministerial Or plenipotentiary level andfunction as an overall coordinating mechanismfor policies concerning food production, nutrition,food security and food aid, as well as otherrelated matters of concern to all the agencies ofthe United Nations system. The Council member-ship would consist of Member States of theUnited Nations or of its Specialized Agencies, in-cluding the International Atomic Energy Agency,and would be nominated by the Economic andSocial Council and elected by the General As-sembly. The Council would be serviced withinthe framework of FAO, and its secretariat will belocated in Rome.
An International Fund for Agricultural Develop-ment to channel additional investment funds forincreasing food and agricultural production in thedeveloping world. Contributions would be vol-untary, both by those nations which are tradi-tional sources of foreign assistance and by devel-oping countries with ample means. The Fundwould be established by the Secretary-Generalafter he had determined, in consultation withMember States, that sufficient resources would bemade available by this means to give "a reason-able prospect of continuity." The Board of Di-rectors of the proposed International Fund forAgricultural Development would report periodi-
held in Algiers from 5 to 9 September 1973. ThisConference urged that in the context of the seriousfood crisis confronting vast areas and populationsof the world, an emergency joint conference of FAOand UNCTAD should be convened at the ministeriallevel for the purpose of formulating a programmeof international cooperation to overcome increasingshortages of food and other commodities and tomaintain stable prices.
The subject was raised again by the Secretary ofState of the United States, Henry Kissinger, duringthe 28th Session of the General Assembly, in Sep-tember 1973. Noting "the growing threat to theworld's food supply," Dr. Kissinger announced the"United States proposal that "a World Food Con-ference be organized under United Nations auspicesin 1974 to discuss ways to maintain adequate foodsupplies, and to harness the efforts of all nations tomeet the hunger and malnutrition resulting fromnatural disasters."
In its 28th Session on 17 December 1973 theUnited Nations General Assembly, following a rec-ommendation by the 1973 FAO Conference, decidedto convene a World Food Conference, under theauspices of the United Nations, for about two weeksin November 1974, in Rome, with the followingagenda:
Assessment of the world food situation based onthe reports of the Secretary-General of the Con-ference and the Preparatory Committee.
National and international programmes of action:Measures for increasing food production indeveloping countries within the wider frame-work of development.Measures for increasing food production indeveloped countries.
(e) Policies and programmes for improving con-sumption patterns in all countries, also aimedat ensuring adequate availability of food indeveloping countries, particularly to vulner-able groups.Strengthening of world food security throughsuch measures as better early warning andfood information systems, more effective na-tional and international stockpiling policiesand improved arrangements for emergencyrelief and food aid.Specific objectives and measures in the areaof international trade and adjustment relevantto the food problem, including measurestoward stabilization and expansion of marketsfor exports from developing countries.
(i) Arrangements for following up the recom-mendations and resolutions of the Conference,including appropriate operational machinery.

cally to the World Food Council and take intoconsideration its advice and recommendations.
A Consultative Group on Food Production andInvestment in Developing Countries (cGFpt) com-posed of bilateral and multilateral donors andrepresentatives of developing countries and or-ganized jointly by FAO, the World Bank and theuNnp. This Consultative Group would keep theWorld Food Council informed of its activities toincrease, coordinate and improve the efficiency offinancial and technical assistance to agriculturalproduction in developing countries.
The International Undertaking on World FoodSecurity, initiated by FAO, was fully endorsed. Tostrengthen work in this field, the Conference rec-ommended that FAO establish a Committee onWorld Food Security as a standing committee ofthe FAO Council. This Committee would submitperiodic and special reports to the World FoodCouncil. The Conference also resolved that aGlobal Information and Early Warning Systemon food and agriculture should be establishedand agreed that FAO was the most appropriateorganization to operate and supervise the system.It requested all governments to participate in thesystem on a voluntary and regular basis.
An improved policy for food aid with bettercoordination between bilateral and multilateralfood aid programmes. The Conference recom-mended the reconstitution of the World Food Pro-gramme's Inter-Governmental Committee as aCommittee on Food Aid Policies and Pro-grammes. The Conference also approved acommitment to provide, on a three-year forwardplan basis, commodities and financing for foodaid to a minimum level of 10 million tons ofcereals per year plus certain other food com-modities.
Left unresolved by the Conference was the questionof how urgent short-term food needs could be metin a number of critically affected areas. However,informal gatherings among major cereal exportersand importers called during the Conference bythe Director-General of FAO led to a full-scale meetingof these countries on 29 November 1974.
The question of agricultural trade, a controversialissue throughout the Conference, was dealt with ina resolution which recognizes the relationship betweenworld food problems and international trade. Ineffect this resolution gives political impetus to theongoing activities of the United Nations Conferenceon Trade and Development (uNcTAD) and the GeneralAgreement on Tariffs and Trade (GATT).
45
The trade resolution gives high priority to im-proved access for agricultural and food productsfrom developing countries in the markets of theindustrialized world. It asks governments to devise,through appropriate organizations, effective steps todeal with the problems of stabilizing world foodmarkets and to take measures to prevent speculativepractices which disrupt markets. Developed nationsare urged "in the determination of attitudes towarddomestic farm support programmes to take intoaccount the interests of food exporting developingcountries." 1
The vital role of fertilizers and pesticides in in-creasing food production was recognized by theConference. It noted the recent increased activityof the international community in respect to fertil-izers, including the establishment of the FAO Com-mission on Fertilizers, the International FertilizerSupply Scheme and the funding operations of theUnited Nations Emergency Operation (uNEo) andrecommended that during the current period of supplyshortages and high prices increased material andfinancial support should be given to the InternationalFertilizer Supply Scheme. Among its recommenda-tions was that FAO, UNIDO and the World Bank jointlyorganize a programme to assist developing countriesin improving the efficiency of their fertilizer plantoperations. As for pesticides, the Conference calledfor an urgent government and industry consultationon the whole problem, including very short supplies,standardization of regulatory procedures and alter-native methods of pest control.
In addition to proposals for the main follow-upaction, the Conference also passed resolutions dealingwith specific aspects of the world's food problem andagricultural development, including:
priorities for agricultural and rural development;
food and agricultural research, extension andtraining;
This " Urgent Consultation " on cereal supply and ways ofmeeting short-term requirements of developing countries wasconvened by the Director-General at FAO Headquarters, Rome.It agreed that the uncovered import requirements of the " mostseriously affected " (msA) countries in 1974/75 could be estimated,on the basis of current conditions, to be of the order of 7.5million tons of wheat, rice and other cereals, and that the uncom-mitted cxport supplies of cereals available for shipment in therest of the season up to 30 June 1975, as currently foreseen,were sufficient to satisfy the estimated uncovered import require-ments of the NBA countries, as well as to meet the known needsof other importing countries. The exporting countries gaveassurances that all possible action was being taken to maximizethe 1974/75 export availabilities and confirmed that they have themeans to keep a close watch on the destinations and quantitiesof grain exports. These procedures should help to ensure thatthe available exportable supplies required for immediate humanconsumption in importing countries are not directed into unnec-essary stockpiling or less essential uses, and that the urgent needsof msn countries are not prejudiced.
From the Consultation it appeared that as much as one fourthto one third of the yet uncovered import requirements of msncountries might be met by present food aid programmes.

policies and programmes to improve nutrition;
world soil charter and land capabilities assess-ment;
scientific water management: irrigation, drainageand flood control;
greater involvement of women in decision-makingon food and nutrition policies;
achievement of a desirable balance between popu-lation and food supply;
programme for the control of African animaltrypanosomiasis;
seed industry development;
reduction of military expenditures in favour ofincreasing food production;
food aid to victims of colonial wars in Africa.
The Conference requested that greater emphasisbe given to social criteria in rural development pro-grammes. National, regional and international re-search institutions were requested to intensify theirefforts on a wide range of subjects, from the improve-ment of the nutritional quality of both conventionaland nonconventional foods, to the opening up of newlands and a better understanding of the motivationof rural people. FAO, in cooperation with WI-10,
UNICEF, WFP and other international agencies, wasrequested to prepare a project proposal for assistinggovernments to develop intersectoral food and nu-trition plans. The Conference recommended that allgovernments and international agencies, such as FAOand wmo, take urgent action to develop agriculturalwater supply, safeguard its use and improve theadministration and management of water deliverysystems.
A Declaration on the Eradication of Hunger andMalnutrition, adopted by the Conference, sets forththe basic aims of all follow-up activities, maintainingthe right of "every man, woman and child ... to befree from hunger and malnutrition" and the "fun-damental responsibility of the governments to worktogether for higher food production and more equi-table and efficient distribution of food betweencountries and within countries."
Sixth Special Session of the United Nations GeneralAssembly
The main outcome of this Special Session, held onthe initiative of President Boumedienne of Algeriawith wide support from other Member Nations, were
46
the declaration on the establishment of a New In-ternational Economic Order and a Programme ofAction for its implementation. The declaration laysdown certain basic principles concerning the sover-eignty of states over their natural resources, the needfor equitable terms of trade for developing countries,for improvements in the position of natural oversynthetic raw materials, preferential treatment of theexports of developing countries, conservation of natu-ral resources and the role which producers' asso-ciations may play in accelerating the development ofdeveloping countries.
The Programme of Action covers a wide range ofmeasures. In general, it calls on governments, par-ticularly of the developing countries, to take stepslo bring about accelerated development and "tofacilitate the functioning and to further the aims ofproducers' associations, including their joint market-ing arrangements, orderly commodity trading, im-provement in export income of producing developingcountries and in their terms of trade, and sustainedgrowth of the world economy for the benefit of all."It also requires that all efforts be made to evolve ajust and equitable relationship between the prices ofgoods exported by developing countries and thoseimported by them, including appropriate measuresto reverse the continued stagnation or decline in thereal price of several commodities exported by thedeveloping countries, as well as to expand the marketsfor natural products in relation to synthetics and topromote the processing of raw materials in the de-veloping producer countries. Regarding food, theProgramme of Action stipulates that developed coun-tries, in framing their food policies, make every effortto take full account of the interests of developingcountries and to ensure that the latter can import thenecessary quantities of food without undue strain ontheir balance of payments. It stresses that concretemeasures should be undertaken to increase foodproduction and storage facilities in the developingcountries by, among other means, ensuring an in-crease in all essential inputs, including fertilizers,from developed countries on favourable terms. Italso provides for exports of food products from de-veloping countries to be promoted through just andequitable arrangements, including "the progressiveelimination of such protective and other measures asconstitute unfair competition."
Regarding general trade, the Programme of Actionurges that all efforts be made to undertake measuresfor the amelioration of the terms of trade and forthe elimination of chronic trade deficits of developingcountries, and it insists on the principles of non-reciprocity and preferential treatment for the exportsof developing countries. It mentions, in particular,improved access to markets in developed countriesthrough the progressive removal of obstacles to trade,

the implementation, improvement and enlargementof the Generalized System of Preferences and "thesetting up of general principles for pricing policy forexports of commodities of developing countries witha view to rectifying and achieving satisfactory termsof trade for them." To the same end, the Pro-gramme of Action calls for efforts to secure theexpeditious formulation of commodity agreementswhere appropriate, together with the setting up ofbuffer stocks within the framework of commodityarrangements and the preparation of an overall in-tegrated programme for a comprehensive range ofcommodities of export interest to developing coun-tries. Reimbursement to the developing countries ofthe taxes and duties levied on their goods when im-ported by the developed countries is proposed, and,where necessary, the adoption of improved com-pensatory financing schemes for meeting the needs ofthe developing countries is also suggested.
The General Assembly also adopted a special pro-gramme to provide emergency relief and developmentassistance to the developing countries most seriouslyaffected by the present economic crisis, natural ca-lamities and foreign aggression and occupation. Asa first step in the programme, the Assembly requestedthe Secretary-General of the United Nations to launchan emergency operation to provide timely relief tothe most seriously affected developing countries forthe purpose of maintaining, unimpaired, essentialimports over the coming months. This is to be fol-lowed and succeeded by a special fund, to be estab-lished on 1 January 1975, for providing emergencyrelief as well as development assistance.
World Population Conference
The main outcome of the United Nations WorldPopulation Conference, held in Bucharest from 19to 30 August 1974, was the adoption of a WorldPopulation Plan of Action. It represents the formalrecognition by governments of the legitimacy of andnecessity for population policies as an integral partof overall policies for economic and social develop-ment. Food and agricultural problems and the ruralsector as a whole received considerable attention atthe Conference.
The major Conference recommendations of concernto FAO were the following:
Governments should develop national policiesand programmes relating to the growth and distri-bution of their populations.
In formulating measures lo harmonize popula-tion trends and socioeconomic change, plans foreconomic and social development and for interna-
47
tional assistance for this purpose should emphasizethe health and educational aspects. Likewise,patterns of production and technology should beadapted to each country's endowment in humanresources. Decisions to introduce technologies thatwould afford significant savings in manpower musttake into account the relative abundance of humanresources. To this end, efforts should be intensifiedto determine for each country the technologies andproduction methods that are best suited to itsworking population and to study the relationshipbetween population factors and employment.
In order to increase the production and distri-bution of food for the growing world population,governments should give high priority to improvingmethods of food production, to investigating anddeveloping new sources of food and to more ef-fectively utilizing existing sources.
Developing countries should consider the pos-sible economic, social and demographic effects ofpopulation shifts from agriculture to nonagricul-tural industries.
Highest priority should be given to the reductionof high death rates. National and internationalefforts to reduce general morbidity and mortalitylevels should be accompanied by efforts to eradicateundernutrition and malnutrition and to improvehealth and nutritional conditions which adverselyaffect working-age populations and their produc-tion, and thus development efforts. To this effect,health and nutrition programmes designed to re-duce morbidity and mortality should be integratedwithin a comprehensive development strategy andsupplemented by supporting social policy measures.
Countries should encourage appropri ate educa-tion, in both rural and urban areas, for responsibleparenthood and make available to persons who sodesire advice and the means of following it. Wher-ever needed and appropriate, use should be madeof adequately trained professional and auxiliaryhealth personnel, rural extension, home economistsand social workers and nongovernmental channels.
Governments should ensure full participation ofwomen in the educational, economic, social andpolitical life of their countries on an equal basiswith men. The economic contribution of womenin the household and farming should be recognizedin national economies.
Countries should be encouraged to develop botha continuing capability for taking multisubjecthousehold surveys and long-term plans for securing

statistics of various demographic and inter elatedsocioeconomic variables on a regular basis.
Training in population matters should be ex-tended to labour, community and other socialleaders and to senior government officials, so thatthey will better be able to identify the populationproblems of their countries and communities andto help in the formulation of related policies.
All countries should further develop their formaland informal programmes for promoting educationamong youth and should abolish factors discrimi-nating against women.
Governments should use all available means fordisseminating population information, among bothrural and urban populations, through the assis-tance of governmental agencies.
Policies should be developed to reduce the un-desirable consequences of excessively rapid ur-banization and to develop opportunities in ruralareas and small towns. Intensive programmes ofeconomic and social improvement should be carriedout in the rural areas through balanced agriculturaldevelopment, so as to provide better income forthe agricultural population, permit effective ex-pansion of social services and afford measures toprotect the environment and conserve and increaseagricultural resources. In rural arcas and areasaccessible to rural populations, new employmentopportunities, including industries and public worksprogrammes, should be created, systems of landtenure improved and social services and amenitiesprovided.
National efforts should be intensified, throughexpanded research programmes, to develop knowl-edge of social, economic and political interrelation-ships with population trends. Work on projectionsof demographic and related variables should beencouraged.
International, intergovernmental and nongovern-mental agencies and national governments shouldincrease their ability to provide assistance in thepopulation field on request.
The Conference also adopted seventeen substantiveresolutions, a number of which further strengthenedthe above recommendations.
The World Population Plan of Action is to beclosely coordinated with the International Develop-ment Strategy for the Second -United Nations Devel-opment Decade and other sectoral international strate-
48
gies, such as FAo's Indicative World Plan for Agri-cultural Development and the Concerted Action forthe Advancement of Women.
Conference on the Law of the Sea
The first session of the Third 'United NationsConference on the Law of the Sea, held in New Yorkfrom 3-14 December 1973, dealt with the organi-zation of the Conference itself; the second sessionwas held in Caracas, Venezuela, from 20 June to29 August 1974. Few expected that the 148 coun-tries invited to take part would be able to restoresome law and order to the world's oceans in thisten-week Conference. A further Conference, in 1975,was foreseen from the start, and a decision wasreached to hold it in Geneva from 12 March to3 May. Resumption in March rather than July, aswas originally planned, will improve the chances ofconcluding a treaty before the end of 1975.
Nearly all countries that took part in the Con-ference referred in some detail to jurisdiction overfisheries and problems of fishery conservation andmanagement. The legal nature and breadth of areasunder national jurisdiction and the claims and rightsof nations over living resources in those areas re-ceived the greatest attention. Another importantmatter before the Conference was the management ofhighly migratory species and of anadromous species(e.g., salmon). The regime which should govern fish-eries in areas beyond national jurisdiction was alsodiscussed.
The main areas of agreement are becoming clear.Claims by coastal countries to 12 miles of territorialwater, already claimed by about sixty governments,might well be generally accepted; so, probably,will the principle of their special rights in a muchlarger economic zone, most likely extending 200 milesfrom shore. The status of the ocean beyond thesezones will be subject to considerable discussion. How-ever, the taking of minerals from the ocean floor isexpected to be controlled by a new internationalauthority, and all countries will be required to acceptcurbs on their freedom to pollute the sea. Thesegeneral propositions have met with widespread agree-ment. It is in connexion with their implementationthat difficulties arise. For example, a universal12-mile rule would turn more than one hundred im-portant straits into territorial waters. Problems ariseover islands and archipelagos with the 200-mile zones.Then, the powers of the proposed seabed authorityhave produced major differences between the mainindustrialized countries and the developing ones. Thedebate concerns whether the authority is to be obligedto award seabed mining contracts to companies that

comply with terms to be specified in the Treaty orwhether the authority itself is to have wide discretion-ary powers and the right to undertake mining itselfthrough joint ventures. The recommendation onpollution control has already received broad agree-ment, but it is only general in nature. At presentthere seems little prospect for the creation of astrong international system that will effectively induce
49
coastal and maritime countries to refrain from pol-luting the seas. A number of sectoral or regionalagreements to protect the marine environment againstpollution are however being concluded outside theframework of the Conference.
These are the issues to be presented for decisionat the next session of the Law of the Sea Conferencein 1975.

Agricultural policies and problems
In general, production price policies have allowedincreases to farmers which are sufficiently high totake account of their considerable increase in costs,but not so large as to intensify general inflation.
Prices for the 1974/75 campaign have been fixed inDenmark, Ireland and the United Kingdom withinthe framework of a progressive alignment with EECprices. In the United Kingdom the dairy sector hasbeen the most seriously affected by the increase infeed prices. That is why the Annual Reviewwhich fixes guaranteed prices and subsidies has raisedthe standard quantity of milk production (the volumewhich benefits from guaranteed prices) by 6% andthe guaranteed price by 7%. There have been thefollowing increases for other products: wheat andbarley 8%, oats 7%, potatoes 29% and lamb andmutton 11%. The guarantees for eggs and sugar beetwere abolished at the end of 1973/74 in accordancewith previous decisions. In Denmark the differencesbetween national prices and EEC prices are now rela-tively small: only about 10% for dairy productsand less for cereals, eggs, pork and poultry.
In Sweden farm prices continue to be fixed byperiodic agreements between the Government andprofessional organizations, although certain new prin-ciples have been introduced into this bargaining ar-rangement. In 1974, as in 1973, the Government puta freeze on consumer prices of essential food itemsand paid subsidies to farmers as part of the pro-gramme. A new agreement on prices, with specialprovisions to compensate farmers for increases inproduction costs, came into force on 1 July 1974;in particular, the agreement stipulates that remunera-tion for agricultural work adhere to that of the na-tional labour market. Also, some price supplementswill be paid to certain categories of milk producers.In addition to the annual price agreements, it hasnow been decided to review farm prices twice a yearbecause of the recent sharp increases in productioncosts and in prices on the international markets.
In Norway, where the level of agricultural prices
Chapter 2. - REVIEW BY REGIONS
Western Europe
51
has had to be increased to keep them in line withthe rise in consumer food prices, a new generalagreement on farm prices came into effect in themiddle of 1974.
In southern European countries, livestock (espe-cially meat) production has benefited most from gov-ernment measures. In Italy, meat imports (mainlyof beef and live cattle) have steadily increased inrecent years, as internal production only covers about25 to 30% of domestic consumption. In 1973 thetrade deficit for meat again increased, by 33%, equiv-alent to about half Italy's total trade deficit. Againin 1974, as in 1973, there has been a serious crisisin Italian cattle production with meat consumptiontending to fall because of high prices and with im-ports rising and domestic farm prices declining. AsItalian beef breeders increased slaughterings, pricesfell even more. Milk production was also cutduring the first half of 1974. At the beginning of1974, in order to restore confidence to the livestockindustry, the Government brought in a bill to encour-age cattle and sheep breeding. Within a five-yearplan covering 1975-79, and with a budget of 305 000million lire, regional programmes will give incentivesto production and to improvements in marketing.Loans will be made available for approved breedingprogrammes at low rates of interest. Within a pack-age programme, centres are to be established tosupply members with both calves and fodder andto buy back finished animals at guaranteed pricesprior to slaughter and marketing.
Also in Spain recent decisions have mainly con-cerned breeding. From June 1974 the slaughteringof cattle of less than 125 kilograms carcass weightis forbidden. Premiums are paid on a progressivescale based on slaughter weight for steers for thepurpose of encouraging the replacement of dairy bybeef cattle. The slaughtering of sheep of less than5 kilograms carcass weight is forbidden, and anextra payment is to be made for carcasses weighingmore than 13 kilograms.
In Greece, too, subsidies bave been introduced onyoung cattle imported for fattening, and financial aid

is being provided for improvement of local beefbreeds and importation of pedigree stock, as wellas for the extension and improvement of pastures.Finally, in 1973, four institutes were created in Por-tugal to supervise the production, processing andmarketing of cereals, olive oil and oilseeds, textilesand forest products.
The agricultural situation in the European Eco-nomic Community (EEc) in 1973/74 has been markedby three major factors: new relationships betweenCommunity prices and world prices, monetary insta-bility, and surpluses in certain commodity markets.Against this background the EEC Cominission pre-sented a programme of adjustment to the CommonAgricultural Policy (CAP) which provided a frameworkfor the decisions of the 1973/74 campaign. Also, inJune 1974, the United Kingdom after her first yearand a half of EEC membership presented a numberof radical proposals.
From the founding of the EEC until 1972/73, Com-munity farm prices were generally fixed well abovethose in world markets, necessitating certain financialmeasures for foreign trade in agricultural producenamely variable import levies and export refunds orbounties. Since the drastic price increases whichoccurred in the world market from about the middleof 1972, the relationship between Community farmprices and world prices has radically changed. Thegap between the two has become much smaller oreven reversed as world prices edged above Communityprices. In this new situation the Community decidedto end import levies and export refunds and to apply,instead, levies on exports of such commodities ascereals and cereal products, rice and sugar. For itemssuch as pigmeat, eggs and poultry, for which pro-duction costs depend largely on cereal prices, importlevies were sharply reduced in 1973/74.
These new relationships between world and Com-munity farm prices, even if only transitory, have hadcertain important consequences. New members ofthe Community, especially the United Kingdom, havebeen able to buy from it at better prices than on theinternational markets, probably encouraging the be-ginnings of a system of Community preference. Fur-thermore, the Common Market system has not onlygiven producers guaranteed prices, but also protectedconsumers from sharp increases in external pricesand speculative exports. However, the Communityhas liad to face the difficult task of establishing abalance between maintaining adequate supplies andreserves for the internal market and supplying itstraditional foreign customers.
Then, in 1973/74, more than in any of the preced-ing years, CAP has been influenced by the monetaryinstability which has affected most members of theCommon Market. In January 1974 the French francjoined the pound and the lira among the currencies
52
floating downward, the Deutschmark and the florinhaving been revalued in June and September 1973respectively. The agricultural sector has been par-ticularly influenced by monetary changes because CAPestablished guaranteed prices (intervention prices) ona unique basis, using a unit of account determined bya gold parity. Thus the decision of a country in theCommunity to change the value of its currency shouldnot, in theory, give rise to any difficulties, as agricul-tural prices expressed in the national currency wouldbe decreased if revalued and increased if devalued tokeep the same value in units of account. In reality,problems arise because governments are generallyopposed to this automatic effect on national prices: areduction in prices affects farm profit levels, for whichit is not always convenient or advisable to recompenseby direct payments (the solution chosen by the Neth-erlands in September 1973); a rise in farm prices maycontribute to further inflation.
Therefore, if a change in exchange rates is notfollowed by a revision of national farm prices, thosecountries which have revalued are at a disadvantage,as their national prices converted into units of ac-count become higher than general prices and thereforeless competitive than those of their partners, whereasthose which have devalued benefit from the rate ofexchange. Consequently there has arisen the practiceof paying farmers compensation in order to keepconditions of competition unchanged and maintainthe "unity of the market," along with import taxesand export subsidies when a currency is revaluedand vice versa when devalued. To complicate matterseven further, compensatory payments in floating cur-rencies are likely to vary from one week to the next.
Compensatory payments have become currentmarket practice despite the resulting uncertainties andcomplications for trade. In the middle of 1974 thecompensatory payments were 12% for the FederalRepublic of Germany and 2.7% for the Benelux coun-tries; they varied from about 7 to 10% for the floatingcurrencies.
The most striking irregularities from the use ofcompensatory payments concerned Italian importsof beef and dairy products. During the winter of1973/74 the subsidies paid by Italy to importersvaried between 15 and 25% of Community prices,while the Federal Republic of Germany granted ex-porters a bounty of 12%. As a result, meat importsinto Italy from the Federal Republic of Germanyincreased greatly, there was a fall in production inItaly, and French consignments to Italy were alsoaffected. Finally, at a time when Italy was sufferingfrom a record balance of payments deficit largelydue to agricultural and food products, it becameapparent that the system of compensatory paymentsto stimulate imports was contrary to Italy's nationalinterest. In May 1974 the Italian authorities an-

nounced temporary restrictions on most imports(with the notable exception of cereals and vegetableoils). This system has since been studied by theCommunity. Italy's "safety measures" are providedfor in the Treaty of Rome, but they reveal the extentto which CAP iS subject to the monetary instabilityof member countries. If CAP iS to function well,economic and monetary union must eventually berealized; such is the opinion which increasingly pre-vails in the Community.
The third factor affecting the agricultural situationin the EEC has been farm surpluses. Such surplusesusually of soft wheat, sugar, butter and skim milkpowder have been a regular feature of the Com-munity since its beginning. In 1973/74 there weremajor surpluses of beef as well as dairy products.
There was a scarcity of beef in world and Com-munity markets in 1972 and until spring 1973. Marketprices in the Community stayed well above orienta-tion prices, and customs duties and levies liad beensuspended in varying degrees according to categoryof meat. By summer 1973 the situation had alreadybegun to change, partly because of the cyclical natureof beef production, but also because of increasedslaughterings caused by the high cost of livestockfeed (especially soybean meal) and stagnation inretail demand due to high consumer prices.
The decree of June 1972 concerning scarcity wasrepealed in September 1973, but market prices havenevertheless progressively declined, especially forheavier beef cows. In March 1974, at the end of the1973/74 campaign, market prices fluctuated aroundthe orientation price for heavy-weight beef cows. Forthe 1974/75 campaign orientation prices had beenraised considerably, and consequently at the beginningof April market prices fell below intervention price.Various measures were taken to protect the marketas it deteriorated, including: exportation. (agreed tofor the first time since the inception of a commonmarket for beef); authorization of privately ownedstorage with a limit of 40 000 tons; extension of thepermanent price support regulations established in1973 to new categories of meat; application of thesecurity clause (suspension of imports coming fromthird countries by France, Italy and the Beneluxcountries); and obligation for importers to buy thesame quantity of frozen meat externally and fromintervention bodies of the Community. In May 1974the situation worsened as Italy announced new importrestrictions. Nevertheless, the Community is a netimporter of beef, and current surpluses are likely toprove only a temporary embarrassment.
The dairy sector has continued to have surplusproblems similar to those of preceding years. Thecost of supporting this sector in 1973 was 1 480 mil-lion units of account, or about 43% of the expen-diture of the "garantie" section of Community funds.
53
The profound changes undergone on internationalmarkets in 1973/74 as well as the particular problemsof the Community have led to new debates on thegeneral orientation of CAP. In autumn 1973 the Com-mission presented a memorandum to the Councilcontaining an adjustment programme for the period1973-78. It includes three main themes:
Price and market policies must be based onmodern farming and remain the principal instru-ment of CAP. A system of direct subsidies tofarmers is not a valid alternative. It is acknowl-edged, however, that some adjustments with cer-tain changes in price relationships are necessary.For cereals, for example, the programme proposesa change in price relationship between wheat andsecondary cereals and a stock policy centred onsoft wheat.
Price and market policies are complementary tothose pertaining to agricultural structures. Tocomplete the existing series of resolutions (asociostructural directive adopted in 1972 and adirective on poor rural areas of autumn 1973), theCommission is preparing soine proposals con-cerning forestry and the processing and market-ing of agricultural products.
Benefits of CAP must extend to new areas suchas the protection of consumers and the environ-ment. The Commission also proposes lo stimu-late better quality products. In July 1973 theCouncil adopted an action programme for theprotection of consumers, providing for the de-velopment of agricultural production techniquesnot harmful to the environment.
Prices 1974/75
The adjustment programme of CAP is not alwaysa subject of general agreement among member coun-tries; however, it does serve and is likely to continueto serve as a framework of reference for differentdecisions. Thus some points of the proposed pro-gramme, outlined above, liad already been acceptedat the time prices were set for 1974/75.
The new way of fixing prices resulted from acompromise between two conflicting needs: to main-tain the revenue of farmers affected by increases inproduction costs, and to moderate increases in agricul-tural prices. The eventual compromise for 1974/75was an increase in prices of about 9% on the average,with more for livestock than for vegetable products.
Increases in orientation prices for cereals are asfollows: soft ),vheat 6%, hard wheat 15% (this is thelast year Italian producers are to receive direct sub-sidies), rye 5% and barley and rice 6%. For barley

the "regionalization" of prices has been suspendedin order to increase the fluidity of the market. Therehas been an increase in orientation price of 11% forwine, 9% for tobacco, 10% for fruit and vegetables(but 7% for apples and 4% for pears), 3 to 6% foroilseeds and 7% for sugar. Production quota B(which only profits from a reduced guarfmteed price)on sugar has been lifted. For livestock there are thefollowing price increases: heavy-weight beef cattle12%, calves 9% and pigs 8%. The indicative priceof milk has increased 8%.
Various temporary price rulings to lessen the priceincreases foreseen during the transitory period havebeen agreed upon in the United Kingdom. Thus theprice of heavy beef cattle has gone up less there thanin the rest of the Community and subsidies for vealproduction have been maintained until 1 February1975, while the butter subsidy has been raised to 17units of account per 100 kilograms compared with10 units of account in the other EEC countries.
In September 1974 agreement was reached on afurther 5% increase in farm prices to help farmersmeet inflated farm costs and depressed incomes. This
Eastern Europe and the U.S.S.R.
Investment and current inputs
Investment efforts continued in 1973 in all easternEuropean countries, but changes in the volume ofinvestment were somewhat less uniform than in earlieryears. Compared with 1972 the volume of invest-ment increased considerably in Poland and moder-ately in Czechoslovakia, but was down in the Ger-man Democratic Republic and Romania. The shareof agriculture in total investment varied considerably,from 10 to 11% in Czechoslovakia and 12% in theGerman Democratic Republic to 16% in Poland andabout 19% in Hungary. Deliveries of machinery andfertilizers and other chemicals increased, though athighly varying rates, in the majority of eastern Eu-ropean countries. Compared with 1972, tractor de-liveries rose some 3 to 4% in Poland, more than 7%in Hungary and as much as 25% in the GermanDemocratic Republic. Deliveries of grain combine-harvesters expanded by more than 35% in Poland,by about 14% in the German Democratic Republicand by 8% in Hungary. For fertilizers by far thelargest increase in deliveries, some 34% above the1972 level, occurred in Romania, the country withthe lowest application rate of fertilizers per hectarein the area.
Capital investments in U.S.S.R. agriculture in 1973
54
intermediate price award to EEC farmers was acceptedby the Council of Ministers only after agreement tothree "prerequisites" demanded by the German (F.R.)Government, which had earlier opposed the priceincreases as inflationary. The three conditions werea reexamination of CAP to be completed early in 1975,an end to the illegal introduction of national agricul-tural subsidies and grants contrary to the Treaty ofRome, and the taking into account of the 5%price rise in drawing up next season's price package.
The German (F.R.) request for a reexamination ofCAP followed closely United Kingdom proposals,made early in 1974, which had four main principles:a more rational pricing policy; a tighter control overthe costs of farm price supports; the avoidance ofsurpluses; and greater attention to consumers' in-terests. While these principles may eventually faceno serious objections from other EEC members, prob-lems are likely to arise in their practical application.Already a number of Community members are seek-ing to introduce greater flexibility into the marketintervention system so as to avoid the accumulationof costly surpluses and to fight inflation.
amounted to 25 800 million rubles as compared with23 900 million rubles in 1972, 21 900 million rublesin 1971 and an average of 16 400 million rubles inthe period 1966-70; in 1974 capital investments inagriculture should reach about 28 000 million rubles.Noteworthy investments in 1973 included the con-struction of livestock barns, large animal complexes(the Kuznetsovsky complex, near Moscow, announcedfor construction four years ago, with a breedingcapacity of 108 000 pigs per year, is now functioning),fertilizer storage buildings and mixed-feed factories.Land improvement was also a major investment item.Newly irrigated land in 1973 amounted to 980 000hectares and more than 900 000 hectares were drained.Under the 1974 budget 6 900 million rubles areallotted for further land reclamation, with specialattention to irrigated lands used for the cultivationof vegetables around big cities and industrial centres;about 89 000 hectares are to be reclaimed in 1974under state control. Agriculture received 322 000tractors in 1973 (against 313 000 in 1972), and thetotal number of tractors in use reached 2.2 million bythe end of 1973, or 10% more than in 1970. Thesupply of trucks and special vehicles (225 000) alsoincreased, but fewer grain combines were deliveredthan in 1972. By 1974 the supply of tractors shouldreach 358 000, and the total production of agricul-

tural machinery is to increase by 10%. Priority isbeing given to the high-powered tractor, K-700, andits use is to be extended. In 1973 U.S.S.R. agriculturereceived 58 million tons of mineral fertilizers (stan-dard gross weight), or 8% more than in 1972, and asubstantial increase is planned for 1974. Variousmeasures were taken to enlarge the production anddelivery of mineral fertilizers, and by 1980 agricul-ture should be receiving some 120 million tons. Ce-reals will receive an even bigger share of total mineralfertilizer supplies, and organic fertilizers are also tobe increased substantially.
Expected increases in labour productivity shouldenable collective and state farms to reduce theirlabour force by 270 000 workers in 1974. At thesame time a campaign is being conducted lo increaseamenities and improve labour conditions in agricul-ture with the aim of reducing the outflow of youngpeople from rural areas. The census of 1970 showedthe reduction of workers under thirty years of agesince 1959, their share in the total number of agri-cultural (manual) workers going down from 40 to24%. Facilities have been provided for people de-siring to migrate with the intention of working inagriculture. A decision taken in May 1973 regulatesthe migration of agricultural man power and providesfor the payment of subsidies, advances and credits.The rights to these facilities depend however on thechoice of migration areas offered by the state pro-grammes. This act even considers the transfer ofentire kolkhozes from one area to another, in whichevent the expenditure for transferring collective mov-able property is covered by the State. Although theeastern areas of the U.S.S.R. are more interested inreceiving agricultural migrants, facilities are also pro-vided in the European area, under the decisionconcerning the Russian Soviet Federated SocialistRepublic (R.S.F.S.R.) non-black soil area (see below),for the people transferring from small villages intokolkhoz or sovkhoz settlements.
Farm incomes, prices and policies
Information on agricultural incomes is sparse, butfurther advances are reported in all countries. InCzechoslovakia the average earnings of cooperativefarmers (including earnings in kind) are reported tohave risen faster than the average earnings of wageand salary earners, which increased by 3.5% in 1973.Incomes from agriculture in Hungary rose by 10%,as compared with a 9% increase in wage and wagelikeincomes; this fast rise of agricultural incomes in thiscountry was the result of larger output and salescombined with higher milk and livestock prices. Forsimilar reasons the 9% rise of agricultural incomesprovided for by the Polish plan was exceeded, al-
55
though no definitive figure has yet been released. InRomania, where total output remained stagnant, al-though the cooperative farms must have accumulatedconsiderable reserves in the preceding highly favour-able year, agricultural incomes in 1973 went up byas much as 11%, as compared with an 8% expansionin wage and salary earnings.
In Poland new regulations were adopted concerningthe wages of workers engaged in various servicesrelated to agriculture, since it has been felt for sometime that wages in this particular occupational fieldwere not sufficiently attractive for properly qualifiedpeople. As of 1 April 1974 the wages of tractor andcombine drivers and of repair-shop workers in theso-called economic units of agricultural circles wereincreased to the level of wages paid for similar workat state farms and machinery centres. Further in-creases in wages came into effect at the beginning ofJuly 1974 for virtually all services (mechanization,veterinary services, seed inspectorates, etc.) in a largenumber of agricultural organizations, and in accor-dance with the general pattern in recent years, priceand other material incentives to farmers, in particularto livestock producers, were improved in several coun-tries. In Hungary, where in 1973 the impressive ex-pansion in pig raising was the result of incentivesintroduced a couple of years earlier, measures weretaken to encourage cattle breeding, and the procure-ment price for cattle was fixed at a level which willensure a 15% profit to the producer. In Poland, also,purchasing prices for prime-quality beef, for calvesand slaughter horses and for a number of livestockproducts (sheep hides, wool, etc.) were increased inearly 1974, but procurement prices were likewiseraised for sugar beet, rapeseed and sorne industrialcrops. In 1973 the Bulgarian authorities introduceda series of measures to improve incentives for animalbreeding in both the socialized and small-scale privatesectors; for example, it was decided to allocate greaterquantities of feedstuffs to private plots against thecommitments of farmers to increase deliveries of
*mals for slaughter. Credit facilities will be ex-tended to collective farms and smallholders for thepurchase of breeding stock, construction material,mechanized equipment, and other necessities; in ad-dition, premiums for deliveries of animals for slaugh-ter were increased.
Consumer food prices remained on the whole re-markably stable, but developments were not exactlythe same in all countries. In Czechoslovakia, forinstance, the retail prices of foodstuffs have remainedunchanged for many years. In the German Demo-cratic Republic, prices have also remained understrict control, the declared policy being to meet greaterconsumer demand exclusively by increasing supplies.The price freeze for basic food products in Poland,having been extended to 1973 and 1974, did not ex-

elude a rise of certain prices; there was a rise in theprice of restaurant meals, as well as a 22-23% in-crease in prices of wine, hard liquors and other al-coholic beverages. In Hungary, on the other hand,the authorities aim to develop a system of consumerprices that will correspond to production costs; butthis aim is being pursued with extreme caution andis not expected to be reached for about ten to fifteenyears. In line with this policy the retail priceindex for food rose by 5% in 1973 (compared with1972), reflecting higher retail prices for milk anddairy products, which, in turn, were induced by higherprocurement prices, increased prices of liquor andtobacco and unforeseen increases in free market pricesof fruit and vegetables caused by poor output in thisparticular sector.
The policy of maintaining stable or relatively stableconsumer food prices while systematically increasingprices paid to producers has met with problems inmost countries. Subsidies in the food sector in Po-land, for instance, amounted in 1973 to more than10% of the value of food retail sales. Retail pricestability in a number of other countries was evencostlier to the governments; in Hungary, for example,stable prices of basic foodstuffs require subsidiesamounting to some 35% of total receipts. It now ap-pears that the eastern European countries, whichuntil recently have been in a good position to provideincentives to farmers and to improve ffie terms ofagricultural trade by systematically increasing pro-ducer prices, have almost exhausted the possibilitiesfor further upward adjustments. Complaints arecommon in many countries about the high level ofsubsidies required to keep retail prices stable, andthere is much talk about the need to stabilize thelevel of subsidies. The situation will become moredifficult if, as is widely expected, the higher pricesof oil and related products used in agriculture resultin higher production costs.
Plans and policies
Plan figures for 1974 vary greatly from country tocountry. Bulgaria expects an overall growth of about5%, with emphasis on animal production. The plantargets set in Czechoslovakia are very much in linewith the actual 1973 results, whereas the Polish plancontinues to provide for modest increases in output.The Hungarian target is also on the modest side,except that the increase in total output (2 to 2.5%)is expected to come entirely from considerable ex-pansion in the livestock sector (6 to 7%). By con-trast, the projected increases in the plans of the Ger-man Democratic Republic (6.8%) and, especially,Romania (21.5%) appear to be very ambitious, eventhough the output target in the latter country hardly
56
exceeds the spectacular results obtained in 1971.In the U.S.S.R. a special development plan is
being prepared for the non-black soil area of theR.S.F.S.R. (north-central part of the EuropeanU.S.S.R.). This long-range plan, which extends to1990, will cover three five-year periods. (The currentU.S.S.R. five-year plan ends in 1975.) Details areto be completed in 1974/75 but much information,such as input targets, is already available for thewhole period or for 1976-80. The plan covers 29oblats (provinces) and autonomous republics repre-senting an area of 52 million hectares of land devotedto agriculture and 32 million hectares of arable land(14% of total arable lands). As this huge territoryincludes some of the biggest cities and importantindustrial centres, the programme is working to-ward bringing production (especially of animal prod-ucts and vegetables) closer to the consumer. Rela-tively poor soil conditions and population outflowfrom rural areas liad reduced the exploitation of landresources in the past: between 1940 and 1970 thecereal crop area was reduced by 20%, the area undervegetables by 38% and the flax area by 44% in thecentral part of the R.S.F.S.R.
The programme is largely based on the industrialapproach to agriculture and on land reclamation.Cereal production is to be increased through im-provement in yields and extension of the crop area.Potato and vegetable crops will be increased, especiallynear big cities and industrial centres, and specializedfarms are to be created. Flax production will alsobe expanded and largely mechanized. Sugar beetcultivation will be encouraged in several provinces,and be concentrated on farms close to sugar factories.There will be a large increase in livestock products,especially by large-scale enterprises. Big complexes,already in progress, are to be created not only forcattle, pigs and poultry but also for sheep.
Heavy investments will be made: in the period1976-80, 35 000 million rubles are to be invested inagriculture, and 120 million tons of mineral fertilizers,380 000 tractors, 94 000 grain combines and 230 000trucks are to be delivered. Land reclamation is tobe given particular importance: from 1975 to 1990,drainage will be extended to 9-10 million hectares,irrigation works will cover 2-2.5 million hectares andliming of acid soils will be carried out on 23 rnillionhectares.
About 25 000 kilometres of roads are to be con-structed, and food industries are also to be developed.In addition, the plan provides for various socialfacilities in state and collective farm settlements, towhich the populations of small villages are encour-aged to transfer.
In the U.S.S.R. the number of collective farms(kolkhozes) diminished during 1973, some 600 ofthem disappearing as a result of being merged with

other kolkhozes or being transformed into state farms.It was decided as far back as 1967 to introduce
a system of cost accounting on state farms, wherebyincome from production would fully cover the ex-penditures, leaving a margin for profit. The sovkhoz,being a state enterprise, was previously able to ignorethe profit-making aspect. By 1973 some 8 000 sov-khozes, about half of the total of 16 000, were alreadyoperating under the new system. In 1974 another5 000 sovkhozes were using cost accounting, andall state farms are expected to do so by 1975; how-ever, the State is taking over the financing of im-portant works like reclamation and the constructionof complexes and buildings for social services, suchas schools, hospitals and houses.
Some data on the development of both state andcollective farms in the period 1965-73 are given inTable 2-1.
Kolkhozes and sovkhozes are to continue for a
TABLE 2-1. - EVOLUTION OP KOLKHOZES AND SOVKHOZES, 1965-73
Agricultural prices and farm incomes
World shortages of most major farm products andcontinuing high levels of domestic and export de-mand dramatically increased farm prices for NorthAmerican agricultural commodities in 1973. TheUnited States index of prices received by farmerswas 37% above 1972, and the comparable Canadianindex was 39% higher. In both countries the in-crease in prices for crop products exceeded that forlivestock products. Increased supplies caused farmprices for livestock products (particularly meat ani-
1 Excluding fishing kolkhozes. - 2 Excluding 1 246 fatteningsovkhozes.
57
number of years, but they are to be strengthenedthrough increased technical inputs and the develop-ment of various forms of associations.
Such associations of cooperative and state farmsand the establishment of highly industrialized farmenterprises are, at present, key elements of U.S.S.R.agricultural policy. Agro-industrial integration, asit is officially termed, is assuming different forms oforganization, which can be summarized as follows:
Associations between agricultural and industrial(sometimes even trading) enterprises, each beingautonomous or merged into a farm-factory witha central management; both types have alreadybeen organized for vegetables, fruit, grapes, sugarbeet, wine and sugar.
Highly industrialized large holdings which coverall the various phases of production, such asanimal and poultry complexes (poultry factories),as well as some fruit growing and manufacturingenterprises.
The organization of factories inside already exist-ing kolkhozes and sovkhozes or the creation ofsuch factories on a joint farm basis. Thesechanges are just being initiated and thereforeare more developed in some regions than inothers. It would be incautious to say as yet whatthe new systems have achieved, as similar at-tempts dating as far back as 1929 had to beabandoned; however, in the U.S.S.R. and in othereastern European countries, this pattern is con-sidered to be the basis of future development.Official U.S.S.R. policy holds that joint farm ac-tivities and industrialization of agriculture con-stitute the future pattern for collective and statefarms.
North America
mals) to average lower during the fourth quarter of1973, but they rose once more during the first quarterof 1974. Prices paid by farmers for production in-puts were also higher in 1973; however, the rates ofincrease were significantly lower than those for pricesreceived by farmers, the indices of prices paid byfarmers for production inputs averaging about 16%above 1972 in Canada and 20% in the United States.Prices of farm inputs have risen further during 1974as a result of continuing general inflationary con-ditions and sharply higher prices for fertilizers, fuelsand feeds.
Kolkhozes(Collectives)
Sovkhozes(Sta te farms)
1965 1973 1965 1973
Number " (thousand) 36.3 31.0 11.7 216.1Families associated (million) . 15.4 13.9Average number of workers
(million) 18.6 16.0 8.2 9.4SONVII area (million hectares): .
area under cereals (millionhectares)
105.1
62.6
98.6
57.0
89.1
59.7
99.6
63.0Cattle (million head) 38.3 44.9 24.5 32,5Pigs (million head) 24.6 32.1 12.6 19.3Sheep and goats (million head) 54.6 53.4 46.4 60.2Number of tractors (thousand
units) 772 1 049 681 894

TABLE 2-2. - NORTH AMERICA: ESTIMATED FARM INCOME
Canada United States
1 Preliminary.
Gross farm income in North America, whichreached a record level in 1973, is estimated to havebeen 42% above 1972 (Table 2-2); the rate of increasewas somewhat larger in the United States (43%)than in Canada (39%). Production expenses alsoincreased in 1973 by about 23%. Higher prices forproduction inputs appear to have accounted for mostof the 18% increase in production expenses in Canadaand the 23% increase in the United States. Netfarm income rose by 95%: in CEtnada by 79% andin the United States by 97%. Farm inventories rosein both countries, however, and the increase inrealized net income was consequently only 79%: inCanada 36% and in the United States 84%. Govern-ment payments in the United States dropped in 1973to their lowest level since 1965, and a further sharpreduction was expected in 1974. Realized net farmincome in the United States averaged $11 332 perfarm in 1973, or 82% above 1972.
Problems, policies and programmes
Even though 1973 production attained recordlevels, it became increasingly evident during theyear that the balance between domestic and exportdemand and available supplies in North Americawould not be restored for most major farm productsand that prices for these would remain at unusuallyhigh levels with consequent inflationary effects.During the latter part of 1973, it also became veryclear that fertilizers and fuels would be in shortsupply for the 1974 crop season and, perhaps evenmore important, that their prices would be sharplyhigher. These developments pose fundamental ques-tions: is this a short-term shift away from the long-term tendency of surplus agricultural production inNorth America, or is it a danger signal indicating
58
that demand pressures on supply are to be a con-tinuing feature of world markets for most majorfarm products perhaps for the remainder of the 1970sor even longer? With no immediate answer in sight,the Governments of Canada and the United Statesseem inclined to keep their options open. Theyhave sought increased production in 1974 and seemlikely to do so again in 1975; but with previousexperiences of market surpluses in mind they aremaintaining, on a stand-by basis, the complex ofprogrammes which they have gradually evolved forrestraining farm production if the current high pres-sures of demand on supply prove to be of onlylimited duration.
WHEAT PRODUCTION AND STOCKS
Continued very high expo:t demand during the1973/74 season brought a further sharp reduction inNorth American wheat stocks, especially in theUnited States where end-of-season stocks droppedto the lowest level since 1951 (Table 2-3). In orderto avoid disruption of normal domestic distribution,the United States permitted imports from Canadatoward the end of the season. Because of the sharpreduction in stocks that had taken place during theprevious season, total supplies available in NorthAmerica during the 1973/74 season were approxi-mately 11 million tons less than during 1972/73,despite the record 1973 harvest, which was 12%larger than 1972. As domestic and export buyerscompeted fiercely for supplies, wheat prices at thefarm level soared in the United States from a mid-July 1973 low of $2.47 per bushel to an all-time peakof $5.52 per bushel in mid-February 1974. Both theUnited States and Canadian Governments soughtincreased production in 1974 to meet prospectivestrong export demand and, hopefully, to enable somereplenishment of stocks. However, because of un-favourable weather, the 1974 harvest was about the
TABLE 2-3. - NORTH AMERICA: SUPPLY AND UTILIZATIONOF WHEAT
1 August-July season for Canada; Jo y-June season for theUnited States. - 2 Preliminary. - 3Indicated. - 4 Includeswheat equivalent of whcat flour exports.
Cash receipts from farm
1971 1972 19731 1971 1972 1973'
ThousandCan. dollars
million ThouU.S.
and Idollars
tinfoil
marketings 4.5 5.4 6.9 52.9 61.0 88.6Government payments . 3.1 4.0 2.6Income in kind 0.5 0.6 0.6 4.6 5.0 5.8Net change in farm inven-
tories 0. 2 -0 . 3 ±9.4 +1.4 ± 0 . 9 +4.0GROSS FARM INCOME 5.2 5.7 7.9 62.0 70.8101.0
Production expenses . . 3.6 3.8 4.5 47.6 52.4 64.7NET EARNS INCOME . . . 1.7 1.9 3.4 14.4 18.4 36.2REALIZED NET FARM IN-
COME 1.5 2.2 3.0 13.0 17.5 32.2
Callada United States
1972/73
1973/742
1974/753 1972/73
1973/742
1974/75
Million t letric tons
Beginning stocks 15.9 9.9 10.3 23.5 11.9 6.7Production . 14.5 16.5 14.2 42.0 46.6 48.5Domestic use . 4.8 4.7 4.8 21.4 20.6 18.9Exports a . . 15.7 11.4 13.3-14.6 32.2 31.2 30.0-31.0Ending stocks . 9.9 10.3 5.1-6.4 11.9 6.7 5.3-6.3

TA13LE 2-4. - NORTH AMERICA: SUPPLY ANO UTILIZATIONOF FEEDGRA1NS 1
1 Rye, barley, oats, maize, mixed grains, sorghum and millet. -2 August-July seasons. - 3 July-June seasons, except for maizeand sorghum, which are October-September. - Preliminary. -5 Indicated.
same as 1973, and total supplies available for the1974/75 season are consequently below those of ayear earlier. Thus the extent to which stocks canbe restored will depend largely on the world foodsituation and the demand for North American wheatlo cover food shortages, particularly in developingcountries.
The 1973 Canadian wheat harvest, 14% largerthan 1972, was slightly higher than the total ofdomestic use and exports during the season, andconsequently stocks showed a corresponding smallincrease (Table 2-4). The area planted to wheatin 1973 had been 1.3 million hectares, or 12% lessthan that indicated by the Government as desirable,apparently mainly because of competition from othercrops for available land. The wheat programmeannounced for the 1974 crop was the same as in1973: the Government again indicated that totalplantings of 11.3 million hectares would be desirable,and the Canadian Wheat Board pledged to acceptdelivery of a minimum of 15.1 million tons with aninitial payment of Can. $2.25 per bushel. The initialpayment for 1973 was however retroactively adjustedupward in February 1974 to $3.75 per bushel, thefinal payment to be made after 1 January 1975 so asto fall within the next tax year. The 15 March 1974survey indicated that Canadian growers intended toplant 10.8 million hectares to wheat, but the springwas late and wet in the Prairie Provinces, and actualplantings totalled only 9.7 million hectares, 4% below1973, but 11% above the 1968-72 average. Earlyfrost damaged the harvest in September, so the totalsupplies available for the 1974/75 season are smallerthan a year earlier. In September 1973 the Ca-nadian Government established a two-price systemfor wheat which for the next seven years fixes theprice to be paid by millers for wheat used fordomestic human consumption at $3.25 per bushel.In seasons when the export price exceeds this guaran-
59
teed level, the Government will pay a "consumersubsidy" to cover the difference, up to a maximumof $1.75 per bushel.
The United States wheat programme for 1974contained no restrictions on production, as area "set-aside requirements" (the device provided by theAgriculture and Consumer Protection Act of 1973for restraining production) were riot applied. Thearea planted to wheat amounted to 28 million hect-ares, 18% more than in 1973 and the largest since1963. Yields averaged below the projected levels,however, because of unfavourable weather in someareas. Production was nevertheless an all-time record48.5 million tons, 4% above 1973. Because of thecritically depleted level of stocks at the beginningof the season, the total supply available for the1974/75 season is about 3 million tons less than in1973/74. Farm prices for wheat were expected toaverage above the target level of $2.05 per bushelduring the period July-November 1974, and con-sequently deficiency payments were not expected tobe required. Similarly, market prices were expectedto remain above the loan level of $1.37 per bushel,and the Commodity Credit Corporation (ccc) is notlikely to acquire appreciable stocks of wheat fromthe 1974 harvest. The wheat programme for 1975,announced in April 1974, is almost identical to the1974 programme: there are no restrictions on pro-duction (set-aside requirements), the target price is$2.05, and the national acreage allotment is 21.7million hectares (2.7 million hectares less than in1974).
FEEDGRAIN SUPPLIES AND PROGRAMMES
With continued strong domestic and export demand,North American feedgrain supplies remained tightduring the 1973/74 season and prices averagedsharply higher. Although total production was about2% above 1972/73, total supplies available wereabout 4% smaller because of the sharp reduction instocks which had taken place; thus stocks werefurther depleted during 1973/74, particularly in theUnited States, where end-of-season maize stockswere the smallest since 1948. The Governments ofboth Canada and the United States encouraged in-creased production in 1974; however, because ofdrought, particularly in the United States, the 1974harvest is estimated to have fallen 19% below 1973.With the further reduction of stocks during the 1973/1974 season, total available supplies for the currentseason are almost 50 million tons (20%) less thana year earlier. The situation is especially tight inthe United States, where the Government has re-quested major importing countries to restrain their1974/75 purchases.
As in 1973, market expectations indicated that in-
Canada 2 United States 3
1972/73
19731744
1974/75 5
1972/73
I 1973/741 1974/75 5
Million metric tons
Beginning stocks 6.2 5.7 5.9 45.1 30.2 20.5Production . . . 20.9 20.4 17.2 182.0 186.6 149.9Imports . . . 0.8 1.1 1.0 0.3 0.2 0.3Domestic use . 18.3 18.7 16.3 157.9 156.1 131.0-131.9Exports . . . . 3.9 2.6 2.7 39.3 40.4 27.9- 28.4Ending stocks . . 5.7 5.9 5.1 30.2 20.5 10.4- 11.8

creased production of feedgrains would again bedesirable in Canada in 1974. The Canadian WheatBoard guaranteed acceptance of a minimum deliveryof 5.7 million tons of barley with an initial paymentof Can. $1.65 per bushel, $0.15 higher than the initialpayme-nt originally announced for 1973, but $0.60less than the 1973 initial payment as adjusted retro-actively in February 1974. However, increasedplantings were desired also for wheat and oilseeds,and the total area actually planted to feedgrains isestimated to have been slightly smaller and Canada's1974 feedgran harvest to have fallen 16% below1973.
The United States feedgrain programme for 1974,the first under the Agriculture and Consumer Pro-tection Act of 1973, contained no provision for areaset-asides and consequently no restrictions on pro-duction. The area planted to feedgrains totalled 50.2million hectares, 1% more than in 1973 and thelargest since 1960. The area planted to maize (31.4million hectares) was 9% larger than in 1973 andthe largest since 1955. The area planted to otherfeedgrains (18.8 million hectares) was however 9%less than in 1973. The barley area (3.8 million hect-ares) was 16% below 1973, and the smallest since1953, because of the large increase in spring wheatplantings. Grain sorghum plantings (6.3 million hect-ares) were down by 2% as a result of larger plantingsof wheat and cotton in the southwestern states. Thefurther small decline in the area planted to oatscontinued the long-term trend. Because of severedrought, the total feedgrain harvest in 1974 is esti-mated at 150 million tons, 20% below 1973. Themaize harvest is estimated as smaller by 26 milliontons (18%), grain sorghum by 8 million tons (35%),barley by 2 million tons (23%) and oats by 2%.The total feedgrain supply available during the 1974/1975 season in therefore estimated as 170 milliontons - that is, smaller by 46 million tons, or 21%,than during 1973/74. Farm prices are expected toaverage above the target prices set for maize ($1.38per bushel), barley ($1.13 per bushel) and grainsorghum ($1.31 per bushel), so deficiency paymentswill not be required for the 1974 crops. Similarly,market prices are expected to remain above the loanlevels established for maize ($1.10 per bushel), barley($0.90 per bushel), oats ($0.54 per bushel) and grainsorghum ($1.05 per bushel), and therefore it seemsunlikely that the ccc will have acquired appreciablestocks of feedgrains from the 1974 harvests.
OTHER COMMODITY PROGRAMMES
Rice. The United States national acreage allot-ment for the 1974 rice crop was reduced to 850 000hectares (compared with 900 000 hectares in 1973).Marketing quotas are not however in effect for the
60
1974 crop, and for the first time since 1954 farmersmay plant in excess of their acreage allotmentswithout incurring marketing quota penalties. Com-pliance with the 1974 farm acreage allotments servesonly as a condition of eligibility for ccc loans on1974 rice. The reduction in the acreage allotmentand the simultaneous lifting of marketing quotas arein accordance with legislation remaining in effect fromthe 1930s and 1940s; rice programmes were notcovered by the Agriculture and Consumer ProtectionAct of 1973.
Groundnuts. The main features of the UnitedStates groundnuts programme remain unchanged for1974: marketing quotas, a national acreage allotmentof 650 000 hectares (the minimum permitted underexisting legislation) and ccc price support loans at75% of parity as of 1 August 1974 (also theminimum permitted under existing legislation). Someadministrative changes have been introduced howeverin an effort to reduce the cost of the programme.The 1973 programme, under which the Governmentacquired the production from more than a third ofthe national acreage allotment for disposal, costabout $70 million. The 1974 crop is the last of thethree annual crops for which marketing quotas wereapproved by the December 1971 referendum ofgrowers. A government proposal for groundnutprogrammes similar to the, wheat, feedgrains andcotton programmes contained in the Agriculture andConsumer Protection Act of 1973 has failed to gainlegislative approval.
Sugar. Proposed legislation to extend and possiblyto modify the United States sugar programmes sched-uled to expire at the end of 1974 had failed to gainCongressional approval as of 1 December 1974.
Dairy. The 1973 Agriculture and Consumer Protec-tion Act extended United States dairy programmeswith minor modifications. The minimum supportlevel for manufacturing milk was increased to 80%of parity, which raised the support price from$5.29 to $5.61 per 100 pounds for the remainderof the 1973/74 dairy season; for the marketing yearbeginning 1 April 1974, it was set at $6.57 per 100pounds. The support purchase price for butter re-mained 62 cents per pound, while for Cheddar cheeseit was raised from 65 cents per pound to 70.75 centsper pound and for nonfat dry milk from 41.4 centsper pound to 56.6 cents per pound. Support pur-chases during 1973 (2.2 billion pounds milk equiv-alent) were only 41% of the 1972 level and thelowest since 1966. Dairy imports in 1973 were morethan double the 1972 level, as temporary increases inimport quotas permitted larger imports of butter,butter oil, cheese and nonfat dry milk. Temporaryincreases in import quotas were granted also duringthe first half of 1974 for Cheddar cheese and nonfatdry milk.

UNITED STATES AGRICULTURE AND CONSUMERPROTECTION ACT OF 1973
The Agriculture and Consumer Protection Act,enacted in August 1973, extended legislative author-ity for major United States agricultural commodityprogrammes, Public Law 480 operations and foodstamp activities for another four years. In general,this Act maintained United States agricultural policiesfollowed since the early 1960s: greater freedom forfarmers to make their production decisions on thebasis of market prices and production costs; lessrigid government restraints on production and directintervention in the pricing and marketing of farmproducts; increased dependence on receipts from mar-ket sales (rather than from government payments)for income from farm operations; domestic marketprices more closely aligned to export market prices;etc. The Act did introduce however some importantchanges in the wheat, feedgrains and upland cottonprogrammes. For the 1974 harvests these pro-grammes were not applied to restrict the areasplanted, and market prices for these commoditieswere expected to remain above the levels at whichthe price provisions of the 1973 Act would becomeoperative. The 1973 legislation also extended forfour years the price support programmes for dairyproducts, wool and mohair with only minor changes.This legislation does not concern the programmes forgroundnuts, sugar beets and sugarcane, tobacco, etc.
For the wheat, feedgrains and cotton programmesthe traditional parity-based price objectives, pricesupport measures and related acreage diversion pay-ments were replaced by guaranteed "target prices."The target prices established in the legislation forthe 1974 and 1975 crops were $2.05 per bushel forwheat, $1.38 per bushel for maize, and $0.38 perpound for cotton; for the 1976 and 1977 crops thesetarget prices are to be adjusted upward in accordancewith changes in the index of prices paid by farmersmodified for changes in yield per acre. Target pricesfor grain sorghum and barley are to be establishedby the Secretary of Agriculture at "fair and reason-able" levels in relation to those set for maize; forthe 1974 crops these have been set at $1.31 perbushel for grain sorghum and $1.13 for barley.
Farmers who choose to participate in these com-modity programmes will receive deficiency paymentsfrom the Government in years when the nationalaverage price received by farmers for any of thecommodities during the first five months of themarketing season is below the established target levels.These deficiency payments are subject to two limi-tations: they are to be based only on production fromthe participating farmer's acreage allotments as com-puted on the basis Of the projected yields of therespective crops established for his farm; the total
61
payments received by a farmer for participation inthe wheat, feedgrains and cotton programmes arenot to exceed $20 000.
The legislation also provides for government pay-ments to farmers when drought, flood or other naturaldisaster or condition beyond their control preventsthem from planting any portion of the farm acreageallotment or reduces their total harvest of wheat,feedgrains or cotton to a quantity equalling less thantwo thirds of the farm acreage allotment times theyield established for the farm. This provision cameinto operation with the severe drought conditions in1974.
The new legislation continues acreage allotmentand area "set-aside" provisions similar to those con-tained in previous wheat, feedgrains and cotton pro-grammes. The national acreage allotments are de-termined annually by the Secretary of Agricultureon the basis of anticipated supply requirements fordomestic use and export, with provision for adjust-ments to assure an adequate. but not excessive, levelof carryover stocks. The law specifies that thenational acreage allotment for cotton is not to beless than 4.5 million hectares, but no such statutorylimitation is specified for either wheat or feedgrains.The national acreage allotments under this legislationare not a direct means of restricting production, butprovide, rather, a way of limiting the total productionof those commodities for which target prices areguaranteed that is, for which deficiency paymentsmay be made. For 1974 the following averageallotments were established: wheat 22.3 million hect-ares, feedgrains 36.0 million hectares and cotton4.5 million hectares.
Under the 1973 legislation a set-aside of croplandis the principal means of restricting areas plantedand agricultural production. The Act authorizes theSecretary of Agriculture to provide for a set-aside ofcropland if he decides that the total supply ofagricultural commodities will otherwise most likelybe excessive, taking into account the need for anadequate carryover to maintain reasonable and stablesupplies and prices and to meet a national emergency.To be eligible for deficiency payments and ccc loanswhen a set-aside of cropland is in effect, a farmermust set aside a specified percentage of his farmacreage allotment under the respective commodityprogrammes plus the acreage of cropland on his farmdevoted to soil conservation uses in preceding years.The law further specifies that the total area set asideshall not exceed 5.4 million hectares under the wheatprogramme and 28% of the farm acreage allotmentunder the cotton programme. Area set-asides werenot included in any of the 1974 commodity pro-grammes.
The programme of ccc non-recourse loans alsocontinued to be in effect, but it is not considered

likely that the ccc will acquire appreciable stocksfrom the 1974 harvests as market prices are expectedto remain significantly above the loan levels (wheat$1.37 per bushel, maize $1.10 per bushel, barley$0.90 per bushel, oats $0.54 per bushel, grain sorghum$1.05 per bushel and cotton $0.25 per pound).Although the ccc may continue to acquire stocks aspart of its loan operations, it appears that only tokenamounts are intended. Only in the cotton pro-gramme does the legislation specify a minimum levelfor carryover stocks in the United States of "not lessthan 50% of the average offtake for the threepreceding years." It is provided, however, that theGovernment shall establish and maintain a separateinventory of up to 75 million bushels of wheat, feed-grains and soybeans for the alleviation of distressarising from natural disasters.
FOOD PRICES AND CONSUMPTION IN THE UNITED STATES
In the United States the consumer price indexfor food in 1973 averaged 14.5% above 1972, thelargest year-to-year increase in a quarter of a century;in comparison the index for all items averaged 6.2%higher, or less than half that for food. Stocks offood commodities were low at the beginning of theyear. The needed expansion of production to fulfilthe strong domestic and export demand was chokedoff by a combination of adverse weather, food pricecontrols and higher feed prices. Costs of processing,transportation and distribution of food products alsorose, particularly during the latter part of the year,but the major factor affecting food prices was higherprices for the farm-produced raw materials used bythe food industry. The farmers' share of the con-sumers' food dollar rose from 40% in 1972 to 46%in 1973. The index of prices paid to farmers forfood products averaged 33% higher in 1973, andthe index of wholesale prices all food rose 21%.Retail prices of food products for home use rose16%, double the rate of increase for prices of foodconsumed outside the home.
During the first quarter of 1973 prices for meatand poultry led the increase in food prices. Ceilingsimposed on prices for red meats at the wholesale-retail levels in March limited advances for this itemduring the spring and early summer. Ceilings onprices after the point of first sale were extended toother food products in June, so average retail foodprices increased relatively little from June to July.However, the combination of ceiling prices and rap-idly increasing costs of production disrupted suppliesand curtailed total output of meat and poultry prod-ucts. After price ceilings were lifted in July on allfoods except beef, retail food prices rose sharply,the August average increasing some 7% over July.
62
In September the index declined slightly, but thenresumed its upward trend, the index for December1973 reaching 20% above that of the previous year.
Stocks of food commodities at the beginning of1974 were even smaller than the year before, andretail food prices continued to rise, with the June1974 index 15% above the previous year. The rapidacceleration in food prices during the winter wasessentially an extension of the abnormal supply/demand conditions of 1973, as the effects of tightersupplies, higher farm prices and increasing costs ofprocessing, transportation and distribution of foodproducts made their impact at the retail level. Thepattern of generally rising retail food prices wasexpected to continue through 1974. Farm com-modity markets and, in turn, retail food prices re-mained extremely sensitive to developments affectingdomestic production, the state of the national econ-omy and the world food supply and demand situation.
Although total consumer expenditures for foodcontinued to rise in the United States, the increasefell short of the amount that would have beenrequired to offset higher retail prices for food. Realfood expenditures (adjusted for price changes toreflect quantity changes) in 1973 were 2.5% below1972, the largest year-to-year decline since 1933.During the first quarter of 1974 real food expendituresdeclined for the seventh consecutive quarter andwere 5.3% below the level of a year earlier. Thedecline in real food expenditures has involved botha decline in per caput consumption (see below) anda shift to less costly foods. Since mid-1973 foodhas accounted for an increasing percentage of totalpersonal consumption expenditures in the UnitedStates, reaching 17.7% in the first quarter of 1974as compared with 17.1% a year earlier.
The United States Government's index of per caputfood consumption showed a decline of 1.6% in 1973,the first such year-to-year decline since 1965 and thelargest drop since 1957; however, in terms of con-ventional nutritional standards (calories, proteins,fats, carbohydrates) 1973 per caput consumption wasabout the same as in 1972. Per caput consumptionof livestock-related foods fell by 4% in 1973; meatby 7% (13 pounds carcass weight), the lowest con-sumption figure since 1966; poultry by 4%; andeggs by 5%. Per caput consumption of dairy prod-ucts (including butter) showed no change, while thatof vegetables rose by 3%, the largest such year-to-year increase since 1945, mainly accounted for byprocessed items. Per caput consumption of fats andoils and of sugar and sweeteners was slightly larger,thus continuing the general trends of recent years.
Expenditures for subsidizing domestic food con-sumption under United States Department of Agri-culture programmes continued to rise during 1973,the total value of these programmes accounting for

3.6% of personal consumption expenditures for foodduring the first quarter of 1974, as compared with3.1% a year earlier. Although the total value ofthese programmes in 1973 ($3 800 million) was only7.5% higher than in 1972, their value during thefirst quarter of 1974 was 31% above the correspond-ing quarter of 1973. Under new legislation thevalue of coupon allotments under the food stampprogramme was adjusted upward in July 1973 andagain in January 1974 to reflect changes in the costof living. During the first quarter of 1974 food
Agricultural prices and farm incomes
With continuing high world market prices for mostof the region's agricultural commodities, farm incomein the region rose sharply in 1973/74 for the secondconsecutive season; however, on the basis of tentativeestimates, Australia accounted for all of the increase.In New Zealand, drought once more restricted output,while production costs continued to rise, more thanoffsetting the effect of high market prices for farmcommodities, and farm income appears to haveshown a small decline. Export returns were adverselyaffected in both countries by the rise in ocean freightrates which followed the oil crisis in October 1973.
Australian farm income in 1972/73 was A$1 888million, a record 65% above 1971/72, and a furtherincrease of about 50% has been estimated for 1973/1974. The combination of high world market pricesfor most agricultural commodities and generallyfavourable weather has created a period of excep-tional prosperity for the Australian rural sector as awhole. The situation in 1974 contrasts markedlywith the relatively depressed rural conditions in1970/71. The improvement has been the result mainlyof external factors which had been offset to someextent by unfavourable weather in 1971/72 and 1972/1973, but which were strengthened by better thanaverage rainfall in the principal producing areas in1973/74.
The gross value of rural production in 1972/73reached A$5 000 million, 25% above 1971/72, whilefarm costs at A$2 906 million were higher by only4%. An increase of 43% in the gross value of live-stock production, mostly accounted for by wool andcattle for slaughter, was slightly offset by a reductionof 7% in the gross value of crop production. Pricesfor most major field crops were higher, but did notfully compensate for the reduced volume of produc-tion resulting from drought. For 1973/74 both the
63
stamps were issued at an annual rate of $5 200million, as compared with $4 000 million a yearearlier. A monthly average of 12.4 million personsparticipated in the food stamp programme in 1973,about 6% more than in 1972, but this increase wasalmost equalled by a corresponding drop in thenumber of participants in the commodity distributionprogramme. Whereas the school lunch programmecontinued to encompass about 25 million children,its cost to the Federal Government rose by 17.5%to $897 million in 1973.
Oceania
gross value of rural production and farm costs areestimated to have increased further, by 26% and15% respectively. With the end of the drought thevalue of 1973/74 crop production was about 63%above 1972/73, wheat and barley contributing mostof the increase. The rise in the value of livestockproduction was, however, only about 8%, beef andveal accounting for most of the increase.
Farm income in New Zealand, which reached arecord level of NZ$515 million in 1972/73, is esti-mated to have fallen to about NZ$500 million in1973/74, and a further drop to $465 million has beenprojected for 1974/75. The gross value of farmproduction in 1972/73 was NZ$1 534 million, 36%above 1971/72. Although the total volume of pro-duction was slightly lower, prices averaged sharplyhigher for wool, beef, mutton and lamb. The indexof prices received for farm commodities duringthe April-June quarter of 1973 was 42% above thatof a year earlier. Although production costs alsoincreased, the April-June farming-costs price indexwas only 16% above the corresponding quarter of1972. The reduction in New Zealand farm incomefor 1973/74 reflects the diminished production ofwool, mutton and lamb, and dairy products largelycaused by drought conditions in 1972 and 1973.Also, the index of prices received for farm commodi-ties levelled off during the second half of 1973 andbegan to turn downward early in 1974. An addi-tional factor was the increase in farming costs ofabout 13% for 1973/74. During 1973, New Zealandsheep farmers deposited NZ$95 million under theFarm Incomes Stabilization Scheme, almost $10 mil-lion more than the announced target.
Problems, policies and programmes
Strong export demand for most of their majoragricultural commodities since 1972 has, at least

temporarily, altered significantly the nature of theproblems confronting Australia's and New Zealand'sagricultural sectors. The marked improvement infarm incomes has, however, made available importantadditional means for dealing with these problems.The many commodity stabilization schemes and mar-keting board arrangements that have been establishedin both countries to absorb the more severe shocksfrom sharp falls in export prices for the commoditiesconcerned are being continued.' Moreover, good ex-port market prospects have allowed a relaxation ofrestraints on wheat, sugar and rice production inAustralia.
Because of the region's heavy dependence on exportmarkets as outlets for its major farm commodities,its agricultural sectors are highly vulnerable to fluc-tuations in world market prices. Recent experiencehas reemphasized that prosperity for the Australianand New Zealand agricultural sectors, on anythinglike their present scale, depends primarily on ex-ternal conditions: world demand/supply balances fortheir commodities and for competing products; andthe manner in which the Govermnents act individuallyor jointly to deal with problems created by thesebalances, especially with regard to specific arrange-ments for international trade in food ancl agriculturalcommodities. Thus both Governments are keenlyinterested in proposals regarding world food securitystocks, food aid and other items on the agenda ofthe United Nations World Food Conference, thepresent round of multilateral trade negotiations spon-sored by GATT, and FAO proposals concerning astrategy for international agricultural adjustment, aswell as related policies and measures adopted byindividual major importing countries.
Both Australia and New Zealand have obviouslybenefited enormously from the strong export demandfor their commodities in recent years. The notablymarked increase in farm income provides an excellentopportunity for farmers to make further innovationsin their farming operations. The improved liquidityof many farmers has facilitated larger investments innew inputs and improved technology, enabling themto increase productivity and reduce costs so as tomake their farms more secure against periodic lowcommodity prices associated with normal marketfluctuations; their liquidity also helps them to remaincompetitive in world markets and to adjust produc-tion to changing patterns of demand. If investmentsare directed toward increased productivity and lowercosts in traditional patterns of production, however,rather than toward new systems better suited to meetnew and changing demand patterns, much of theirpresent advantage could be lost. To take full ad-
I For details, see The state of food and agriculture 1973.
64
vantage of this opportunity, farmers in both Australiaand New Zealand need clear signals as to whichadjustments and investments they must make nowin order to be in a good position to meet marketconditions in the late 1970s.
WHEAT PRODUCTION AND STOCKS
Strong export demand and the very small carryoverfrom the previous marketing season led the Austra-lian Government to encourage virtually unlimitedwheat production in 1973. Delivery quotas wereincreased to 14 million tons, only slightly less thanthe record harvest of 1968, and guaranteed advancepayment for deliveries from the 1973 harvest wasraised by A$0.10 per bushel to A$1.20. The wheatarea was increased by 18% to 9.0 million hectares.The crop was adversely affected by unusually wetweather and suffered from rust and other diseaseproblems in the eastern wheat area, while WesternAustralia had a favourable season. The 1973 pro-duction is estimated at 12 million tons, almost doublethe drought-stricken level of 1972; there was how-ever an unusually large proportion of off-grade wheatdue to rust damage. Wheat exports were doublethose of the previous season, but again limited by theavailability of supplies. End-of-season stocks werestill at a minimum level (Table 2-5).
Prospects for the 1974 harvest were good. Plantingswere estimated to be about 15% larger than in 1973,with moisture conditions at least adequate for normalyields. In view of present export prospects, however,a harvest of 10 to 12 million tons is likely to leaveend-of-season stocks at a minimum level for thethird consecutive season.
TABLE 2-5. AUSTRALIA: SI, PPLY AND UTILIZATION OF WHEAT
Preliminary. Indicated. 3 December-November year.- 4 Includes wheat equivalent of wheat flour.
WOOL PRODUCTION AND PRICES
Australia's wool production in 1972/73 dropped to737 000 tons, 16% below the previous season. Thisdrop reflected an acceleration in the rate of declinein the number of sheep and a reduced clip per head.
Mil ion metric tolls
Beginning stocks 3 1.4 0.5 0.5Production 6.4 12.0 10.0-12.0Domestic use 3.2 3.4 3.7Exports',Ending stocks a
4.10.5
8.60.5
6.3-8.3
1972/73 1973/74 I 1974/75 2

Between 31 March 1972 and 31 March 1973 thenumber of sheep fell 14% to 140 million (the lowestlevel since 1956), because of the continued highslaughtering rate of both sheep and lambs, a par-ticularly low lambing rate and a larger than usualnumber of deaths on farms caused by drought. Thebelow-average clip per head and the poor lambingrate were also indicative of the poor weather. Woolprices showed considerable variation during the sea-son, with the greasy auction price averaging 183.77Australian cents per kilogram, a 144% increaseover the previous season. The Australian WoolCorporation (Awc) reduced its stocks of wool to aminimal level during the season. For the 1973/74season Australian wool production was estimatedat 701 000 tons, 5% below the 1972/73 production.A substantially lower slaughter rate halted thedecline in sheep numbers, and improved weatherincreased the average clip per head and brought, aswell, a more average lambing rate. Wool prices again
Development plans and policies
Recent experience in Latin America has made in-creasingly evident the importance of periodic evalua-tion and revision to effective planning. Both Para-guay and Peru modified their medium-term plans in1973 after comparing actual performance with theoriginals. In Argentina, control and evaluation of theplan, including periodic revision of its programmesand projects, are now routine practice in implemen-tation. Despite the progress in planning made inmany countries, however, commtmication betweencentral planning agencies and sector planning officesis virtually nonexistent or scarcely used. Further-more, the budget of the Ministry of Finance and theannual operational plans of the various executingbodies, including ministries, show only a partial con-formity, although for good planning it is essentialthat the annual programming efforts of the budgetaryauthority and the executing agencies be closelyaligned. If the quality ad delivery rate of agricul-tural plans, programmes and projects are to be"mproved, the programming office of the ministriesof agriculture need strengthening in both their or-ganizational and technical capacities.
New development plans were put into effect inArgentina, Barbados, Costa Rica, Ecuador, El Sal-vador, Honduras and Uruguay in 1973 and thefirst months of 1974. Plans were also being draftedor revised in Brazil, Jamaica, Nicaragua and Vene-
65
showed considerable variation during the season,with a general downward trend, but the season aver.age was close to that of 1972/73.
In New Zealand both wool production and sheepnumbers declined in 1972/73, each by 4%, to 309 000tons and 56.7 million head respectively. As inAustralia, drought encouraged more severe cullingof ewes and reduced the average clip per head shorn.Auction prices for greasy wool averaged 143.96 NZcents per kilogram, 117% above 1971/72. TheNew Zealand Wool Marketing Corporation com-pleted disposal of its stock carried over from theprevious season and made no purchases from the1972/73 clip. New Zealand's 1973/74 wool pro-duction was estimated at 300 000 tons, 3% below1972/73 and the third consecutive annual decline.Drought conditions, which continued during theearly part of 1973, lowered the lambing rate. Auctionprices fluctuated during the season, showing a gen-erally downward trend.
Latin America
zuela." All the plans emphasize increased outputbut high priority is also given to a more equitabledistribution of earning capacity and income, to areduction in regional differences in production andincome and, lately, to the development and conserva-tion of natural resources. Resource conservation hasreceived attention in the plans of Argentina, Brazil,Colombia and Honduras, while in some of the newplans, such as those of Argentina and Costa Rica,there is support for political and economic integrationon the subcontinent.
Argentina's three-year plan for reconstruction andnational liberation (Plan Trienal para la Reconstruc-ción y la Liberación Nacional) for the period 1974-77has established a system of concerted planning, whichimplies active and effective participation of all sectorsof society and the economy in preparing and executingdevelopment plans and programmes. This frameworkhas been set up, in particular, for the elaboration andimplementation of agricultural and rural developmentprogrammes. A special committee in the Ministryof Economy, composed of representatives of pro-ducers and their cooperatives, agricultural labour,agro-allied industries, consumers and the public sector,will be the principal body to elaborate them. Centralobjectives of the present plan are the achievement ofsocial justice, which implies a more equal distribution
2 The main features of current development plans in LatinAmerica are given in Annex table 12.

of means of production and income; the regainingof economic independence; the strengthening of thepublic sector; and economic and political integrationwith the rest of Latin America. For agriculture theplan has set the following basic goals: an expansionof output; a more equal distribution of agriculturalincome; a more appropriate regional distribution ofoutput and income in the sector; the provision ofagricultural inputs and services for all producers,including marketing activities in the public sector;and an increase in the participation of the rural pop-ulation in the process of political, economic andsocial development. The plan calls for a specialtax on land in holdings, a forestry law, a programmeof rural housing, price policies, a nutrition programmeand a comprehensive national food supply plan.
Bolivia's long-term strategy for the years 1971-91aims to reduce the economy's dependence on theforeign sector and to involve the rural populationmore closely in social, economic and political develop-ments. The 1973-77 national development plan, aspart of this perspective framework, stresses the needfor an accelerated and continued expansion in thedirectly productive sectors, a more intensive utiliza-tion of existing infrastructure, an increase in exportsand a selective substitution of imports. To strength-en the planning system, major responsibility wasshifted in September 1973 to the Secretariat of theNational Economic and Planning Council, located inthe President's Office.
The new Government of Brazil, soon after itsinstallation on 15 March 1974, identified its majorproblems as inflation, income distribution, illiteracyand the quality of the public health services. Atpresent, the Ministry of Planning is preparing a newdevelopment plan in close collaboration with sectoralprogramming units such as the Under-Ministry forPlanning of the Ministry of Agriculture (SUPLAN), theNational Institute for Colonization and Agrarian Re-form (1NcRA), the Superintendency for Fishery De-velopment (suutipE), as well as with regional plan-ning bodies. A special secretariat for environment,created in the Ministry of the Interior in October1973, is in charge of preparing and coordinatingprogrammes for developing regional and naturalresources.
The change in Chile's Government in September1973 caused radical reorientation in economic policyand development strategy. In place of the planningeffort which was previously compulsory for the publicand social property sectors and indicated for theprivate sector, present policy-making is geared to thecontext of a liberalized market economy. Althoughsome national planning activities have been envisagedin the government programme, the role of centralplanning, with the State predominating, will becomemuch less important. The new system of planning
66
is to become largely decentralized, with the regionshaving their own responsibilities in formulating, pre-paring and executing their development objectivesand plans. The overall goal of the present develop-ment programme is a 6% annual growth of thegross domestic product (Gm)), with special prioritygiven to increases in agricultural and industrial out-put. While structural change through agrarian re-form, for instance, has been discontinued, agricul-tural policy is basically designed to increase outputfor domestic consumption and export. Governmentprogrammes aim to improve relative prices forfarmers and expand technical assistance for productionand marketing, agricultural credit and improvementin farming methods. The ECA (Empresa de ComercioAgrícola) will continue to be the Government's pur-chasing agency for domestic and imported agricul-tural commodities, although the private sector mayundertake such activities. Agricultural program-ming is now carried out by a work group consistingof representatives of the Ministry of Agriculture, itsAgricultural Planning Office (oDEpA), the NationalDevelopment Corporation (coRPo), the AgriculturalDevelopment Institute (INDAP), the Agrarian ReformCorporation (coRA) and the central bank.
The 1971-75 development plan of Paraguay hasbeen modified in a revised plan for 1972-77. Majorobjectives for agricultural development are a moreintensive utilization of natural resources and ofthe capital invested in the sector, in order to expandexports of both traditional and nontraditional com-modities. Public investment in agriculture will in-crease by 26% and would thus account for 16%of total public investment expenditures in 1977. Acredit programme to assist small and medium farmershas been set up to expand output, mainly of suchexport crops as cotton, soybeans and tobacco.
The biennial plan (1973/74) of Peru, preparedwithin the framework of the national developmentplan (1971-75), shows modifications and adjustmentsnecessitated by the changes which occurred in theeconomy during 1971 and 1972. The biennial planindicates the determination of responsible authoritiesto consider planning as a continuous process, withperiodic evaluations of progress. The general objec-tives of the plan are a substantial increase in em-ployment opportunities (a net increase of 300 000in the labour force); greater self-sufficiency; strength-ening of economic and administrative decentraliza-tion with a view to stimulating development outsidethe Lima-Callao area; greater participation of thewhole population in political, social and economicprocesses, e.g., through expansion of the "socialproperty" sector; and generally more State influenceon the economy. Emphasis is placed on expandingthe supply of consumer goods for poorer people andincreasing the coverage of the social services. Invest-

ment expenditures should increase by 47% over1971/72. Agricultural development programmes fea-ture the expansion of output and rural employmentwithin a newly established agrarian structure. Theagrarian reform process will continue along the fol-lowing lines: creation and expansion of new systemsof ownership of the means of production; just distri-bution of and increase in rural incomes; establishmentof cooperatives to facilitate the development of effi-cient production units; improvement of the market-ing system; and greater participation of the ruralpopulation in the decision-making process. Integraldevelopment programmes (Pin) and integral projectsfor rural settlement (PIAR) aim at maximizing ruralemployment in the new land-tenure and productionsystems. Recently the Government has elaborated awell-designed package programme of crop develop-ment in selected areas involving seed, fertilizers,credit and technical assistance; it also intends tointroduce a centralized planning system for the plant-ing of crops.
Uruguay's national development plan (1973-77) isprimarily indicative, like many other Latin Americanplans. It gives attention to the expansion of outputof the traditional export products: meat, wheat andwool. The public sector will play a greater role inthe relocation of small farmers on underutilized landsexpropriated by the State. The area cultivatedshould expand slightly from 1.29 to 1.32 millionhectares during 1974-77. In addition, the Govern-ment will take measures to improve and expandstorage and transport facilities. Increases in thevolume of exports are also to be encouraged by fiscalmeasures, consumption restrictions (meat) and main-tenance of large-scale production units (latifundio)in agriculture.
The principal targets in Colombia's agriculturaldevelopment strategy are increased output, expansionof employment and agricultural earni:ngs, more equaldistribution of means of production and income,improved use and conservation of natural resourcesand higher standards of living for the rural popula-tion. Among the means of achieving these goals aretechnical assistance and credit programmes, market-ing and price programmes and policies, agrarian re-form and policies aimed at better utilization of nat-ural resources (under the Institute for Developmentof Natural Resources [INDERENA]).
The main medium-term objectives of Ecuador'scomprehensive plan of transformation and develop-ment, 1973-77, are agrarian reform, strengthening' ofthe public sector, including tax reform and improve-ment in the administrative structure, and reform ofthe financial, banking and credit systems. The fol-lowing priority areas have been selected to strengthenpublic planning organization: (1) widening of thetasks of planning and coordinating bodies, including
67
regionalization of the planning effort; (2) creationof strong sector programming and evaluation offices(during the preparation of the present plan the rela-tions between the central planning body and theministerial planning units, including that of the Minis-try of Agriculture, were very limited); (3) strength-ening of the National Development Bank and theEcuadorian Institute for Agrarian Reform and Col-onization (IERAc); and (4) application of modernsystems of budget planning and control procedures.Heavy investments in agrarian reform, colonizationand the irrigation infrastructure are a major featureof Ecuador's agricultural development programme.
Although Mexico has no overall economic plan-ning process, there are various programming effortsin conjunction with short-term planning, budget prep-aration and economic and financial policies. Inprinciple these activities, including elaboration ofannual public sector plans and sectoral programmes,are performed by the Ministry of the Presidency, theMinistry of Finance and the Ministry of NationalDevelopment (Secretaría del Patrimonio Nacional).Hitherto, because of the lack of effective channelsof communication between the public and privatesectors, it has been rather difficult however to relatethe two types of programming. Despite the limita-tions of formal methods, a medium-term planningeffort for the period 1970-80 was carried out late in1973. According to its projections, agricultural grossdomestic product should grow annually by 3.7 to4.8%, industrial production by 8.9 to 9.2%, construc-tion by 8.3 to 8.6% and commerce and service 6.9to 7.9%; the overall growth rate would amount to7 to 8% a year. In the longer run, major emphasisis put on the creation of new jobs and a more equi-table income distribution. Specific goals for agricul-ture are sustained increases in output, expansion ofemployment opportunities, increases in small farmers'incomes and improved nutritional levels.
Government poJicies in 1974 aim at further orga-nization of small farms; more infrastructure pro-grammes, including irrigation works (rehabilitationprogrammes and small-scale irrigation under theBenito Juarez Plan); expansion of agricultural credit;wider coverage under the crop insurance system;higher support prices, especially for the basic foodcrops; and considerable expansion in the capacity ofthe fertilizer industry.
High priority has been given to expansion of agri-cultural production and rural development because ofunsatisfactory recent performances. The NationalProgramme for Food Production deserves specialmention. Its central objective is a 5% average annualincrease in basic food production over a period often to fifteen years. Short-term targets are incorpora-tion of 200 000 hectares of unused arable land, ex-pansion of credit and technical assistance, especially

for maize, wheat, beans and oilseed crops. Thisprogramme will be administered by newly createdState councils (juntas), in which regional bodies ofthe public sector, ejidatarios, comuneros, small in-dividual farmers, credit institutions, and other in-terested groups will take part. The Governmentintends to bring more industrialization to rural areas,using the National Fund for Development of theEjidos (Fondo Nacional de Fomento Ejidal) for thispurpose, and it aims to create more new jobs inbackward rural areas through the Public InvestmentProgramme for Rural Development.
The 1974-78 national development plan of CostaRica has the following objectives: purposeful em-ployment policy; improved income distribution; in-creased diversification of production and exports;greater efficiency in the public sector; and higherrates of saving and investment. It emphasizes thatthe standards of living of the entire population canrise only through economic growth and changes inproduction and sociopolitical structures. There isto be strengthening of the public sector. Expansionof employment is also given priority, especially inthe more productive sectors. In agriculture, humanproductivity should increase through better utiliza-tion of arable land with irrigation and drainageschemes. During the period covered by the planthe number of jobs needed for new entrants in thelabour force is estimated at 127 000; in addition, asharp reduction in the present unemployment andunderemployment rates is strongly required. Theagricultural sector should absorb some 18% of thegrowth in the economically active population in theperiod 1973-78, whereas its share of the active labourforce should decline from 37.0 to 34.5%. The planproposes the establishment of a National Interminis-terial Committee for Labour and Employment tomonitor and coordinate efforts toward creating em-ployment. Targets in the agricultural strategy, inwhich Central American integration is specificallymentioned, are an increase, or at least a maintenance,of the growth rates of agricultural exports; agricul-tural growth and development, to contribute moreeffectively to red ucing income disparities; and moreformal regionalization of agricultural activities as away of widening the resource base. The plan hasfour main fields of action: the coordinated planningand execution of the agricultural agencies; the de-centralization of planning and plan implementation;the participation of farmers and campesinos in thedecision-making process; and the concentration ofpublic resources in selected priority programmes andprojects.
The new national development plan of Honduras(1974-78) contemplates fundamental changes in theeconomic and social structure. Its main objectivesare the insurance of sufficient income to the whole
68
population, satisfying basic needs in nutrition, hous-ing, education, health and employment; the achieve-ment of a more equal distribution of income andmeans of production; the transformation of the pro-duction structure; and the rational exploitation ofnatural resources. The strategy for agricultural de-velopment relies heavily on agrarian reform andforestry development. It stresses the importance ofland, the creation of employment and the transfor-mation of the latifundio-minifundio structure into amodernized agriculture with viable production units.There are programmes for integrated agrarian reform,in which some 100 000 families will be settled on600 000 hectares. All forest resources are to benationalized, and a forestry development corpora-tion is to be established. Farm communities andcooperatives will be enabled to share in the develop-ment of these resources. The forestry programmeincludes timber conservation, development of a woodprocessing industry, better quality timber suppliesand increased exports.
In the Dominican Republic the comprehensive planfor agricultural development (Plan Integrado de De-sarrollo Agropecuario [PIDAGRO]) of 1970-74 aimed atincreasing the output of small farmers and strength-ening the public sector; it had a strong regional ap-proach to agricultural development. Regions weresubdivided into communities where small farmerswere encouraged to participate actively in planningand executing agricultural programmes. The firstphase of the plan included sub-programmes in re-search, technical assistance, training, animal health,livestock production, credit, cadastral activities andsoil-capability studies, as well as institutional im-provements. The second phase places emphasis onmarketing, agrarian reform, irrigation and drainage,reforestation and community development.
The new four-year development plan (1974-77) ofBarbados notably strives for a decrease in the un-employment rate, which presently stands at 11%,and an expansion of the productive capacity of thewhole economy. The plan requires more investmentin the sugarcane and banana subsectors as well assome diversification of agricultural production forimport substitution.
Jamaica's general priorities are the developmentof human resources and the revitalization of agricul-ture through land settlement programmes and ex-pansion of social services such as housing andeducation. The Green Paper containing the Govern-ment's proposals for agricultural development in-dicates the following main lines of action: moreequitable distribution of agricultural land; more effi-cient utilization of natural resources, especially ofland through land reform, land settlement and infra-structural works; setting up of training, education andextension services to farmers; reorganization and ex-

pansion of research activities, as well as .the intro-duction and wider application of new technologies;creation of cooperation schemes for farmers; andimproved agricultural credit and marketing.
In St. Kitts-Nevis, the Agricultural DevelopmentAct of 1973 airm at higher incomes, increased cm-ployment opportunities and a be,tter standard ofliving. The Act provides for the establishment of aland development authority and stresses the impor-tance of creating economically viable farms. Thereis to be a central agricultural marketing corporation.
Integrated rural development
An integra ted approach to rural development is notnew; commonly known as the package deal, orprogramme, it originated in India late in the 1950sand early in the 1960s. There are always problemsassociated with it, including where and when itshould be used, its content and 1,vho should receiveits benefits.
As funds for rural development are extremelylimited in all developing countries, the choice ofareas to receive a package deal has to be approachedwith great care. Recent experience in Latin Americahas shown that a conflict between welfare and more.purely economic considerations can arise in makingsuch a choice. The "community development" ap-proach is based essentially on improving basic ser-vices to poor rural areas, regardless of their economicpotential; clearly, this is the welfare choice. A secondapproach gives priority only to those rural areaswhich have distinct possibilities of development, de-spite their present depressed conditions. It appearsthat a gradual shift toward the second approach isnow taking place in Latin America. Chile adoptedthe selective approach as far back as 1964 and ap-plied it more vigorously after 1970, but the recentpolitical and social instability has eroded its prog-ress. Since 1969 Peru has chosen the more rigorousapproach applying it only to areas with developmentpotential, and Ecuador has followed suit since 1972.Bolivia is at present applying its rural developmentprogramme over large areas, thus precluding con-centrated efforts. In Colombia, welfare aspects seemto have priority in rural projects currently under prep-aration, although there is a less pronounced biastoward areas with economic potential.
Progress with package programmes varies greatlyin Central America. Only Honduras and, to a hm-ited extent, Panama have been actively interested,while El Salvador and Guatemala are limiting theirsupport to community developmi-
The recent experience of Ecuador and Peru withintegrated rural development in areas with economicpotential is briefly examined below.
69
ECUADOR 3
Rural development in Ecuador has been handi-capped by the relatively large number of publicand private agencies involved. This problem is notlimited to Ecuador, of course, or to rural develop-ment; but it has led to much duplication of effort,waste of all kinds and relatively few positive results.
Recently, there have been serious attempts toovercome this handicap and to organize a new multi-agency programme of clearly defined and locatedprojects. This programme is based on the activeparticipation of the farm population and relates toa wide range of activities, including land redistribu-tion, water supply, credit, technical assistance, mar-keting, training and education.
First efforts have been concentrated mainly in theAndean and inter-Andean area with twenty-fiveheavily populated rural areas in the Sierra havingbeen identified as possible choices. Final choice ofan area depends on certain criteria. First, informa-non is needed about such basic items as populationdensity, land tenure and availability of water. Then,consideration must be given to the ethnic and socialstructure of the population, the existence of projectsfor natural resource development and the generallevel of knowledge about the areas concerned. Fi-nally, account must be taken of the interest andcapacity of the population to participate actively andresponsibly in projects, together with the existenceof public and private development institutions in theproject area, or capable of operating in it, and eco-logical characteristics (soil, water, climate) favour-able to the success of the project.
Applying these basic criteria, it was decided tobegin rural projects in four areas: Ayora-Olmedo-LaEsperanza, Chota, Quero and Columbe.
A general outline of the Ayora-Olmedo-La Espe-ranza project is given to illustrate the nature of thesefour projects. The area covers approximately 161square kilometres. It is divided into two sectorsseparated by a belt of farms not included in theproject and encompasses part of the parishes of LaEsperanza and Angochagua (in Imbabura Province)and Olmedo and part of Ayora (in Pichincha Prov-ince). About 6 700 people, all Indian, live in theproject area, mostly on farm settlements. A surveyconducted in 1971 in El Abra, a farm settlementof 210 people, yielded the following data: school at-tendance (6-15 years of age), 54%; illiteracy (popu-lation above ten years of age), 70% (male, 59%;female, 83%); school instruction for population aboveten years of age, 5%.
3 Based on Informe de Identificación de Prioridades de Inver-sión en el Sector Agropecuario de Ecuador, August 1973.

The inhabitants are almost exclusively farmers.Some estates have already benefited from agrarianreform projects now in progress. Holdings awardedfor individual or collective farming average 6 to 8hectares per family. On two of the three projectsin progress in the area, plans call for collective culti-vation of most of the arable area. The principalcrops are barley, wheat, lima beans, potatoes and, toa lesser extent, beans, peas and maize. Cattle, par-ticularly dairy herds, are important, but sheep andpigs have a significant complementary role in theeconomy. The principal products sold are barley,wheat, potatoes and milk.
In the area of the Cayambe project the annualincome of the ex-sharecroppers (an average of 4hectares cultivated) is estimated at 5 000 sucres (US$200) and that of the "apegados" (less than 2 hectarescultivated) at 3 500 sucres (US$140).
The breakup of estates has given rise to well-knit,active peasant cooperatives, the oldest and most sig-nificant of which are in the Pesillo project, wherethe leaders exert remarkable influence. The humanpotential of the area is on a level with the naturaldevelopment potential. Several institutions operatein the area.
The poor living conditions there are graduallybeing improved by programmes for the transfer oflands and the exploitation of natural resources alreadybegun in several sectors.
The zone in which the project area is situatedhas been defined as humid mountain forest (ph-MB),having an average annual rainfall of about 1 000millimetres, with peak precipitation in April andNovember; there are on the average 149 rainy daysa year, and the annual average humidity is 78%.Temperature records show an average monthly peakof 13.5°C in May. The low-lying zone is a broad,almost flat valley with a few streams. The substratumis hardened "cangahua," a deposit of ancient volcanicash, over which more recent accumulated ash hasgiven rise to the present soils; these are of irregulardepth and in very extensive patches have been entirelyremoved by erosion, leaving the cangahua exposed,particularly on slopes. A detailed study of the soilsat Pesillo, with a map on the scale of 1:5 000, foundthat a layer of hardened cangahua appears on thesurface or at depths of as much as 1 metre. There areeight soil series, ranging from deep and very deep well-drained loams with black volcanic ash, to very poorlydrained peaty soils. The Cayambe regional land-transfer project includes a description of the arableareas on the eight estates covered by the project. Twoland-use maps on a scale of 1:5 000 have been drawnon the basis of the existing soil map of the PesilloEstate. One of them shows the land-use potential indetail; depth of the soil, slope of the ground anddrainage were the three main factors considered in
70
determining fifteen land-use categories, indicating theconditions of the soil (apparent fertility, depth andpermeability), measures required for improvementand, generally, the importance Of conservation mea-sures.
These studies provide a good basis and model foraction in the rest of the Ayora, Olmedo and LaEsperanza area since prevailing conditions and char-acteristics are highly similar to those of the PesilloEstate.
The soils are now being used inainly for wheat,barley, potatoes and pasture and, on a lesser scale,maize, peas, lima beans, quinoa, vegetables, fodderoats, sorghum and crops to cover local needs. An-other major crop in the higher zones is pyrethrum,for which much manpower is needed. Livestockproducts include mutton, wool and pigs, and par-ticularly milk. The sheep and pigs are native breeds,kept in common folds and sties without special fa-cilities. As regards water resources needed for ir-rigation, good information is available relating tothe existing hydrological study of the area, the sourcesof water supply, the flow rates of rivers and the pres-ent irrigation network on the estates. The sourcesof water supply for the area are varied in partic-ular, La Chimba river. The upper reach of thisriver is easy to tap for irrigation purposes becausethe stream course is not very deep. Tapping themiddle and lower courses would be very difficult, ifnot impossible, because the stream course graduallydeepens, with the bottom sinking to below irrigationelevations. The entire basin of this river must bemaintained and conserved to prevent the flow fromdiminishing in volume from year to year. Part ofthe irrigation system would function by gravity.
Although there is no specific study for forest de-velopment, the Forestry Service of the Ministry ofAgriculture takes the view that there are some areas,not completely defined, available for forest plantingand extraction operations. An important project isabout to begin in the Angla and Topo highlands withthe following recommended species: Eucalyptus glo-bulas (blue gum, or eucalypt), for timber stands;Prunus serotina (capuli, or black cherry); Cupressuslusitanica (Portuguese cypress); and Pinas radiata(Monterey pine), which should be used together withblue gum for shelterbelts.
On the basis of all these surveys it has been rec-ommended that operations for the integrated devel-opment of the area be concentrated on some 15 600hectares between the villaLY,es of Ayora and La Es-peranza, with projects that will encourage active par-ticipation by the peasants in order to generate changesof attitude, opportunities and income levels. Theguidelines for action were developed with the helpof the information obtained froin the Cayambe re-gional project, the Pesillo resettlement project, the

El Abra resettlement project and other sources,including the provincial-level documents prepared bythe Andean Mission.
Perri 4
In Peru integrated rural projects are associatedwith areas undergoing agrarian reform. Criteria usedin selecting project areas have been the area's sig-nificance in agrarian reform at both regional and na-tional levels; the likely social and economic returnsfrom investment in each area, particularly in termsof food production, redistribution of income and in-creases in per caput income; the possibilities of animmediate improvement in the irrigation systemsthrough application of the new water-use code; thenormal requirements of financing agencies relatingto technical, economic and financial feasibility ofinvestment projects; and the availability of basic in-formation, including engineering, soil, water and mar-keting studies and appraisal of local administrativecapabilities to cope with new projects.
The projects are largely based on production pos-sibilities within a five-year period and take into ac-count, as realistically as possible, likely changes infarm management practices during this period.
An objective of the first projects approved was arapid improvement in earnings and living conditionsof some 24 000 peasant families who had already beenawarded lands under the agrarian reform. A coop-erative system was introduced in farm management,with farmer training and technical assistance. Fa-cilities for improving the marketing and processingof local produce were also given priority. Specialimportance was at first given to the identification ofareas in the coastal strip, where agrarian reform wasbeing strongly pushed, and then the Ferrefiaje andVirti area projects were started. The studies werelater broadened to include the Andean zone, whichresulted in the Anta and Lampa-Capachica projects.The projects are based on a specific provision inArticle 92 of Decree-Law 17716.5
Area projects in Peru encompass six main pro-grammes which relate to the following:
land tenure (expropriations, awards, organiza-tion of enterprises);
production (crops, forest plantations, livestock,crafts, poultry raising);
't Based mainly on the Plan for the development of agricultureand marketing in agrarian reform areas of Peru, General report,May 1971.
5 It reads: "Once an Agrarian Reform District has been defined,the General Directorate for Agrarian Reform and Rural Settle-ment, in coordination with the Settoral Office of AgrarianPlanning (OPSA), shall draw up the plan for the development ofsaid district, covering problems of research, extension, develop-ment, credit, protection, marketing and others that will necessarilycomplement the operations to change the land-tenure structure."
71
training and technical assistance programme (re-gional centres, technical assistance, area trainingcentres);
infrastructure (roads, electrification, construction,irrigation and drainage);
marketing and agro-industry programme (phys-ical plant, market organization);
credit.
The land tenure programme provides the basicframework for the other five programmes. The Gov-ernment adopts a procedure in each agrarian reformarea for awarding expropriated lands, which mayvary from one area to another; it determines thearea to be awarded, the number of peasants to benefitand the method of organization to be used for im-proving conditions.
There is careful programming of crops, livestockand other activities to make the best use of availableresources. A production schedule is prepared foreach area, including several alternative cropping pat-terns which take full account of local conditions.
National targets and the broad framework foragricultural development are decided at the nationallevel in the Ministry of Agriculture and transmittedto planning offices in the different agrarian reformzones. These offices work closely with zonal councils,in which farmers' cooperative organizations are fullyrepresented, and help in the preparation of guidelinesfor production cooperatives in the areas concerned.It is understood that farm planning must not be over-centralized and that farmers must have ample op-portunity to take part in the process themselves.
To improve managerial skills and knowledge, avital part of the project, the Government of Peruhas set up an agency called the National AgrarianReform Training and Research Centre (cENctRA),which is amply financed and receives technical andfinancial support from the United Nations Devel-opment Programme (uNDP) and FAO.
Since infrastructure is generally poor in the agrarianreform zones, each area plan contains proposals forimprovements. Major emphasis is given to structuresand roads at the farm level. Area plans do notprovide for large-scale irrigation works, networks ofprimary roads or electric power stations. At firstthey are limited to complementary or secondaryworks, either independent or part of more broadlybased and costly national programmes.
The marketing of agricultural and livestock prod-ucts is one of the weakest links in Peruvian agricul-ture. Marketing channels are well established forexport products, such as cotton and sugar producedby the large landed estates (latifundios), but verydeficient for other commodities sold mainly by peas-ant farmers. Improvements in marketing are thus

being directed to the needs of the peasant farmer,notably the provision of a suitable network of publicstorage facilities. A radical change in farm creditfacilities has also been accepted as essential.
Regional economic integration
Economic integration in Latin America continuesto follow the pattern of recent years. The CaribbeanCommon Market and the Andean Group representthe more imaginative and active schemes, whereasthe Latin American Free Trade Association and theCentral American Common Market have not so farachieved positive results. The Caribbean countrieswhich in 1968 founded the Caribbean Free TradeAssociation (CARIFTA) on 4 July 1973 signed thetreaty creating the Caribbean Community and theCaribbean Common Market (cARtcom) in Chagua-ramas. The main objectives of this new integrationscheme are a common trade tariff agreement, com-mon trade regulations, harmonization of taxationsystems and of economic legislation, rationalizationof agriculture, a common rate of exchange, coordina-tion of economic policies, a common advisory ser-vice on development planning, a joint action pro-gramme for industrial development and joint promo-tion of tourism.
The CARICOM Treaty provides for special treatmentof the less developed countries of the CaribbeanCommonwealth, including concessions in customrights, fiscal incentives, phasing of the external tradetariff agreement, special treatment for exports fromthe less developed countries in the region to theothers and assistance in the promotion of exports.The Treaty of Chaguaramas also refers to direct co-operation of associated institutions with ministerialcommittees; among these institutions are the Carib-bean Development Bank and the Caribbean Invest-ment Corporation.
The Caribbean Community Secretariat is studyingcentralized bulk purchasing of some essential im-ported commodities for the CARIFTA/CAR1COM area, tocombat rapidly increasing import prices and trans-portation costs and to reduce the cost of living. Ata meeting of the CARIFTA/CARLCOM Council of Min-isters held at the beginning of 1974, the Secretariatsuggested the establishment of a regional trade boardwhich would consist of representatives of govern-ments and of the private sector.
The most interesting event relating to agricultureunder the Cartagena Agreement was the First Meetingof the Ministers of Agriculture at the end of January1974. Agreement was reached on the following im-portant items: to intensify the movement towardregional integration in conjunction with current effortsat national agricultural development; to establish theoperational procedures for achieving integration of
72
the agricultural sector in the shortest time possible;to coordinate national agricultural development poli-cies which afford possibilities of agricultural com-plementarity among the countries of the sub-region,taking into consideration not only the comparativeadvantage, but also the impact in depressed areas andin those with high population density; to give highpriority to the supply of agricultural products; toharmonize the action of member countries in agricul-ture in international forums and in other sectoralmeetings; to intensify the programmes of scientificand technical cooperation among member countrieswith the aim of reducing technological dependenceon other countries, and to accelerate the process ofspreading the technology developed or adapted bythe countries of the sub-region; to adopt norms andestablish a system for coordinated implementation ofsanitary programmes for plants and animals in orderlo facilitate the trade of agricultural products; tocoordinate and direct forestry policies toward rationaluse and conservation of national resources; to requestthe Cartagena Agreement's governing bodies to mod-ify the institutional framework of the board so asto strengthen the technical resources required in theagricultural integration process; and, lastly, to co-ordinate joint 'actions in order to create a strongerbargaining power in the importing of food and agri-cultural inputs.
Ministers of agriculture of the Andean Pact attend-ing this meeting also recommended the establishmentof an agricultural council to the Commission of theCartagena Agreement board, which would periodi-cally analyse the progress of integration, create thenecessary worlcing groups and strengthen the unitsdealing with agricultural integration in the ministriesof agriculture of the member countries. They alsorequested that the board submit proposals for jointprogrammes to encourage production of cereals,oilseeds and livestock, and that it carry out a fea-sibility study in cooperation with the Andean De-velopment Corporation for the creation of a sub-regional agricultural system.
Economic integration of Central America continuesto be held back by a lack of policy decisions, despitethe 15% rise in intraregional trade in 1973.
FAO has published a perspective study of devel-opment and integration of the agricultural sector inCentral America up to 1990.° It elaborates twomain growth paths: in the first the present patternof income distribution and present use of productionfactors would continue in the sub-region, while inthe second there would be changes in income distribu-tion and the structure of landholding, as well as more
6 Perspectivas para el Desarrollo y la Integración de la Agri-cultura en Ccntroamerica, prepared by the UNDP/FAO AdvisoryTeam on Central American Economic Integration (GAFicA),Guatemala, 1974.
efficient use of production factors to maximize em-ployment opportunities. The second hypothesis alsoimplies that, as part of the integration strategy,disparities in the GDP growth rates of member coun-tries will gradually be reduced. The rAo studypresents a general strategy with two main features:to increase and diversify production in accordancewith the growth of domestic demand, derived fromhigher incomes and more equitable income distribu-tion; and to make better use of productive resources,both economically and socially, thereby ensuring therural population a greater share in the benefits ofgrowth.
Development plans and policies
All recent plans in the region show a commonpreoccupation with the broader socioeconomic goalsof development, such as elimination of poverty, in-creased and improved distribution of food, incomeand employment, in addition to growth.' Whilemost new plans have accepted these goals as partof their philosophy, few have been able to modifytheir planning methodology accordingly or translatesuch goals into concrete policies and programmes.Thus, neither their consequences in terms of changesin the patterns and levels of consumption, of savingsand investment rates and of effects on input mix,technology and product mix nor even their structuralimplications for production, trade, institutions ortechnology have always been followed through. Theseare the next awaited methodological and technicaldevelopments in Asian planning efforts.
Unfortunately, the intention to pursue these socialand distributive goals has come at a time when therate of growth (especially per caput growth) hasfaltered in many countries, especially in south Asia.Nor have these objectives been made easier to achieveby recent world economic developments. Mountinginflationary pressures and the prevailing uncertaintyin the short-term commodity markets have made moredifficult not only actual performance and its assess-ment but also investment allocation and target settingfor the future.s International economic developments
7 The main features of current development plans in the FarEast are given in Annex table 12.
S. While the rise in export prices does lead to a "real" increasein income, imported inflation depresses this increase. But sincethis affects mainly imported goods, the usual deflators for reducinggrowth estimates from current to constant prices are likely togive misleading results. Nor can a terms-of-trade index deflatorsolve the problem, because a third component, internal inflation,has to be accounted for. Since the proportions of these threecomponents are elusive, it is difficult to assess the real increasein GNP and real progress toward the achievement of plan targets.
73
In the Latin American Free Trade Association(LAFTA) a series of negotiations took place in 1974,with the scope of bringing integration closer throughnew political, institutional and operational rules. TheAndean countries have proposed a number of mea-sures that LAFTA should adopt to give more favourabletreatment to the less developed countries and to thosewith limited markets. Mexico has also presentedideas regarding the renewal of LAFTA with referenceto improvement of the Montevideo Treaty, comple-mentary agreements, industrial policy and the roleof transnational enterprises, support to less devel-oped countries and administrative reorganization.
Far East
have overtaken many targets and strategies of newplans. India, for instance, has already begun revisionof its plan, which was launched in 1974. Since1971, planning in Pakistan has been on an annualbasis, although a new five-year plan, now beingformulated, is to take effect from July 1975.
For the Indochinese countries the Khmer Re-public, Laos and both Viet-Nams unsettled po-litical and military conditions have continued tohamper development. In the Khmer Republic, al-though the second five-year plan (1968-72) accordedhigh priority to agriculture, the war brought a sharpfall in investment and implementation, turning thecountry from a substantial rice exporter into a netimporter. In Laos, too, the development plan of1969-72, which assigned high priority to agriculturalproduction, could not be implemented for the samereason. However, the signing of the cease-fire in1973 enabled the renewal of plan formulation in1974, and the 1974-79 plan is now in preparation.Its two main objectives are understood to be nationaleconomic integration and self-sufficiency, the latterbeing interpreted as greater reliance than before onLaos' own resources. Priorities are (a) the resettle-ment of refugees, (b) the rebuilding of the country'sinfrastructure and (e) the establishment of integrateddevelopment zones.
Bangladesh hurriedly prepared its first five-yearplan (1973-78) on becoming independent in 1971.The plan's basic objectives, which reflect the coun-try's political philosophy of democratic socialism,are as follows: to reduce poverty; to regain the prewarlevels of the economy by 1974; to achieve a GDPgrowth rate of 5.5% per annum (with a per caputincome growth rate of about 2.5%); to lower pricesand expand the output of essential consumptiongoods for the masses; to reduce dependence onforeign aid; and to ensure a wider and more equitable

diffusion of income and employment opportunities.The plan provides for a total financial develop-
ment outlay of 44 550 million takas (about US$5 570million), with about 90% of the total financial outlayin the public sector. The overall strategy of the planis aimed at achieving the objectives of generatingemployment and increasing output. An additional4.1 million jobs are expected to be created duringthe plan period, estimated to be enough to absorball new entrants in the labour market and makeinroads into existing unemployment and underem-ployment.
The agricultural sector receives top priority. Themain objectives of the sectoral programmes in agri-culture are to attain self-sufficiency in foodgrains by1978, to expand employment opportunities and toincrease production of export crops. Agriculture,planned to grow at an annual rate of 4.6%, is pro-vided with 24% of the total financial developmentoutlay. For crop production, the strategy lays heavyemphasis on a package of modern inputs namelyirrigation, high-yielding varieties of crops, fertilizersand plant protection measures, together with nec-essary incentives and institutional measures. Irri-gation development mainly involves minor projectswith shorter gestation periods and lower capital outlay.Major shifts in policy include a gradual move frominput subsidies to price incentives and technologicaladvances in jute production, selective mechanizationin agriculture and improvements in organization.
A number of institutional reforms are suggested tosupport plan implementation as well as to achieveits distributive objectives. The organization of co-operatives, rural works programmes and the devel-opment of Thana Development and Training centres(based on the Comilla experience) are brought to-gether under the new Integrated Rural DevelopmentProgramme, which is to lead the movement for ruraldevelopment. There is also a moderate land reformprogramme.
The second four-year plan of Burma has beenformulated within the framework of the twenty-yearplan (1974/75-1993/94), which was launched in April1974. The main objectives of the latter (to be im-plemented in five stages of four years each) are toraise the standard of living of the people to a leveltwice as high as in 1973/74; to develop the economyfrom an agricultural to an agriculture-based economy;and to establish a socialist production pattern, underwhich people's ownership would increase to 48% andcooperative ownership to 26% by 1993/94.
The medium-term targets of the second four-yearplan (1974-78) provide for a 4.5% average annualgrowth rate of GDP (with a per caput growth of 2.4%).Average annual exports are set at 1 540 million kyats(US$320 million) and average annual public sectorinvestments at 1 000 million kyais, with a further
74
investment of 1 920 million kyats from the privateand cooperative sectors. State and cooperative busi-ness enterprises are to be reorganized on commercialprinciples, and labour productivity therein is plannedto increase at an average annual rate of 2%.
A basic strategy of the plan is to expand productionimmediately in those sectors with the shortest gesta-tion period, so as to create a quick momentum forgrowth. For this reason, top priority is given toagriculture, forestry and mining the three mainpillars of the Eurmese economy. The average annualrates of growth planned for various sectors of theeconomy are as follows: agriculture 4%, livestockand fisheries 3.4%, mining 2.4%, transport and com-munications 5.2%, manufacturing industries 7.5%and electric power 9.1%. The 4.5% GDP growth ratemay be difficult to achieve in the light of recent worldeconomic developments and of past performance (ap-proximately 2.5% per year). The annual exporttarget of 1 540 million kyats (US$320 million), al-though more than double that of past years, is nothowever impossible to achieve at current prices.
The new constitution envisages some liberalizationof the economy, while the plan provides for theencouragement of small-scale privately owned in-dustries and emphasizes that public enterprises willbe run on "private enterprise" principles, perfor-mance being measured by input-output ratios. Thefact that aid and long-term credit are again beingsought (with World Bank/Apa assistance in transportand anticipated foreign participation in offshore oilexploration) is indicative of a change in economicpolicy.
India's draft fifth five-year plan (1974/75-1978/79)has been drawn up within a twelve-year perspective(1974/75-1985/86). The main elements of the fifthplan's strategy for the realization of its twin objec-tives elimination of poverty and attainment ofeconomic self-reliance as well as the rates ofgrowth envisaged for the various sectors were re-viewed in The state of food and agriculture 1973(p. 100). The disparate rate of growth foreseenfor different sectors will involve a degree of structuralchange in the composition of Gnp the share formanufacturing, mining and construction increasingrelative to that of agriculture, which is to declineslightly from 46 to 42% by 1978/79.
The financial resources for the fifth plan are esti-mated in 1972/73 prices at Rs534 110 million, ofwhich 95.4% will be generated from domestic re-sources and about 89% will go into investment. Ex-ports are projected to grow at the rate of 7.6% perannum, with large increases expected from engineeringgoods, iron ore, handicrafts, cotton textiles, steel, fishand leather. Import substitution is to be concentratedin four major fields: crude oil, metals, machineryand equipment, and fertilizers.

The main effort is directed toward the agriculturalsector in order to raise the per caput consumptionof the lowest 30% of the rural population (25 mil-lion of the poorest rural households). This will re-quire changing agricultural development programmesso as to ensure that small farmers and agriculturallabourers are able to benefit from these programmes,with special assistance to small farmers within areadevelopment programmes and the expansion of specialprogrammes designed for the weaker sections andareas of the agricultural economy. Attainment ofthe 5.5% growth rate, as well as of the minimum-income programme for the poorer 30% of the popu-lation, will depend of course on a progressive declinein the rate of population growth (2% per annumfor 1971-76 and 1.7% per annum for 1976-81), whichappears rather unlikely in the light of present popu-lation trends.
Although the plan was officially launched in April1974, the unexpected impact of the oil, food andinflationary crises has necessitated a revision of theplan in regard to both resources and targets; it istherefore unlikely to be released before October 1974.
Indonesia's second five-year development plan(1974-79), like many other current plans in the region,places a new emphasis on the achievement of broadersocial goals such as better food, clothing, housing,more employment and improved social welfare. Theplan calls for a total expenditure of about Rp4 859thousand million with a growth rate of 7.5% and arise in per caput income of about 5.2% per year.Sectoral growth targets are 5% per year for agricul-ture, 13% for industry, 9% for mining and 10% forcommunications.
Dependence on foreign aid is to be reduced by half(from 35% of total development expenditure to only17.7%) in the plan period, with provision for itsdistribution throughout the country's twenty-six prov-inces under a new provincial development aid pro-gramme. With its good credit standing and with theprices and production of its primary commodities(particularly oil, timber and rubber) rising rapidly,Indonesia should find little difficulty in generatingadequate investment by the end of the decade. Sinceone of Indonesia's problems in the past has beenthe provision of adequate food supplies for itspeople, the Government has introduced a new policyto increase stocks and stabilize prices by both do-mestic rice procurement through rural development/rural cooperative units and imports.
The Philippines four-year development plan (1974-1977) also stresses the more egalitarian aspects ofdevelopment. The main objectives of the plan areto attain a more equitable distribution of income and1,vealth; to expand employment opportunities; to pro-mote social development; to stabilize prices; to ac-celerate economic growth; to promote regional de-
75
velopment and industrialization; and to improve thebalance of payments. GNP iS to grow by 7% peryear in real terms, and per caput incomes are toincrease by 5.5%, assuming a reduction in the popu-lation growth rate to 2.5% annually. Growth ratesplanned for the main sectors are 5% for agriculture,18% for mining, 10% for manufacturing, 10% forconstruction and 4.9% for transport and utilities.
An increased rate of investment involving greatermobilization of domestic resources is the key toattaining these objectives. Investment is expected togrow at 15% annually, while tax revenues are to beincreased from the present 13% to 16% of GNP by1977. Between two thirds and three quarters oftotal investment is expected to come from domesticsavings, with the remainder coming from foreignsources.
The major objectives set for the agricultural sectorare accelerated land transfer, food self-sufficiency,conservation and development of forest resources,and expansion of exports and substitution of imports.Strategies for achieving these objectives include:speedy implementation of land reforms; promotionof private sector investment by credit and incentivepolicies; greater emphasis on programming at regionallevel with local government and community participa-tion; vigorous promotion of private agribusiness; in-tegrated planning and implementation of rural de-velopment programmes; and coordination of all gov-ernment agencies from national to local levels neces-sary to implement these programmes. The land re-form programme, which receives special emphasis,should be completed by 1977 for rice and maize land.A second important feature is the strong regionalapproach. The country is divided into eleven de-velopment regions, each with a Regional Develop-ment Council (extensions of the National Economicand Development Authority) that is charged withsurveying regional resources, preparing regional plans,and coordinating and assisting all planning activitiesat regional and lower levels.
In Malaysia the new economic policy for the elimi-nation of poverty and the restructuring of societyhas a twenty-year perspective, within which the sec-ond Malaysia plan (1971-75) covers the first fiveyears. The mid-term review of the second plan at-tempts not only to measure progress but also tosuggest ways and means of tackling new problemsand adding substance to the original policies andprogrammes. According to this review, the averageannual growth at current prices during the first threeyears of the plan was 11% at current prices (actually20% in 1973), as against the target of 6.5% per year,largely because of the present boom in Malaysia'smain commoditiy prices. Growth in real terms wasestimated at 6.9% annually. On the contrary, lessprogress has been made toward the achievement of

the broader development goals, such as reducingunemployment and income disparities.
The average annual growth in the agriculturalsector at 1970 prices has been 7.5% as against theplan target of 8.3%. At current prices the value ofrubber, palm oil and sawn log production registeredincreases of over 14 to 20% in 1973, while paddyproduction continued to rise through increased yieldsand double cropping, despite adverse weather condi-tions in 1972. Despite this high rate of performance,the mid-term review does not expect agriculturaloutput to rise above 7% in 1974 because of an-ticipated anti-inflationary effects in the industrialcountries. However, the main source of growth isexpected to be the smallholder sector, reflectingplanning and development efforts over the past de-cade. By increasing the real earnings of the small-holders, this will to some extent meet the plan'sobjective of wider income distribution. The othersocioeconomic changes contemplated, such as mod-ernization of rural areas, education and training, andcreation of a Malay commercial and industrial com-munity, will take a longer time to accomplish becauseof their very nature.
Employment creation in the agricultural sector hasnot been very successful, only 58% of the plan targethaving been reached, mainly due to capital-intensiveand labour-saving technologies introduced in rubber.Nevertheless, it is hoped that unemployment 7.5%of the total labour force in 1970 will be reducedto 7% in 1975, primarily through new land develop-ment and industrial programmes.
Technological innovation and its policy implications
The adoption of improved technologies in rice andwheat, as well as in palm oil, rubber and tea, largelyaccount for the recent acceleration in the rate offood and agricultural production in the Far East(discounting the bad years of 1971-72). Further de-velopment and adoption of new technology willcontinue to determine to a large extent the level ofincome and nutrition in this vast region.
A number of factors have tended to bias tech-nological change in Asia, not all of them in themost desirable direction. Large-scale, capital-intensivetechnology, while increasing the productivity of la-bour, may not necessarily be the most economic inthe use of scarce resources of the countries concerned.Often such indiscriminate adoption of technology hasbeen due to the imitation of patterns of develop-ment or technology in developed countries, withoutreference to local conditions and needs or withoutsufficient realization of their true cost in socioeco-nomic terms. It is no coincidence that the onlycountry which has developed technologies to suit her
76
own particular needs, factor endowments and socialobjectives is Japan, which was not subject to colonialrule. The Republic of Korea, with similar conditions,copied the Japanese model with success, and Malaysiais now diversifying its production and modifying itstechnology to suit its own conditions. The adoptionof inappropriate technologies has also resulted fromsuch negative factors as the lack of any real tech-nological alternative; whereas the science and re-search of developed countries are naturally directedtoward developing technology to suit their own needs,the lack of any clear-cut policy on technological de-velopment on the part of developing countries hashelped this unfortunate trend. Under these circum-stances, technological choice was left to the individualfirm, which naturally chose the technology (usuallycapital-intensive) that would maximize profits, seekingto internalize the gains and externalize the costs ofnew technologies which in this case were borneby the society in terms of foreign exchange, employ-ment, etc. The small farm, on the other hand, unableto bear the cost of such technology, has often beenbypassed by the gains of scientific innovation, re-sulting in economic and social disparities which havenow begun to be felt in many countries of the region,such as India, Pakistan and the Philippines.
The direction of technological innovation shouldideally be determined by the given factor endowmentsand be aimed at "augmenting" the scarce factors ofproduction. Likewise, the economic efficiency andsocial relevance of a given technology should bedetermined by the structural, institutional and valuesystem into which it is introduced. The pattern ofagricultural and technological development of Japan,which followed different development paths of re-sources use and productivity as compared with theUnited States since about 1880, with equally efficientresults, is of considerable relevance to Asian coun-tries. Whereas growth in Japan was achieved mainlythrough the use of biochemical technology, whichprovided greater returns from the scarce land resourceby increasing productivity per hectare, in the UnitedStates it was achieved mainly by bringing more landunder cultivation through capital-intensive mechaniza-tion and thereby increasing the productivity of labour,its scarce factor. Historically, other land-scarce coun-tries, such as Germany and the Netherlands, alsobegan their development process by increasing landproductivity.
While any approach to development in the heavilypopulated developing countries of Asia must startwith recognition of the scarcity of resources, any de-velopment approach based solely on a reallocationof these scarce resources would be completely inade-quate. Needless to say, the past lopsided use ofresources and technology in Asia with its failure tomobilize labour, the only abundantly available re-

source, to maximum advantage (except in China andJapan), has to be corrected. The next step is teensure a direction of technological change that isin line with resource availability, so as to make thelimited resources more productive. In the absence ofadditional capital and land, the productivity of Asianagriculture can be increased only by introducing fromoutside the agricultural sector inputs that incorporatenew technology which will increase the productivityof existing factors of production and thus quickenthe pace of agricultural development')
The technology must also be geared to the socio-economic goals of the country if it is to be economi-cally and socially relevant. These goals in most coun-tries of the region are: to increase food productionand improve nutrition; to increase agricultural in-comes and foreign exchange earnings; to providegreater and more gainful employment; and to securea wider and fairer distribution of such income andemployment. While these aims indicate to someextent the type of technology required, the actualchoice is by no means simple, as there may be "con-flict and trade-offs" between objectives. Choice oftechnology is therefore a problem of Far Easternagriculture and has to be decided by a deliberatechoice of development paths which are determined,or modified, both by existing resource availabilitiesand institutions and by desired development goals.
The first major question concerns the type of tech-nology. The biochemical technologies recently in-troduced have fortunately been applicable regardlessof the scale of farming, thus offering a means ofrapid increase in land, labour and capital productivity,ideally suited for Asian resource availabilities andstructural conditions. During 1954-61 Japan thusrecorded an annual rate of growth in land produc-tivity of more than 2% and in labour productivityof 7%, while working capital increased by only 8%per annum." In India, Malaysia, Sri Lanka and thePhilippines even the small farm has been able toadopt these improved technologies with higher pro-ductivity per unit of land and capital than largefarms, provided that effective supporting serviceswere made available. However, the large-scale me-chanical technologies of the developed countries,which are usually costly in terms of scarce capitaland foreign exchange and displace labour, tend tofavour large farms. Their real cost in social terms
u A recent study has shown that roughly 24% of the differencein labour productivity between certain developed countries andeleven developing countries studied could be attributed to tech-nical inputs such as fertilizer and machinery (embodying tech-nical change), which thus augmented the productivity of existingresources. Vernon W. Ruttan, Induced technical and institutionalchange and the future of agriculture. Theme Paper, FifteenthInternational Conference of Agricultural Economists, August 1973.
10 K. Okawa, Phases of agricultural development and CCOliOnliCgrowth (Japanese). See also The .state of food and agriculture1973, p. 102, footnote 27.
77
is often very high. Yet, improved implements, me-chanical threshers, mechanized pump sets and two-wheeled tractors not only meet the needs and limita-tions of the small farms of Asia, but have gone along way toward raising both their land and labourproductivity. The really relevant distinction is there-fore not between biological and mechanical tech-nologies, but between types of each and, especially,the levels of technolog,y which are suited to givenfactor endowments, skills and institutions.
A second and more relevant question thus relatesto the level of technology. Three alternatives arctheoretically possible: a continuing improvement ofexisting traditional technology that is, a technologyof "production by the masses" (if possible, through"mass innovation" as in the early Chinese model),rather than the developed countries' "technology ofmass production"; an "intermediate" technology basedon technological innovation and transformation at agraduated pace on a progressively wider base; or anadvanced "modern" technology involving high capitaland skills, but paying off in greatly increased labourproductivity. Ideally, the level of technology has tobe decided with the national development strategy inmind.
Whatever the strategy selected, it should not onlyprovide for substantial increases in returns per unitof land, the logical take-off point for agriculturaldevelopment in Asia, but also generate adequateincreases in labour productivity and income to meetrising social expectations as well as food and em-ployment needs. Some progress toward attainingthese multiple goals has already been made in China,India, Japan, Malaysia, Pakistan and the Philippinesthrough the higher labour requirements of the im-proved biological technologies. These goals can alsobe achieved with certain types and levels of me-chanical technology which can increase land produc-tivity with a minimum or even no displacement oflabour ----- for example, the mechanical pumps, tube-wells ancl threshers used with high-yielding varieties.Also in fisheries, outboard motors fitted to log raftsand canoes have doubled the fishing range, whilesmall mechanized fishing boats (passing progressivelyto larger ones) actually d.oubled catches, as in SriLanka. The advantages of an intermediate technologywere implicitly recognized in Chinese policy in 1968with official acceptance of the need to promote a"widespread mass movement throughout the countryto introduce tools and technological innovations sothat semimechanized or fully mechanized operationscould properly be combined with the necessary handwork."
It was earlier suggested and generally accepted
11 Report of the Central Committee to the 8th National Con-gress of the Chinese Communist Party, 1968.
12 E.g., The state of food and agriculture 1970, p. 84.

that growth on the broadest possible land base wouldbe most likely to meet both the present productiveand distributive goals of most countries of the FarEast. As for production, a 300/) increase on the 70%of the cultivated land held by small farmers wouldtheoretically yield as much as a 90% increase on the20% of the land in large farms. Such broad-basedgrowth would also enable the widest distribution ofthe product, since under systems of private landownership the production base usually tends to de-termine the pattern of consumption. Furthermore,such policy emphasis would readily identify priorityareas and the direction for specific research and tech-nological innovations. The "unimodal" strategyadopted in Chinese, Japanese and Korean agriculturewith an intermediate technology is attractive. Astrategy should however be flexible enough to exploitthe advantages of existing farm systems, types ofcrops and markets. For example, Malaysia, witha flourishing plantation sector, has pragmaticallyadopted a bimodal agricultural strategy, which hashowever created a dualism between the plantation andsmallholder sectors with a sharp income differentialbetween the two.
Whatever technology is chosen, economic and so-cial goals should determine the main thrust of de-velopment strategy and the technological means andpolicies to achieve them. For example, high-yieldingrice varieties currently depend on controlled irrigationand thus are limited to the relatively small proportionof rice land in the region that has these facilities."Fhis restriction has been an important factor behindthe slowing down of the "green revolution" with allits dismal consequences. Clearly, better varieties areneeded -- and soon --- for the high proportion of riceland solely dependent on rainfall. A large effort isalso needed in irrigation, with emphasis on widelydispersed, quick-maturing, low-cost works, includingtube-wells, pumps, drainage, etc.
Adoption of improved technology is required overthe widest possible area of land, even if at a loweror "intermediate" level. For example, a much smalleryield improvement on the rain-fed rice lands of theFar East (which account for approximately 65% of(he rice land of the developing countries in the region)can add a higher increment to total rice productionthan the substantial achievement of the "green revo-lution" so far. Likewise, low-risk varieties, lesssusceptible to pest and drought damage, would enablea wider range of adoption among small farmers in theinitial phase and might provide higher national aver-age yields per hectare despite their lower maximumyield potential. The same applies to varieties whichshow a greater response to lower levels of fertilizerapplication. The current scarcity and high pricesof fertilizers have already caused a reversion to loweryielding varieties requiring less fertilizer in some
78
countries. 'This, in turn, has stimulated new researchinterest in varieties that are more responsive tosmaller chemical fertilizer application or to organicmanures. Improvements in different types of grain,such as maize, millet and sorghum, would also helplo stabilize production and increase productivity onthe substantial areas under dry farming and rain-fedcultivation. Research and innovations need to beapplied to broader areas, as well as crops, in orderto yield the greatest possible increases in total foodproduction, income and employment.
Expansion of technology should also be on thewidest possible institutional basis, so that small farm-ers, who cultivate approximately 70% of the landin the region, would benefit directly. Therefore, apolicy is needed which includes selection of tech-nology, method of introduction and institutionalchanges to enable it to operate successfully on thewidest front.
A number of factors determine the rate at whichhigher levels of technology can be introduced andadopted, including the level and type of the farmers'education, price and tenure incentives, the securityvitally needed by small farmers against risk of cropfailure and the extent to which they arc providedwith credit, fertilizers, other inputs, extension, etc.
A technology requiring high managerial and tech-nical skills can have only a limited effect until therequired education and skills for its use are widelyavailable. Education in its broadest sense has beenestimated to account for as much as 35% of thedifferences in agriculture labour productivity betweenthe less developed countries and the more developedcountries." Changes are required not only in thecontent of general education and its orientation, bothpractical and technical, but also in the content, typeand system of agricultural extension, to make it rele-vant to the region's small farmers."
Institutional measures to support the new tech-nology have been discussed elsewhere." Since the1960s a wide range of measures have been adoptedin most Far Eastern countries to support the introduc-tion of high-yielding varieties and to enable smallfarmers to share in the gains. But further institutionalmeasures may be required to adapt both structureand institutions to the new technology --- insofar asthe latter cannot be changed to suit the farmer --so as to capture the potential productivity gains orenable the wider spread of benefits. New systemsof common management may be necessary for water,crop rotation and pest control. Institutional changesmay in themselves encourage a new technology, asland reforms did in Japan and the communes inChina.
13 Vernon W. Ruttan, op. cit.14 See The state of food and agriculture 1973, p. 103.15 Ibid.
The search for the most efficient technological de-velopments has implications not only for changes ininstitutions, but also for agricultural research and itsstructure. The pursuit of science for its own sake ---irresponsive or irrelevant to social needs, with theseparation of research from application and of edu-cation and production from the institutions respon-sible for them is a luxury which the developingcountries of the region cannot afford. Changes areneeded in the structure of research, educational andproduction institutions to ensure that science andtechnology serve society better than in the past. Thesignificance of the Chinese experiment lies in theextent to which science and technology have beenmade to help society rather than to follow narrowerinterests.
The pattern of development and technology chosenby the developed countries is not necessarily themost suitable or most economic for the less developedcountries of the Far East. This needs restating:strategies must be chosen according to the needs, re-sources and objectives of the countries concerned.For example, although the developed countries havesatisfied their protein needs through dairying andlivestock production, in Asia given the shortage ofland, capital and time ---- this might be achieved moreefficiently by improving the protein content of rice,the main source of calories; moreover, soybeans pro-vide more than double the amount of protein perunit of land, capital and time gained from livestock.
Thus it is being increasingly recognized in the FarEast that the adoption of capital-intensive, sophisti-cated technologies from developed countries, withtheir alien institutional and structural framework andpolicies, is unlikely to lead to nationally desiredeconomic and social goals. International transfer oftechnology is acceptable only if it is in line with orcan be adapted to the endowments, local institutions,values and objectives of the recipient nations. Choiceof technology must be considered a part of the totaldevelopment strategy. Induced technological change,an essential component of such a strategy, requiresan economic policy that influences costs and prod-uct prices so as to encourage the type and level oftechnological change needed; the scarcity of resourcesmust be reflected accurately in order to makeoptimum use of them. In the Far East, such strat-egies cannot be achieved by economic measuresalone; they must always take account of more gen-eral aspects that are currently limiting agriculturaldevelopment.
Regional economic cooperation
The current world economic problems of rapidinflation, international monetary and energy crises,
79
and food and fertilizer shortages have all given newurgency to the long-recognized need for regionalcooperation in the Far East. The need for unifiedaction was demonstrated at the Fifth Conference ofthe Confederation of Asian Chambers of Commerceand Industry, held in New Delhi in February 1974,which urged governments to progressively changetheir energy base, to promote intraregional trade andthe transfer of investment and technology, to buildup Asian buffer stocks of food and to promote actionon the Asian Trade Expansion Programme, the pro-posed Asian Clearing Union and the Asian ReserveBank.
The only group of countries continuing to cooper-ate for common purposes is the Association of SouthEast Asian Nations (ASEAN), although still on a limitedbasis. It has now decided to move toward somekind of economic community along the lines of theEEC, and a central secretariat, in Djakarta, is to be
established in 1975. Economic ministers will meetregularly to coordinate planning. Private industrywill be encouraged to undertake multi-AsEAN projects,with special exemptions from internal tariffs, andgovernment-supported industrial projects are to beshared out between the members, somewhat alongthe lines already established by the east EuropeanCOMECON. Internal tariffs are to be progressively re-duced. Thirteen major industrial projects are nowunder review, including a $220 million nitrogenousfertilizer complex. The rice experts of ASEAN havealso agreed to discuss the possibility of establishingregional standards for rice. The ASEAN countriesworked together during 1973 to oppose increasedJapanese synthetic rubber production, which wouldcompete with their products. Six countries --- Bangla-desh, India, the Khmer Republic, the Philippines,the Republic of Viet-Nam and Sri Lanka havesigned an agreement setting up the Asian Rice Trade
Fund. Proposals are being rnade to secure the initialresources required for the operation of the fund ona continuing basis.
These countries have decided to seek closer tieswith the EEC in ami attempt to persuade its members
to adopt an outward-looking, flexible and pragmaticpolicy toward Asia.
At the Thirteenth Session of ECAFE (held in Co-lombo, March-April 1974), it was decided to estab-lish an ECAFE committee on agriculture to deal with
food and agricultural development in the region, inclose cooperation with FAO and other international
organizations. Recommendations made at that con-ference and afterwards include proposals for a worldfertilizer fund and for world and regional food se-curity; together with similar international initiatives,these decisions could find effective expression at theregional level for building up fertilizer and foodstocks within a wider international framework. In

regard to oil exploration, there has been preliminaryagreement among seven east Asian countries, somedeveloped countries and the UNI)P tO contribute aboutUS$5 million for offshore oil exploration in regionalwaters over the next five years.
Groupings around special interests or commod-ities such as the Asian Coconut Community and
CHINA
No major policy changes took place in Chineseagriculture in 1973. The main .features of the cur-rent five-year plan (1971-75) are an increase in agri-cultural production not only to make China's foodsupplies secure and. "crisis-proof," but also lo ensurea plentiful supply of industrial raw materials andthus allow for a brisk expansion of light industry --as well as the modernization of agriculture throughgreater use of fertilizers, insecticides and machinery,emphasis on "self-reliance and hard struggle" by theproduction teams (the most important units in China'sagriculture), and firm resistance by both the centraland provincial governments to any radical alterationin the organization of the communes or interferencewith peasants' rights. The need to make even fulleruse of indigenous methods and intermediate tech-nology continues to receive great emphasis in thepeople's communes.
The central government has encouraged the pro-vincial authorities to give more attention to suchcash crops as rape, cotton and other commoditiesin short supply on world markets and urgently re-quired for the country's growing light industrysector. Problems arose in certain provinces such asHunan and Fukien, regarding districts which hadplanted cotton on a large scale and found themselvesshort of grain. In theory, grain and industrial cropsshould have been expanded side by side., in practice,the clash between those who saw cotton as a profit-able new rural enterprise and those who were de-termined to continue with grain when food suppliesseemed in jeopardy because of the weather was noteasily resolved. The central government had toprepare a set of directives dealing with the wholeproblem of how to reconcile the cotnpeting dem.andsof grain production and the other, frequently moreprofitable, activities open to the peasants. Thesedirectives can be summed up as encouraging engage-ment in nongrain production, provided that it doesnot conflict with the national economic plan andwith commune operations, is consistent with localconditions and needs, aids collective financial re-sources, and does not lead to black-marketeering.
80
the Asian Pepper Community, and Asian participationin the Association of Rubber Producing Countriescontinued to make some progress in 1973. Mean-while, initiatives for the establishment of the pro-posed Asian Timber Community, Asian Rice TradeFund, Asian Clearing Union and Asian ReserveBank are continuing.
The fundamental dilemma is the shortage of labourto perform all the tasks demanded in rural areas.Not a general shortage, it is to some extent beingmet by drafting to the communes thousands of youngpeople at the completion of their schooling or evenfor periods during their university or college edu-cation. Adding to the extra effort required fornormal routines in abnormal weather, the massiveendeavours to build water-control works and reclaimland, to undertake multiple cropping and diversifyfarm output, the otherwise adequate supply of workersbecomes stretched very thin. Water conservation isreceiving much attention in all communes in responseto Chairman Mao's dictum that it is the lifebloodof agriculture.
l'he answer, as China has long realized, lies inmechanization and electrification, which permit therelease of agricultural labour from routine choresto more specialized and intensive cultivation, as wellas for work on capital projects and in rural factoriesto meet rural needs. The provision of portable waterpumps is a key item in this strategy. Mechanizationduring 1973 appeared to proceed more cautiouslythan in the previous year, By July 1973 the totalnumber of mechanical rice transplanters was only230 000, despite the high priority given this imple-ment in the previous eighteen months.
The mass mobilization of rural manpower, and ofmanpower in general one of the salient features ofthe Great Leap Forward --- has since been maintained.It was reported in 1971 that the annual labour inputinto such schemes as reforestation, flood control andconstruction of rural roads since 1961 was neverlower than 10 000 million man-days and mostlymuch higher. A recent incomplete account of masslabour projects for the 1973/74 winter season lists1.6 million hectares newly brought under cultivation,2.6 million hectares of hilly lands made level, 460 000hectares of terracing and 800 000 hectares of formerwasteland opened up for cultivation. In Honan prov-ince alone some 50 000 new power wells and 110 000small and rnediutn water conservation projects werecompleted in winter 1973/74 by commune labour.

Japan's food and agricultural policies and pro-grammes continue to evolve within the general frame-work of the comprehensive objectives establishedin the Agricultural Basic Law of 1961. The primaryaim remains that of assuring adequate supplies offood at reasonably stable prices to meet the popu-lation's expanding and changing patterns of demand.The sharp rise in world prices and the general insta-bility of world market conditions for most of Japan'smajor agricultural imports since 1972 have led toreview and further elaboration of the guidelines(adopted late in 1972) concerning desired adjust-ments in Japan's agricultural sector during the nextdecade.'" In view of the current and prospectiveworld food situation, the Government is seeking todevelop sources of additional supplies, more stablewith respect to both prices and assurance of deliv-eries than those previously available have proved tobe since 1972. For this purpose, the Japanese Gov-ernment is looking to both increased domesticproduction and development of alternative sources ofi mports.
The state of Japan's agriculture 1973, published bythe Ministry of Agriculture and Forestry. analyses thepresent situation in the context of recent trends andprospective developments. It concludes, "in orderto secure a stable and efficient supply of food, therewill have lo be established a comprehensive foodsupply system based principally on the maintenanceand strengthening of the production and supply ca-pacity of domestic agriculture." Particularly becauseof the instability of world markets for farm productsand the need to stabilize Japan's long-term balanceof payments, maintenance and improvement of theproduction capacity of the domestic agriculturalsector are seen to be the foundation of such anoverall system for supplying Japan's food require-ments; in short, it is deemed necessary to increaseJapan's self-sufficiency in food. Between 1960 and1972, overall self-sufficiency in food (including fisheryproducts) had declined from 93 to 78% in wheatfrom 39 to 5%, in concentrated feeds from 67 to36%, in soybeans from 28 to 4°/, in fruit from100 to 82% and in meat from 91 to 81%.
Increased self-sufficiency is to be attained by set-ting long-term goals for commodity production andadopting comprehensive measures to raise productiv-ity. In 1974 the Government encouraged higher pro-duction of most crops and livestock products. Pay-ments under the rice-land diversion programme forleaving rice land fallow were terminated to encourageuse of such land for rice or for other crops. Incentivepayments for increasing production of wheat, barley,
le See The state of food and agriculture 1973, p. 108.
81
JAPAN
soybeans and forage crops were introduced. Govern-ment subsidies on imported feedgrains were adjustedso as to avoid forcing producers to curtail output,particularly of pork, poultry and eggs. Higher pricesfor most domestically produced crops and livestockproducts, although largely reflecting higher productioncosts, also tended to encourage increased production.
The central role in Japan's future agricultural pro-duction is expected to be played by farm householdswith at least one male worker under sixty years ofage employed full-time in farming» It is estimatedthat about a third of Japan's total farm householdsare in this category, and that they account for abouttwo thirds of the gross agricultural production. Theytend to have larger areas of farmland than the house-holds that depend entirely on the farm labour ofwomen and old men, but to be relative/y less de-pendent on rice production and more dependent onthat of fruits and vegetables and on livestock andpoultry products. Farm households in this categoryconstitute the core of the group farming organiza-tions which are a prominent feature of Japaneseagriculture. The Government is looking to expansionof the scale of their farming operations as the prin-cipal means for attaining the desired increase in bothproduction and productivity.
Given Japan's relatively limited land resourcesand the continuing diversion of farmland to otheruses, there is little possibility of this core of farmhouseholds increasing its holdings of farmland. Theprice of farmland has continued to rise rapidly,reportedly by more than 100% between 1969 and1972, encouraging current owners to hold it for fur-ther capital gains. Current owners tend also to bereluctant to rent their land, since tenants acquirecertain rights to continued use, for which they arelikely to have to be paid if the owner later decidesto sell. Thus, to make additional land available forexpanding the scale of farming operations by thesecore farm households, the Government has encour-aged owners to contract with group farming orga-nizations for the performance of farming operationson their land; the number of organizations performingsuch operations under contract is reported to be in-crea sing.
Although the comprehensive food supply system isto be based principally on maintenance and improve-ment of the production capacity of the domestic agri-cultural sector, the Government recognizes that itwould be practically impossible for Japan to fulfil
" These households include those with other members employedoff the farro as well as those with no members employed off thefarm. Thus the category does not correspond with classificationsof Japanese farm households as "full-time" or "part-time" onthe basis of the sources of househohl income.

al! its prospective increases in food demand fromdomestic production. The food supply system willtherefore continue to rely also on imported suppliesof those food commodities in which Japan cannotbe fully self-sufficient, including wheat, feedgrains,soybeans, tropical fruits and oils and, to a lesserextent, meat and dairy products. The Governmentemphasizes the necessity for systematic stockpilingof imported food commodities by both itself andprivate trade.
To assure the stability of imported supplies, theGovernment recognizes that changes will be neces-sary in the structure of Japan's foreign trade in foodcommodities. These are to be brought about byexchanges of information with exporting countries,
Near East
Development plans and policies
Planning of economic and social development isa general practice in most of the countries of theNear East. Recently, another country, the YemenArab Republic, adopted this practice and preparedits first development programme, covering the three-year period 1973/74-1975/76.18 Moreover, there is acontinuous improvement in the methodology andtechnique of development planning as applied bythe countries of the region, mainly because of theavailability of better statistics and the strengtheningof national capacities in the fields of planning andprogramming. Long-term perspective developmentplanning is being gradually adopted in the region,and several in-depth perspective studies of agricul-tural development by country have been carried outrecently with FAO assistance.
Most of the development plans of the countriesindicate nutritional objectives; employment also re-ceives more attention than in the past; and specialemphasis is put on the development of agriculturalresources, especially water.
The current five-year development plan of Iraqended in 1974, and preparation of the new develop-ment plan covering the period 1975/76-1979/80 isnearing completion. Available information on thisnew plan indicates that major attention will be de-voted to land reclamation and drainage and to thelivestock sector, in order to increase the agriculturaloutput. Special emphasis will be placed on regionaldevelopment planning and integrated rural develop-ment. Early indications suggest that a larger share
s The main features of current development plans in the NearEast are given in Annex table 12.
82
long-term bilateral import agreements and diversifi-cation of sources. To secure the food it needs, it isalso considered necessary that Japan make an activeeffort to increase the agricultural production capacityof developing countries through long-term coopera-tion in development of their agricultural potential,thereby increasing their capacity to export commod-ities. For stabilization of international markets infarm commodities and steady expansion of trade,Japan continues to look to various international fo-rums, including the present round of multilateraltrade negotiations sponsored by GATT, negotiationsconcerning international commodity agreements anddiscussions of proposals for world food securityreserves.
of oil revenues will be earmarked for developmentof the agricultural sector.
Saudi Arabia is in the fourth year of implementa-tion of its five-year development plan (1971-75).Scheduled development expenditures during the planperiod will certainly be exceeded. The present in-tention is to diversify production and lessen as muchas possible the economy's dependence on oil revenues.
Reports from Iran indicate that its fifth devel-opment plan, launched in 1973, will undergo sub-stantial revision in the light of the recent oil agree-ments. Planned investments in the industrial sectorare likely to be increased considerably, and recentinformation indicates that agriculture, which has al-ready been given high priority in the plan, willreceive yet further attention.
According to available information on Egypt'snational ten-year development plan (1973-82) totalinvestments planned for this period will amount to£E8 400 million -- £E3 221 million in the first fiveyears and LES 179 tnillion in the subsequent five-year period. The public sector is to contribute90.1% of these investments as compared with 9.9%from the private sector. The agricultural sector is toreceive £E985 million, most of which will be fromthe public sector. The ten-year plan contemplatestwo sets of programmes for the agricultural sector:one directed to increasing productivity on the existingagricultural land through better irrigation, drainage,fertilizer use and seed and pest control; the other toextending the limited agricultural resources throughland reclamation and irrigation. Programmes relatingto vertical expansion include continuation of pres-ent projects for the expansion of new high-yieldingcrops, the consolidation of crop rotation, an increasein horticultural production and plant protection, as

well as programmes of soil improvement and protec-tion that are to reach 2 million feddans by 1982.The agricultural plan also calls for programmes whichaim to reorganize the cropping pattern by expandingcrops of relatively higher value and by increasing theproduction of major crops, such as cotton, wheat,maize, vegetables and fruit. Programmes for verticalexpansion of the livestock sector involve publicand private participation. They are expected toyield an increase of productivity in this sector mainlythrough selective breeding, animal health schemesand provision of necessary services, including veteri-nary services and large-scale and better quality vac-cination. Poultry production is expected to growat a fast rate, the production target being 100 mil-lion birds in 1982 as compared with 12 million in1972. Fish production is also planned to increaseat a very high rate. The extension services will bestrengthened and adequate services provided for thefarmers, including training and credit facilities.
The programmes for horizontal expansion of agri-culture include projects of land reclamation, settle-ment schemes and irrigation, aiming at full utilizationof the additional water resources from the High Damat Aswan. The land already reclaimed is to be pro-vided with irrigation and drainage facilities so thatit can be put under cultivation as quickly as possible.The necessary infrastructure for the settlement offarmers is expected to be completed in the reclaimedland area. The survey of groundwater resourcesis to continue. Efforts to speed up the develop-ment of land and its cultivation include division ofland into viable production units and preparation ofcropping plans for these units, mechanization adaptedto local conditions, extension of horticultural pro-duction and new high-yielding crops, and betterworking conditions for the farmers. An integratedapproach to rural development will be adopted onall newly reclaimed lands.
Agricultural production is expected to increase by19.4% from 1972 to 1977 and by 39.4% during theten-year period of the national development plan,corresponding to an annual growth rate of 3.9%.Agricultural income is expected to grow by 6.3%annually during the first five years of the plan and by
over the whole period of the plan, 1973-82.The new three-year economic and social develop-
ment plan (1973-75) of the Libyan Arab Republicaims at a restructuring and diversification of theeconomy through rapid growth of the agricultureand manufacturing sectors and controlled develop-ment of the oil sector in line with the general frame-work of the economic and social development of thecountry. Planned investment programmes are ex-pected to ensure this rapid change in the pattern ofeconomic development as well as a considerable in-crease in output. The total development budget for
83
the three years amounts to £L1 965 nillion, ofwhich EL416 million are earmarked for agri-culture and EL393 million for industry, mineralresources and petroleum. Under the previous three-year plan the latter sector received £L2 965 million,while only £L165 million were allocated to agri-culture. These figures illustrate the shift of emphasiswhich characterizes the present development plan.The expansion of the public sector's share in totalinvestment is another feature of the 1973-75 plan.The private sector, including the oil-producing com-panies, is expected to contribute only 17% of theplanned gross fixed investment, the remaining 83%to come from the public sector. Gross domestic in-come (Gm) is expected to grow by 10.5% a year (6%per caput). The target growth rates for non-oil activi-ties and petroleum and natural gas mining are17.5% and 5% respectively. Agricultural output isto increase annually by 16% against 26% for manu-facturing activities. The share of the non-oil sectorin Gm is planned to reach 50.5% as compared with42.2% at present. Full or nearly full employmentis aimed at for 1975.
The agriculture sector is given high priority in theplan, and efforts are being directed toward increasingproduction in order to reach self-sufficiency in majoragricultural food products. Two thirds of the totalfunds for agriculture are earmarked for activitiesrelating to integrated development, which aims todevelop new areas estimated at about 367 000 hect-ares, of which 95 000 hectares are to be irrigated.The remaining one third is mainly to be spent onvertical expansion. The objectives and targets setfor crop and livestock production must be consideredsteps toward self-sufficiency in the near future andare relatively high in comparison with recent per-formance. From 1972/73 to 11975 the output ofcereal, vegetables and fruit is expected to increaseby 86, 50 and 25% respectively, while the increasein meat, milk and egg production is projected in thesaine period at 36, 68 and 35%. The inputs forachieving these objectives and targets are specified,and programmes for the development of fodder cropsand pastures have been planned.
The first three-year development programme (1973/1974-1975/76) of the Yemen Arab Republic is animportant step toward systematic planning of eco-nomic and social development. Although this pro-gramme mainly concerns the allocation of publicinvestments, it also analyses in some detail theexisting situation and defines the general orientationof economic and social development, as well asgeneral and sectoral objectives, and the strategy tobe adopted to achieve them. All efforts will bedevoted to the installation of the social and economicinfrastructure needed for the implementation of fur-ther development programmes. GDP is to grow by

6% a year in real terms; the agricultural sector, whichoccupies 90% of the total active population and con-tributes about 70% of GDP, IS to be reorganized sothat the agricultural surplus can be used to financedevelopment efforts. Among the main objectivesare integration of the economy and training of na-tionals in administrative and technicall fields, in orderto meet the demand for qualified people and establisha modern public administration.
l'he investments required to achieve the projectedGDP growth rate are estimated to amount to 1 610million rials over the three-year period. Foreignassistance is expected to reach the sum of 860 millionrials, leaving 750 million rials to be raised locally.The public sector's share in total investment willamount to 823 million rials, 17% of which will bespent on agriculture. Transport and communica-tions will receive 25.5% of total public sector invest-ments against 11% for industry. Private invest-ments will continue to be encouraged. Total invest-ments, private and public, are expected to makepossible the creation of 268 000 jobs, which will helpreduce existing underemployment in all sectors ofthe economy.
Actions planned in agriculture aim, above all, toremove the obstacles impeding the development ofthis sector. Agricultural production should grow,according to the programme, by at least 6% a yearin order to fulfil its role in the overall developmentof the economy. This increase in production, inaddition to producing a surplus to be used in financ-ing development in other sectors, is intended to re-duce the trade deficit and improve nutritionalstandards.
Long-term objectives toward which the YemenArab Republic's three-year development programmeis directed include creation and consolidation of bothtechnical and administrative institutions dealing withagriculture at national and regional levels, trainingof personnel, expansion of the irrigated area by100 000 hectares and increases in crop and animalproduction. Priority will be given to the productionof commodities with high nutritional value, such aspulses, oilseeds, vegetables, fruit and animal products.
A series of surveys and studies are planned forassessing the national agricultural, fishery and for-estry resources and their potentials. This is neededto plan their conservation and utilization in the mostefficient way and to meet the general objectives ofeconomic and social development.
Country Perspective Studies
FAO has recently launched a programme of Coun-try Perspective Studies (CPS), to give more countryemphasis to its activities. The programme should
84
be of significant value to the participating countriesas it places major emphasis on basic agricultural de-velopment policy issues and the options open tothese countries in terms of the macroeconomic frame-work and alternative growth patterns. The pro-gramme should also be useful to both the countriesinvolved and FAO in providing the vital link be-tween policy and programming and between sectoranalysis and project identification. The output of thecrs programme consists of a series of working noteswith a strong policy orientation, preceded by theCentral Policy Paper (crr), which embodies the coreof the study findings and conclusions, but also standsas a comprehensive and concise report in its ownright. The other working notes deal with particularaspects and subsectors, reflecting the interdisciplinarycontributions to the study. A pilot programme,covering Egypt and the Sudan, was started in October1972, and the two studies, completed in mid-1973,have been very well received by the authorities inboth countries. The second round of the CI'S pro-gramme in the region, covering Iran and Iraq, isexpected to be completed early in 1975.
The CPP plays a pivotal role in the perspectivestudy, providing a summary of the findings. It beginswith a brief review of the present situation and themajor issues of agricultural development in the coun-try. This is followed by a presentation of the quan-titative framework, covering the major parameters ofchange as reflected in the study. Domestic and for-eign demand and national production targets areconsidered within the context of assunied growthalternatives for the economy as a whole. This par-ticular section, dealing with the basic quantitativeframework, is a standard element of all countrystudies. The second part of the crr focuses on basicpolicy issues for agricultural development, which arenaturally related to the conditions bearing on agri-cultural development in each country. Identificationand analysis of these policy issues and options assumevital importance in the crr. Supporting policy mea-sures and instruments directly associated with thesepolicy options conclude the policy paper.
The agricultural policies and options of the fourcountries that have so far been covered under theCPS programme are reviewed here. All four studiesreflect different situations:
Egypt. The policy issues and the open optionsfocus on the increasing difficulty of reconcilingconflicting demands on the agricultural sector:earning foreign exchange versus meeting domesticfood requirements.
2. The Sudan. The basic policy issue is whetherto continue emphasizing large-scale irrigationschemes in the eastern region or to give greaterattention to the less developed southern and

western regions. The options reflect a shiftfrom a single objective emphasizing export ex-pansion to multiple objectives of import substi-tution, export diversification and regional bal-ance, in addition to a general increase in agri-cultural production.Iran. The country's long-term food import pro-gramme is the main policy issue. One optionis an import programme heavily weighted by redmeat imports, which implies a significant drainon the country's foreign exchange resources. Theother calls for major reliance on wheat importsand greater self-sufficiency in meat consumption;it would have favourable effects on foreign ex-change, but would be less attractive in terms ofcertain socioeconomic considerations.
Iraq. The key policy issues concern land-usepatterns, both with respect to lands covered bydevelopment projects and to irrigated lands notcovered by such projects. In the first case theoptions relate to the relative weights assignedto fodder versus grain crops; in the second, theyevaluate the feasibility of greater concentrationon limited areas on the peripheries of projectsvis-à-vis leaving the entire area at a lower aver-age cropping intensity.
An important factor in the orientation of policyissues and open options in all four countries is therelative significance of foreign exchange earnings.For Egypt and the Sudan the earning of foreign ex-change is a special demand pressing on the agricul-tural sector and also a major constraint on the entiredevelopment process, while the situation is very dif-ferent in both Iran and Iraq, where oil provides thisincome.
EGYPT
Egypt's agriculture in the last twenty years hashad to meet two main demands: earning foreign ex-change and providing sufficient food for domesticconsumption. A structural conflict in land use,chiefly owing to intercrop competition over the lim-ited land resources, has made satisfaction of thesedemands very difficult.
Intercrop competition involves export crops, foodcrops and fodder crops. Any expansion in cotton re-duces the area available for food and fodder crops,and any increase in fodder crops (berseem) unavoid-ably encroaches on winter cereals and pulses. Thereis also a conflict in food crops: more winter cerealsmay mean less winter pulses, or enlargement of thearea under fruit trees may be at the expense of bothwinter and summer cereals. Great effort has beenmade to reduce this conflict, including both the in-
85
tensive and extensive margins of agricultural pro-duction, but the need for foreign exchange and thesharp increase in food demand have been beyond thecapacity of Egyptian agriculture. Consequently,Egypt has had to import large quantities of foodstuffsand its import bill has been steadily rising.
By 1990 the conflict between the two pressing de-mands would most probably assume intolerable pro-portions in view of the severe constraints of land andwater. This could dictate a strategy of crop substi-tution, which would be manifested in a "buy orproduce" situation with respect to cereals in generaland wheat in particular. Should Egypt, in the longrun, expand production of export crops, especiallycotton, and use the additional export proceeds tobuy its cereal requirements on the world market?This is the essence of the policy options as reflectedby the Egypt CPS.
As an integral part of the study a simple analyticalmodel was developed to assist decision-makers inevaluating this fundamental problem. The main aimof the analysis was to demonstrate the relative ad-vantages of a cotton crop sequence (rotation) versusa cereals sequence under different price relationshipsand relative yields. The comparative advantages ofthe two crop sequences were examined from fivedifferent angles: (1) respective foreign exchange earn-ings; (2) inherent risks and uncertainties; (3) net re-turns to farmers; (4) effects on employment creation;and (5) water requirements.
The results of the analysis show that at the mostprobable cotton and cereal prices the foreign exchangereturns to the economy would be considerably higherfor the cotton sequence. The risks and uncertaintiesin the alternative crop sequences would be closelyrelated to world price fluctuations. Obviously, acombination of low cotton prices with high cerealprices (wheat and maize) would lead to seriousforeign exchange difficulties; however, according tothe analysis the probability of such an event wouldbe relatively small, and it would be possible to reducethe risks involved by building up strategic food re-serves, the costs of which would need to be assessedcarefully. On the other hand, the model indicatesthat the advantages of the cotton sequence would bemuch less perceptible with respect to farm income.The balance between the cotton and the cereal se-quence would be precarious and require strong gov-ernment support to maintain the cotton area. How-ever, price adjustments required to bring farm incomeinto line with the foreign exchange advantage of cottonwould be relatively small, well within the bounds ofpolitical and economic feasibility. Finally, the ad-vantages of the cotton sequence are also illustratedby its favourable effects on agricultural employment:the total man-days for the cotton sequence would be49 per feddan as compared with 38 for the cereal

sequence. Furthermore, the cotton sequence showedconsiderably lower water consumption requiretnentsthan the cereal sequence.
THE SUDAN
For many years agricultural development policyin the Sudan has been outward looking, with majoremphasis on large irrigation schemes mainly pro-ducing cotton for the export market. A basic policyissue concerns the feasibility of continuing this pat-tern rather than undertaking a major effort to pro-mote agricultural development in the poorer sectorsof the country.
Whereas further concentration on the large irriga-tion schemes in the eastern region would evidentlybe less cumbersome and produce a higher return oninvested capital, it would reinforce past trends andwiden the existing gap in regional incomes. Thiswould be in direct conflict with certain national ob-jectives which are voiced strongly at present, e.g.,self-sufficiency, diversification of production and ex-ports, and greater income equality. Recognizing allthese factors, the Sudan cps explores productionalternatives which blend multiple objectives. In es-sence these alternatives attempt to reduce the struc-tural distortions associated with a dual agriculturaleconomy, but do not fail to emphasize the vital roleof both earning and saving foreign exchange.
The promotion of self-sufficiency and the expansionof exports are treated as the immediate objectives inthe study, whereas the broader objectives of diversifi-cation and balanced regional development are viewedas overriding and major considerations in choosingamong various production possibilities. The optionsrelate not only to broad agricultural developmentobjectives but also to choices within the scope ofthese objectives. Thus the criteria for selection ofalternatives within the context of import substitutioninclude the suitability of ecological conditions, thebalancing of regional development, the magnitude offoreign exchange savings, the level of investment re-quirements and the impact on development of agri-cultural processing and intersectoral linkages.
The range of choices within the context of importsubstitution is largely dictated by the compositionof agricultural commodity imports and by the levelsof projected demand in 1985 under two growth al-ternatives. The latter imposes a ceiling on fulfilmentof self-sufficiency ratios. Also, there are limitationson the range of choices relating to ecological factorsand to economic considerations. In view of the other.;onstraints pertaining to organization, manpower re-luirements, know-how, and infrastructure, a phasingof the production of import-substituting commoditieshas been recommended.
For export expansion the decision criteria place
86
relatively greater weight on balancing regional devel-opment and monetization of the traditional subsec-tors of crop and livestock production. Other crite-ria relating to increased foreign exchange earnings,diversification of exports, capital productivity andproximity to the export outlet have also guided theselectivity of choices and the determination of theexport mix. The range of choices is determinedmainly by the export alternatives postulated in thetnacrocconomic framework and the growth rates as-sumed under these alternatives. The range of choicesis also restricted by the Sudan's capacity to meetexport demand in certain lines of production, limitedinfrastructure and weaknesses in organization, laboursupply and mechanized power.
A major policy element in the above criteria re-lates to the location of both export-expanding andmport-substituting projects. Consideration has been
given not only to the suitability of ecological condi-tions and the desirability of a better regional distri-bution, but also to the achievement of a more ra-tional production pattern by concentrating the pro-duction of agricultural exports (in areas easily acces-sible by the transportation system) and dispersingthe production of import-substituting commodities.
The shift of a single-objective monoculture to mul-tiple objectives would be manifested in certain in-tricate relationships, the most critical of which wouldbe that between more balanced regional developmentand higher income to farmers. These objectiveswould be quite complementary for rice production.Rice production in the south, although of no valuein export expansion or export diversification, wouldpromote self-sufficiency and contribute to the otherobjectives of both higher and better distributed in-come. Wheat production in the Gezira scheme, onthe other hand, has demonstrated the conflicting re-lationship between the objectives of higher farmerincomes and better regional income distribution; infact, promotion of this crop, another import-substi-tuting item, would accentuate the problem of inequali-ties in regional income distribution by benefiting asmall group of the larger farmers.
IRAN
The type of food import strategy which Iran willneed to adopt in the long run (because of the com-bined effect of large income and population increasesin Iran) is the main policy issue considered. A sharprise in domestic food demand is projected for 1990,and the strategic role to be played by food importsstems from certain physical and structural constraintson agricultural production. For example, crop pro-duction is limited throughout the country by watershortages which restrict the cropped area, the useof inputs, and the range of field crops. Also, most

mutton comes from the flocks of seminomadic tribeswhich utilize the larger part of existing rangeland.
Because of these circumstances Iran will probablyremain below full self-sufficiency for all major agri-cultural commodities, with the exception of cotton,and will have to rely increasingly on imports to sup-plement domestic supplies. However, Iran does notface shortages of foreign exchange with which topurchase food imports, nor are such shortages likelyto arise within the time horizon of the study. None-theless, recent developments on world markets anduncertainties about world supplies and prices ofmajor agricultural commodities reinforce the im-portance of a long-term import policy and strategicconsiderations for basic staples. The orientation ofprimary policy issues in this direction is thereforewell justified.
Aside from rice, Iran will most probably experiencethe largest deficit in supplies of red meat in view ofboth the sharp increase in domestic demand projectedto 1990 and the structural constraints on expandingmutton production. This deficit suggests two policychoices:
A long-term import mix which would lessenIran's dependence on foreign sources for meat.Under this option it would be necessary to maxi-mize feedgrain and white meat production do-mestically, as well as red meat production withinthe prevailing system. Iran would need to im-port a relatively smaller volume of chilled orfrozen mutton but a larger quantity of wheatas a result of import substitution through feed-grain production.
An import mix which would require larger redmeat imports but less imported wheat. Underthis option Iran would produce enough wheatto be nearly self-sufficient and would rely moreon imported feedgrains to supplement domesticsources earmarked for a somewhat lower levelof domestic meat production.
The strategy under the first option would be toshift consumption away from red meat to white meat,with some increase in mutton production based onextensive breeding flocks. Obviously, the availabilityof feedgrains and Wher feedstuffs would be the mostimportant aspect of this strategy, since domestic pro-duction of feedgrains is limited to barley, a largepart of which is cultivated under rain-fed conditions.The expansion of feedgrain production would needto be at the expense of wheat, which is at presentmore remunerative to farmers than barley. Even iflarge supplementary quantities of feedgrain are im-ported, it would probably be substantially less expen-sive to import feedgrains than red meat.
87
The basic risk in this strategy would be Iran'sincreased dependence on the world market for itsstaple food : wheat. Another disadvantage is thatwheat and sheep are the major products of Iran'ssmall farmers, who undoubtedly would not receiveincentive prices; this would clearly have unfavourableeffects on income distribution. Therefore, while theshifts in land-use and production patterns embodiedin the first option are likely to optimize the use ofland and water resources in terms of foreign ex-change earnings or savings, their sociopolitical im-plications may be much less desirable.
IRAQ
A basic policy issue in the Iraq CPS is the implemen-tation capacity for agricultural development that is,the country's capacity to harness water resourcesand develop agricultural land to give satisfactoryyield levels. The options depend on the relativeweight to be given urban development versus ruraland agricultural development. In agriculture thereare also options related to the respective weightsassigned to vertical and horizontal expansion. Theanalysis includes an evaluation of the organizationaland human factors affecting implementation ca-pacity. Similarly, the production analysis tests theimplications of varying degrees of implementationcapacity.
As regards irrigated areas covered by developmentprojects, an important policy issue is the pattern ofproduction. One option is a primarily self-sufficientpattern based on domestic food demand projections.Another would maximize farm income by concen-trating on certain high-value crops. The regionalArab Common Market would favour a pattern whichgives special importance to maximum wheat pro-duction for export to other Arab countries in theregion. A third policy issue directly concerns themore than two million hectares of irrigated landswhich are not included in the contemplated irrigationand drainage projects. In this connection there areseveral possible options. One is to concentrate onimproving the irrigated lands close to the new projects,with the purpose of raising their cropping intensityfrom 50 to 100% and to convert the rest of theselands to permanent pasture. Another possibility isto leave these lands at the present cropping intensityand to relocate the inhabitants and change their wayof life.
CONCLUSIONS
Identification and analysis of agricultural develop-ment policy issues and options constitute an importantpart of the FAO country perspective studies. The

options bring into focus substantive policies andmeasures to promote agricultural development inlong-term. perspective. The studies already under-taken in the region disclose significant variations inthe orientation of basic policy options from countryto country, as a result of structural differences whichinfluence the demands pressing on the agriculturalsector in each country.
It is hoped that this type of comparative analysiswill gain momentum as the CPS programme proceeds.It should crystallize the relation between the socio-
Africa
Development plans and policies
A number of African countries in particular,Ethiopia, Tanzania and the Sahelian zone countrieshave been stricken by exceptionally prolonged andsevere drought. For the Sahelian countries espe-cially, the only way to secure food supplies may bethrough large-scale irrigation, which will require amassive internationally financed investment. In theimmediate future the problem may be that of buildingup minimum reserve stocks, which will involve choiceof commodities, quantities required, location andmanagement of stocks, financing, etc. The serious-ness of the food supply situation, both short- andlong-term, in these countries calls for planning of ahigh order if the best use is to be made of the con-siderable supplies which are being enlisted from mul-tinational and bilateral sources. It is reasonable tosuppose that the greater awareness of the funda-mental importance of agricultural development evi-denced in some of the more recent national planswill be further strengthened by recent events. As aresult of all these events, some current developmentplans in Africa have had to be substantially revised,while those being formulated are undergoing modi-fications in line with what may now be assumed tobe the likely evolution of the world economy. Un-fortunately, few medium- or long-term predictionscan be madc with any degree of certainty.
The draft document of the second four-year plan(1974-77) of Algeria indicates the orientation, objec-tives and targets to be set for the economic andsocial development of the country in the period 1974-1980. GDP is expected to grow by 8% a year duringthis seven-year period. Total investment is projected
50 The main features of current development plans in Africaare given in Annex table 12.
88
economic structures and the orientation of agricul-tural development policy options in various countries.A sharper focus on agricultural policies and technicalassistance would then emerge, making possible amore effective integration in the development of rele-vant subsectors. Furthermore, such an analysiswould put a regional strategy for agricultural develop-ment in a new perspective by highlighting the basicsimilarities and differences in the orientation of policyoptions; it may also result in reevaluation of certainoptions when considered in regional contexts.
to reach 40% of GDP and grow by 5% a year. Privateconsumption will grow at a higher rate than duringthe first four-year plan, the growth rate being set at7%, which means a 3.5% increase per caput. Theemployment problem is to be given serious attention,and 200 000 jobs are expected to be created peryear by 1980. Labour-intensive investments aregiven the highest priority whenever possible. Themain objectives for the agricultural sector are fulfil-ment of the local demand for agricultural food prod-ucts, increase and better distribution of income forthe agricultural population and judicious use of thepotentialities of the country. The forecasted demandfor food corresponds to a per caput daily food rationproviding an average of 2 400 calories, 50 grammes ofvegetable proteins and 13 grammes of animal protein.Efforts to increase agricultural production are toconcentrate on milk, meat and fish production. Ce-reals, pulses and vegetables should show increases of50, 90 and 70% respectively. Tree crops are ex-pected to grow at a higher rate, although the arcaof vineyards will decrease by 100 000 hectares duringthe period 1974-80. A vast reforestation programmeis planned, involving the planting of 100 000 hectaresper year by 1980. Despite all these efforts, Algeriais still expected to rely on imports to meet its in-ternal demand for cereals, milk and milk productsby 1980. One of the main features of the secondfour-year plan is closer participation of all citizensin the planning process and in the development ef-forts. Plans at the commune level are geared tomeeting local needs, and the "Agrarian Revolution,"which entered its second phase in mid-1973, is toserve as a basis for the economic, social and culturaldevelopment of the rural population. Income fromagriculture is to be used mostly for the improvementof living conditions for the mass of peasants and thedevelopment of agriculture. Smallholders will receivehelp in organizing cooperatives so that they will have

access to modern techniques and be able to takefuller advantage of investment possibilities.
Morocco's new five-year economic and social de-velopment plan (1973-77) aims to mobilize all theproductive capacities of the country in order toachieve a higher rate of economic growth and ensurean equitable distribution of income. Total invest-ment under this plan amounts to more than doublethat of the previous five-year plan. Agriculture'sshare of these investments is projected at about 13%of the total. The public budget will finance 42.5%of total investment and 70% of the sums earmarkedfor the agricultural sector. The agricultural sectorhas been given priority, as in previous plans, with theobjectives of meeting a greater share of the country'sdemand for agricultural products, taking maximumadvantage of farm investments already made, pro-moting agro-industrial activities based on local pri-mary products and improving farmers' incomes.GDP is expected to grow by an average of 7.5%a year during the plan period. The projected growthrate of primary activities (including crop production,animal products, forestry and fishery products) is3.6%, while the growth rates of the industrial andtertiary sectors are set at 11.0 and 6.9% respectively.The value added by crop production will show anannual increase of 4% and by livestock products3%; industrial crop production will grow by 8.3%annually, compared with 3.5% for cereals and pulses.Veg,etable and fruit production is expected to in-crease by 3.7 and 3.6% respectively. Some 800 000jobs will be created, in comparison with only 400 000during the previous five-year plan. LaAd alreadyirrigated is to be more intensively farmed, and thetime lag between the building of dams, the installationof facilities and the cultivation of the newly irrigatedland is to be reduced; there are programmes for amore rapid development of non-irrigated areas andone for livestock development.
In Tunisia the fourth economic and social develop-ment plan (1973-76), approved in the second half of1973, corresponds to the first phase of the secondten-year programme. The economic growth rateplanned for this decade is 7.6% (6.6% duringthe period 1973-76 and 8.6% for the remainder ofthe decade), which is almost double that achieved inthe first development decade (1961-71). Total invest-ments will be almost three times the amount allocatedin the preceding ten years. The economic and socialinfrastructure built up in the past is expected toenable the economy to grow at a higher rate. Theplan indicates a shift in investment to directly pro-ductive projects. Employment, a key problem forthe Tunisian society in the coming years, is expectedto be overcome through a rapid growth rate combinedwith a reduction in population growth in line withthe economic development potential. About 350 000
89
jobs are to be created during the decade some120 000 during the fourth plan period. No jobs areto be created in the agricultural sector, but under-employment is to be eliminated. About 80% ofthe investments planned for the second developmentdecade will be financed by local resources, against60% in the first development decade. The publicsectors' relative share in total investment is intendedto decrease. The share of agriculture in total invest-ment planned for the fourth economic and socialdevelopment plan is 14.9% of which more than halfwill be devoted to directly productive projects, com-pared with only 24% in 1961-71. Agricultural pro-duction is excepted to increase by 27% during 1973-1976, above that achieved under the previous four-year plan. Projected annual growth rates for cereals,vegetables, tree crops and livestock are 6.4, 7.5, 5.7and 6% respectively, while a growth rate of 11%has been set for industrial crops. The production offish will increase considerably, largely owing to im-provements in organization. The target for 1976 is53 000 tons, against only 35 000 tons in 1972. Agri-cultural exports are expected to rise by an averageof 7% a year. To achieve these various objectives,there are long-term measures, such as soil conserva-tion and desert control, and programmes designedto give more immediate results.
Ghana is preparing a five-year development plan.No official guidelines have been issued, but indi-cations are that the plan will give major priorityto the creation of employment in both rural andurban areas. Also, fiscal measures are to be intro-duced to increase domestic savings for investment.Meanwhile, programmes are being evolved in theagricultural subsectors to increase production andhelp achieve the targets of the "Agricultural Years"programme under the "Operation Feed Yourself"campaign. Emphasis is being put on the restructur-ing of the Ministry of Agriculture to make it moreresponsive to the needs of small farmers. Existingcommodity development boards are being made moreeffective, and new ones are contemplated. Actionprogrammes and price policies will be needed toincrease productivity and help stabilize prices offoodstuffs, at present one of the major causes of thestrong inflationary pressures in the economy.
Guinea's five-year plan (1973-78) is interesting forits methodology, which is in essence an attempt tobuild the plan from the base up, starting with theplans of each small local authority. Great emphasisis placed on the need for each region to becomeself-sufficient in staple foods, particularly rice, whichat present acounts for a considerable import bill.However, less than 10% of public investment isdevoted to rural development, compared with 31%for public works and 16% for energy.
Comparisons with the targets (investments, foreign

exchange earnings, savings, etc.) of Nigeria's seconddevelopment plan (1970-74) have little meaning inthe present changed circumstances of the country asa result of developments in the prices of oil. Tobegin with, the expected revenue from oil has morethan tripled; at the same time, agriculture has failedto realize the planned targets even halfway and thesectoral rate of growth has been less than that ofpopulation. The population movement to the citiesand oil-producing areas from the farming areascontinues, and the country's ability to feed itselfand increase the export of primary commodities is inserious doubt. Short of a radical departure frompresent investment and pricing policies in agriculture,the situation could deteriorate even further in relationto the developments in other sectors, and the bulkof the population the small farmers might notshare in the new wealth of the nation. The guide-lines for the third plan of Nigeria recognize theproblems of the sector and generally set the sameobjectives as the current second plan. The interestingfact is that even before the guidelines came off thepress they were outdated with regard to critical vari-ables, including the revenue the Government will haveat its disposal during the period, and will thereforerequire revision. As the world's seventh largest pro-ducer of oil, Nigeria faces the problem of managingrather large sums of money as a result of the oilboom. However, since the duration of Nigerian oilreserves is estimated at twenty-five years, it is im-portant, indeed vital, to pursue policies that will im-prove and develop the country's agriculture, not onlyto ensure the livelihood of the bulk of the population,but also to supply the numerous industries nowdeveloping.
Work is almost completed on the first national de-velopment plan (1974/75-1978/79) of Sierra Leone.As expected, the plan will give high priority to agri-culture in an attempt to reduce the country's ever-increasing import bill for food and nearly totaldependence on diamonds as earner of foreign ex-change and source of government revenue. The plan,prepared with the aid of the United Nations, had tobe revised in the final stage to reflect the presentprices of oil. It is hoped that policies and pro-grammes will be evolved to reduce drastically theimports of rice, now about 60 000 tons annually, andto increase the prices received by producers forexport products like coffee and cocoa.
The first five-year plan for social and economicdevelopment of the Central African Republic, al-though dated 1971-75, was not presented until De-cember 1972. Its main priorities are the develop-ment of agricultural and livestock production, theimprovement of marketing structures, the training ofpersonnel at all levels, the development of tourism,the growth of forestry production and associated in-
90
dustries and the intensification of mineral prospecting.The plan covers both public and private investment,with foreign sources expected to provide 35% of thetotal. Agriculture, forestry and fisheries are to re-ceive approximately 24% of the total outlay. Theplan aims to provide an average annual increasein GDP of 8.75% in constant prices.
Ethiopia's five-year plan was due to begin in July1974, but it will no doubt be delayed because offamine in some provinces, uncertainties of the worldeconomy and recent changes in the country's politicalsystem.
Kenya's new development plan (1974-78) illustratesvery clearly the problems faced by planners in thisperiod of rapidly changing conditions. Publishedearly in 1974, and consequently conceived and largelyformulated before the oil crisis broke in the autumnof 1973, some of the targets and forecasts in theplan are already unrealistic. In a sessional paper onthe current economic situation which has since beenissued the Kenya Government outlines the measuresit intends to take in order to minimize the foreseeabledislocations. The Kenyan economy is among thosewhich have performed most consistently over a periodof years. Between 1964 and 1972 GDP increased by6.8% annually. In this period, marketed agriculturalproduction achieved an annual rate of increase of6.5% and the subsistence sector 3.8%, giving anoverall rate of about 5%. But this very satisfactoryrate of growth, in agriculture and in the economy asa whole, has not solved Kenya's severe unemploymentproblem, which is among the Government's majorpreoccupations. The new plan, strongly influencedby the findings of the 1972 mo Employment Mission,places emphasis on the growth of labour-intensivesectors and the stimulation of employment opportu-nities in rural areas. Other important and closelyrelated goals are to improve nutrition and to securea more even distribution of income.
Regional economic integration
Although there have been few new achievementsrecently, interest in various forms of political andeconomic integration has been maintained. Intensivecontacts and consultations on a bilateral and sub-regional basis have been taking place, some of whichmay be expected to lead lo formal agreements.
It is widely agreed that neither the immediate northe long-term problems of the Sahel can be satisfac-torily tackled with a piecemeal, country-by-countryapproach. A certain coordination of outside assis-tance has been achieved through the United Nationssystem, and the Sahelian countries themselves (Chad,Mauritania, Mali, Niger, Senegal, Upper Volta) haveset up an interstate committee for combating drought

in the Sahel (cmss), with headquarters at Ouaga-dougou. If this first, limited step toward integrationis successful, the process will probably go further.There are also better prospects, particularly in eastAfrica, for the setting up of regional food reserves,a measure that has been advocated for some yearsby the Organization for African Unity.
The majority of African countries have been in-volved since late 1973 in negotiations with the Eu-ropean Economic Community regarding the renewalof the Yaoundé Convention. Now that the UnitedKingdom is a member of the EEC, the former Britishcolonies in Africa are eligible for the preferentialtreatment already accorded to ex-French and Bel-gian territories under the Yaoundé Convention. Whatform this will take is subject to negotiation, but it isencouraging to note that all the African countriesconcerned have agreed on a common line, and theircase is being argued by a single spokesman.
The activities of the East African Communityhave been hampered by continuing poor relationsbetween Tanzania and Uganda, although there hasbeen some easing of the situation after a meeting ofpresidents Amin, Kenyatta and Nyerere.
The railway line connecting Dar es Salaam withZambia has been completed well ahead of schedulewith Chinese technical assistance, and the first traincrossed the Tanzania border into Zambia in April
91
1974. This rail link is immediately proving its valueby enabling supplies of grain to be sent from Zambiafor distribution in the areas of Tanzania sufferingfrom food shortages.
With preparatory assistance by a joint United Na-tions mission, Liberia and Sierra Leone concludedthe Mano River Union agreement for economic unionbetween the two countries. A secretariat has sincebeen established in Freetown, and detailed proposalsand arrangements are being examined in an attemptto translate the fourteen-point agreement into imple-mented projects.
The Onchocerciasis Elimination Programme,' anexample of regional cooperation within the frame-work of the United Nations system, involves sevencountries: Upper Volta, Niger, Mali, Dahomey, Togo,Ghana and Ivory Coast. Operations to eliminate thisdisease will begin shortly, and the territory subse-quently cleared will be available for settlement. FAO
is collaborating with the executing agency, wHo, andwill have responsibility for planning the agriculturaldevelopment of these areas.
2 Infestation caused by the nematode worm Onchocerca volvo-Ins found on the west coast of Africa. The parasite is transmit-ted to man by the buffalo gnat, Shinano?? danznosum. It cancause conjunctivitis, iritis, keratitis, choroiditis and blindness.The common name for this disease is "river blindness."

Food production
In recent years the prevailing view of the worldfood situation and prospects has swung from pessi-mism in 1965-66 to optimism in the "green revo-lution" years, from 1967 to 1970 or so, and sub-sequently back again to pessimism. It is essentialthat the present widespread concern should be di-rected to the longer-term problems before it is againdissipated in a wave of optimism and lack of attentionfollowing a few years of good harvests.
Most of the following discussion of the longer-termevolution of the world food situation is devoted totrends in food production in the developing countriesin relation to the growth of population and domesticdemand and other measures of performance and tothe obstacles faced in increasing food productionfaster in these countries. The developed countries,with only about 30% of the total population, ac-counted in 1971-73 for about 60% of the world'sfood production. They therefore clearly play a verymajor role in the provision of the world's food sup-plies a role that may well be crucial in the mediumterm, especially in view of the urgent need to rebuildstocks as quickly as possible. The provision ofadequate development assistance also depends to alarge extent on these countries. As emerges fromthe analysis of future prospects later in this chapter,it is essential however that the developing countriesaccelerate the expansion of their own food produc-tion, partly for purposes of national security andpartly to relieve malnutrition and poverty among theirown farm people. This consideration is reinforced bythe high level of rural underemployment in thesecountries and by the fact that their agricultural labour
* This chapter was prepared by FAO for the United NationsWorld Population Year, 1974, and provided the basis for FAo'scontributions to both the World Population Conference andWorld Food Conference. Appreciation is expressed to theUnited Nations Fund for Population Activities for its significantfinancial participation toward carrying out the research work forthis chapter and to the World Health Organization for its col-laboration with FAo in preparing the material on which thesections dealing with the nutritional situation and the incidenceand causes of hunger and malnutrition are based.
- POPULATION, F001 2UTIi1LY ANAGRICULTURAL itiEVEluOPVIENT*
Population and food sttpply
93
forces are bound to go on increasing in absolutenumbers for a long time to come. In the longer run,the task of the developing countries will be eased bymeasures to reduce population growth.
Although the long-term average increase in worldfood production has been greater than the growth ofpopulation since the second world war, the marginwas smaller in the 1960s than in the 1950s (Table 3-1).The increase in food production slowed down in the1960s in every major region except Africa and NorthAmerica, reflecting in part the large element of post-war recovery in the early 1950s. In the developedcountries, population growth has declined, and theslower increase in production in the 1960s was duepartly to deliberate government policies; on thecontrary, in the developing countries a decline in foodproduction occurred despite accelerated populationgrowth and government policies of increasing pro-duction more rapidly.
Thus, although total food production has increasedat about the same rate in the developed and the de-veloping countries, the increase on a per caput basishas been much smaller in the latter (Figure 3-1).This has meant that the already large difference inthe actual level of per caput production betweenthese two groups of countries has widened stillfurther. Food production per caput was roughlythree times higher in developed than in developingcountries in 1961-63 and three and a half timeshigher in 1971-73. That food production in the de-veloping countries as a whole has for so long a periodkept ahead of an unprecedented rate of populationgrowth is a tremendous achievement. Furthermore,food production in these countries in 1972 was 20%greater than in 1966, the previous year of widespreadbad weather, and so, even between the troughs of thelonger-term trend, production has outpaced popula-tion growth; in many countries, however, develop-ments have been much less favourable.
Annex table 3-A compares food production trendswith growth of population and domestic demand inthose countries for which relevant data are avail-a ble. In thirty-four developing countries, or almost

TABLE 3-1. - RATO OF GROWTH OF FOOD PRODUCTION IN RELATIONTO POPULATION, WORLD AND MAIN REGIONS, 1952-62 AND 1962-72
Trend rate of growth annual y compounded. - 2 Includingcountries in other regions not specified.
40% of the total, the increase in food productionfailed to keep up with population growth in 1952-1972. Population growth is estimated to account forabout 70% of the medium-term increase in thetotal demand for food in the developing countries.If allowance is made for the effect of rising incomeas well as population growth, it appears that in 1952-1972 the increase in food production was less thanthat in the domestic demand for food in as many asfifty-three of the eighty-six developing countries, oralmost two thirds of those for which relevant dataare available in Annex table 3-A.
Regionally, the growth of food production has beenmost rapid in Latin America and the Near East andslowest in Africa, but in each continent striking con-trasts can be noted between individual countries.For example, over the twenty-year period 1952 to1972 food production expanded at an annual rateof 6.1% in Venezuela but only 0.8% in Uruguay,5.4% in Togo but only 0.8% in Tunisia, 5% inLebanon but only 1.8% in the Syrian Arab Repub-
94
lic, and 5.3% in Thailand but only 2% in Indonesiaand 0.1% in Nepal.
Such comparisons of the growth of food produc-tion, population and demand in individual countriesshould of course be interpreted with caution. Tomeasure the relative success of different countries inincreasing food production in line with their broaderdevelopment objectives would require very detailedanalyses of the particular circumstances of each oneof them. Nor do the comparisons in Annex tables3-A and 3-B imply that self-sufficiency in food is adesirable or feasible aim in all countries. However,most developing countries are aiming at greater self-sufficiency in food, and even those whose exportcarnings enable them to import a large proportionof their food supply do not usually desire a reductionin self-sufficiency. The failure of food production tokeep up with domestic demand in so many developingcountries has led to very rapid and generally burden-some increases in their food imports.
Domestic agricultural production is the main de-terminant of the level of available food supplies inmost developing countries, but it also has other im-portant roles to play in their overall economic andsocial development, including the e,rning and savingof foreign exchange (part of which has to be used bymany of them at present for the importation of foodand fertilizers), and the provision of employment andof much of the capital needed for the development ofthe rest of the economy. This wider role of agri-cultural production is reflected in the targets of na-tional development plans and in the Second UnitedNations Development Decade (DD2) target rate ofincrease of 4% for the developing countries as awhole. A comparison of the recent performance ofagricultural production with targets in national de-velopment plans indicates that out of sixty-six plansfor forty-seven countries these targets have been metin only seventeen countries, or a quarter of the total.The plan targets for agricultural production rangefrom an annual increase of 1.5% for 1965-67 inMorocco to 8.5% for 1967-71 in Cyprus.
Similarly, the development target rate of 4% isbased mainly on the widely varying objectives forindividual countries in the periods 1961-63 to 1975and 1985 proposed in rAo's Provisional IndicativeWorld Plan for Agricultural Development (twp) andrelated FAO studies. Table 3-2 shows the performanceof agricultural production in thc developing regionsin relation to these objectives. They have not, sofar, been met in any region. As regards individualcountries, the rate of growth of agricultural produc-tion proposed in the twn for the period 1961-63 to1975 had by 1971 (i.e., before the generally badharvests of 1972) been reached in only twenty-oneof the sixty-four countries covered. It is noteworthythat the usual criticism of the Iwn objectives is that
Percent per year'DEVELOPED
MARKETECONOMIES 2 1.2 2.5 1.3 1.0 2.4 1.4
Western Europe 0.8 2.9 2.1 0.8 2.2 1.4North America 1.8 L9 0.1 1.2 2.4 1.2Oceania . . 2.2 3.1 0.9 2.0 2.7 0.7
EASTERN EUROPEAND U.S.S.R. 1.5 4.5 3.0 1.0 3.5 2.5
Total developedcountries . . 1.3 3.1 1.8 1.0 2.7 1.7
DEVELOPINGMARKETECONOMIES 2 2.4 3.1 0.7 2.5 2.7 0.2
Africa . . . . 2.2 2.2 2.5 2.7 0.2Far East . . . 2.3 3.1 0.8 2.5 2.7 0.2Latin America . 2.8 3.2 0.4 2.9 3.1 0.2Near East . . 2.6 3.4 0.8 2.8 3.0 0.2
ASIANCENTRALLYPLANNEDECONOMIES 1.8 3.2 1.4 1.9 2.6 0.7
Total developingcountries . 2.4 3.1 0.7 2.4 2.7 0.3
World . . . 2.0 3.1 1.1 L9 2.7 0.8
1952-62 1962-72
Food FoodPopu-lation
production Popu-lation
production
growthTotal
Percaput
growthTotal Per
caput

Index140
130
120
110
110
90
80
FIGURE 3-L - TOTAL AND PER CAPUT FOOD PRODUCTION IN DEVELOPED AND DEVELOPING COUNTRIES, 1961-73
DEVELOPED COUNTRIES
Total food production
Per caput food production
1961 - 65 average
1961 62 63 64 05 65 67 68 69 70 71 72 1973
they are too low. In general, the performance ofagricultural production in the developing countriesin relation to both their own plan targets andthe often lower IWP objectives is most disappointing.
TABLE 3-2. - AVERAGE ANNUAL RATE OF GROWTH OF AGRICULTURAL
iwp objectives for nor hwest Africa based on 1965. - 2 Thesefigures are derived from t se four INVP regional studies; the finaltwp objectives in the world study, based on faster growth rates forpig and poultry production, raised these rates of growth to 3.6 and3.9% respectively (3.7% over the whole period). - 3 The originaliwi. objectives for Latin America were superseded by a studycovering South America and giving for the decade 1970-80 twotarget growth rates: a high of 5.0% and a low of 3.6%.NOTE: The regional groupings cover the 64 countries studied in
the twp: 24 in Africa south of the Sahara (84% of re-gional population), 8 in tlse Far East (80%), 17 in LatinAmerica (90%) and 15 in the Near East and northwestAfrica (96%). Thus, although they cover most of thepopulation of the developing regions, the data in tisistable are not fully comparable with those in other tables.
95
Index DEVELOPING COUNTRIES140 (Including China)
110
100
90
80
Total food production
Per caput food production
1961 - 65 average
1961 62 63 64 65 66 67 68 69 70 71 72 1973
Most individual commodities followed the generaltrend and thus lagged behind the proposed objec-tives, although the pattern of the expansion of pro-duction has differed so far in a number of respectsfrom that proposed in the IWP.1 The wheat produc-tion objectives have been exceeded in both Africasouth of the Sahara and the Far East - in the latterby a wide margin. For rice the objectives have notbeen met in the Far East, the main producing area,although they were exceeded in the other regions.For the starchy roots, which are crops of low nutri-tional value, the objectives were exceeded in eachof the regions where they play an important role inthe diet. On the other hand, for pulses, a majorsource of protein, production lagged behind the objec-tives in every region - in some cases because ofcompetition from more profitable crops, such as
cereals. Among the main export crops the produc-tion objectives were exceeded for bananas, rubber,soybeans, sugar and total fruit, but there were short-falls for cocoa, ccffee, cotton, groundnuts, jute, tea,tobacco and total oilseeds.
The overall performance of livestock productionhas been much closer to the original objectives pro-posed in the iwp regional studies than has crop pro-duction, although far behind the higher objectives of_the world study based on the more rapid expansion
For a more detailed analysis covering the period up to 1971,see: Agricultural production in developing countries in relationto the targets of the Second United Nations Development Decade.Monthly Bulletin of Agricultioal Econoniics and Statistics (FAO),22(4), April 1973.
PlIODUCTION IN DEVELOPING REGIONS IN COMPARISON WITH IWPOBJECTIVES
Actual growth rateof production
IWPobjectives 2
1961-63 to1967
1967to
1973
1961-63101973
1961-63 to1975
1975to
1985
Per ent per yearAfrica south of the Sahara 2.4 2.6 2.6 3.2 3.3Far East 1.5 2.9 2.6 3.6 4.0Latin America . . . . 3.8 2.4 2.9 a 3
Near East and north-west Africa i. . . . 3.5 2.6 3.2 3.4 3.5
Average 2.5 2.7 2.6 3.4 3.7
130
120

of pig and poultry production. Beef and veal pro-duction increased more slowly than the objectivesin every region except the Far East. The productionof pigmeat and especially poultry increased fasterthan the original regional objectives in most regions,thus going some way toward meeting the higher objec-tives proposed in the world study. The increase inmilk production was ahead of the objectives in everyregion except the Far East.
The discussion of food production has so far in-cluded only crop and livestock production, as fishproduction accounts for less than 1% of world foodsupplies in terms of dietary energy, 5% of total pro-tein and 14% of animal protein, although it is ofmuch greater importance in some individual coun-tries. Thus the rapid rate of increase in fish produc-tion (about 6% a year during the 1950s and 1960s),much of which was for animal feeding, would makelittle difference, except for a few countries, to thetrends under discussion. More recently this rapidrate of increase has tailed off, and world fish produc-tion actually dropped in 1969 and 1972, largely be-cause of a sharp reduction in the catches of speciesused for animal feed. (Catches used directly for hu-man consumption have continued to increase.) Thefall in fishmeal production has put additional pressureon alternative sources of livestock feed.
Production resources
In view of the major influence of short-term fluc-tuations in production as a cause of the presentdifficult world food situation, it is clearly necessaryto ensure long-term rates of increase in food produc-tion that are sufficient for the inevitable "belowtrend" years, so as to avoid crises in the food supplysituation. It appears that agricultural technology inboth developed and developing countries may not beproperly attuned to the weather and to climatic con-ditions; but it is equally apparent that the principalcauses of the disappointing long-term trends in foodproduction in the developing countries must betraced to sources other than the weather.
Increasing production basically depends on expand-ing inputs of the different factors of production: landand water, labour, materials, various types of capitaland technological know-how. For farmers in devel-oping countries, especially the numerous small farm-ers, the possibility of and incentive for using moreinputs depend, in turn, largely on the infrastructureand services provided by governments. Many gov-ernment development budgets have tended to neglectagriculture in favour of industry. More recently therehas been a widespread tendency to increase the em-phasis on agriculture, especially in the Far East, fol-lowing the difficult food situation of 1965/66, although
96
this is difficult to quantify. The proportion ofdevelopment expenditure devoted to agriculture isheavily influenced by whether a large-scale project-- say, for irrigation or settlement is under wayat the time in question. A United Nations analysisof forty-one recent development plans of twenty-sixdeveloping countries indicates that the planned in-vestment in agriculture varies from 5 to 39% ofthe total outlay. Shortfalls in actual investment fromthe planned level appear to be particularly markedin the agricultural sector, while very little informationis available on the current expenditures needed tosupport the capital investment. Both formulationand implementation of agricultural planning havebeen hampered in many countries by the multiplicityof agencies concerned with various aspects of agri-cultural and rural development.
For some of the physical means of production theIWP proposed quantitative objectives in relation tothe production objectives discussed above. Thesecan provide the only available framework for anapproximate evaluation of the recent performance inthis regard.
Consider first the input of new land where theextension of the arable area proposed in the nwrfor the period 1961-63 to 1985 is only 0.7% a year,whereas, in fact, the arable area appears to havebeen extended a good deal faster than this. Forcereals, which occupy the largest part of the arableland, the increase in harvested area from 1961-63 to1973 was higher than was proposed for the periodup to 1975 in each of the developing regions exceptAfrica south of the Sahara. In the latter region theslow expansion of arable land contributed to themajor shortfall in the important millet and sorghumcrops. In the other regions most of the lags inreaching the proposed objectives for cereal productionhave occurred despite a faster increase in area thanwas proposed in other words, the improvement inyield per hectare has been disappointing.
Inasmuch as the IWP foresaw production expand-ing at some 3.5% but the arable area at only 0.7%,clearly the major emphasis was placed on yield im-provement to be achieved through more irrigation,multiple cropping, better seeds, greater use of fer-tilizers and pesticides and general progress in culti-vation practices. Among eight countries where ir-rigation is particularly important in this regard, andfor which the necessary data are available, the ex-pansion of the irrigated area has been much lessthan the national plan target in India, Malaysia,Sri Lanka, the Syrian Arab Republic and Thailand,and exceeded it only in Aigeria, Egypt and the Sudan.Since the IWP'S proposed expansion in irrigated areaof 1.7% a year up to 1985 in the developing countriesas a whole was the main basis for an increase in theharvested irrigated area of as much as 2.9% a year

through multiple cropping, there has therefore prob-ably been a substantial shortfall in relation to thismajor objective. Even where irrigation targets havebeen met, they have sometimes been partly offset byland that is decreasing in productivity or even goingout of production through poor irrigation practices.Moreover, the long-standing limitations of the effec-tiveness of existing facilities have been accentuatedrecently by the shortage of power for pumping, be-cause of reduced hydroelectric power caused bydrought as well as the scarcity of diesel fuel.
In some of the principal food deficit countries ofthe Far East the high-yielding varieties (Hyvs) of riceand especially wheat were major contributors to themore rapid expansion of food production late in the1960s, which enabled a few of them to become tem-porarily self-sufficient in certain cereals. The pro-duction objectives proposed in the iwr involved arise of 12% a year in the area under HYVS of cerealsin the Far East from 1967/68 to 1985, by whichtime they would cover about 75 million hectares, oralmost half the total cereal area of the region. Theincreases proposed in the other regions were gen-erally much smaller. Comparison of performancewith these targets is difficult because of problems of
TABLE 3-3. -- PRODUCTION AND CONSUMPTION OF CHENUCAL FERTILIZERS,' WORLD AND MAIN REGIONS,Jtmv/JuNE 1967/68, 1971/72 AND 1972/73
97
defining HYVS and because full data for the mostrecent years are not yet available. It is clear, how-ever, that .the HYVS of wheat have so far made moreprogress than those of rice, mainly because of thelack of controlled irrigation and drainage facilitieswhich are required by the rice varieties. By 1972/73the area under the HYVS of wheat in India and Paki-stan had reached 52 and 56°A, respectively, of thetotal wheat area. As for rice, in thirteen majorcountries of the Far East by 1972/73 the HYVS coveredonly 20% of their total rice area (ranging from 56%in the Philippines, 43% in Pakistan, 38% in Malaysiaand 25% in India to only 4% in Burma and 2.5%in Sri Lanka).
Between 1961-63 and 1972/73 fertilizer consump-tion in the developing countries rose by 13.9% ayear, only slightly less than the objective of 14.6%a year up to 1975 proposed in the IWP. While therewere substantial shortfalls in the Far East during thisperiod, the rwp objective was exceeded in thisregion late in the 1960s. More recently, however,the rate of increase has fallen off as a result of thecurrent scarcity and high fertilizer prices.
World production of fertilizer rose by 39% between1967/68 and 1972/73, and agricultural consumption
I N, P, K nutrient content. - 2 Fertilizer production statistics for some countries include the production of "technicals" not used inagriculture; some ammonia exported for further processing is double-counted by exporting and importing countries ; no account is takenof losses in storage and transit, which are estimated as about 2% of total production. Making allowance for these factors, the availableworld supply of fertilizers is estimated to llave been 73.7 million tons in 1971/72 and 78.3 million tons in 1972/73, or much closer toworld consumption. - 3 Compounded annually. - 4 Including other countries in regions not specified.
DEVELOPED MARKET ECONOMIES 4 40.4 46.5 48.5 3.7 33.8 33.7 40.5 3.7
North America 17.7 21.3 21.9 4.3 14.5 16.5 17.2 3.5Western Europe 17.9 19.9 20.8 3.0 15.1 18.1 18.8 4.6Oceania 1.3 1.3 1.4 2.0 1.5 1.4 1.6 2.2
EASTERN EUROPE AND U.S.S R 14.1 21.7 23.3 10.5 12.6 18.5 20.1 9.8
Total developed countries 54.5 68.2 71.8 5.7 46.4 57.2 60.6 5.5
DEVELOPING MARKET ECONOMIES 2.5 5.2 6.1 19.6 5.8 9.9 11.5 14.7
Africa 0.3 0.8 0.9 24.9 0.4 0.8 0.9 17.6
Far East 1.1 2.3 2.6 18.8 2.3 4.7 5.3 18.2Latin America 0.8 1.3 1.4 11.9 2.0 3.1 3.8 13.7
Near East 0.4 0.8 1.1 22.5 0.8 1.3 1.5 13.4
ASIAN CENTRALLY PLANNED ECONOMIES . . . 1.9 3.5 4.0 16.1 2.7 4.9 5.3 14.5
Total developing countries 4.6 8.7 10.1 17.0 8.5 14.8 16.8 14.6
World 59.1 76.9 81.9 6.8 54.9 72.0 77.4 7.1
Production 2 Rate ofincrease
Consumption Rate ofincrease
1967/68 1967/68967/68 1971/72 1972/73 to 1967/68 1971/72 1972/73 to
1972/73 1972/73
Million ton Percentper year3 Million tons Percent
per year

by 41% (Table 3-3). Consumption has grown muchmore rapidly in the developing than in the developedcountries, but in 1972/73 it was still only 15% ofthe world total. The developed countries as awhole have been substantial net exporters of fertil-izers. While domestic production of fertilizers inthe developing countries more than doubled in thefive years from 1967/68 to 1972/73, they still dependon imports for more than a third of their total supply,and in the developing market economies importsrepresent almost half of the supply. Moreover, fer-tilizer production in many developing countries ismainly based on imported raw materials. Fertilizerplants in developing countries have generall3r operatedat low levels of capacity utilization.
The 1WP estimated an annual increase in pesticiderequirements of 11.2% a year in the developing coun-tries up to 1985. The general impression is that,while the use of herbicides for weed control hasincreased rapidly in many areas, the use of insecti-cides and fungicides has risen more slowly. Therehas also been some increase in the use of biologicalagents in place of chemicals. The slow rise in theuse of chemical insecticides is partly due to thebanning or restriction of DDT and other persistentorgano-chlorine products. The present scarcity ofpesticides (see p. 32) is expected to continue in theshort term and to have a negative influence on theexpansion of crop production.
One area in which the proposed IWP objective hasbeen exceeded is farm mechanization: the increasein the number of tractors in 1965-73 was greater thanthat proposed for 1965-75 in each developing region.Since the objective took account of the need tocreate as much employment as possible without sac-rificing production objectives, overfulfilment may insome cases have led to an unnecessary displacementof labour.
Whether or not the "green revolution" has begunto taper off depends on how one defines the term.Clearly, wider use of existing mots in regions towhich they are suited is being held up by the ratherslow expansion of irrigation. Certainly, there is aneed for additional HYVS of wheat, maize and ricefor use in other ecological environments, as wellas for HYVS of barley, millet, sorghum and othercrops. Surely, a continuation of the green revolutiondepends on a continually increasing use of fertilizers,which at present have become scarce and expensive.But, subject to these provisions, there are no tech-nical reasons for supposing that the green revolutionhas no more to offer.
There are however other preconditions for itssuccess, notably as regards farm management andeconomic and social incentives. While it is true thatmany small farmers have already benefited, theinitial impact was mainly on the larger farmers.
98
More recently, further progress has depended in-creasingly on the difficult task of drawing in moreof the smaller farmers hence the importance ofrural institutions and services capable of meetingtheir needs.
Rural institutions and services
The general inadequacy of rural institutions andgovernment services to farmers is widely recognizedas a main cause of the slow growth of food produc-tion in developing countries. It is difficult howeverto assess their performance. The 1WP was able topropose quantitative objectives only for the volumeof institutional credit and for the trained manpowerrequired to staff government services, but, even so, ithas not been possible to measure performance againstthe objectives. Developments in this important fieldcan therefore be assessed only in broad qualitativeterms.
Moreover, the effectiveness of rural institutionsand services should be judged not merely on the basisof their contribution to meeting production objectives,but also in relation to the achievement of social goals,including better distribution of the benefits from in-creased production. The overall institutional systemnot only has to fill various organizational or tech-nical functions in providing links between producersand consumers of both agricultural products andinputs, but it also has a crucial role in the mobiliza-tion of human resources. It should provide a systemof planning and decision-making that involves theproducer as well as the policy-maker, and it shouldmotivate the rural population through education,communication and incentives.
Whereas the need for agrarian reform in manycountries and the complexity of the processes in-volved have been increasingly recognized in the lastfew years, actual progress in this area has generallybeen small. The scope of the few new agrarian re-form programmes launched in recent years has oftenbeen limited. In some countries they have beenimplemented very slowly, and evasions of legislativeprovisions have been widespread. Even where im-plementation has been vigorous, poor administrativesystems and lack of trained personnel for the essentialsupporting services have been obstacles to positiveresults.
There has been somewhat more success in im-proving institutions and services for the supply ofinputs and credit; but, here too, progress has beenuneven and inadequate, especially in relation to therequirements of small farmers. There is now muchmore widespread realization of the need to concen-trate development programmes on the poorest pop-

ulation groups if social progress is to be achieved,and that in most developing countries these groupsarc principally the small farmers and other rural poor.However, not only input and credit services but alsoextension, training and marketing have so far gen-erally failed in this regard; nor has there been muchsuccess in integrating the small farmer or the ruralpoor as a whole into the overall socioeconomicframework for rural development.
In agricultural education, training and extensione attention has been given to the original solutions
required for the special problems of the developingcountries. Even where good progress has beenmade in the development of the higher and inter-mediate teaching institutions so badly needed to trainthe staff of government services to farmers, theorientation of the training is often impractical andgraduates are seldom used at the farm level, wherethey are most needed. A preoccupation with tradi-tional, formal systems has hampered the innovationsneeded in informal, out-of-school education. In manycountries, education and extension have been almostexclusively directed to the adult male, neglectingwomen and youth, who form a major part of therural labour force. Extension work has stayed tooclose to the concept of an individual agent reachinga particular "clientele" in person, and too little at-tention has been paid to group work and to modernmethods of mass communication. Insufficient effortshave been made to involve the farmers themselves,by means of various types of farmers' organization,in making better use of advisory information throughself-help and in participating more fully in the de-velopment process.
Even in areas where communications are good andproducers not physically isolated, it has generallybeen found difficult to integrate small farmers intothe marketing system. Attempts to organize the col-lection and primary marketing of produce throughfarmers' cooperatives have succeeded in some cases,but there have been numerous failures. Some coun-tries have established statutory boards or publicbuying agencies to deal directly with farmers, butthey have often proved too costly and ill-adapted tocollecting produce from widely scattered small farm-ers. Similar difficulties have been encountered intha distribution of fertilizers and other inputsagain, especially in the case of small farmers. Inmany countries the whole marketing chain fromproducer to consumer has become badly overstretchedby the very rapid pace of urbanization. Facilitiesfor storage, processing and wholesale marketing havenot been adequately developed and still involvesubstantial avoidable losses of food.
Food price policies in the past have often tendedto favour the urban consumer at the expense of theincentives needed to increase production fast enough
99
at farm level. In recent years there has been somereversal of these policies, and higher farm priceswere a major factor in increasing incentives in themany countries, especially in the Far East, wherethere was an acceleration in the expansion of pro-duction at the end of the 1960s. Most of the highsupport and procurement prices of that time appearto have been maintained or even increased, althoughin some cases their incentive effect has been erodedby inflation and by increases in input prices, some-times with the removal of fertilizer subsidies. Theeffects of the most recent price developments forboth agricultural products and inputs remain un-certain, but it is clear that the large changes thathave occurred and are still occurring have enhancedthe importance of careful adjustments to price policiesin order to maintain production incentives.
One of the more encouraging trends of recent yearshas been an increasing tendency to view rural de-velopment as a whole, rather than in the limitedcontext of increasing food and agricultural pro-duction. There is now widespread recognition ofthe need for more integrated policies of rural devel-opment that also embrace such elements as nonagri-cultural sources of rural income and employment,the development of decentralized rural towns, publicworks programmes, social services and amenities,and people's participation in development decision-making. It is increasingly realized that such policiescan contribute not only to social progress but alsoto the possibilities of and incentives for increasingproduction. There is less awareness however of theproblems involved in the implementation of integratedrural development policies.
It appears likely that the rural poor have becomerelatively poorer in recent years, although this isdifficult to quantify. Rural-urban income disparitieshave widened in many countries, and there has beenlittle if any redress in the rural-urban imbalance inpublic services and amenities. Regional differentialsbetween rural areas have widened, since improvedtechnology has usually been available only to thosealready favourably endowed with natural resources.Moreover, although the "green revolution" technologyhas been successfully taken up by many smallfarmers, the bias of rural institutions and servicesin favour of larger farmers has generally ineant thattheir gains have been greater.
The overall level of agricultural underemploymenthas beei reduced in some countries, but it is notcertain whether the increased employment opportu-nities have actually gone to the poorest, most seri-ously underemployed groups. In general, the slowprogress in increasing food production in the de-veloping countries as a whole has meant that agri-cultural and rural employment and incomes have notincreased as fast as they could have.
Development assistance
Development assistance, which plays a significantrole in agricultural as well as overall economic andsocial development, has remained well below DD2and other targets.2 Total official and private finan-cial flows from the sixteen-country DevelopmentAssistance Committee (nAc) of the OECD rose fromUS$9 200 million in 1961 to $19 500 million in 1972.There was a sharp increase to $24 600 million in1973, but much of this latest increase reflectedchanges in currency rates, and prices; in real termsthe volume of aid increased by only 7% in 1973.The level of aid is also dwarfed by the recent in-creases in the oil import bills of both recipient anddonor countries. Food aid (included in the abovetotals) has recently declined in value and even morein volume.
Development assistance has deteriorated in severalother respects. The total aid flow declined from0.95% of the GDP of the donor countries in 1961 to0.78% in 1973, which is substantially below thetarget of 1% accepted by oAc. Official developmentassistance fell from over two thirds of the total con-tribution in 1961 to about one half in 1973, droppingfrom 0.52% to only 0.30% of GDP, less than half theDD2 target of 0.7%.
A more encouraging development is the rise inthe grant element of official assistance after a decadeduring which the ratio of loans to grants had in-creased. Since i January 1973 a grant-elementthreshold of 25% has applied to all new nikc com-mitments. Payments by DAC countries to multilateralagencies grew from 10% of total development as-sistance in 1961 to 16% in 1970 and 24% in 1973.The latest rise mainly reflects increasing contributionsto the World Bank's International Development As-sociation (IDA); more recently, however, IDA has beenexperiencing refinancing difficulties.
The sixteen DAC countries are estimated to be re-sponsible for about 95% of the total aid flow to de-veloping countries. A precise evaluation of the totalnet flow from non-bAc countries is not possible, butit is tentatively estimated by DAC that it increasedfrom about US$600 million in 1967 to $1 300 millionin 1972 for the developing countries on the DAC list.In addition, non-nAc countries have provided sub-stantial amounts to Cuba and other centrally plannedeconomies, which according to the limited informa-tion available could have exceeded $1 000 millionannually in recent years. A number of initiativesare now under way to increase substantially theamount of development assistance available fromthe Arab and other oil-exporting countries. Insuf-
2 For complete coverage in this context some of the materialdiscussed in Chapter I (p. 23) is repeated here.
100
ficient information is available to assess either theterms of aid frorn non-bAc countries or its relationto their national income.
The flow of aid has been very unevenly distributedamong the recipient countries. Partly because oftheir low absorptive capacity and lack of a "pipeline"of projects, the least developed countries have re-ceived less than half the average amount on a percaput basis. The external public debt of the devel-oping market economies increased from US$19 000million in 1960 to $66 000 million in 1971, and an-nual debt service payments from $2 100 million to$6 100 million In some countries, such as Iran andIraq, until the recent changes in petroleum prices,about one third of total annual export earnings werepreempted by repayment and servicing of debts.
Only approximate data are available on the amountof total development assistance to agriculture, al-though efforts are being made to improve the avail-able information. It may be rouahly estimated how-ever that in 1970-72 the commitment of DAC andmultilateral assistance to agriculture 3 was approxi-mately Si 000 million a year. In 1973 theSe com-mitments rose sharply to about $1 500 million, almostentirely because of an increase in World Bank/IDAcommitments from $436 million in 1971/72 to $938million in 1972/73. The much lower level of inter-national assistance for population programmes stoodin 1969-72 at 1 to 2% of total development assistance.
World trade in food
International trade plays a major role in the worldfood situation. Among the main food products, 19%of global wheat production, 30% of sugar and 33%of fats and oils entered world trade in 1973. Forbeverages and raw materials, which account for alarge share of the export earnings of many food-importing developing countries, the proportions areeven higher, ranging up to 77% for coffee, 82% forcocoa and 92% for natural rubber.
The longer-term lag of food production behind thegrowth of domestic demand in many developingcountries has greatly increased their dependence onfood imports, which had already doubled in volumebetween 1955 and 1966. More recently, the increasehas somewhat slackened, to about 3.4% a yearfor the developing market economy countries, whichis considerably above their rate of population growthand not far behind the average for the developedcountries (Table 3-4).
A very large part of the food imports of the de-veloping countries consists of cereals, the staple
3 Excluding food aid and the agricultural technical-assistancecomponent of onc bilateral aid.

TABLE 3-4. -- INDEX NUMBERS OF TEIE VOLUME OF GROSS FOODIMPORTS AND TFIE/R RATES OF GROWTH, WORLD AND MAIN REGIONS,
1961-63 io 1972
Including countries in other regions not specified.
element of the diet in most of them. Between 1949-1951 and 1966-68 their gross imports of cerealsrose from 12.4 to 34.4 million tons and by 1972 hadreached 36 million tons.4 In value they rose fromUS$996 million in 1955 to $3 000 million in 1967,then to about $4 000 million in 1972/73, and reacheda tentatively estimated $9 000-10 000 million in 1973/1974.
Before the second world war the developing coun-tries as a group were net exporters of cereals, butthey have subsequently become substantial net im-porters. Table 3-5 shows the average annual flowof cereals in value for 1969-71, the latest periodin which prices were relatively stable. The de-veloping countries accounted for 19% of world ce-real exports (Argentina, Burma, Mexico and Thai-land being the only significant net exporters) and37% of world imports. The developed market econ-omy countries provided 69% (North America alonealmost 50%) of world exports and took 47% ofworld cereal imports. Japan, the United Kingdom,
4 Excluding China, for which figures for the earliest period arenot available.
101
Italy and the Federal Republic of Germany, withabout 7% of the world's population, accounted for36% of total cereal imports in 1969-71. India andChina, the largest importers in the developing world,with 36% of the world's population, accounted foronly 9% of cereal imports. A very large part ofthe developed countries' cereal supplies is used tofeed livestock.
The burden on the develop:Jig countries of payingfor increasing food imports has been greatly mitigatedduring the last twenty years by the availability oflarge amounts of food aid. Between 1954 and 1969food aid shipments ranged between 30% and 45%of the total food imports of the developing countries.The main source of food aid has been the UnitedStates surplus stocks of grain, which were availableon concessional terms but have now been depleted.Since 1963, multilateral food aid has been availablethrough WFP, and since 1968 under the Food AidConvention (FAc). Food aid shipments, whichreached a peak of about 18 million tons in 1964/65,have subsequently declined to 9.8 million tons in1972/73 and to less than 6 million tons in 1973/74,the lowest since 1957/58.
Most developing countries continue to dependheavily on agricultural exports for their foreign ex-change earnings. This affects their food situationin a number of ways. Many developing countrieshave to use much of their exchange to import foodand the fertilizers and other inputs needed to produceit, whereas agricultural exports are a major sourceof employment and income for the farmers of de-veloping countries and can thus contribute to thealleviation of poverty, which is the key to the im-provement of nutrition.
Trends in agricultural export earnings have nev-ertheless been generally unsatisfactory. While thevolume of the agricultural exports of the developingcountries rose by 2% a year between 1961-63 and1970-72, the annual increase in their value over thiswhole period was only 3.3%. The agricultural ex-port earnings of the developed market economy coun-tries increased at more than twice that rate. Thedeveloping countries' share in world agricultural ex-ports declined from 40% in 1961-63 to 30% in1970-72.
In some cases where long-term demand conditionshave been favourable (e.g., for meat, fruits andvegetables, timber and paper products), developingcountries have missed export earning opportunitiesthrough a failure to increase production fast enough.Frequently, however, their access to markets in de-veloped countries, especially for competing products,has been limited by various tariff and nontariffbarriers which have discouraged the steady expansionof production for export. Such progress as has beenmade in the introduction of the Generalized System
DEVELOPED MARKET
1961-65 average 100 Perce It perar
ECONOMIES 1 96 128 140 3.6 3.3
Western Europe . . . 96 125 133 3.4 3.7North America . . . 102 116 123 1.7 1.9Oceania 97 114 123 2.0 2.4EASTERN EUROPE AND
U.S.S.R. 86 113 154 3.5 6.0
Total developed countries 95 126 142 3.6 4.1
DEVELOPING MARKETECONOMIES 1 96 127 133 3.4 3.5
Africa 100 123 135 2.6 3.1Far East 93 120 125 3.2 3.0Latin America 96 127 154 3.5 4.8Near East 94 135 135 4.5 3.6
ASIAN CENTRALLY PLANNEDECONOMIES 96 106 120 1.2 2.2
Total developing countries 96 123 134 3.2 3.4
World 95 125 139 4 3.9
196 1-63
19 69-71
1972
1961-63to
1969-71
1961.-63to
1972
Volume of gross food Annual rate ofimports growth

Exports to
TABLE 3-5. STRUCTURE OF WORLD TRADE IN CEREALS, ANNUAL AVERAGE 1969-71
Developed market economies
of Preferences and in GATT nogotiations has had alimited effect on agricultural products. Most tariffsystems still discriminate against agricultural importsin processed form.
The frequent short-term fluctuations in expoilprices have greatly added to the difficulties of coher-ent national planning in the developing countries.An UNCTAD analysis indicates that the average annualdeviation from the trend in 1960-71 was 13% for theprices of rice and soybean oil and 44% for sugar.International commodity agreements, aimed partlyat mitigating these fluctuations, have mostly beenonly partially effective. The recent sharp rises incommodity prices, comparable to those of the boomduring the Korean conflict at the beginning of the1950s, have brought substantial windfall gains inagricultural export earnings to many developingcountries. However, these temporary benefits appearlikely to have been partly counteracted by the ad-verse effects, especially the higher costs of manufac-tures and other imports and the atmosphere of un-certainty that makes rational development planningextremely difficult.
The unsatisfactory long-term evolution of world
Total
18397
1 641272
2 193
1017
108
3357
467
557
2 858
102
Centrally plannedeconomies
East-ern
Europe
5715
12910
211
39312
405
506
15
71
687
Asia
Million U.S. dol ars f.o.b.
10
14080
230
17
17
262
28
275
Total
6715
26990
SOURCE: United Nations, Monthly Bulletin of Statistics, July 1973, April 1974.Original six members, excluding intra-tracie. 2 Chiefly Australia. 3 Chiefly Argentina.
503217
Developing market economies
Africa
848
12871
441 291
410 1612 11
422 27
353112
99 78
962 396
Asia
LatinAmer-
icaand
Carib-bean
Total
Worldtotal
45 2 131 3815 2 15 127
674 255 1 057 2 967273 30 374 736
997 289 1 577 4 211
14 46 76 58784 19 114 133
98 65 190 720
25 2 62 145232 1 264 353
18 134 164 648
275 137 490 1 146
1 370 491 2 257 6 077
trade in agricultural products and the heavy depen-dence of the developing countries on this trade haveled to increased recognition of the need for majormeasures of international agricultural adjustmentaimed at a more rational system of agricultural pro-duction and trade. In such a system there could beprovision for increasing the agricultural export earn-ings of the developing countries, which would alsooffer them expanded agricultural employment op-portunities.
This account of the longer-term development ofthe food situation has concentrated on its less satis-factory features, since the main aim is to indicateobstacles and difficulties as regards what action isnecessary. There are however some more encour-aging aspects that should not be overlooked. Thereare many success stories of individual countries in-creasing production very rapidly in the face of fastpopulation growth; for example, over the twentyyears 1952-1972 eleven countries 5 achieved a food
5 The eleven countries are Bolivia, Costa Rica, Cyprus, Ecua-dor, Lebanon, the Libyan Arab Republic, West Malaysia, Mexico,Thailand, Togo and Venezuela.
Exports from
EEC I
Otherwest-ern
Europe
NorthAmer-
icaOthers
DEVELOPED MARKET ECONOMIES
EEC I- 177 1 5
Other western Europe . 50 40 7
North America 527 343 155 616
Others 2 33 104 4 131
Total 610 664 160 759
CENTRALLY PLANNED ECONOMIES
Eastern Europe 41 60Asia 1 1 5
Total 42 61 5
DEVELOPING MARKET ECONOMIES
Africa 14 18 1
Asia 3 6 48Latin America and Caribbean 3 252 129 9 77
Total 269 153 9 126
World total 921 878 169 890

production increase averaging 5% or better. Thereare also individual examples of success in takingadvantage of trade opportunities and in devisingviable systems of rural institutions and services. Therapid increases in food production achieved in manyFar Eastern countries in 1967-70 reflected not onlyfavourable weather and the opportune availabilityof improved technology but also the political will
Nearly thirty years ago when the first of the newUnited Nations specialized agencies was being estab-lished, the word "food" was deliberately inserted inthe name FAO to emphasize agriculture's contributionto freedom from want. Expansion of food suppliesin the poor countries combined with nutritional pro-grammes and, more generally, an attack on povertythrough economic development were correctly chosenas the weapons with which to eliminate hunger.
What, in fact, has happened in the interveningyears'? Several countries, it is true, have succeededin expanding their food production faster than theirdomestic demand for food, and some of these coun-tries and certain others have organized effectivenutritional programmes; but a much larger numberhave failed. About two thirds of the developingworld's population live in countries where foodoutput has been rising more slowly than effectivedemand for food, and in most of those countries thegrowth in effective demand has itself not been rapidenough to diminish the numbers of persons livingin extreme poverty. In other words, the progressin food production in developing countries togetherwith the progress in economic development, althoughsignificant, has been insufficient over the last twentyyears to reduce appreciably the incidence of hungerand malnutrition. In many countries the proportionof the population suffering from undernourishmenthas declined, but in the third world as a whole theactual number of hungry persons has quite certainlyincreased; this is indeed the grim centre of the world'sfood problem.
Assessment of undernutrition and malnutrition
It is not easy to present a precise picture of theextent of under- and malnutrition in the world. Cer-
6 This section is based on material prepared jointly by theWorld Health Organization (wHo) and FAO.
to do more about agriculture. The proposed objec-tives in the IWP for production and input use, al-though rarely met so far, have been carefully workedout in terms of physical, economic and social pos-sibilities and can still be met, although with sometime lag. The urgency of doing so is emphasized bythe following analysis of the dimensions and causesof hunger and malnutrition in the world.
Dimensions and causes of hunger and malnutrition6
103
tainly in its extreme form of near-starvation, under-nourishment can be clearly identified; however,even when not outwardly obvious, dietary deficienciesmay be severely affecting an individual's health,physical grol,vth and working capacity.
Nevertheless, progress in definition and evaluationhas been made. At national level and internationallyin FAD/wHo expert committees, the concepts of nu-tritional requirements have been clarified.' Thecurrent position on these matters is spelled out ina technical note annexed to this, chapter (p. 147).Only the highlights of that statement are recapitu-lated here.
The most important characteristic of dietary de-ficiency is an inadequate intake of energy or proteinor both over a period of time. An insufficient intakeof the energy and/or protein needed to maintain thebody functions for activity, for growth and for thereproductive cycle can be manifested in many dif-ferent ways, depending on age, physiological state,existence of concomitant infections, association withspecific mineral or vitamin deficiencies, etc. Thisspectrum of manifestations extends from the slightimpairment of growth or thinness seen in mildlyundernourished children to the gross alterationsshown by persons suffering from kwashiorkor ormarasmus. Other manifestations, for example, areapathy, emaciation, incapacity to perform the re-quired physical work, weight loss, inadequate weightgain during pregnancy and low birth weight.
In the light of the most recent recommendationsto cover protein needs, it seems improbable that adietary intake sufficient to cover energy requirementswill be insufficient to meet protein requirements. Thismeans that protein deficiency in the absence of energydeficiency is unlikely to occur a possible excep-tion being in populations that subsist on cassava,
7 FOC example, FAo and WHO have convened groups on energyor protein requirements in 1949, 1955, 1956, 1963 and 1971. Inthis section, use is made of the more recent recommendationsavailable in Energy and protein requirements, report of a JointFAO/WHO Ad Hoc Expert COMMittee, FAO, Rome, 1973.

plantains, yams or breadfruit, all of which are ex-tremely low in protein content. In most of the de-veloping countries where cereals and pulses are thestaples the consumption of more food will simul-taneously correct any insufficiency of energy andprotein in adults and older children; but this doesnot hold true for infants and preschool children,whose ability to consume more food is limited, andhence foods with a higher concentration of proteinare needed.
It must be further emphasized that even if a dietis adequate in its protein content, but the quantityof food eaten is not enough to satisfy energy needs,some of the protein will be used mainly as a sourceof energy and consequently not be fully utilized forits protein. In the present discussion the assessmentof the number of people suffering from energy orprotein deficiency or both takes into account thisrelationship between the metabolism of energy andprotein as well as the new recommendations for pro-tein intake recently made by the WHO/FAO ExpertCommittee referred to above.
To assess the magnitude of the nutrition problem,attention is paid first to the level of total food sup-plies at national and regional levels. The problemcaused by inequitable distribution of available sup-plies is then illustrated with examples of energy in-take by income and social group. The availableevidence from vital statistics, clinical and anthropo-metric data and detailed food-intake surveys is sum-marized, and the conclusions from these sources,which are limited in coverage, are compared withthose obtained by a crude estimate based on foodbalance sheet material. From these disparate sourcesa picture of the scope and nature of the problememerges.8
Food availability
Table 3-6 shows by regions for 1961 and 1969-71the per caput availability of energy and proteinand of energy as a percentage of requirements. Asthe distribution of available supplies within a coun-try is far from equitable in relation to need, it isclear that aggregate supplies should exceed require-ments. For energy, it is considered that suppliesin the developing regions should be at least 10%above aggregate requirements, thus allowing for mal-distribution. The energy requirements for 1961 and1969-71 are based on the average requirement of a
8 It bas not been possible to update the information presentedin this section due to the lack of recent data. It may be as-sumed however that the nutritional situation of the poorer groupsof the population, particularly of children, has deteriorated inthe last two years due to the rapid rise in food prices ; however,this would only strengthen the major conclusions emerging fromanalysis of existing data.
104
TABLE 3-6. -- AVERAGE ENERGY ANO PRO1MIN SUPPLY BY REGION I
Energy
1961
ProteinEnergy aspercent of
rcquil emen t
1969- 1969-71 711961aver- aver-age age
1 The figures relate to protein at d energy contei t of food avail-able at the retail level after allowance for storage and marketinglosses and waste.
moderately active reference man whose body weightis presumably the prevailing mean for the particularregion. The requirements are slightly different for1961 and 1969-71 owing to changes in age and sexstructure of the population between these years.
Energy and protein supplies in the developed re-gions, which continued to rise in the 1960s, have beenwell in excess of requirement. In 1969-71, energysupply (Figure 3-2) was an estimated 23% above re-quirement and protein supplied 12% of the energyavailable. The developed regions averaged over3 100 kilocalories per caput of energy availabilityper day, whereas the developing regions averagedonly 2 200 kilocalories per caput per day. Similarly,the protein supply was over 96 grams per caputper day in the developed regions and less than 58grams in the developing regions, much of whichwas being diverted in an attempt to meet energydeficits.
Kilocaloriesper caput
Grainsper caput Percent
DEVELOPEDMARKETECONOMIES . . 2 950 3 090 87.5 95.1 115 121
Western Europe 3 020 3 130 89.3 93.7 118 123North America 3 110 3 320 92.3 105.2 118 126Oceania . . . 3 210 3 260 92.7 108.1 121 123Other developed
maTket econo-mies . . . 2 420 2 550 73.3 79.1 102 108
EASTERN EUROPEAND U.S.S.R. 2 990 3 260 85.8 99.3 116 127
Total developedconntries . 2 960 3 150 87.0 96.4 116 123
DEVELOPINGMARKETECONOMIES . 2 130 2 210 55.0 56.0 93 97
Africa . . . 2 120 2 190 55.7 58.4 91 94Far East . 2 050 2080 51.3 50.7 92 94Latin America . 2 410 2 530 63.7 65.0 100 105Near East 2 200 2 500 62.3 69.3 89 102
ASIANCENTRALLYPLANNEDECONOMIES . 2 020 2 170 54.7 60.4 86 92
Total develop-ing countries 2 100 2 200 54.9 57.4 91 95
World . . . t 2 380 2 480 65.2 69.0 100 104
1969-
1961 71aver-
age

FIGURE 3-2. ENERGY SUPPLY AS PERCENT OF REQUIREMENT,WORLD AND REGIONS, 1969-71
Percent of requirements90 95 100 105 110 II& 120 125 130
Asian plannede-conomies
FarEast
Africa
NearEast
LatinAmerica
MrthAmerica
Oceania
WesternEurope
asternitirope and
U. S. S. R.
In many developed countries most individuals arefree from the threat of nutritional diseases causedby the combined effects of an insufficient diet, poorenvironmental sanitation and cultural deprivation;but more and more are falling prey to the nutritionaldiseases of abundance. The consumption of excesscalories, especially in the form of "empty calories"such as visible fats and sugar, and a dietary patterncharacterized by a high content of cholesterol andsaturated fats, coupled with decreased physical ac-tivity, lead to a high prevalence of obesity and ar-teriosclerosis. These two conditions are commonlyassociated with diabetes, hypertension and ischemicheart disease diseases that are responsible for thelargest number of deaths and permanent disabilitiesin the industrialized nations.
Protein has not been shown as a percentage ofrequirement, as the result could be very misleadingin view of the failure to utilize protein adequatelyif the energy intake is insufficient. In general, pro-tein supplies in all regions are well in excess of
105
national requirements; however, as energy suppliesare not adequate in many regions, the surplus ofprotein availability is more apparent than real.
In none of the developing regions did energy sup-plies reach 110% of requirements, and in three failedto reach even 100% of requirements. In view of thecertain inequitable distribution in supplies, it isclear that all developing regions faced a serious energydeficit problem in certain segments of the community.The position regarding energy supplies per caput im-proved in the 1960s. Nevertheless, the Far East,Africa and the Asian centrally planned economiesstill had an overall 6 to 8% deficit in 1969-71. Thesedeficits represent averages for each region; becauseof inequalities in consumption between and withincountries the most disadvantaged population groupswill suffer from a much higher percentage incidenceof food deficiencies.
Table 3-7 shows the number of countries withsurpluses and deficits of energy supplies in 1961 and1969-71 (see also Annex table 3-C). Only six devel-oping countries had an energy surplus of more than10% of the national requirement in 1961, but this fig-ure rose to eighteen by the early 1970s. On the otherhand, in 1961 seventy-four developing countries hadenergy supplies below the basic requirement, even
TABLE 3-7. NUMBER OF COUNTRIES WITH SURPLUS AND DEFICITENERGY SUPPLIES BY REGION, 1961 AND 1969-71
DEVELO PEEREGIONS
Western EuropeNorth AmericaOceania . .
Eastern Europeand U.S.S.R.
Other developedcountries' . .
Total
DEVELOPINGREGIONS .
Latin America .Far East . . .
Near East . .
Africa . . .
Asian centrallyplanned econ-omies . . .
Total
World
Japan, Israel and South Africa.
1961 1969-71 average
Surplus Deficit Surplus Deficit
Morethan10%
Lessthan10%
Morethan10%
Lessthan10%
Morethan10%
Lessthan10%
Morethan10%
Lessthan10%
1422
4
1
5
3
2
17
2
2
2
1
23 10 1 30
5
1
441
5
2
_.._
3
71018
2
8
5
214
8
41
3
1
6438
1
43
412
1
7
5
6
14
1
6
29
16 45 29 18
48
22 24 33
26 45 30 25 24 34
VA World
Totaldevelopedcountries
Totaldevelopingcountries

assuming perfect distribution of food, and fifty-sevenof these were in the same position in 1969-71. Themajor improvement occurred in the countries facingthe bigger deficits: the number of countries whereenergy supplies failed to reach even 90% of require-ment declined from forty-five in 1961 to twenty-fourin 1969-71 (twelve, of these in Africa).
Distribution of food by income and social group
Knowledge that food supplies at an overall na-tional level are or are not adequate is not enough.If corrective measures to reduce or eliminate theincidence of nutritional deficiencies are to be un-dertaken, it is essential to know which particulargroups of the population are malnourished, whythey are malnourished and where they are located.Apart from the fact that available food in the worldmay be badly distributed among different geographi-cal areas owing to ecological, technological or otherfactors, a basic feature of the present food situationis the extreme inequality in food distribution betweendifferent socioeconomic groups. According to theinformation available for a few countries, it is clearthat the poorer groups of the population receive thesmaller amounts of food and hence show the lowerdaily calorie/protein intakes. Annex table 3-D showsthe effect of income and urban/rural residence onfood consumption in a few countries for which thenecessary recent data are available. Unfortunately,food intake data as well as other data reflecting thenutritional status of the population are available forvery few developing countries.
It is obvious from these tables that an adequateincome in cash or kind tends to ensure availabilityof a sufficient amount of food for the family andtherefore reasonable energy and protein intakes. Theincome effect is most noticeable for the urban pop-ulation. The urban poor, especially recent migrantsfrom rural areas, are perhaps more vulnerable froma nutritional standpoint. Deprived of access to sub-sistence food, and without regular or adequate in-come to purchase sufficient food, the nutrition ofsuch people may be reduced to a perilous state. Theprocess of rapid urbanization that is taking placein developing nations is not only accentuating theunsatisfactory nutritional status of the populationbut also modifying the characteristics of this phe-nomenon, with severe malnutrition appearing at anearly age.
It is impossible to draw precise conclusions fromthe tables as to the numbers risking undernutrition,for very little is known about the distribution ofhouseholds within each income class. For example,even though the mean intake of the poorest urbanhouseholds in southern Brazil is less than 1 500
106
kilocalories, an unknown proportion of the house-holds even in this group may have satisfactory in-takes. Nevertheless, some conclusions can be drawnfrom the simple averages, for it is clear that if theaverage intake is well below the average requirement,a very large proportion of the group must be seriouslyrisking undernourishment.
The rural poor tend to fare slightly better thanthe urban poor from a nutritional standpoint, asshown in Annex table 3-D. Thus, in the northeastregion of Brazil, 22% of urban households were inthe lowest income groups and had per caput intakesof between 1 200 and 1 500 kilocalories per day.Whereas 32% of the rural households fell into thesame low-income groups, the average per caput in-takes ranged from 1 500-1 800 kilocalories per day.The same effect is seen in Pakistan and Bangladesh,where the poor urban households had intakes sub-stantially lower than the equivalent rural households.
The most vulnerable among the rural populationare the landless agricultural labourers, who have tolive on their meagre income earned during the harvestand sowing seasons. Next come the small subsistencefarmers, who operate such small holdings that theyfind it difficult to eed their families even in yearsof good harvests. In times of poor harvests or inthe season prior to the harvest, when previous sup-plies have been exhausted, their nutritional statusbecomes extremely precarious.
If there is not enough food for the whole family,the working adults tend to take the largest sharefor themselves. This is particularly serious becausechildren and pregnant and lactating women haveadditional nutritional needs. Even if the adults re-duce their requirements by diminishing their activity,their calorie intakes must still reach a certain levelif they are not to descend into an increasing stateof undernutrition. This necessity of keeping in energybalance, including the needs for maintenance and es-sential activity, means that the adults may be forcedto draw upon some of the energy supply that shouldhave been available to the children, whose energyrequirements comprise a relatively high proportionfor activity and a proportion for growth. Faced withan insufficient family supply, the adults may thusunwittingly deprive children of an adequate foodsupply for activity and growth, since an inactivechild does not jeopardize the family's survival asdoes an inactive adult; also, retardation of growth isnot irnmediately apparent and, in any case, may notbe associated by the parents with nutritional de-privation.
Comparative studies of children from poor andwell-to-do households in places as diverse as Hyder-abad and Lagos tend to confirm the above conclu-sions. These studies show that poor children receivedabout one half the energy and protein consumed

by children from the better-off families. Table 3-8shows the data for schoolchildren in Hyderabad.
Surveys carried out in Nigeria, Kenya and Guate-mala found that children's intake of nutrients is notproportional to the nutrient supply available in thehousehold. Children may lose their appetite, andthe efficiency of their bodies to utilize nutrients isreduced by infections; or they may not be able toeat enough of the monotonous bulky staple foodprovided at the one or two major meals servedduring the day. Studies carried out in various coun-tries show that this inability to eat enough of thelocal diet is a more important cause of nutritionaldeficiencies in children than the quality of the diet,poor though this may be. However, if there is alimit beyond which younger children cannot ingestthe staple foods, clearly some diversification of thediet is required, and the provision of such a dietis associated with an improvement in the family'slevel of income.
There is evidence, particularly from India, thatalso the pregnant and lactating women fare poorlyin comparison with the men. The extra requirementof the women is often only partially met, withresulting adverse effects on both the health of themother and the physical condition of the offspring.
Consideration should be given to the fact that in-fections interact with nutrition by decreasing the re-sistance of the host, by lowering his normal foodintake and by incrementing his nutrient loss. Whileit may not be possible to prevent excessive losses aslong as the infection persists, higher protein andenergy intake will be needed for convalescence andcatch-up growth. This is of particular importancein infants and preschool children subsisting on inad-equate or marginally adequate diets, as episodes ofacute infection can trigger full-blown marasmus orkwashiorkor.
The inescapable conclusion is that the poorer seg-ments of the population and within these seg-ments, the children in particular will bear thebrunt of an insufficient food supply. In fact, the
TABLE 3-8. ENERGY AND PROTEIN INTAKE OF SCHOOLCHILDRENIN HYDERABAD
Age group
Calories Protein
SOURCE: Diet atlas of India, National Institute of Nutrition,icma, Table xvi.
107
small size and poor physical development of adultsin many countries constitute, to a great extent, a livingrecord of hunger suffered when they were young.
Other indicators of the incidence of food deficiency
In assessing the prevalence of food deficiency inindividuals, rather than on the basis of populationgroups or country averages, various indicators maybe used, ranging from clinical studies through an-thropometric measurements to food intakes. Ac-curate data from all these sources are extremelylimited, but those available are summarized below.
Since vital statistics, particularly infant and childmortality rates, reflect the entire environmental back-ground, the contribution of poor nutrition is difficultto isolate. However, recent studies by wHo and thePan-American Health Organization have shown thatmore than one half of child deaths under the ageof five years in Latin America are directly or in-directly caused by nutritional deficiencies.
Clinical examination of children and anthropo-metric data, consisting mainly of weights and heights,although usually available only for small and oftenunrepresentative samples, point to a cautious estimatethat of the children less than five years of age in thedeveloping countries 10 million are suffering fromsevere malnutrition, 80 million from moderate mal-nutrition and 120 million from less obvious and moredifficult to define milder forms of malnutrition. Thusabout 50% of all young children in the developingworld may be inadequately nourished, which formany will lead inevitably to premature death.
Actual food intake as opposed to food availabilityhas been measured in some food consumption sur-veys. There are however very few surveys whichhave been taken on a big enough scale and with amethodology that allows it to be said that the resultsrepresent the country as a whole. The interpretationof such data is fraught with difficulties. Nevertheless,various methods based on different assumptions areavailable and may be useful in estimating the overalllevel of nutritional deficiencies in the total popula-tion. Two methods that purport to provide a con-servative or minimum estimate of the probable levelof undernutrition, if applied to the detailed foodintake data available for a few developing countries,give estimates of the percentage of the population
9 Both methods are based on a comparison of observed intakeswith theoretical requirements, assuming moderate activity. Onemethod compares the frequency distributions of intakes and re-quirements and matches as many requirements as possible withobserved intakes that would meet the requirement, thus mini-mizing the estimate of the incidence of undemutrition. Thesecond method recognizes that individual requirements varyaround the average and thus considers as undernourished onlythose with intakes below a critical limit that allows for suchnormal individual variation.
7-9 1 429 2 186 37.0 67.89-11 1 411 2 343 36.5 62.1
11-13 1 292 2 833 34.5 72.213-14 1 374 2 585 35.5 75.5
All age groups 1 376 2 485 35.9 69.4
Low Highincome income
Low Highincome inconic

likely to be undernourished that range from around10% in Trinidad and Tobago to nearly 20% inTunisia, Madagascar and Sri Lanka, and even higherin Burundi, for example. In the developed countriessuch as France and the United States food consump-tion surveys reveal that up to 6% of the populationmay be at the risk of some degree of malnourishment.Evidence from these few countries is scarcely suf-ficient to warrant any general conclusions about theextent of undernutrition in the world in terms ofnumbers of individuals rather than countries. So,although the present purpose is to comment on in-dividual incidence rather than overall national aver-ages, it is necessary to utilize such data as exist atthe national level for most countries. Such analysisis based on per caput food availabilities as givenin national food balance sheets and certain knownor observed features of food intake distribution byindividual or consumer unit. In making such anapproximation it seems appropriate to use a morerigid yardstick than the average requirement of amoderately active reference man.
The critical limit used for assessing the incidenceof food deficiency in this way is the maintenance costof energy, set at 1.5 times the basal metabolic rate.This is normally lower than the average requirementused in compiling Table 3-9, which allows formoderate activity." The maintenance cost of energyis used, rather than the requirement of a moderatelyactive reference man (although it may be said thatfor a population as a whole the concept of moderateactivity is reasonable), because the distribution ofthe individual variation in activity is unknown andassumptions that have been made regarding the dis-tribution are controversial. People classed as un-dernourished using a mean requirement for moderateactivity as a standard may in fact merely be followinga sedentary life out of choice rather than because oflimitations imposed by their energy intake. It istrue that the maintenance cost of energy is alsosubject to individual variation, but since the activityvariable has been removed, it may be more justifiableto say that such variation is truly a random residual.Such variation has been allowed for by setting a limit,which for Asia is of the order of 1 900 kilocaloriesper young adult male and rises to 2 000 kilocaloriesfor countries in which the body weights are on aver-age much higher.
Table 3-9 and Figure 3-3 show by regions the lowerestimate of the number below the selected limit. Anindividual with an intake below this limit will be
10 See the technical note on p. 149 for details. The basalmetabolic rate is a measure of the rate at which body substanceis oxidized in order to support the continued maintenance of life.The maintenance cost is higher than this and refers to the energyneeded to ensure constant body energy in nonfasting subjects atthe minimum level of activity needed for dressing, washing,eating, etc.
108
TABLE 3-9. ESTIMATED NUMBER AND PERCENTAGE OF PEOPLEWITH INSUFFICIENT PROTEIN/ENERGY SUPPLY BY REGIONS (1970)
E25% 434
Population
Thousandnzillion
Percentagebelowlowerlimit
Percent
World population 2 830
Numberbelowlowerlimit
Millions
g 3% 28 Developed regions1 070
11 30% av East01 1 020
a
2 13% 6 I 280 atin Amertc
25% 7 280 Africá
18% 301170 Near East
DEVELOPED REGIONS . . . . 1.07 3 28
DEVELOPING REGIONS 1.75 25 434
Latin America 0.28 13 36Far East 1.02 30 301Near East 0.17 18 30Africa 0.28 25 67
Total 2.83 16 462
1 Excluding Asian centrally planned econo 'es.
exposed to a high risk of an inevitable reduction inactivity, and adverse effect on growth (in the case of achild), or a continuous loss of body weight.
It may be said that within the limitations of thisapproach there is a very high probability that about462 million individuals have available food in aquantity insufficient to meet their needs. The truefigure may indeed be very much higher than this, asthe criteria used aim to allow only a small chanceof classifying a person as undernourished if in facthis intake is above a conservatively low limit. Thesefigures exclude the Asian centrally planned econ-omies, for which comparable data are lacking. Itmay be assumed that food is somewhat better dis-
FIGURE 3-3. ESTIMATED NUMBER OF PEOPLE WITH INSUF-FICIENT PROTEIN/ENERGY SUPPLY, WORLD AND REGIONS, 1970
POPULATION IN MILLIONS
1 760 Developing regions
500 500 1000 1500 2000 2500 3000
16% 462

tributed in these countries and the percentage ofundernourished may be less than in the rest of Asia.Countries where the problem of malnutrition maywell be particularly acute are Angola, Somalia, Tan-zania and some of the Sahelian countries in Africa;Bangladesh, India, Indonesia and the Philippines inAsia; Afghanistan, Saudi Arabia and the two Yemensin the Near East; and Bolivia, El Salvador and Haitiin Latin America.
The figures in Table 3-9 reflect an average year,rather than the situation in times of drought or othercalamities, as occurred recently in the Sahelian zoneof Africa. Data on people in drought-affected areasare scarce, but some data for states in India affectedby drought in the mid-1960s indicate that the dailyintake of food may fall in the short term to levelsthat are well below those necessary to maintain life.
The above review of the indicators of the incidenceof food deficiency reveals the difficulty in estimatingthe magnitude of the problem with any precision.Nevertheless, even if the picture is shifting andblurred, a pattern emerges. Each strand of evidence,such as the clinical or the derived estimates in Ta-ble 3-9, is far from incontrovertible, but together theypoint to a conclusion that the problem of food defi-ciency is extremely serious: one half of child deathsare in some way attributable to malnutrition; thereare at least 200 million living child sufferers; and thepercentage of the population in the developing worldsubject to food deficiencies ranges to 30%, or evenhigher in some areas, amounting to over 400 millionpeople -- probably many more. All these deductionsare consistent and forbidding.
The decline in breast-feeding
Breast-feeding has recently been declining in manydeveloping countries. This trend has been recognizedas a growing threat to the nutritional status andhealth of the infant by national governments andinternational agencies. Breast-feeding also has animportant influence on the spacing of children andtherefore on family size. The United Nations WorldFood Conference, held in November 1974, empha-sized the importance of breast-feeding and recom-mended that governments take action to encouragewomen to breast-feed their children.
The milk of each mammalian species has evolvedso as to reflect in its composition the nutrient de-mands of that species during the critical times whengrowth and development are proceeding at maximumrates. Likewise, human milk has been shown to beideally suited, both in its composition and the equi-librium of its different components, to the needs ofthe infant during the first five or six months of life.
Early weaning under conditions that prevail in the
109
developing countries can be singled out as the maincause of infant malnutrition. Furthermore, sincesevere infant malnutrition of the type associatedwith early weaning may lead to permanent physicaland mental damage, the poorer countries may con-sequently have to bear the added economic burdenof many permanently disabled persons.
The shift from breast-feeding up to one year ofage to artificial feeding from birth that has occurredin the industrialized nations was a gradual phenom-enon that probably started a century ago. In thesenations this shift has been accompanied by a rise inthe standards of living, of income and of literacy andgeneral education, by control of infectious diseases,by the innovation of safe water supplies, by im-provements in refuse and excreta disposal systems,environmental sanitation and availability of medicalservices, and other related developments. Further-more, a revolution in the dairy industry in the lastseventy-five years has provided bacteriologically safeand nutritionally acceptable products to replacebreast-feeding.
The situation in the developing nations is quitedifferent. For the economically privileged minoritiesthere is little problem in adopting the westernizedpattern of early weaning. But for the impoverishedmasses, who live in an environment that presentsconstant infectious hazards (flies, garbage, excreta,animals, dirty hands, crowded living, lack of cleanwater, absence of immunizations and medical ser-vices, etc.), breast-feeding can mean the differencebetween life and death for the child.
Although the basic physiological principles thatgovern milk secretion are fairly well understood, thecause of the decline of breast-feeding now being ex-perienced in urban areas of developing countries isnot clear. No doubt the factors responsible for thedecline are complex and vary between countries,areas, cultures, income groups and even individuals.The effects of indiscriminate and often misleadingcommercial promotion which presents a picture ofhealthy babies raised on a proprietary formula shouldnot be underestimated. Little does the mother knowthat the success of these preparations depends on ahygienic environment, an adequate income to pur-chase r,-.Tularly such products in the needed amountsand a sufficient education to understand the tech-nique of safe bottle-feeding.
Moreover, breast-feeding is now declining also inrural areas. For example, in Teheran and Santiagoonly about one third of the infants are exclusivelybreast-fed at three months of age. While in Iran(1969) this urban influence had not yet reached therural areas, where 90% of the infants were beingexclusively breast-fed at three months of age, in aChilean rural area (1966) the percentage was 30%,or the same as in Santiago.
Certainly, much more research is needed to clarifywhat factors are responsible for the decline of breast-feeding and how they operate if programmes aregoing to be set up to try and reverse the presenttrend.
Other nutritional deficiencies
Considerations of nutritional deficiencies, up to thispoint, have been mainly restricted to protein andenergy malnutrition. There are however nutritionalconditions caused by the lack of specific nutrients.Some of these malnutritions have become less im-portant as a public health problem because of thereasonably precise available knowledge of theirepidemiology and the specific measures which havebeen taken to eradicate them. This applies, forexample, to pellagra, beri-beri and scurvy. Of theremaining ones, vitamin A deficiency, iron- andfolate-deficiency anaemias and endemic goitre arestill widely prevalent.
Vitamin A deficiency is a major cause of blind-ness in many countries, such as India, Indonesia,Bangladesh, the Philippines, northeast Brazil and ElSalvador. Moreover, it is a major problem in viewof its socioeconomic consequences. It is estimatedthat in the Far East alone more than 100 000 childrengo blind each year owing to vitamin A deficiency.
Iron- and folate-deficiency anaemias, widely prev-alent in both developed and developing countries,cause ill health and result in a decreased abilityto lead an active life. In Latin American countriesbetween 5 and 15% of the men and between 10 and35% of the women have been found to have signifi-cant anaemia, and in some communities more thanone half of the children were also in this category.In most populations pregnant women and infantsfrom 6 to 18 months of age appear to be the mostvulnerable groups. Iron-deficiency anaemia is alsolinked with infections, principally hookworm andbilharzia, because the iron losses caused by theseinfections cannot be met by an adequate supplyof this element in the food intake.
A comprehensive world review of endemic goitrecarried out some fifteen years ago revealed that therewere 200 million people suffering from this disease.The problem is compounded by the endemic cre-tinism that usually accompanies it. In recent yearsconsiderable progress has been made in the controlof this disease in some countries, but in many areascases of endemic goitre and associated cretinism arestill found in substantial numbers.
Causes of inadequate nutrition
The causes of inadequate nutrition are many andclosely interrelated, including ecological, sanitary and
110
cultural constraints, but the principal cause is pov-erty. This, in turn, results from socioeconomic de-velopment patterns which in most of the poorer coun-tries have been characterized by a high degree ofconcentration of power, wealth and incomes in thehands of relatively small elites of national or foreignindividuals or groups.
In the rural areas, land and water, capital, technicalknowledge, credit and institutional assistance are mostunevenly distributed. The majority of the rural pop-ulation is either landless or has to make a living fromthe exploitation of meagre land and water resources.Despite the fact that annually millions of rural in-habitants migrate to the urban areas, unemploymentand underemployment are usually very high and ruralwages generally extremely low. In some instancesthe irregular employment profile gives rise to acuteunemployment during the slack seasons. In otherinstances production patterns, geared to satisfying thedemands of external markets or of the smaller middle-and high-income national groups, do not favour di-versification and proper utilization of the availableindigenous resources. Land tenure and productionstructures therefore constitute one of the basic reasonsfor rural poverty and malnutrition. In addition, thereare all the inefficiencies that affect the agriculturalproducer, particularly the small farmer. Inadequatestorage, handling and transportation facilities; theprevalence of monopsonistic practices, which leavesmall producers in the hands of relatively few whole-sale buyers; the lack of adequate access to marketsand market information all are factors that tendto diminish the small farmers' real incomes and per-petuate their state of poverty.
In the urban areas few of the millions of migrantsfrom the countryside can find remunerative, produc-tive jobs, and the remainder join the already vastarmy of unemployed. Available evidence shows aclose relationship between inadequate employmentand energy deficiencies. The unemployed or un-deremployed are usually at the bottom of the socio-economic ladder, having the lowest incomes, andhence eat least and show the lowest nutritional levels.Unfortunately, many of the technologies currentlyused in industrial development have been borrowedfrom the developed countries and do not generateas much employment as could the more intermediatetechnologies. Furthermore, the urban poor sufferfrom the shortcomings of the food distribution sys-tem: the superabundance of middlemen, themselvesproducts of the lack of alternative employment op-portunities; the unjustified high cost of basic food-stuffs; and the absence of socially oriented food-pricepolicies.
The governments of many developing countrieshave in recent years initiated programnies for ex-panding the volume of productive employment. Many

also have specific nutritional programmes orientedtoward the needs of vulnerable groups. Externalassistance has been given through food aid and othertransfers. The need for intensification of these effortswill become more acute in the years ahead as popu-lation continues to expand rapidly and the cities growever larger. Action to mitigate the maldistributionof income would also help. However, it should beclearly understood that an increase in food avail-ability cannot be expected to decrease the prevalenceof severe protein/energy malnutrition unless there isa parallel improvement in the environment, particu-larly the sanitary conditions, in which the poor (espe-cially the children) live.
Whereas the previous discussion has dealt mainlywith the assessment of trends, levels and adequacyof food intakes from the nutritional point of view,here the main factors which determine the demandfor food are to be considered. The importance ofsuch an analysis derives from the need to anticipatechanges in future patterns of food demand whichmay result from broader economic and social changesbrought about through economic growth and otherdevelopment policies.
Patterns of food expenditure
It is widely accepted that patterns of food con-sumption are influenced not only by the income,size and composition of the family but also by theoccupational status and level of education of theadults in the family, by the characteristics (such asrural versus urban, racial, religious) of populationgroups and many other social and psychological fac-tors. Ecology is also an important determinant oflevels and patterns of food consumption, particularlyin subsistence economies where inadequate trade andmarketing structures necessitate greater reliance onlocally available foodstuffs.
Household consumption, expenditure or budget sur-veys are the main source of information. These sur-veys differ greatly in scope and coverage: somemerely give estimates of family expenditure for foodand other items within a given period, while othersgive information on the quantities of different itemsconsumed; in some studies, information on the quan-tities of food grown by the family is given separatelyfrom the amounts purchased in the market. Fur-thermore, many studies are restricted to srnall geo-
111
Progressive elimination of poverty and improve-ment in the physical and cultural environment, withspecial efforts to educate mothers in correct weaningmethods and child-feeding practices, promotion ofbreast-feeding and development of low-cost home-made formulas, would therefore constitute the majorstep toward elimination of protein/energy malnutri-tion deficiencies. To this end, it would be necessaryto break the vicious circle of unemployment, lowfood production, low productivity, and low incomewhich strangles such a large part of mankind. This,in turn, could entail very deep transformations in thepresent socioeconomic structures.
The demand for food
graphical areas or to selected socioeconomic groupswithin individual countries. Thus, although the dataon family expenditure are often classified by a widerange of socioeconomic variables such as urbanand rural income groups, family size, occupational,cultural and ethnic characteristics the lack ofuniformity in definition and treatment from onesurvey to another should be kept in mind, partic-ularly in making intercountry comparisons. How-ever, despite the limitations, from the evidence abroadly consistent picture can be drawn of differencesin patterns of food consumption between populationgroups, both within and among countries.
Food in family expenditure
The proportion of total family expen.diture devotedto food generally decreases as family income and ex-penditure increase. One indication of this tendency,first propounded over a century ago in England, isshown in Table 3-10, which summarizes recentfamily expenditure surveys in selected developed anddeveloping countries. Thus, for example, in Tan-zania and India, where GNP per caput is aboutUS$100 (at 1970 market prices), at least half of totalper caput expenditure is on the average allocated tofood, whereas in Sweden, with a GNP per caput ofmore than US$4 000, food accounts for only abouta quarter of total per caput expenditure. This tablealso shows that typically the percentage expenditureon food is slightly lower in urban than in ruralareas.
Also within these countries the outlays of individ-ual families tend to account for a smaller proportionof their total expenditure as it increases. In In-

TABLE 3-10. - THE WIPORTANCE OF OUTLAYS FOR FOOD IN TOTALPER CAP UT EXPENDITURE IN SELECTED COUNTRIES
1 Industrial and agrarian workers. - 2 White-collar workersand intellectuals. - 3 Self-employed. - 4 Nonmanual workers. -5 Farmers. - 6 Manual and agricultural workers.
donesia the proportion is around three quarters forthe lowest-income families and gradually declines toabout two thirds on the average for the highest-in-come stratum indicated in the survey. Similarly, inSweden, the percentage drops, from one third for thepoorest families to just under one quarter for therichest.
Although increases in wealth generally lead throughtime to a decline in the proportion of total expen-diture devoted to food, nevertheless absolute percaput expenditure for food increases. Higher-incomefamilies can satisfy basic desires for more food andtheir patterns of expenditure shift, in particular, to-ward more expensive, varied and protein-rich foods.Moreover, an increasing proportion of this expen-diture is attributable to marketing and servicing costsassociated with more highly processed foods.
An example of how expenditure patterns -varyfrom one income group to another is shown inTables 3-11(a) and 3-11(b), and other examplesare given in Annex table 3-D. Close to 70% of
112
TABLE 3-1(a). - FOOD EXPENDITURE PATTERNS AND FAMILY INCOME.IN THE UNITED KINGDOM, 1971
.... Percent of total loor! expenditure .
SOURCE: Ministry of Agriculture, Fisheries and Food, Householdfood consumption and expenditure: 1970 and 1971,Annual Report of the National Food Survey Committee,1151so, London, 1973.
food outlays are for cereals, starchy roots, pulsesand nuts among the Indonesian low-income families,as compared with 34% among the highest incomegroups. For the United Kingdom, on the other hand,these commodities constitute only about 21% of foodexpenditure in the lowest-income classes and 15%in the highest. The opposite is true for high-qualityfoods, such as livestock products. In Indonesiathe proportion of food expenditure for these foodsranges from 5% among the poor to 25% in the high-income groups, while in the United Kingdom thesehigh-quality foods absorb about 50% of the foodexpenditure of both low- and high-income families.Richer families and countries likewise spend a higherproportion of their food outlays on vegetables andfruits than do poorer families and countries.
For comparative purposes it is convenient to ex-press the degree of responsiveness of consumer de-mand to changes in income or expenditure in termsof income or expenditure elasticities, defined as theratio of the percentage change in food expenditure orconsumption to the percentage change in income orexpenditure." In practical terms, as an elasticity
11 Mathematically, income elasticity may be expressed asc1C Y dC E
X - and expenditure elasticity as - x -dY C dE C
where C is consumption of or expenditure on an individual corn-
GNP
Percaput Year
Outlays for foodas percentage of total
expendi lure
Nation-(US$) Urban Rural wide
)E. VELO Fl NG
COUNTRIES
ndonesia . . . . 80 1969 70.6_esotho . . . 90 1968 51.8Fanzania . . . . 100 1969 26.8 53.6 50.0ndia 110 1964/65 60.7 70.5 66.1
Kenya (Mombasa) 150 38.93ierra Leone
(W. Province) . 190 1967 53.6Corea, Rep. of . 250 1971 41.0 47.4:Thana (eastern) . 310 1967/68 53.53uatemala . . . 360 1966 58.2'ran 380 1971 45.7,rarnbia 400 1966/68 50-0
Libyan Arab. Rep. 1 770 1969 37.0
DEVELOPED
COUNTRIES
Portugal . . . . 660 1961/68 48.7Hungary . . 1 660 1971 1 45.9
3 39.2Japan 1 920 1971 33.3Austria 2 010 1964 34.0Netherlands . . . 2 430 1963/64 3 18.2
4 19.96 27.56 28.3
Switzerland . . . 3 320 1972 21.9Sweden 4 040 1969 26.3
14.79 15.63 15.93 14.57 12.86 11.57
2.43 2.31 2.60 2.40 1.77 1.542.59 2.06 2.79 2.47 2.25 1.996.83 5.90 6.71 6.98 7.23 7.187.93 7.07 7.03 8.29 10.12 11.40
30.38 29.57 30.48 30.21 29.92 31.743.83 4.14 3.79 3.71 3.74 3.774.20 4.60 4.05 4.02 4.16 4.41
14.22 14.18 13.83 14.47 15.03 14.455.64 6.22 5.71 5.66 5.42 4.947.16 7.32 7.08 7.22 7.50 7.01
100 100 100 100 100 100
Weekly incomeof head ofhousehold
Aver-age
Under£14 £14-21 £21-45 £45-63
Over£63
Number ofhouseholds
7 444total
1 620 2 636 2 371 596 221
Average sizeof household 3.04 1.81 3.33 3.45 3.43 3.26
Average weeklyincome of head
of household£27.7 £10 £20.5 £36 £57 £75
Cereals . .
Starches andstarchy roots .
Sugar . . .
Vegetables .
FruitMeatEggsFishMilk and dairy
products .
Fats and oilsOthers . . . .
TOTAL . .

TABLE 3-11(b). - FOOD EXPENDITURE PATTERNS IN RELATION TO TOTAL FAMILY EXPENDITURE IN INDONESIA, 1969
SOURCE: National Bureau of Statistics, National Social Economic SUIVey, (October-December 1969), Djakarta, 1972.
value approaches zero, demand becomes less respon-sive to further increases in income.
Income and expenditure elasticities have been esti-mated for many countries and food commodities 12and are generally found to decrease as income andconsumption grow, although the magnitude and rateof decline vary from one food group to another. Theexpenditure elasticity of demand for food as a wholeis generally between 0.5 and 1 for the poorer coun-tries and declines to a relatively low value in thericher countries.
Turning to individual commodities and groups ofcommodities, the expenditure elasticity for cerealsin developing countries is typically in the range of0.3 to 0.5, whereas it is generally less than 0.2 in thericher countries. Again the general finding applies- namely that at low levels of income the elasticityvalues for cereals are relatively high, while at highlevels of income they are low. Indeed, at very highlevels of per caput income or total expenditure, theelasticity for cereals might even be negative, indi-cating that with further increases in income the de-mand for cereals for direct human consumptionwould decline. However, while demand for additional
modity or group of commodities, Y is income and E is total ex-penditure. Note that income elasticities are typically lower thanexpenditure elasticities and that an elasticity is generally lowerwhen evaluated at the farm gate than at the retail level. For anindividual commodity the elasticity is generally higher when Cis measured as expenditure than when C is measured as quantitydemand, since richer consumers tend to buy more highly pricedforms of the commodity than do poor consuiners.
12 See FAO, Income elasticities of demand for agricultural prod-ucts, Projections Research Working I'aper No. 1, p. 194, Rome,1972.
quantities of cereals may be relatively unresponsiveto increases in income except at lower income levels,per caput expenditure on cereals may neverthelesscontinue to rise as consumers switch from lesspreferred cereals (e.g., millets) to rice and wheat andfrom relatively unprocessed cereals to more highlypriced convenience foods based on cereals.
Generally, the expenditure elasticity for starchyroots and tubers is low compared with cereals evenin developing countries, and there is a tendency forcereals to replace them in diets as incomes increase.Conversely, expenditure elasticities for quality foods(fats and oils, fruits and vegetables, dairy products,rneat, etc.) are higher than those for cereals. Forfats and oils the expenditure elasticity is somewhatlower than 0.5 in developed countries and a littlehigher in most developing countries. For livestockproducts the expenditure elasticities for developedcountries typically range up to 0.50, or even higherin some cases, whereas for most developing coun-tries the expenditure elasticity for this group is greaterthan unity."
In summary, it is clear that with increases in in-come the demand for various foods increases at verydifferent rates. The implication of this is that evenin those countries where the aggregate expenditureelasticity for food does not fall substantially, exceptover a long period of time, there occur changes inthe structure of demand which, in turn, imply thatstructural changes in patterns of production must be
13 Ibid, p. 93-194 for detailed comparison.
NN. Rps percaput per
monthN,N
N.Average NN
Unclei300
301-500
501-750
751-1 000
1 001-1 250
1 251-1 500
1 501-2 000
2001-2 500
2 501-3 000
Over3 000
Average monthlyexpenditure 1 416.23 241.77 425.64 633.61 875.64 1127.70 1 388.23 1 740.71 2235.21 2735.16 4486.14
Percentage ofhouseholds 100 1.22 6.44 15.85 18.60 14.85 11.36 13.99 7.67 3.82 6.20
Perce it of total food exp nditure
Cereals 43.83 45.06 54.43 56.64 53.97 52.03 47.09 43.85 39.27 36.12 28.05Starches and starchy
roots 4.68 20.43 12.90 9.33 6.81 4.84 4.38 3.92 3.28 2.89 2.54Pulses and nuts . . 3.10 2.40 2.24 2.60 2.86 3.01 3.19 3.04 3.36 2.96 3.53Vegetables and fruit 8.58 11.08 8.78 7.64 7.63 7.89 8.12 8.76 9.24 9.06 9.54Meat 5.23 0.04 0.82 1.39 2.04 2.56 2.71 5.11 6.78 8.29 10.29Fish 8.64 4.35 4.37 5.37 6.86 7.65 8.34 9.21 9.65 10.34 10.75Milk and dairy prod-
ucts 1.76 0.11 0.32 0.40 0.66 2.02 1.35 1.67 2.25 2.51 3.65Others 24.18 16.53 16.14 16.63 19.17 20.00 24.82 24.44 26.17 27.83 31.65
TOTAL 100 100 100 100 100 100 100 100 100 100 100

viewed as an integral component of economic de-velopment.
Moreover, since income groups have different ex-penditure elasticities for the various foodstuffs, achange in the pattern of income distribution alsoinfluences aggregate demand. For instance, domesticincome redistribution in favour of poor people wouldbe expected to result in an increase in demand formost foodstuffs as their income elasticity is usuallyhigher than that of the rich. To illustrate this, arecent study of Latin American countries showedthat a redistribution of income could increase caloriedemand by nearly 10% and protein demand by 12%,although clearly the extent of structural changes indemand would depend on the form and intensity ofany redistribution."
Other factors influencing long-term food demand
In addition to household income, size and com-position of the family are important variables af-fecting food consumption behaviour, although inpractice it is often difficult to determine from budgetstudies the separate influences of these factors. More-over, even when this is possible the analysis becomescomplex, since variations in family composition byage and sex require the conversion of householdmembers into consumption units by using scaleswhich differ from one commodity to another."
The conclusion drawn from a number of budgetsurveys is that increases in family size are accom-panied by less than proportionate increases in fooddemand. This may be due, in addition to thegreater number of children in the larger families,to the effect of economies of scale. For example, inJapan it has been estimated that each 1% increasein size of household leads to an increase in theexpenditure for food of only 0.4% and for riceof 0.9%. Similarly, in a study of working-classbudgets in India, the elasticity of demand for cerealswith respect to family size was 0.7, as compared with0.9 for the middle class."
Studies on food consumption also suggest that theexpenditure elasticities for food of families in ruralareas differ from those of urban households, andthat consumption patterns differ from one occupa-
" FAO, Perspective study of agricultural developnzent for SouthAmerica (provisional version), Vol. I, p. 74-75, Rome, 1972; seealso The impact on demand of changes in income distribution,Monthly Bulletin of Agricultural Economics and Statistics (FAO),21(3), 1972.
15 S.J. Prais and H.S. Mouthakker, The analysis of familybudgets, Cambridge University Press, 1971.
le F.G. Hay and R.P. Sinha, Analysis of food expenditurepatterns of industrial workers and their families in developingcountries, Journal of Development Studies, 8(4), 1972; R.P. Sinha,Some determinants of the demand for food, Farnz Economist,Vol. 11, 1968.
114
tional group to another. In urban areas, for exam-ple, elasticities tend to be lower for cereals and oftena little higher for quality food in comparison withrural areas (Table 3-12).
TABLE 3-12. -- EXPENDITURE ELASTICITY FOR CEREALS IN RURALANO URBAN ARRAS IN SELECTED COUNTRIES
SOTJRCE: FAO, Income elasticity of demand for agrciultural prod-ucts, Projections Research Working Paper No. 1, p. 99,Rome, 1972.
Such differentials occur partly because rural in-comes are generally lower than urban incomes, butthey may also be due in part to differences in en-vironment, food habits and range of available foodsbetween urban and rural areas. However, the prac-tice of classifying the population into urban andrural groups for survey purposes is not entirelysatisfactory for studying the influence of urbanizationon food consumption, because when rapid urbangrowth is attributable to migration from the coun-tryside, the migrants may retain their cu.stomary foodhabits for some time even if their incomes and oc-cupations change as a consequence of migration.
However, with growing urbanization it is expectedthat the demand for meat, fish, fats and oils andseveral other processed products will increase at amuch faster rate than the demand for foodgrains.This is of crucial importance in the formulation ofplanning policies for the agricultural sectors of manydeveloping countries undergoing a rapid process ofurbanization. Perspective studies of the long-termevolution of consumption patterns by sector are thusan important element in agricultural developmentplanning."
There is also some evidence that the pattern offood consumption is affected by size of town, as isillustrated in Table 3-13. For foodgrains, edibleoils, and total food the elasticities are much thesame for towns and cities of various sizes, but theelasticities for milk and milk products, meat, fish,eggs and sugar are higher in the larger towns andcities. It should be pointed out however that someof these differences may result from differences inprice levels and relativities in smaller and biggertowns, although, again, such influences cannot pos-
17 The impact of urbanization on food demand, Monthly Bul-letin of Agricultural Economics and Statistics (FAO), 22(9), 1973
Sudan (1967/68) 0.91 0.63India (1963/64) 0.50 0.18Hungary (1966) 0.38 0.03Philippines (1965) 0.44 0.37
Rural Urban

TABLE 3-13. - EXPENDITURE ELASTICITIES FOR FOOD ITE S FORURI3AN AREAS OF INDIA
SOURCE: Estimates based on relevant statistics from the NationalSocial Survey, 8th Round.
sibly be discerned in surveys that focus entirely onexpenditure patterns.
Household consumption surveys often indicate thatfood consumption behaviour is influenced by occupa-tion and professional status, even though the differ-ences between different groups may be masked byincome differentials.
In part, such variations in diets reflect differencesin energy needs: a mineworker typically needs moreenergy than a white-collar worker, and his diet istherefore likely to include a greater proportion ofcereals or other starchy foods. But at the same time,variations in level of education associated in somecases with occupation - may through differencesin knowledge of the need for better nutrition partlyexplain dietary patterns.
Within a given socioeconomic grouping, as well,differences in economic opportunities and conse-quently in food consumption behaviour may occur.Table 3-14 summarizes the results of a number ofstudies of the food-consumption behaviour of thelow-income stratum in India.
TABLE 3-14. - ELASTICITIES OF EXPENDITURE ON FOOD FOR LOW-
SOURCE: Estimates based on relevant statistics from the NationalSocial Survey, I lth Round, using the first four incomegroups from each round. 18 See FAO, Income elasticities of demand for agricultural prod-
1 F.G. Hay and R.P. Sinha, op. cit. ucts, Part II and selected bibliography, Rome, 1972.
115
The estimated expenditure elasticities for cerealsand pulses are substantially higher for agriculturallabourers than for other groups, suggesting that forthem both cereals and pulses are still luxuries. Forthe rest of the rural working class, comprising work-ers in Community Development Project areas, wherethere are relatively more regular opportunities forwork, the expenditure elasticity is somewhat lower,but not as low as for the urban working class, whichhas a higher income as well as more regular em-ployment.
Low-income groups consist of both rural and ur-ban categories, not all of which have adequate em-ployment opportunities, so their elasticity for allfoods is higher than those of both the urban workingclass and the rural working class in CommunityDevelopment Project areas, although lower than thatof agricultural labourers. It thereforz seems thatexpenditure elasticity is related to regularity of em-ployment opportunities as well as to income levels.
To some extent, hovvever, the observed contrastsin food expenditure patterns between various socio-economic groups are also due to locational andmarketing factors. For example, the availability ofindividual foodstuffs and their relative prices maydiffer in rural and urban areas due to imperfectionsin marketing and distribution systems arising frominadequate storage, processing and transportationfacilities.
In the wider context, as well, prices usually playa key role in the allocation of family expenditurebetween food and nonfood items and between in-dividual foodstuffs. In particular, a change in theprice of one item not only affects dernand by makingit cheaper or more expensive relative to other com-modities, but may also affect demand for all com-modities through the impact of the price change onthe overall purchasing power of family income.
The measurement (usually at the national level)of the responsiveness of demand to price changesnecessitates consumption and price data which, incontrast with budget surveys, span a lengthy periodof time, particularly if the data series are availableonly on an annual basis. Most of the empiricalstudies pertain to high-income countries."
As a generalization, demand for commodities withlow income elasticities, such as cereals, is unrespon-siv-e to changes in their prices compared with thosecommodities, such as meats, which typically havehigh income elasticities. However, the degree ofdemand responsiveness for an individual product orgroup of products also depends on whether otheritems are considered to be close substitutes by con-
Foodgrains . .
Milk and milkproducts . .
Edible oil . .
Meat, fish andeggs . . . .
Sugar . . . .
Other foods . .
ALL FOOD .
Townswithpopu-lationsbelow15 000
Townswithpopu-lations
between15 000and
50 000
Townswithpopu-lations
between50 000and
100 000
Citieswithpopu-lationsover
100 000
Calco ttaBombay'
Delhi '
andMadras
0.20
0.830.68
0.780.560.850.69
0.28
1.110.81
1.030.740.900.73
0.30
1.210.71
0.940.740.750.75
0.29
1.120.60
1.000.820.830.75
0.29
1.280.72
1.150.820.810.80
Cereals . . 1.09 0.61 0.61 0.24Pulses ... 1.18 0.78 0.52
ALL FOOD 1.10 0.76 0.85 0.66
INCOME GROUPS IN INDIA I
Agriculturallabourers
Ruralworkingclass in
CommunityDevelopment
areas
Rural andurbanlow-
incomegroups
Urbanworking
class

sumers. For example, recent estimates for the UnitedKingdom 10 indicate that a 1% increase (decrease) inthe price of all carcass meat would lead to a decrease(increase) in demand for this food group of only0.7%, assuming that all other prices were to remainunchanged. In contrast, a 1% increase (decrease)only in the price of pork, for which there are closersubstitutes in beef and veal, mutton and lamb andpoultry meat, would lead to a rather greater decrease(increase) of 1.24% in demand, again assuming nochange in other prices. Finally, although ahnostall of the empirical studies at the national level in-dicate that a change in the price of a commodityleads to a change in the opposite direction in thevolume of its demand, such findings do not neces-sarily apply to all population groups. In particular,very low-income groups who are forced by povertyto spend a high proportion of their total income onfood and whose diet is largely comprised of one or
The food problem of the future
The following analysis concerns trends in fooddemand and production up to the middle or end ofthe 1980s. First, food demand is projected, and thensome possible future production trends are examined.The major issues suggested by a comparison of levelsand patterns of demand and supply in the next decadeare also identified, with particular reference to de-veloping countries. While the analysis is largelyconcerned with trends, the implications of alternativeassumptions about underlying factors are examinedas well. Thus the sensitivity of food demand todifferent growth rates of income and populationis noted, as are the consequences of fluctuations fromtrends in food production. At the same time, adistinction is made between food demand, generatedby population and income growth, and supplementaryfood needs for improving the nutritional status ofthat part of the world's population which, owing tochronic poverty and unemployment, would not shareto any marked extent in the benefits of economicgrowth.
Food demand projections
As will be explained in the methodological note(p. 127), the principal components of food demandprojections are assumptions concerning population
10 Ministry of Agriculture, Fisheries and Food, Householdfood consumption and expenditure: 1972, Annual Report of theNational Food Survey Committee, umso, London, 1974.
116
two staple foodstuffs may increase their demandfor those staples if their prices rise and at the sametime forego consumption of more expensive sup-plementary food even though the prices of theseremain unchanged.
In conclusion, there is clearly evidence that alarge number of factors besides real income con-tribute to an explanation of changes in long-termpatterns of food demand. However, the evidenceis limited to specific situations, and much still needsto be done to improve the coverage, the contentand the uniformity of consumption and expendituresurveys and of price statistics. Until this is achieveda confident assessment cannot be made of the world-wide impact of many of these factors. Consequently,the analysis of future demand for food at the globallevel is inevitably confined to consideration of thepossible impact of a rather limited selection of themore important factors.
growth and growth of gross domestic product (GDP);the United Nations "medium" population growthvariant and the "trend" growth in GDP have been usedunless otherwise stated. On this basis, an annualgrowth rate of 1.5% in the food demand is projectedfor developed countries between 1970 and 1985; inother words, their volume of demand would be 26%higher in 1985 than in 1970 (see Table 3-15). Thesituation in the developing countries will be totallydifferent. In this group the market economy coun-tries' food demand is projected for an annual growthrate of 3.6%, which would mean over fifteen years anincrease of some 70% in total food volume. (Thegrowth rates for the Asian centrally planned econ-omies would be lower because of their lower pop-ulation expansion.) This contrast between the growthrates in food demand of developed and developingcountries is the key to an understanding of the per-sisting food problem. The factor of population in-crease, it must be emphasized, accounts for 0.9%of the demand growth rate in the developed coun-tries and 2.7% in the developing market economycountries, as is indicated in Table 3-15 by the "zero"income growth rate of consumption.
The effect on food demand of assuming a higherrate of income growth in the developing countriesis also shown in Table 3-15. For the developingmarket economies this would on the average raisethe annual growth of food demand from 3.6 to4%; however, even with this alternative assumption,population growth remains the dominant factor indetermining future food demand.
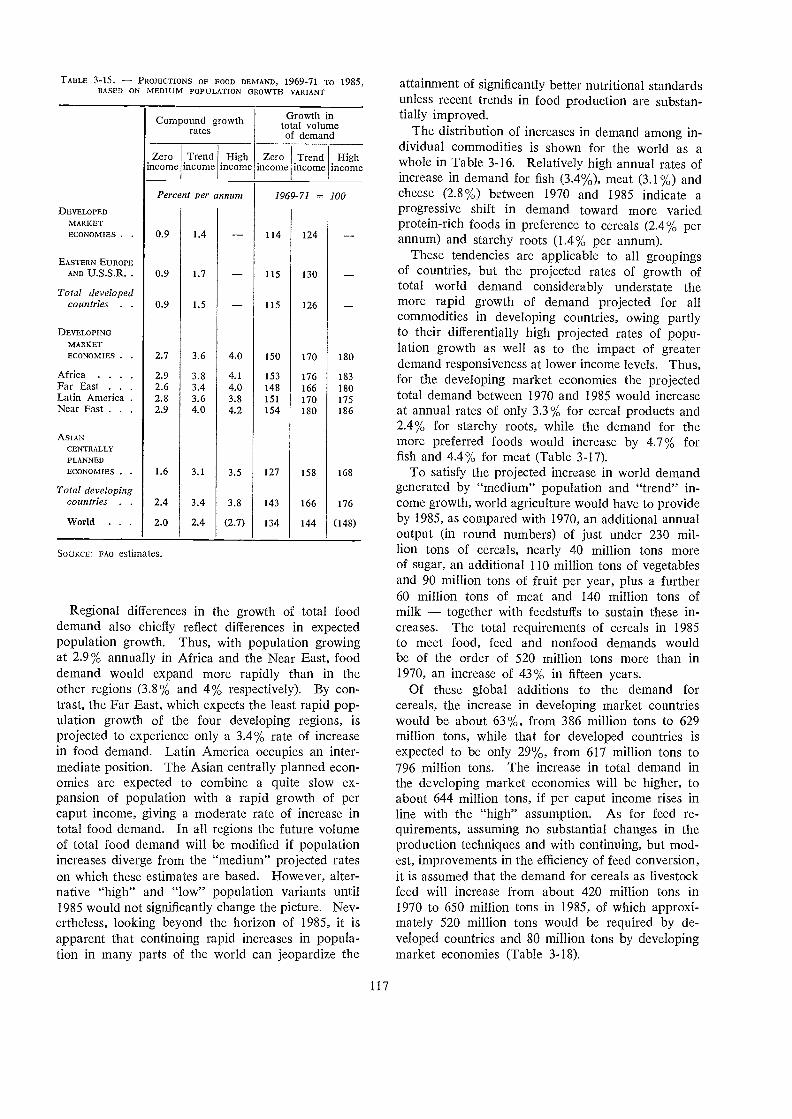
TABLE 3-15. - PROJECTIONS OF FOOD DEMAND, 1969-71 TO 1985,BASED ON MEDIUM POPULATION GROWTH VARIANT
SOURCE: FAO estimates.
Regional differences in the growth of total fooddemand also chiefly reflect differences in expectedpopulation growth. Thus, with population growingat 2.9% annually in Africa and the Near East, fooddemand would expand more rapidly than in theother regions (3.8% and 4% respectively). By con-trast, the Far East, which expects the least rapid pop-ulation growth of the four developing regions, isprojected to experience only a 3.4% rate of increasein food demand. Latin America occupies an inter-mediate position. The Asian centrally planned econ-omies are expected to combine a quite slow ex-pansion of population with a rapid growth of percaput income, giving a moderate rate of increase intotal food demand. In all regions the future volumeof total food demand will be modified if populationincreases diverge from the "medium" projected rateson which these estimates are based. However, alter-native "high" and "low" population variants until1985 would not significantly change the picture. Nev-ertheless, looking beyond the horizon of 1985, it isapparent that continuing rapid increases in popula-tion in many parts of the world can jeopardize the
Compound growthrates
Growth intotal volumeof demand
117
attainment of significantly better nutritional standardsunless recent trends in food production are substan-tially improved.
The distribution of increases in demand among in-dividual commodities is shown for the world as awhole in Table 3-16. Relatively high annual rates ofincrease in demand for fish (3.4%), meat (3.1%) andcheese (2.8%) between 1970 and 1985 indicate aprogressive shift in demand toward more variedprotein-rich foods in preference to cereals (2.4% perannum) and starchy roots (1.4% per annum).
These tendencies are applicable to all groupingsof countries, but the projected rates of growth oftotal world demand considerably understate themore rapid growth of demand projected for allcommodities in developing countries, owing partlyto their differentially high projected rates of popu-lation growth as well as to the impact of greaterdemand responsiveness at lower income levels. Thus,for the developing market economies the projectedtotal demand between 1970 and 1985 would increaseat annual rates of only 3.3% for cereal products and2.4% for starchy roots, while the demand for themore preferred foods would increase by 4.7% forfish and 4.4% for meat (Table 3-17).
To satisfy the projected increase in world demandgenerated by "medium" population and "trend" in-come growth, world agriculture would have to provideby 1985, as compared with 1970, an additional annualoutput (in round numbers) of just under 230 mil-lion tons of cereals, nearly 40 million tons moreof sugar, an additional 110 million tons of vegetablesand 90 million tons of fruit per year, plus a further60 million tons of meat and 140 million tons ofmilk - together with feedstuffs to sustain these in-creases. The total requirements of cereals in 1985to meet food, feed and nonfood demands wouldbe of the order of 520 million tons more than in1970, an increase of 43% in fifteen years.
Of these global additions to the demand forcereals, the increase in developing market countrieswould be about 63%, from 386 million tons to 629million tons, while that for developed countries isexpected to be only 29%, from 617 million tons to796 million tons. The increase in total demand inthe developing market economies will be higher, toabout 644 million tons, if per caput income rises inline with the "high" assumption. As for feed re-quirements, assuming no substantial changes in theproduction techniques and with continuing, but mod-est, improvements in the efficiency of feed conversion,it is assumed that the demand for cereals as livestockfeed will increase from about 420 million tons in1970 to 650 million tons in 1985, of which approxi-mately 520 million tons would be required by de-veloped countries and 80 million tons by developingmarket economies (Table 3-18).
Zeroincome
Trendincome
Highincome
Zeroincome
Trendincome
Highincome
Percent per arm= 1969-71 = 100DEVELOPED
MARKET
ECONOMIES . . 0.9 1.4 114 124
EASTERN EUROPEANO U.S.S.R. . 0.9 1.7 115 130
Total developedcountries . . 0.9 1.5 115 126
DEVELOPINGMARKET
ECONOMIES . 2.7 3.6 4.0 150 170 180
Africa . . . 2.9 3.8 4.1 153 176 183Far East . . 2.6 3.4 4.0 148 166 180Latin America . 2.8 3.6 3.8 151 170 175Near East . . 2.9 4.0 4.2 154 180 186
ASIANCENTRALLY
PLANNED
LCONOMIES . 1.6 3.1 3.5 127 158 168
Total developingcountries . 2.4 3.4 3.8 143 166 176
World 2.0 2.4 (2.7) 134 144 (148)

TABLE, 3-16. - WORLD DEMAND BY MAJOR COMMODITY GROUP
Consump-tion
Since these projections of feed demand for cerealsare based upon the assumption of unchanging pricerelationships in the feed/livestock sector, the potentialinaccuracies may be substantial. In the first place,the responsiveness of demand for livestock feeds toshort-term changes in relative prices is much greaterthan that of consumers when faced with changes infood prices. Secondly, although the livestock econ-omy is to a large extent characterized by cyclicalproduction patterns, the regularity of these is upsetby abrupt, unexpected price movements. Conse-quently, the projections of feed demand presentedhere are to be regarded as but one of many possibleoutcomes. In the 1960s the decline in the real priceof cereals encouraged both widespread and rapidexpansion in the use of cereals for feed and increasesin meat consumption. A continuation of those trendsinto the 1980s could lead to much greater utilizationof cereals as feed than has been estimated in theseprojections. Conversely, if the present tight supplysituation with relatively high prices in cereal marketspersists, the expansion of feed use of cereals will bediminished by the substitution of other feedstuff s; at
Projected demand 'Total increase Compoundgrowth rate
SOURCES: For 1969-71, OECD Food Consumption Statistics, and FAO Statistics Division, Supply Utilization Accounts; for 1980, 1985 and1990, FA0 estimates.
1 All demand data are rounded. - 2 Including feed and nonfood demand in primary commodity equivalent. - 3 Including offals. -4 Including milk products in liquid milk- equivalent. - Including animal fats.
118
the same time, less growth in the consumption oflivestock products which are grain-intensive can beexpected.
In all regions the use of cereals for livestock feedwould grow more rapidly than demand for directconsumption and other uses. This is particularlytrue of the developing countries, which must meetrelatively fast-expanding requirements of proteinood, although by 1985 feed uses would still onlyaccount for 14% of their total cereal demand. By.contrast, 66% of the overall cereal demand of de-veloped countries would be utilized as feed in 1985,compared with 60% in 1970. On a per caput basisthe total demand for cereals in developed countries,which was nearly three times that of developingmarket economies in 1970, would thus continue togrow more rapidly than in the developing countries.
The projected growth in per caput food demand issummarized in Table 3-19 in nutritional terms. Percaput demand (in terms of nutrients) in the devel-oped countries would increase slowly, at 0.2% peryear for calories and proteins, because of the generallow responsiveness of food demand to increases in
1969-71 1980 1985 1990 1970-85 1970-90 1970-85 1970-90
Million metric tons Per ent . . Percent per antrum
Cereals 2 1 207 1 538 1 725 1 910 42.9 58.3 2.4 2.3Wheat 2 332 404 447 490 43.8 47.6 2.0 2.0Rice, paddy 2 310 400 447 493 44.3 59.1 2.5 2.3Coarse grains2 565 734 831 927 46.9 64.0 2.6 2.5
Starchy roots 279 321 342 361 22.3 29.2 1.4 1.3
Sugar, centrifugal (raw basis) 70 92 107 126 54.1 80.9 2.9 3.0
Sugar, noncentrifugal 12 15 17 19 42.1 54.0 2.4 2.2
Pulses, nuts and oilseeds 52 69 79 91 51.2 73.5 2.8 2.8
Vegetables 223 290 330 374 48.0 67.7 2.6 2.6
Fruits 158 214 250 290 58.2 83.5 3.1 3.1
Meat 3 107 144 168 197 57.3 84.7 3.1 3.1
Beef and veal 39 51 60 70 54.7 80.1 3.0 3.0Mutton and Iamb 7 10 12 14 69.1 104.5 3.6 3.6Pigmeat 36 46 53 61 48.3 71.4 2.7 2.7Poultry meat 16 24 29 36 83.5 125.4 4.1 4.1
Eggs 19 25 29 34 50.8 75.1 2.8 2.8
Fish 41 57 68 81 64.6 96.3 3.4 3.4
Whole milk, including butter 389 476 532 597 36.9 53.3 2.1 2.2(Skim. milk) (40) (50) (58) (66) (44.4) (65.5) (2.5) (2.6)Cheese 9 12 14 16 51.7 74.4 2.8 2.8
Fats and oils," 33 43 49 57 47.9 70.8 2.6 2.7Butter (fat content) 5 6 7 s 33.9 49.3 2.0 2.0Vegetable oils 22 30 35 41 55.1 81.9 3.0 3.0

TABLE 3-17. - TOTAL DEMAND OF DEVELOPING MARKET ECONOMIES BY MAJOR COMMODITY GROUPS
income at existing high consumption and incomelevels. However, there would be a more rapid in-crease demand for the relatively expensive foods, asreflected by an increase of 0.6% per year in the farm-gate value of total food demand per caput. Thedeveloping countries' average per caput demand forboth calories and protein would increase at a rateof 0.6% per year, a faster increase than in the de-veloped countries, but substantial differences in cal-ory and protein levels per caput between the twocountry groupings would nevertheless persist through-out the projection period. If incomes in developingregions were to increase at the alternative "high"rate, per caput demand for calories and proteinwould increase at rates of 0.8% and 0.9% per yearrespectively, raising the average levels to 2 485 kilo-calories and 65.6 grams of protein by 1985.
Average demand levels for heterogeneous aggre-gates of countries conceal wide disparities whichwould continue to exist between individual countriesand regions. Particularly in the Far East and to alesser extent in Africa the average per caput demandfor calories would remain below the level required
SOURCES: For 1969-71, OECD Food Consumption Statistics, and FAo Statistics Division, Supply Utilization Accounts ; for 1980, 1985 and1990, FAO estimates.
I All demand data rounded. - 2 Including feed and nonfood demand in primary commodity equivalent. - 3 Including offals. -`I Including milk products in liquid milk equivalent. - 5 Including animal fats.
119
for moderate activity until well into the 1980s. Thenumber of countries with average food demand belownutritional requirements in terms of calories woulddiminish during the period. However, by 1985 therewould still be thirty-four countries with a combinedpopulation of nearly 800 million where average percaput energy demand would fall short of require-ments, or if incomes grew at the "high" rate, twenty-six countries with a population of 600 million, inboth cases making no allowance for uneven distribu-tion of available food supplies among different socio-economic groups.
Extrapolated food production trends
It is more difficult to establish an objective basisfor assessing future rates of growth of productionthan it is to project food demand. For reasons givenin the methodological note (p. 127) the base periodchosen was 1961 to 1973, and all the extrapolationsof production are exponential growth rates derivedfrom this period. Calculations were made both by
Consump-tion Projected demand Total increase Compound
growth rate
1969-71 1980 1985 1990 1970-85 1970-90 1970-85 1970-90
Million 1 etric tons Percent .. .. Percent per annumCereals 2 385.70 534.3 628.5 737.6 63.0 91.2 3.3 3.3
Wheat 2 87.0 119.3 140.2 164.0 61.1 88.5 3.2 3.2Rice, middy 2 171.2 235.3 274.8 318.6 60.5 86.1 3.2 3.2Coarse grains 2 127.5 179.7 213.5 255.0 67.5 100.0 3.5 3.5
Starchy roots 107.9 136.5 153.4 171.6 42.2 59.0 2.4 2.3
Sugar, centrifugal (raw basis) 23.9 36.9 46.7 59.3 95.2 148.1 4.6 4.6
Sugar, noncentrifugal 10.8 13.5 15.3 17.4 42.1 62.0 2.4 2.4
Pulses, nuts and oilseeds 32.4 44.7 52.8 62.3 63.0 92.2 3.3 3.3
Vegetables 69.7 99.4 119.3 142.4 71.1 104.3 3.6 3.6
Fruits 73.4 107.5 130.4 157.3 77.5 114.2 3.9 3.9
Meat 3 21.1 32.2 40.6 51.7 92.1 144.4 4.4 4.6Beef and veal 9.6 14.0 17.3 21.5 80.1 123.8 4.0 4.1Mutton and Iamb 2.6 4.2 5.5 7.1 110.9 174.4 5.1 5.2Pigmeat 3.5 5.3 6.6 8.3 88.0 135.5 4.3 4.4Poultry meat 2.3 4.1 5.6 7.9 143.6 241.1 6.1 6.3
Eggs 2.8 4.5 5.9 7.7 112.4 179.7 5.2 5.3
Fish 12.3 19.0 24.3 31.4 98.7 155.9 4.7 4.8
Whole milk, including butter 93.7 137.6 168.4 205.8 79.6 119.6 4.0 4.0(Skim milk) (13.6) (20.2) (25.1) (31.1) (84.9) (129.4) (4.2) (4.2)Cheese 2.6 3.7 4.5 5.5 75.0 112.6 3.8 3.8
Fats and oils 5 9.9 14.8 18.5 23.0 84.9 129.4 4.2 4.2Butter (fat content) 1.1 1.7 2.1 2.5 81.4 122.6 4.1 4.1Vegetable oils 7.7 11.7 14.5 13.1 87.6 133.6 4.3 4.3

country and by commodity. The summary resultsby region are shown in Table 3-20, where they arecompared with projected rates of population growth.
Although the growth rate of production for de-veloped market economy countries (2.4%) is lowerthan the rate calculated for developing market econ-omy countries (2.6%), the former lies far above thecorresponding population growth rate, while the latteris slightly lower (2.6% for production versus 2.7%
120
for population growth), thus providing no margin tomeet the projected increases in per caput demand.These extrapolated production growth rates varyfrom 2.4% in Africa to around 3% in the Near Eastand Latin America. A striking result is that foodproduction in every developing region except theNear East (and the Asian centrally planned econ-omies) would grow more slowly than populationif past trends were allowed to continue. This would
TABLE 3-18. -- CEREALS: ACTUAL CONSUMPTION AND PROJECTED TREND DEMAND BY MAIN TYPES OF UTILIZATION, 1970-90, BASED ON TRENDGROWTH ASSUMPTION
Actualconsump-
tion
Projected demand Total increase Compound growth rate
1970 1980 1985 1990 1970/80 1970/85 1970/90 1970-80 19 70-8 5 1970-90
Million metric tons Percent Percent per annum
DEVELOPED COUNTRIES
Food 160.9 163.1 164.1 164.6 1.3 2.0 2.0 0.1 0.1 0.1Feed 371.5 467.9 522.7 565.7 25.9 40.7 52.3 2.3 2.3 2.1Other uses 84.9 100.6 109.5 116.4 18.5 29.0 37.1 1.7 1.7 1.6
Total I 617.3 731.6 796.3 846.7 18.5 29.0 37.2 1.7 1.7 1.6
Kilogranzs
Per capzit . . I 576 623 649 663 8.2 12.7 15.1 0.8 0.8 0.7
Million metric tonsDEVELOPING MARKET
ECONOMIES
Food 303.7 409.3 474.5 547.2 34.8 56.3 80.2 3.0 3.0 3.0Feed 35.6 60.9 78.6 101.9 71.1 120.8 186.2 5.5 5.4 5.4Other uses 46.4 64.1 75.4 88.5 38.1 62.5 90.7 3.3 3.3 3.3
Total I 385.7 534.3 628.5 737.6 38.5 63.0 91.2 3.3 3.3 3.3
Kilograms
Per caput . . I 220 233 240 246 5.9 9.1 11.8 0.6 0.6 0.6
Million metric tons
ASIAN CENTRALLYPLANNED ECONOMIES
Food 164.1 200.5 215.2 225.3 22.2 31.1 37.3 2.0 1.8 1.6Feed 15.3 38.7 48.7 61.4 152.9 218.3 301.3 9.7 8.0 7.2Other uses 24.6 32.6 36.0 39.1 32.5 46.3 58.9 2.9 2.6 2.3
Total I 204.0 271.8 299.9 325.8 33.2 47.0 59.7 2.9 2.6 2.4
Kilograms
Per caput . I 257 290 298 304 12.8 16.0 18.3 1.2 1.0 0.8
Million metric tons
World
Food 628.7 772.9 853.8 937.1 22.9 35.8 49.1 2.1 2.1 2.0Feed 422.4 567.5 650.0 729.0 34.4 53.9 72.6 3.0 2.9 2.8Other uses 155.9 197.3 220.9 244.0 26.6 41.7 56.5 2.4 2.4 2.3
Total I 1 207.0 1 537.7 1 724.7 1 910.1 27.4 42.9 58.3 2.5 2.4 2.3
Kilograms
Per caput . . . 333 349 355 357 4.8 6.6 7.2 0.5 0.4 0.3
SOURCE: FAO estimates.

TABLE 3-19. -- PER CAPUT FOOD DEMAND IN CALORIES AND PROTEINS,1970 1 AND PROJECTIONS TO 1990, BASED ON TREND GROVVTH
ASSUMPTION
SOURCE: FAO estimates.
1 1969-71 average. - 2 Kilocalories and grams of protein daily.
be a widespread phenomenon, not one reflecting lowproduction rates in a few big countries, since (ex-cluding the Near East) only about half the countriesstudied separately would have a margin of foodproduction over projected population growth.
It must be reiterated that the data in Table 3-20
TABLE 3-20. -- EXTRAPOLATED GROVVTH RATES OF FOOD PRODUCTIONAND PROJECTED POPULATION ogow-ni, 1969-71 TO 1985
121
show nothing more than what would happen ifrecent production trends were to continue unchangedand assuming a stable climate. What actually hap-pens between now and 1985 may be quite different, asthe outcome will depend on a wide range of factorswhich have been deliberately excluded at the presentstage, such as changes in the relative profitability offarm production and in the agricultural policies ofgovernments, as well as possible changes in the cli-matic pattern or trend. Nevertheless, there clearlyare two completely contrasting tendencies: productionis growing much faster than population in developedcountries, whereas the reverse is true in developingcountries. The high rate of production growth (rel-ative to population) extrapolated for the developedmarket economies and the still higher rate for thedeveloped centrally planned economies (3.5%) willmaterialize, in fact, only if a demand for massiveexports from these countries occurs."
The demand/production balance
The next step is to correlate the demand projec-tions and the production extrapolations in order tosee theoretical surpluses or deficits. The word"theoretical" is used because the two series werecalculated independently of each other, with noallowance made for the influence of demand on pro-duction and vice versa or for consequential changesin prices. In practice, of course, it would be im-possible for surpluses (or deficits) to continue toaccumulate persistently over a period of several years.These projections, subject to this important reserva-tion, are shown in Table 3-21.
Most arresting are the data for the developingmarket economy countries, in which food demandexpands at 3.6% annually while the "trend" annualgrowth of food production is only 2.6%; the regionalfigures show the smallest difference between thetwo rates occurring in Latin America, the biggest inAfrica. This implies the building up by 1985 of avery substantial imbalance between demand and pro-duction in all these regions, and especially in Africa.For instance, between 1969-71 and 1985 Africa'sfood demand would, on these assumptions, rise by76% and her food production by only 45%."
What the possible food import requirement forcereals alone might amount to if present trends con-
20 It should also be noted that an exponential extrapolation offood production - which is the growth path that food productionmust take if it is to match population growth - does not imply aconstant addition in tenns of tonnage to world food output eachyear. It means, rather, that the quantity by which one harvestexceeds the previous harvest must grov year by year.
21 In a number of individual developing countries total fooddemand would more than double between 1969-71 and 1985 - forinstance, in Nigeria, Iran, Iraq, Saudi Arabia and Thailand.
Calories Proteins
Devel- Devel- Devel- Devel-World oped
coun-opingcoun- World oped
coun-opingcoun-
tries tries tries tries
Levels per caput2
1970 . . . . 2 480 3 150 2 200 69.0 96.4 57.41980 2 560 3 190 2 330 71.1 98.4 61.21985 . . 2 610 3 220 2 400 72.6 100.0 63.31990 . . . . 2 670 3 260 2 480 74.3 101.9 65.6
Percentageincreasefrom 1970 to:
1980 . . . . 3.3 1.2 6.1 3.0 2.1 6.51985 . . . . 5.3 2.3 9.3 5.3 3.8 10.21990 . . 7.5 3.6 12.7 7.7 5.7 14.2
Annual rate ofgrowth from1970 to:
1980 . . . . 0.3 0.1 0.6 0.3 0.2 0.61985 0.3 0.2 0.6 0.3 0.2 0.61990 . . . . 0.4 0.2 0.6 0.4 0.3 0.7
Foodproduction Population
. Percent per annum . . .
DEVELOPED MARKET ECONOMIES . 2.4 0.9
EASTERN EUROPE AND U.S.S.R. . 3.5 0.9
Total developed countries . . 2.8 0.9
DEVELOPING MARKET ECONOMIES . 2.6 2.7
Africa 2.5 2.9Far East 2.4 2.6Latin America 2.9 3.1Near East 3.1 2.9
ASIAN CENTRALLY PLANNED ECON-OMIES 2.6 1.6
Total developing countries . . 2.6 2.4
World 2.7 2.0

TABLE 3-21. PROJECTIONS OF FOOD DEMAND AND EXTRAPOLATIONSOF FOOD PRODUCTION TO 1985
VOlume grOwthrates Volume indices
1 The commodities covered include all of those shown inTable 3-17 on p. 119.
tinue can be seen in Table 3-22. In 1985 the develop-ing market economy countries would have a netcereals deficit of almost 85 million tons, comparedwith an annual average deficit of only 16 million tonsin 1969-71 and net exports in prior decades. More-over, the net deficit embraces all developing marketeconomy countries. If the cereal-exporting countriessuch as Argentina and Thailand are excluded, theprojected cereals deficit rises to around 100 milliontons per year, three times their gross imports in1969-71. This assumes normal production condi-tions; in a good year the deficit could be less, butin a bad year it could rise to some 120 million tonsor possibly even more by the mid-1980s. (The cerealsdeficit of the developing market economies in the bad1973/74 season, again excluding exporting countries,is estimated at 52 million tons.) However, the de-veloped countries' cereal production extrapolationsuggests that these countries could be capable ofgenerating export surpluses that would far outweighthe deficits of developing countries, given a continua-tion of established trends in countries with commandover advanced technology and substantial productiveresources. The largest deficits of the developingmarket economies would be in rice and coarse grains,reflecting the much greater role of these cereals inthe production and consumption patterns of most de-veloping countries.
122
In these calculations cereals for food and feed arecombined; but, whereas the demand projections ofcereals for human consumption are reasonably firm,those for feed could be modified upward or downwardby a number of factors. For example, if the ratiobetween feedgrain and livestock prices shifts infavour of the latter, either because of a persistentabundance of grain or because of an intensifieddemand for livestock products, then the expansion ofthe livestock sector will accelerate through the in-creased use of feedgrains. Conversely, improvernentsin the efficiency of feed conversion would reduce theamount of grain required to produce each kilogramof meat. Likewise, some part of the demand forlivestock products might be satisfied by the use ofmeat analogues or meat "extenders" based on thedirect use of vegetable proteins, and to that extentthe demand for feedgrains would be reduced. Againthe availability and price of other foods such asoilcake, fish meal and cassava will affect the use ofcereals.
While cereals dominate world food issues, attentionmust also be given to other products, particularlythe protein-rich items for which demand grows rap-idly. Table 3-23 summarizes the balances for cattleand sheep meat and for fish. No production estimateswere made for pig and poultry meat because therapidity with which production adjusts to demandconditions gives little validity to separate extrapola-tions of production trends. In general, exponentialtrends were selected for extrapolating the output oflivestock products, modifications being made in anumber of cases when the base period trend ap-peared unrepresentative (e.g., short-run slaughteringlevels which cannot be sustained).
Beef and veal would be in moderately short supplyat the world level, although if the deficit indicatedfor the Asian centrally planned countries (which arcnot large producers or consumers) did not materialize,world production and demand would approximatelybalance. The global situation is heavily influencedby the developed countries, which together producetwo thirds of the world supply and for whom a smallsurplus is indicated, reflecting rising self-sufficiencyin the EEC and growing export supplies from Oceania.Their production might grow somewhat faster stillif grains and other feedstuffs were plentiful and cheap,but biological limitations would be a restraint on anylarge acceleration of past trends. While a turnaboutfrom deficit to surplus is indicated for developedcountries, a reverse shift from net export availabilityto deficit is shown for developing countries as awhole. However, the margins of surpluses or deficitsare small in relation to overall production and de-mand. Worsening of the balance holds for all re-gions except Latin America and underlines the mag-nitude of the problems of doubling the supply of
Demand Pro-duction
Demand Pro-duction
Percent per alumni 1969-71 100
DEVELOPED NIARKET ECON-OMIES 1.4 2.4 124 143
EASTERN EUROPE AND
U.S.S.R. 1.7 3.5 130 168
Total developed countries 1.5 2.8 126 151
DEVELOPING MARKETECONOMIES 3.6 2.6 170 146
Africa 3.8 2.5 176 145Far East 3.4 2.4 166 143Latin America 3.6 2.9 170 152Near East 4.0 3.1 180 157
ASIAN CENTRALLY PLANNEDECONOMIES 3.1 2.6 158 146
Total developing countries 3.4 2.6 166 146
World 2.4 2.7 144 150
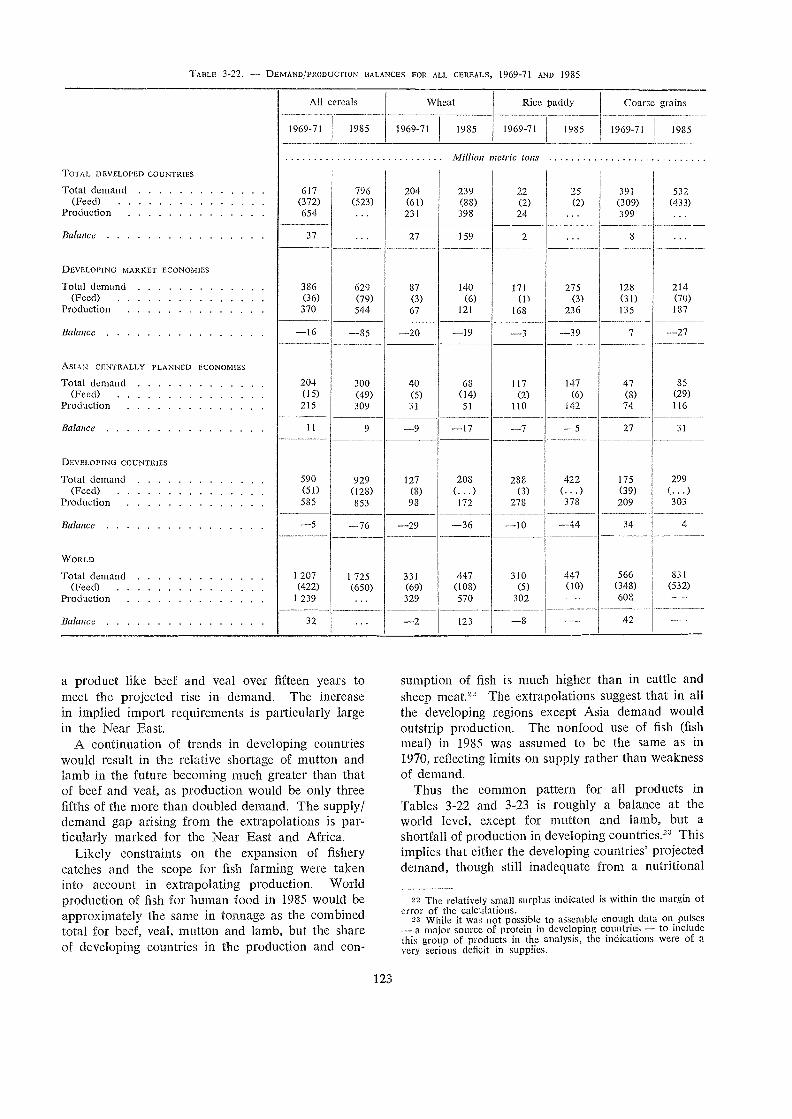
a product like beef and veal over fifteen years tomeet the projected rise in demand. The increasein implied import requirements is particularly largein the Near East.
A continuation of trends in developing countrieswould result in the relative shortage of mutton andlamb in the future becoming much greater than thatof beef and veal, as production would be only threefifths of the more than doubled demand. The supply/demand gap arising from the extrapolations is par-ticularly marked for the Near East and Africa.
Likely constraints on the expansion of fisherycatches and the scope for fish farming were takeninto account in extrapolating production. Worldproduction of fish for human food in 1985 would beapproximately the same in tonnage as the combinedtotal for beef, veal, mutton and lamb, but the shareof developing countries in the production and con-
123
sumption of fish is much higher than in cattle andsheep meat.22 The extrapolations suggest that in allthe developing regions except Asia demand wouldoutstrip production. The nonfood use of fish (fishmeal) in 1985 was assumed to be the same as in1970, reflecting limits on supply rather than weaknessof demand.
Thus the common pattern for all products inTables 3-22 and 3-23 is roughly a balance at theworld level, except for mutton and lamb, but ashortfall of production in developing countries.23 Thisimplies that either the developing countries' projecteddemand, though still inadequate from a nutritional
22 The relatively small surplus indicated is within the margin oferror of the calculations.
23 While it was not possible to assemble enough data on pulsesa major source of protein in developing countries to include
this group of products in the analysis, the indications were of avery serious deficit in supplies.
TABLE 3-22. DEMAND/PRODUCTION BALANCES FOR ALL CEREALS, 1969-71 AND 1985
TOTAL DEVELOPED COUNTRIES
All cercals Wheat Rice paddy Coarse grains
1969-71 1985 1969-71 1985 1969-71 1985 1969-71 1985
Million metric tons
Total demand 617 796 204 239 22 25 391 532(Feed) (372) (523) (61) (88) (2) (2) (309) (433)
Production 654 231 398 24 ... 399 ...
Balance 37 27 159 2 8
DEVELOPING MARKET ECONOtvilES
Total demand 386 629 87 140 171 275 128 214(Feed) (36) (79) (3) (6) (11 (3) (31) (70)
Production 370 544 67 121 168 236 135 187
Balance 16 20 19 3 39 7 27
ASIAN CENTRALLY PLANNED ECONOMIES
Total demand 204 300 40 68 117 147 47 85(Feed) (15) (49) (5) (14) (2) (6) (8) (29)
Production 215 309 31 51 110 142 74 116
Balance 11 9 9 17 7 5 27 31
DEVELOPING COUNTRIES
Total demand 590 929 127 208 288 422 175 299(Feed) (51) (123) (8) (...) (3) (...) (39) (...)
l'roduction 585 853 98 172 278 378 209 303
Balance 5 76 29 36 10 44 34 4
WORLD
Total demand 1 207 1 725 331 447 310 447 566 831
(Feed) (422) (650) (69) (108) (5) (10) (348) (532)Production 1 239 329 570 302 -- 608 ---
Balance 32 2 123 s 42

TABLE 3-23. - MEAT AND FISH BALANCES FOR 1969-71 AND 1985
point of view, cannot be met or they will be facedwith massive food import bills. What one part ofthese bills might amount to may be illustrated bycereals.
The cost of importing 85 million tons of cereals,for instance, would depend on prices prevailing in1985. At the 1973/74 average of US$200 per tonfor all cereals, it would reach $17 000 million perannum; even at 1969-72 prices, it would cost toward$8 000 million. In addition, the developing coun-tries, according to the projections and extrapolations,would be importing substantial amounts of other
124
foodstuffs. Clearly, the financing of internationalfood trade on this scale would raise very grave prob-lems. Under the present trading arrangements it ishardly conceivable that the majority of the food-deficit developing countries would export to the de-veloped countries in sufficient quantities to paythese bills, even if there were a massive food aidprogramme to cover a part of the import needs.Whatever combination of remedies may prove fea-sible, it seems certain that the projected food im-balances for developing market economy countriesin 1985 imply international trade problems of suchmagnitude that it becomes imperative for their gov-ernments to formulate policies which will alter thetrends, especially by achieving a marked increasein production, so that no such unmanageable situa-tion is allowed to materialize.
Supplementary needs to meet nutritional standards
The balance of supply and demand has so far beenexamined in relation to effective or commercial de-mand. However, great inequalitites in levels offood consumption would persist within, as well asbetween, individual countries. Deficiencies in data donot permit an estimate of the additional quantities offood which would be required to assure nutritionallyadequate diets to all, or virtually all, people. None-theless, some indications of the scale of the problemmay be given.
As was noted above, it has been estimated that in1970 at least 462 million people were suffering frommalnutrition. For reasons already given, it is notpossible to quantify exactly the extent to whichtheir intakes should be increased. However, theprovisions of even a small addition of, for example,250 calories to per caput energy intakes per daywould ha ve required in 1970 nearly 12 million tonsof cereals or cereal equivalent. Tentatively, by1985 the number of people in this category wouldbe approximately 750 million if the present patternof food distribution within countries were to persist;hence the additional cereal equivalent requirementscould total nearly 20 million tons annually, assumingunrealistically that all the additional quantity waschannelled directly to those in need; in practice con-siderably larger amounts would be required.
A further dimension of the magnitude of supple-mentary food needs is given by projections of thesize of vulnerable groups of the population. Esti-mates of the numbers of young children, of pregnantand lactating women and of the elderly suggest thatthe overall proportion of these groups in most re-gions will decline slightly by 1985 to approximatelyone quarter of total population, but that their ab-solute numbers will rise substantially (Table 3-24).
Beef and veal Muttonand lamb Fish
1969-71
1985 1969-71
1985 1969-71
1985
Million metric tons
TOTALDEVELOPEDCOUNTRIES
Total demand 27.0 38.4 3.7 5.2 34.5 43.2(Feed) . . (-) (-) (-) (-) (12.6) (12.6)
Production 26.6 39.0 3.9 4.9 34.5 45.5
Balance -0.4 0.6 0.2 -0.3 2.3
DEVELOPINGMARK ETECONOMIES
Total demand 9.6 17.3 2.6 5.5 25.9 37.9(Feed) . (-) (-) (-) (-) (13.6) (13.6)
Production 10.6 17.0 2.6 3.4 27.2 38.3
Balance 1.0 -0.3 2.1 1.3 0.4
ASIANCENTRALLYPLANNEDECONOMIES
Total demand 2.0 4.1 0.6 1.1 7.3 13.3(Feed) . . (-) (-) (-) (-) (-) (-)
Production . 2.1 2.9 0.7 0.8 8.0 12.8
Balance 0.1 -1.2 0.1 -0.3 0.7 -0.5
TOTALD EVELOPINGCOUNTRIES
Total demand 11.7 21.4 3.2 6.6 33.2 51.3(Feed) . . (-) (-) (-) (-) (13.6) (13.6)
Production . . 12.7 20.0 3.2 4.1 35.2 51.1
Balance 1.0 -1.4 2.5 2.0 -0.2
World
Total demand 38.7 59.8 7.0 11.8 67.7 94.4(Feed) . . (-) (-) (-) (-) (26.2) (26.2)
Production . 39.3 58.8 7.1 9.1 69.7 96.6
Balance 0.6 -1.0 0.1 -2.7 2.0 2.2

Again, it is possible to quantify only roughly theextent of their additional food needs. As an indica-tion of possible needs, if one half of the 700 millionvulnerable people in developing market economiesin 1985 received a daily supplement of 300 grams '4of whole milk or its equivalent, the additional milkrequirements would amount to 40 million tons an-nually.
The redistribution of income in favour of the poorcould have a major effect on food demand becauseof the higher income elasticity of demand at low in-come 13vels. However, the quantitative effects ofredistribution depend, of course, on the form of re-lated policies 25 and on the responsiveness of con-sumers in the various income strata to changes intheir real incomes. Therefore, estimates of the im-pact of redistribution on total food demand can beno more than illustrative. A recent FAO study ofeleven Latin American countries 26 estimated that a"drastic" redistribution of income (involving thechannelling of all increases in income to the poorergroups) would add nearly 14% to food demand afterten years as compared with the volume of demandwithout a change in income distribution. Alterna-tively, with a more "moderate" redistribution (withpart of the increase in income going to the higher
24 Equivalent to about 200 calories and 10 grams of proteinper day if provided as fluid whole milk from cows.
25 For example, general fiscal measures, pensions and childallowances, school feeding programmes and food distributionschemes aimed at other specific groups may all be regarded asinstruments for income redistribution.
26 The impact on demand of changes in income distribution: acase study of eleven Latin American countries, in Fp,o MonthlyBulletin of Agricultura! Economics and Statistics, 21(3), 1972.
125
FAO estimates based on United Nations "medium" population projections. 2 Estimated on the basis of crude birth rates (numberof births times 2).
income groups), nearly 10% would be added to de-mand after ten years. The impact on the consump-tion of individual commodities could also be sub-stantial if measures for redistribution were eitherdirected toward particular target groups or involveddirect distribution of specific foodstuffs.
Production fluctuations
In the extrapolation of trends every year is assumedto be a normal year from the point of view of thefactors governing the volume of production, includingnormality of weather. In reality, as has been recentlydemonstrated, the weather is capable of causing sig-nificant annual fluctuations in harvests: the 1972world crop of cereals was 33 million tons less thanthat of 1971. As the volume of the world's normalproduction will have substantially increased by 1985,so also will the potential fluctuations perhaps tosome 50 million tons above or below the trend line.
Unless special preventive measures are taken, theburden of this risk will fall mainly on the developingcountries for two reasons. First, they are majorgrain producers, accounting for ahnost half theworld's production, and many of them are locatedin zones of unreliable weather (monsoon or semi-arid). Second, as they will be depending on importsfor a notable proportion of their requirements, if thegrain-exporting countries were to have bad harvestsin the same year, their export availabilities woulddiminish and the importing countries would be leftshort.
TABLE 3-24. VULNERABLE POPULATION GROUPS, 1970 AND 1985 1
Children, from birthto age 4
Pregnant andlactating women 2
Elderly persons, fromage 65 Totals Percentage of total
population
1970 1985 1970 1985 1970 1985 1970 1985 1970 1985
Millions
TOTAL DEVELOPEDCOUNTRIES . . 95 114 40 48 103 127 238 289 22.1 23.6
DEVELOPING MARKETECONOMIES 305 423 154 201 54 89 513 714 29.2 27.2
Africa 50 79 26 39 8 12 84 130 30.0 30.3Far East 178 233 90 111 30 51 299 394 29.3 26.2Latin America 47 68 22 30 11 18 79 116 27.9 27.0Near East 30 44 15 21 6 9 51 74 29.7 28.3
ASIAN CENTRALLYPLANNED ECONOMIES 107 114 52 52 32 49 191 215 24.0 21.4
TOTAL DEVELOPINGCOUNTRIES . . . . 412 537 206 253 86 138 703 929 27.6 25.6
World 506 652 246 301 189 266 941 1 218 26.0 25.1

For these reasons the risks of a simultaneousbreakdown in production and imports can be ex-pected to be greater in 1985 than in 1972. Thisunderlines the urgency of intergovernmental con-sideration of FAO'S food security proposals and theneed for a continuous global monitoring of currentcrop conditions and concurrent on-going weather con-ditions.
Outlook for rural poverty
What happens to agricultural production in de-veloping countries will decisively influence the stan-dard of living of farmers and indirectly that of therest of the rural population. As has been shownearlier, the greater part of world hunger and mal-nutrition is found in rural areas among people whoproduce too little food or who have insufficientemployment or income to purchase enough food. Amajor step toward ameliorating this situation couldcome from a rapid expansion of food production,especially by the small-scale, farmers, most of whomare among the poorest. But what is the outlook?
Population in the developing countries is expectedto expand by 1985, and indeed up to the end of thecentury, more rapidly than in any previous periodin history, and whatever the rate of migration ofrural people to cities, rural population will also con-tinue to expand. Probably some 200 million personswill be added to the rural labour force between 1970and 1985, and a further 250 million between then andthe year 2000. IVIeanwhile, in all developing regionsexcept the Near East, total food production will, ac-cording to the extrapolations, be expanding moreslowly than total population. Bearing in mind thata proportion of this production must feed the in-creasing urban population, it seems unlikely that thequantity of food per rural inhabitant and availablefor rural consumption will be greater in 1985 thanit is today. Certainly, any modest improvementsin the more favoured agricultural areas would notmake a significant impact on the general problemof rural poverty and hunger. These considerationsstress the role of agricultural production and itsexpansion. An acceleration of expansion is urgent,not only to avoid unmanageable deficits in the na-tional food supplies of developing countries, butbecause it offers the, chief hope of combating under-nutrition among the agricultural poor and, moregenerally, of raising rural living standards.
From the foregoing analysis of the food problemof the future, a great many conclusions leading topolicy suggestions in various fields could be drawn.Different individuals would probably single out dif-ferent items. Some may focus on that aspect of theanalysis which shows no 1.985 imbalance in food
126
supplies at the world level and may express satisfac-tion that world production appears to be capable ofmeeting effective coimnercial demand. Others willemphasize the alarming increase in the projectedfood deficits of the majority of developing countries,which in turn would create major international tradedifficulties and offer little hope of improving thenutritional level of disadvantaged groups in thosecountries; they will note that a continuation of existingtrends in developing countries would result in deficitsnot only in cereals but also in major sources ofproteins.
There are three alternative approaches, not mutual-ly exclusive, for meeting the developing countries'growing food deficit:
Exporting countries mostly developed coun-tries, but also including some developing ex-porters would provide supplies to deficit coun-tries on a commercial basis. For grains alonethe quantities could reach 80-90 million tons,while imports of a wide range of other foodswould also increase. Fundamental changes wouldbe needed in the structure of payments and tradeto finance such greatly enlarged food importsand the expected increases in imports of foodproduction requisites.
Food imports would be provided in whole orin large part as continuing food aid. It is dif-ficult however to visualize an expansion of foodaid on the vast scale which would be necessaryto cover all the needs.
Food-deficit developing countries would acceler-ate the growth of their food output to aroundthe proposed target rates, thus diminishing theirimport needs. This would seem the only prac-ticable alternative for solving the food problem,but developed countries as a group might laterneed to retard somewhat their rate of productionexpansion, particularly of cereals.
In the sphere of nutrition the conclusion may bedrawn that in the absence of new initiatives thenumber of malnourished persons is likely to increase,because the projected growth rates of GDP, especiallyof food production, are not enough to eliminatepoverty, particularly rural poverty, which is mal-nutrition's chief cause. Accordingly, governmentsmay need to give higher priority than in the pastto income redistribution and to programmes designedto improve the nutritional status of vulnerable groups,and by improvements in marketing and distributionkeep retail food prices at reasonable levels. Externalassistance, especially food aid, could intervene on alarger scale to support such national programmes.

.1n many developing countries a major contribu-tion toward rectifying the imbalance could be madethrough a campaign against waste of all kinds andin all places. Such a campaign, with concomitantimprovements in storage facilities, could save insome instances as much as 20% of grain crops andpossibly a much larger proportion of perishable fruitsand vegetables. In countries where d.eficits in basicfoods persist, attenti.on might be given, through pricepolicies and other means, to encouraging the use offeedstuffs other than grain in the livestock sector.
Furthermore, it has been seen that large fluctuationsin demand on world markets occasioned by cropfailures, particularly of cereals, must be expected.This Implies that in addition to action designedto improve trends of production and demand andtheir long-term balance, new initiatives will be calledfor to build a system of food security to ensure,among other things, that stocks are adequate to meetunpredictable crop failures and large temporarysurges in im.port demand.
Lastly, efforts toward reducing population growthto alleviate the longer-term situation would alreadybegin to be felt by 1985 and thus considerably reducethe :food deficit of the developing countries.
Methodological note
FOOD DEMAND ASSUMPTION
The projections of food demand utilize essentiallythe same methodology as that employed in FAO'SAgricultural commodity projections, 1970-1980," theprincipal component being population and incomegrowth, with account being taken of the responsive-ness of consumer demand to changes in private con-sumption expenditure and of information on foodconsumption levels in the period 1969-71."'s Relativeprices are also assumed to remain unchanged.
The assumptions on population growth have beenupdated to comprise the provisional projections madeby the United Nations Population Division in 1974on the basis of the results of recent national censuses.The greater part of the following analysis makesuse of the "medium" variant, for which the data,shown in Table 3-25, indicate a world populationexpansion during the 1970s and 1980s of 2% peryear, but with striking differences between regions.The developed countries' population is expected togrow at 0.9°/, compared with 2.7% for the develop-ing market economies, and the Asian centrallyplanned economies lie in between. This difference
27 A full description of [he methodology is given in Vol. 11,
Part I, of the cited publication (ccr 71/20, Rome, 1971).2s In the text and tables the year 1970 refers to the 1969-71
average.
127
TABLE 3-25. - WORLD POPULATION, 1970 AND PROJECTIONS 1 TO1985 AND 1990
Actual Compound rate ofProjected growth
1 United Nations "medium" variant assumption, provisional,1974.
in growth rates will be seen to have an importantbearing on the food problem of the future.
The alternative "low" and "high" population vari-ants, which embody different assumptions regardingfertility rates, would at the world level provide an-nual growth rates of 1.8% and 2.1% respectivelyfrom 1970 to 1985. Over this fifteen-year span thedifferential impact of the various growth assumptionswould therefore be rather marginal. For example,for the developing countries the "high" variant wouldindicate a total population of 3 695 million in 1985,that is, 1.8% greater than the 3 631 million impliedby the "medium" variant. However, by 1990 thedifference would have widened to 3.1%, and by theend of the century it would be 13%, according tothe United Nations projections, giving considerablygreater long-term importa.nce to clifferen.ces in popu-lation growth rates.
The assumptions relating to th.e growth of grossdomestic product (GDP) take into account informa-tion on growth actually achieved late in the 1960s
DEVELOPEDMARKET
1970 1985 1990
.
1960-70
Percent
1970-85
per
1970-90
antrumMillion
ECONOMIES . . 724 828 861 1.1 0.9 0.9
North America 226 262 271 1.3 1.0 1.0Western Europe 354 386 396 0.8 0.6 0.6Oceania 15 20 21 1.9 1.8 I .7Others .... 129 160 169 1.4 1.4 1.4
EASTERN EUROPEANO U.S.S.R. 348 399 416 1.0 0.9 0.9
Total developedcountries . . 1 072 1 227 1 277 1.1 0.9 0.9
DEVELOPINGMARKETECONOMIES 1 755 2h23 2 997 2.6 2.7 2.7
Africa . . . 279 427 498 2.5 2.9 2.9Latin America 284 428 489 2.8 2.8 2.7Near East . 171 262 303 2.7 2.9 2.9Far East . . . 1 021 1 506 1 707 2.5 2.6 2.6
ASIANCENTRALLYPLANNEDECONONIIES 794 1 008 I 072 1.8 1.6 1.5
Total develop-ing countries 2 549 3 631 4 069 2.3 2.4 2.4
World . . 3 621 4 858 5 346 1.9 2.0 2.0

TABLE 3-26. - Gaoss nomesric PRODUCE', 1970 AND ASSUMPI IONS POR 1985 AND 1990
SOURCES: For 1960 and 1970, see footnote 29 below; for 1985 and 1990, FAO estimates.At 1970 prices. - 2 For centrally planned economies, based on net material products; see FAO A gricultural commodity projections,
1970-1980, Vol. II, p. xxiv-xxv.
and, where possible, during the first three years ofthe 1970s." Two new features are that medium-term economic growth in the majority of developedcountries is expected to be depressed by the effectsof present energy difficulties and that high rates ofgrowth will be enjoyed by petroleum-exporting coun-tries. For developed market economies, for example,it is assumed that the growth of GDP in real termswill average 4.1% per year between 1970 and 1975,and rise to 4.6% in the last half of the 1970s and4.7% in the 1980s compared with an average of5% during the 1960s.
Table 3-26 summarizes actual growth in GDP be-tween 1960 and 1970 and projected growth to 1985and 1990. It shows a marked contrast in the pro-jected 4.5% per year growth rate for the developed
2 2 For the years from 1960 to the present a number of sourceshave been utilized, including: OECD, National Accounts of OECDCountries; United Nations, National Accounts Statistics andEconomic Commission for Africa ; IBRD, World Bank "Atlas";and United Nations, Monthly Bulletin of Statistics. The 1985and 1990 figures are FAo estimates.
128
market economies and the 6.3% per year for thedeveloping market economies. However, these dif-ferences disappear when allowance is made for pop-ulation growth - the per caput annual growth ratesfrom 1970 to 1985 being 3.5% for both groups ofcountries. Only eastern Europe and the U.S.S.R.have a significantly higher per caput growth rateof 5.2%.
Although the following analysis uses the above"trend" assumptions as a main bench mark, thesensitivity of food demand is also examined withrespect to alternative assumptions concerning eco-nomic growth; one extreme variant, the assumptionof no growth at all in per caput real incomes andexpenditures, implies demand would grow at thesame rates as population. Also, in view of the greaterresponsiveness of demand to changes in income atlow levels of income and consumption, alternativeGDP growth rates have been calculated for themajority of developing countries. The selected "high"rate of growth of per caput GDP averages 4.1% fordeveloping countries and 4.3% for developing market
Actual
Trend assumption High assumption
GDP Projected CompoundProjected GDP Compound rates of growth
GDPrates ofgrowth
1970 1985 I 1990 1960-70 1970-85 1970-90 1985 1970-85
ThousandThousand million U.S. dollars1 Percent per annum . . . .
m illionU.S.
Percent perannum
dollarst
DEVELOPED AIARKET ECONOMIES 2 112 4 058 5 100 5.0 4.5 4.5North America 1 072 1 924 2 352 4.1 4.0 4.0Western Europe 779 1 485 1 880 4.9 4.4 4.5Oceania 41 87 116 5.1 5.2 5.3Others 220 562 752 10.5 6.4 6.3
EASTERN EUROPE ANO U.S.S.R. 2 599 1 475 2 012 6.5 6.2 6.2
Total developed courarles 2 711 5 533 7 112 5.3 4.9 4.9
DEVELOPING MARKET ECONOMIES 388 974 1 352 5.2 6.3 6.4 1 087 7.1(excluding oil exporters) (318) (721) (970) (5.1) (5.6) (5.7) (816) 6.5
Africa 44 104 142 4.0 5.9 6.0 114 6.6Latin America 152 372 510 5.5 6.1 6.2 416 6.9Near East 55 206 314 7.0 9.3 9.1 220 9.7Far East 137 292 386 4.8 5.2 5.3 337 6.2
ASIAN CENTRALLY PLANNED ECONOMIES2 . . 130 234 285 2.8 4.0 4.0 258 4.7
Total developing countries 518 1 208 1 637 4.6 5.8 5.9 1 345 6.6
World 3 229 6 741 8 749 5.2 5.0 5.1

economies, against "trend" rates of 3.3% and 3.5%respectively." The differences in patterns of fooddemand implied by this alternative serve as an in-dicator of the sensitivity of demand to variations inincome growth around the "trend" rate in thesecountries.
For working purposes it is assumed that domesticand international prices of food commodities remainunchanged in relative terms during the projectionperiod. Consequently, since the requirements ex-pressed in terms of commodities do not allow forpotential changes in food consumption patternscaused by changes in relative prices, they are, inthis sense, not to be regarded as forecasts of actualfuture consumption.3' However, if the substitutionof one commodity for another were to occur becauseof changes in price relationships, the impact on totalfood demand expressed in calories or protein wouldbe less marked.
It should also be noted that the projections reflectthe average situation in a country or a group ofcountries. The results therefore do not take intoaccount inequalities in income distribution and hencein effective demand within countries. For thisreason, supplementary estimates are made of theadditional food requirements which, on the basisof specified assumptions, might be necessary to meetsevere nutritional needs that would persist despiteimprovements in average standards of living.
FOOD PRODUCTION TRENDS
It is far more difficult to assess the rate of growthof food production than that of food demand. Therange of potential outcomes is much wider, owing tothe possible changes in agricultural technology, infarm structure, and in quantity and quality of inputsand services available to farmers, in price policiesand guarantees and in international markets. Takinginto account these and many other significant factorswould involve introducing an unjustifiable amountof subjective judgement.
Consequently, some other approach must besought, at least to form an initial picture. Probablythe approach which involves the least subjectivityis to assume that in the coming fifteen years tech-nological innovations in farming will continue atabout the same rate as in the past and that therewill be no major policy changes on the part of gov-ernments. What policy changes might be desirable
30 The high-income assumption for 1985 refers to th3 maximumgrowth rate that is compatible with the assumption, made forthe Second United Nations Development Decade.
31 Some substitution effects arising from shifts in consumerpreferences (e.g., from butter to vegetable oils in developedcountries) are introduced into the model through a trend factor.See FAO Agricultural commodity projections, 1970-1980, Vol. II,CCP 71/20, Rome, 1971.
129
was the main theme of the United Nations WorldFood Conference (see p. 43).
If this approach is adopted, a trend of growthmust be extrapolated from some past period. Thebase period should be as representative as possible,although the choice inevitably includes an elementof personal judgement, and a slight difference in baseperiod can produce a significantly different projectedtrend rate of growth. A number of alternativeswere carefully considered before settling on the baseperiod 1961-73, which was selected for severalreasons. As for the starting date, any earlier spanof years would have given a period weighted tooheavily by conditions of the past; a later initialdate would not have given a long enough time spanfor calculating trends and might have been tooheavily weighted by the very recent past. As forthe choice of tettninal year for the base period, both1970 and 1973 were considered, but since in a purelystatistical sense the 1971 and 1972 seasons werenot untypically bad and fell, rather, within theto-be-expected limits of fluctuations, it seemed pref-erable to select 1973, which provided a longer base.Thus, unless otherwise stated, all production ex-trapolations are derived from the 1961-73 trends.It must be repeated that no base period is ever fullyrepresentative: the one used here contains four badseasons (1965, 1966, 1971 and 1972) out of twelveand therefore the production trends may be somewhatconservative insofar as climatic influences are con-cerned.
For extrapolation of total food production, ex-ponential growth rates have been used. These rates(constant yearly percentage growth) give results nec-essarily higher than those derived from linear trends(constant annual growth in volume).32 For instance,the extrapolation of world food production (includingfeed) gives a 2.7% exponential growth rate as com-pared with 2.1% when based on linear trends. If theextrapolations were based on the trend over theperiod 1961 to 1970, rather than to 1973, the ex-ponential growth of production would be two pointshigher: 3% in place of 2.8% for developed countriesand 2.8% instead of 2.6% for developing countries.
Extrapolations were made of (a) the indices oftotal food and feed production for sixty-four coun-tries that account for 85% of the world populationand (b) the quantities of production of selectedcommodities or groups of commodities for countrieswhich together account for the great bulk of worldproduction; also, estimates were added for the ag-gregate production of countries not covered indi-vidually. The mathematical extrapolations for major
32 A weighted linear trend was so close to the unweightedlinear trend that it has not been presented separately.

commodities were reviewed and adjusted in someinstances, where the rates of growth appeared to beunusually high or low when considered in long-termperspective. While the trend .rate of growth was
Possibilities for increasing production
More food will need to be prod.uced in the devel-oping countries of the world if the combined goalsof better nutrition and economic development areto be achieved. If the past trends of productionin these countries were to continue, these goals wouldnot be attained and many nations would face acritical situation. The aims of this section are topoint out the potentialities for "closing the foodgap" and to present some of the main directions ofthe needed programmes. It is equally important toensure that increased food production also leads toimproved consumption and nutrition of the vastnumbers of undernourished people in developingcountries. Emphasis on increased food productionalone, without due consideration of its distributionamong different socioeconomic groups, obviouslydoes not tackle the serious problem of poverty andundernutrition. Both national production policiesand food and nutrition policies need to includespecific programmes for achieving nutritional objec-tives. Thus, an important aim of production policiesand programmes could be that of encouraging andenabling small farmers, through appropriate institu-tions and incentives, to participate acti.vely in theprocess of increasing food production so that withhigher productivity and incomes their food consump-tion levels would improve. Furthermore, while theprocess of increasing food production may create ad-ditional employment opportunities for rural workers,special nutrition campaigns wi.11 still be necessary.,particularly to reach the vulnerable groups in bothurban and rural areas.
To date, the most detail.ed and comprehensive as-sessment of the developing world's food productionpotential has been presented in FAO'S Indicative WorldPlan for Agricultural Development (iwp). The factthat the actual production performance in the devel-oping countries is not meeting the IWP targets for1975 and 1985 does not mean that the latter wereunrealistic. From a critical reexamination of the IWPmaterial it emerges that the targets are indeed attain-able provided that the following conditions can besat:isfied: (1) governments must succeed in mobilizingand allocating adequate financial and other resources;(2) governments must accelerate the institutionalchanges which are essential to support rapid agricul-tural development, particularly training programmes
130
derived from the period 1961-73, in order to havea common time base for projections of both demandand supply, the starting point for the productionextrapolations is the 1969-71 average.
to overcome the shortage of technical and adminis-trative personnel at all levels and programmes toreach larger numbers of small farmers and landlesslabourers; (3) political stability must be sufficient topermit orderly progress; and (4) a satisfactory volumeof international assistance and support must beforthcoming. However, the enormous effort, commit-ment, and investment required can only be realizedthrough crash programmes at enormous costs, whichcannot be sustained indefinitely; it is therefore nec-essary to adopt simultaneously measures to reducepopulation growth.'"
Agricultural inputs
The major potential for future increases in pro-duction lies in increased yields per unit of land. Ina number of large countries where population pres-sure has already brou.ght nearly all usable land under:production, this approach indeed offers the onlypotential for substantial production increases.
Whereas the achievement of higher crop yieldsdepends on a combination of many factors, attentionis focused h.ere on four components of the packagewhich will be needed to support the drive for higheryields -- namel.y, improved seeds, fertilizers, plantprotection and farm credit. In addition, in manyareas farmers need more irrigation water a requi-site which is to be co.nsidered separately below. Theuse of improved seeds is the fundamental elementof the technological package. Fertilizers and pesti-cides are at present in the forefront of discussionconcerning the future direction of agricultural tech.-nology owing to the energy crisis. Agricultural creditespecially directed to assisting small farmers is re-quired if they are to be able to purchase sufficientquantities of the above and other inputs.
33 The coordination of population and socioeconomic devel-opment policies is directly related to FAO'S work programme,particularly with regard to population aspects of research, train-ing and advisory work on agricultural development and planning;orientatio.. of rural development programmes toward populationobjectives; inclusion of population education and communicationin agricultural education, training, extension and related pro-grammes; collection of population information through agri-cultural censuses and food consumption and related householdsurveys; and projections of agricultural population and labourforce.

In recent years some of the success stories of high-yielding varieties (HYVS) of wheat, rice and maizehave generated hopes which have been dampenedby the realization that most of the new HYVS flourishin rather limited ecological areas and by the lackof breakthroughs in a number of other importantcrops. Many of the factors which were responsiblel'or the less than full success of already developedhigh-yielding varieties have been identified, and theproblems are on the way to being overcome. More-over, for a number of important crops such asoilseeds, tubers and pulses, all of which have a crucialrole in nutrition, as yet too little breeding workhas been accomplished. Yet, the world-level or-ganization of plant breeding, as it has evolved overthe past two decades through international centresworking in close cooperation with national researchstations, has proved its worth. With more resourcesin men and money the existing centres, some veryrecently established, together with new ones that maybe needed could help bring about dramatic yieldimprovements over much wider areas of the devel-oping world. Varietal improvement also offers op-portun.ities for increasing the quality of cereals, espe-cially the quantity and composition of their proteincontent. Recent breakthroughs (e.g., maize with ahigh lysine content) indicate the scope for increasingprotein availabilities for both human and animalconsumption.
One of the main bottlenecks to the rapi.d andsustained spread of HYVS has been the lack of acommercial supply of the improved seeds. Most de-veloping countries do not yet have a seed industrywhich could support a major d.rive for higher pro-ductivity, or they produce seed for a very smallnumber of crops. This situation has to be urgentlyremedied by introducing seed-multipl.ication pro-grammes.
In the short run, chemical fertilizers constitutethe most important single weapon in the food pro-duction battle. The per hectare use of these nutrientsin most developing countries is at present only onequarter, often less than one tenth, of what it is inmost developed countries; i.t is especially low inAfrica. Nevertheless, fertilizer consumption in de-veloping countries has been doubling every five yearsand is expected to continue growing at 11';',, peryear over the next decade. This rate of increasewould accelerate if supplies were to become availableat reasonable prices.
However, fertilizer prices have trebled and quadru-pled between 1971 and 1974, and at the momentthere is a worldwide physical shortage. Developingcountries depend on imports from developed coun-tries for at least half their req-uire,ments, and thedifficulties of the current supply situation promptedgovernments to agree, at the FAO Council's July 1974
131
session, to the setting up of an International FertilizerSupply Scheme, including a fertilizer pool and otherarrangements to assist developing countries in cover-ing their minimum requirements. In the long,er run,massive expansion of fertilizer production capacityin developing countries is necessary, so that levelsof fertilize.r use will become high enough to take fulladvantage of HYVS and the planned extensions ofirrigation.
Even so, because fertili.zer p.rices in relation toother prices are likely to be higher than in the past,it may become important to examine how far fer-tilizer requirements per hectare can be reducedthrough improved methods of formulation and ap-plication, such as sulphur-coated urea and other slow-release mechanisms. The use of nitrogenase inhib-itors is a further possibility; nor should nitrogen-fixing legumes and a more efficient use of organ.icmanure supplies be overlooked.
Analogous considerations apply to the use of otheragricultural chemicals in, for example, plant protec-tion and weed control. While a much wider use ofthese products could contribute substantially to in-creasing per hectare yields, it is also true that theycould be used with greater discrimination., thu.s ef-fecting economies in the quantities required. Forinstance, certain pests might be combated by othermeans such as the sterile rnale te.chniques, and muchweed control could be accomplished by hand, espe-cially in the many areas where farm labour is un-deremployed. Yet, the major thrust must be toward-familiarizing a larger proportion of the farmers ofdeveloping countries with plant protection practicesand by th.is means significantly reducing the wide-spread losses of crops which occur every year be-cause of pests, diseases and weeds.
The use of quality seed, of fertili.zers and of plantprotection materials on a sufficient scale is precludedin developing countries because most farmers do nothave enough money to 'buy these inputs. In southernAsia the average small farmer spends only US$6per hectare per year, when he should be spending$20 to $80 according to crop. If modern technologyis to be applied, farmers, especially small farmers,must have credit n.ot the extremely expensivefacili.ties provided by moneylenders, but insti.tutionalcredit, delivered and supervised in many casesthrough farmers' own organizations. The availabilityof credit on reasonable terms will also enable farmersto level their land and thus make better use ofirrigation water, as well as to purchase pumps andother mechanical equipment and tools. A limitingfactor at present is the insufficiency of financial re-sources in developing countries. The World Bank.and other bodies have already initiated programmesto support the credit institutions in developing coun-tries, but such activity could be greatly expanded.

The scope for increasing yields through the variousagricultural inputs is enormous. Of course, differ-ences in performances depend not solely upon theuse of material inputs but also upon levels of farmmanagement and services supporting agriculture, aswell as on climate and other factors; yet, closing theyield gap by only half would make a major con-tribution to the developing countries' food production.
Water and land resources
Another important agricultural input is water. Atpresent only 93 million hectares of the 740 millionhectares of arable land in developing countries areunder irrigation, and of this irrigated area a largeproportion is in the Far East. Almost half of itrequires renovation and improvement. Furthermore,much of the water available in irrigation schemes isunderutilized for lack of attention to land levelling,field distribution, drainage systems and regulatoryservices. Improved drainage can check and largelyeliminate the degradation of irrigated land throughsalinity. Because the water is being ineffectively used,crop yields are much less than they could be.
In the short run the most profitable returns canbe obtained by devoting money to the improvementof existing schemes. Beyond this, in many countriesnew sources of water can be tapped most cheaplyby utilizing groundwater supplies. The constructionof large dams, which are generally expensive, re-quires thorough preliminary investigation of costsand benefits. In the long run the mobilization ofnew water resources should allow the irrigated landof developing countries to be increased by some 50%,but because this will be costly, a better knowledge ofthe resources must first be secured. Such knowledgecombined with information on land capability andclimate could be the core of a world survey of ir-rigation potentials.
As for the mobilization of additional land for foodproduction, while in some developing countries thepractical ceiling on land development may have beenreached, in a large part of the developing worldthere remain land resources which are either unuti-lized or utilized in productive processes giving verylow returns. The largest "land reserves" in the devel-oping world are in Latin America, Africa and in partsof southeast Asia. All of these regions suffer fromspecific limitations, often associated with high rainfalland high temperatures, but since modern technologyis increasingly able to cope with such problems,some very major development programmes for put-ting additional land under cultivation may be ex-pected in these regions.
Many of the other tropical high-rainfall areas aredifficult of access and expensive to exploit, which
132
points to a need for selective and step-by-step de-velopment of their potential. Land capability sur-veys using remote sensing techniques would indicatewhere to begin. Opening-up programmes would haveto include new soil management policies to copewith many of the still only partially solved problemsof high leaching, high soil temperatures, high lossof organic matter and the like. Altogether it shouldbe possible to increase the arable area of develop-ing regions from the 737 million hectares of 1970 tonearly 900 million hectares by 1985.
The potential contributions of water and new landsto the expansion of food production are no doubtvery great. The influence of better use and largersupplies of water on crop yields is hard to quantifybecause of the subsequent opportunities for wideradoption of HYVS and more intensive application offertilizers; but it is an essential component of themajor increase in per hectare yields which the de-veloping countries should be able to achieve. Theproposed 20% expansion of arable area should addmore than 20% to agricultural output because thenew areas should, on the average, be better fannedthan the existing arable lands. The magnitude of thetask can be understood by reference to the likelyinvestment requirements. For the three tasks of ren-ovating existing irrigated areas, developing new ir-rigation schemes and bringing new land under cul-tivation the combined cost is estimated at close toUS$90 000 million, of which about one third might bethe foreign exchange coniponent. Not all of thiscould be spent by 1985, as the more ambitious landand water schemes will take time to prepare andexecute, but the annual rate of investment (nationaland international combined) will certainly need tobe stepped up to the range of $8 000-8 500 millionif these potentials are to be exploited fast enoughto meet the rising demand for food.
The development and preservation of the naturalresources on which agricultural production is basedare of increasing concern throughout the world today.More means will have to be allocated to soil andwater conservation in the future, not only becauseof their role in preventing resource degradation, butalso because of their contribution to increases inproduction, especially in marginal areas where theother weapons of modern agricultural technology areoften not so relevant, as it is these areas, includingthe Sahelian zone, which contain the highest propor-tion of poverty-stricken people and the least devel-oped economies.
Livestock
The livestock sector merits particular attention indeveloping countries because the projections show

effective demand for livestock products rising byover 4.4% per annum into the 1980s. Without doubt,the potentialities in this sector are enormous, giventhe very low levels of efficiency which characterizeanimal husbandry in most of these countries, apartfrom a few outstanding exceptions.
Three overall considerations apply to all livestockproduction systems, whether they rely mainly onroughage or on grain. The first consideration isthe need to improve health conditions through im-proved veterinary services, advice to farmers, andavailability of required inputs. An increasing shareof such sanitary measures will have to extend acrossnational boundaries, as the benefits from continent-wide control of major epidemics are high.
The second general consideration is the geneticimprovement of all animal stocks. Here, just as incrop production, the direction of policy is to provideanimals with a high genetic capacity and then togenerate the health conditions, managerial skills andfeed base which will permit full use of the highcapacity. In fact, the success of genetic improvementlargely depends on the improvements in the feedbase which can be achieved.
Thirdly, improvement in the feed base will haveto relate to all three of its major components indeveloping countries. The first of these is naturalgrassland, which provides a large share of the suste-nance of both bovine and sheep and goat populations.The grasslands of the developing world are perhaps,at once, the most overutilized and underutilizedresources in agriculture. Overstocking causes furtherdegradation of the pastures, while there exist far-reaching unused possibilities for raising the produc-tivity of pastures through man-made changes in theircomposition for instance, but not exclusively, inthe semiarid areas. Also, a large part of the feedfrom these pastures goes to animals which are verypoor converters and kept under traditional low-efficiency systems of husbandry.
Again, as with fertilizers, it is the developing coun-tries which are and will continue to be facing thegreatest difficulties in assuring supplies of concen-trates, because most of them do not have enoughdomestic cereal production to spare much of it forlivestock, and because most of the other componentsof concentrates have to be imported.
One major potential area for expansion of cattleproduction may be the high-rainfall belt of tropicalAfrica, where the tsetse fly and other causes ofdisease have kept large areas out of production.It is estimated that if trypanosomiasis were broughtunder control, the pasture of the savanna area in-fested by the tsetse fly would support a supplemen-tary cattle population of about 120 million head,which could produce 1.5 million tons of meat, rep-resenting a value of at least US$750 million; a
133
substantial part of this land would also become avail-able for crop production. In order to reach thisgoal an important financial effort would have to bemade by all interested organizations: a twenty-yearcampaign costing something of the order of US$2 000-2 500 million, but only about US$30 million a yearin the first five years.
To sum up, priority needs to be given to im-proving the production capacity of livestock herds,with less emphasis on increasing the number ofanimals. Sociological customs and practices oftenentail the maintenance of large numbers of unproduc-tive animals since, in such cases, numbers rather thanquality are significant. In not a few instances whereunproductive animals are pressing upon too meagrefeed supplies, the first step should be to decreasenumbers rather than increase them. Finally, muchmore of the world's unused land could be mobilizedfor raising cattle and sheep, and much of the world'slivestock could become far more productive throughbreeding, nutrition and health programmes.
The second major feed component which supportslivestock production and needs substantial improve-ment the roughage obtained from crop produc-tion. For the future it will be important that agrowing share of these be cultivated fodders withthe aim of providing animals with a much higher-quality roughage for high levels of productivity. Theefforts toward increased fodder production will haveto be linked with the development of lands underirrigation or under high-rainfall conditions, wherethey can be part of intensive systems of land use;also in lower-rainfall areas they can replace fal-lows in cereal rotations. Research, technical adviceand availability of relevant inputs need to be themain components of such a fodder developmentprogramme, often requiring the transfer of technol-ogies from distant parts of the world. Supplies canalso be augmented by mobilizing the by-productsof the food industries, many of which are wasted,such as molasses or wastes from the fruit-growingindustry or from other industrial crops. Even lig-neous products such as husks, straw and bagasse maybecome useful feeds after treatment by chemicals,heat or microbes.
The third important component of the feed baseconsists of grains and other concentrates, and it isin this area where the most dynamic changes aretaking place. While the shortage of feedgrains andoilseed meal and cake may be temporary, that ofconcentrates such as fish meal may not. If thisproves to be so, added stimulus will be given to theresearch for other nonagricultural sources of proteinfor incorporating into animal feeds. Examples areurea (a morganic nitrogenous product converted intoprotein through the action of the ruminal microbialflora), which is already in commercial production in

a number of countries, and single-cell protein derivedfrom petroleum, for which commercial plants areunder construction in at least two European countries.
Fisheries
Measures aimed at increasing the contribution offish to world food supplies cover a wide range ofactivities concerning management and development.The IWP estimated that the annual potential yield ofconventional marine species of fish, crustaceans andmolluscs was about 118 million tons, and subsequentassessments have confirmed this figure of well over100 million tons. At the time the estimate was made(1965) the world catch of such species was some 43
million tons, or 36% of the potential yield, but by1972 catches liad increased to 50% of the potential.Although this implies that the world catch of thesespecies can still be approximately doubled, this isnot true for all species an increasing number ofwhich are becoming fully or excessively exploited,thus diminishing the potential. Moreover, recent yearshave seen the fairly dramatic collapse of a numberof major fisheries, due at least in part to excessivefishing, and it is clear that management action isneeded if many stocks are to continue to providethe basis for commercially viable fisheries.
Greater utilization of those areas and stocks ofconventional species of fish which have not yet beenheavily exploited requires action in the fields ofmarketing and distribution, as well as the introduc-tion of modern fishing techniques to traditional fishingcommunities. Some stocks, such as those within theIndonesian archipelago, have remained lightly ex-ploited, as they are too scattered and mixed to beof interest to large long-range vessels, but cannot asyet be harvested by the traditional local vessels.Other stocks, such as those in the northwest IndianOcean or the southwest Atlantic, have so far notattracted much attention because of their distancefrom the main consuming centres, and because, forthis reason or others (e.g., the burden of licence feesfor fishing within exclusive fishery zones), the costof harvesting has deterred the long-range fleets ofnoncoastal states. For whatever reason stocks haveremained unexploited, they will in many cases alsobe unfamiliar to consumers and will thus requireprocessing into familiar products. For example,squid and other cephalopods, highly prized andheavily fished in some areas, but little regarded andalmost unexploited in others, could be caught inseveral times the present numbers if appropriatemarket outlets were found.
A possible means of increasing the supply of fishfor direct human consumption lies in the diversionto the food-fish market of those species now used
134
predominantly for fish meal. Although there isalready evidence of this trend with such species asherring and Alaska pollack, care must be takento ensure that steps in this direction do not have adisruptive effect on markets, as even now largequantities of certain species are being converted tomeal in relation to the existing market for thesespecies for direct human consumption.
Supplies could also be increased by reducing thevery high wastage. Steps could be taken to retainfor marketing much of the "trash" fish at presentthrown back into the sea (e.g., the finfish taken byshrimp trawlers) and to prevent the heavy lossesfrom bad handling, preservation and storage afterlanding. It is estimated that the quantities of fishlost in these various ways amount to several milliontons annually.
In the longer run it may be possible to augmentworld food supplies by harvesting less familiar typesof marine animals, such as krill in the Antarcticand lantern fish in the warmer oceanic waters. Theharvesting and marketing of these animals on acommercial scale present formidable technical prob-lems, but if these were overcome, the potential foodsupply from the world's oceans could be increasedseveral times. Perhaps nearest to realization is thecommercial exploitation of krill, the food of Antarcticwhales, which has recently been marketed in theform of fish paste in the U.S.S.R., although it hasso far remained unutilized elsewhere.
For the foreseeable future the bulk of world fish-ery, especially in developing countries, seems likelyto remain based on the more conventional typesof fish. Maximum utilization of these resources,however, implies management measures to maintainyields of the more heavily fished species. Inter-national agreement in these matters remains difficultto obtain. Furthermore, it seems unlikely that theLaw of the Sea Conference, whatever its eventualoutcome, will provide a solution to these problems,since fisheries under national jurisdiction have notbeen conspicuously better managed than internationalfisheries; nevertheless, such rational management isessential, especially since by 1985 most of the con-ventional types of fish will be exploited to the limit.
As the possibilities of increasing supplies fromwild stocks of fish diminish, attention is being in-creasingly directed to the cultivation of fish. Presentproduction from aquaculture of fish, crustaceansand molluscs amounts to some 6 million tons, orroughly 10% of world fish production. In the im-mediate future the best prospects for increasedoutput lie in the tropical areas of Africa and Asia,particularly the latter, where aquacultural practiceis well established and the species cultivated areconsumed by the lower-income groups. Further in-creases in production can be expected in the long

run from the incorporation of the results from re-search into commercial practice and the widespreadintroduction of methods now on the threshold ofcommercial adoption, such as culture in cages inopen waters. A most important requirement for thedevelopment of aquaculture (as well as the produc-tion of natural stocks in fresh water) is water ofappropriate quality, and attention will have to bepaid to the potentially harmful effects on fisheriesof flood control, waste disposal and other conflictinguses of water, including irrigation. What level ofoutput might be reached in ten or twenty years isdifficult to forecast, but clearly, given the necessaryeconomic incentives accompanied by appropriate in-vestment decisions, the technical means exist to meetprospective levels of demand.
Post-harvest losses
Food supplies could be augmented not only byreducing waste in fisheries (and likewise, to somedegree, in livestock products) but also to an im-portant extent by trying to minimize crop losses. Anumber of surveys have shown post-harvest losses offoodgrains of 20%, sometimes even reaching 40%,depending on crop and country. Losses occur allalong the line through poor management in harvest-ing, insect, rodent, and fungus damage in storage,poor-quality sacks and other containers, inexperi-enced handling in transport, inefficient or poorlymaintained milling equipment and faulty distributionof milled products. The use of extremely low extrac-tion rates to meet the presumed tastes of urban con-sumers means less food for humans and more feedfor animals, as well as a less nutritive end product.Avoidable losses also occur in the handling andprocessing of other crops, e.g., oilseeds, since inmany small factories an unnecessarily high proportionof oil is left in the by-products or, alternatively,a part of the protein contained in the oilseed mealcould be incorporated into foods suitable for humanconsumption. For perishable fruit and vegetables,wastage in distribution quite normally reaches 30to 40%.
These examples, of which there are many more,sufficiently indicate the scope for increasing foodsupplies through reduction of losses; but they alsosuggest that no single programme would have asignificant impact on the overall problem. Becausethe problems are various, their solution must besought through improvements in several directions.Among the most important are investment in modernstorage for grains and other crops both in villagesand in larger centres, better packaging materials andtransport facilities, modifications in the milling prac-tices for cereals and oilseeds, and, more generally,
135
efforts to modernize the organization of wholesaleand retail distribution.
Incentives and services
Production potentials can be more fully realizedonly if the producers are operating under conditionsof adequate incentives and supporting services. Forinstance, the price policies for farm products needto be formulated and implemented in such a wayas to fu( prices at incentive levels and to ensure thatsuch prices are actually received by farmers. Incen-tive level also implies that prices of farm productsmaintain a realistic relation to the prices of farminputs. It is sometimes supposed that farm-gateprices cannot be maintained at adequate levelswithout excessively raising food prices to consumers,the majority of whom in the developing countrieslack purchasing power. But this dilemma can bealleviated by investment in the modernization ofstorage, transport and distribution, thereby reducingthe costs added to the farm-gate prices before theproduce reaches the consumers' shopping baskets;food subsidies are also helpful in this connection.
In the areas of advisory services and education,there exist large potentials for improving com-munications between the experts and the producerscommunications which today are almost everywhereinadequate and in some extreme cases nonexistent.A number of imaginative new techniques of com-munication are being tried, and some of them maymerit widespread adoption. The major weaknessand failure of most extension and other field servicesare their inability to reach in any meaningful waythe vast numbers of small farmers and agriculturallabourers who, together with their families, formthe hard core of the present poverty and nutritionproblems. It often happens, in fact, that the re-sources channelled into agricultural programmes endup in the hands of the larger-scale, wealthier farmersand landowners, whereas policies and programmesthat directly benefit the smaller-scale poorer farmersand agricultural workers are needed.
Most of the possibilities sketched in the precedingparagraphs assume a continuation and, indeed, anintensification of agricultural research. For example,it was the many years of patient research by plantbreeders and their colleagues in related disciplineswhich produced HYVS of wheat, rice and maize,and it is on them that the world relies for furtherHYVS of these crops adapted to a wider range ofecologies, for HYVS of other important crops andfor possible "man-made" new crops, such as triticale.Research will need to be expanded to solve theproblems of cultivating tropical soils, so as to im-prove the performance of ruminants in tropical cli-

mates and increase supplies of grass, roughage andother feeds. Possibly the fruits of conventional re-search will be sufficient to sustain the expansion ofagricultural production until around 1985, but afterthat, as world population continues to increase, morefundamental innovations will be needed: new "geneticengineering" and propagation techniques, widespreaduse of single-cell protein as animal feed, improve-ment of the photosynthetic efficiency of plants andbasic aspects of radiation technology. As has oftenbeen said, the sum total of today's known technologyis probably less than one tenth of that which will beavailable in the year 2000.
Mobilizing the rural population
In the agricultural sector, human potential is justas important as the natural resources potential, asfarm producers are, in essence, the world's mostprecious resource. The first precondition for anyprogrammes aimed at resolving the problems of foodproduction is that they reach the farm producersthemselves. Without the willing and active collabo-ration and more effective mobilization of farmersno progress can be made. There have been and stillare many attempts, which have met with varyingdegrees of success, to involve rural people in theprocess of development. As yet, there is no clear-cutsolution, nor is it likely that any single approachwill be relevant to all developing countries becauseof the diversity of their social structures.
Nevertheless, certain features which will probablycharacterize the rural mobilization process in manycountries can be distinguished. For example, actionto democratize landholding structures, includingagrarian reform, will in many cases constitute a
Major policy implications
The food crisis of the last three years has dramat-ically drawn attention to both the interdependenceof production, trade, stocks and prices and the seriousunpreparedness of the world as a whole to contendwith the vagaries of the weather. From time totime adverse weather may strike large areas of theworld in a single year, and when this occurs thegovernments of affected countries must turn abruptlyto the world market with the hope of making up fortheir harvest shortfalls. But when many governmentsdo this simultaneously, or when one governmentmakes purchases on a very large scale, world stocksmay quickly disappear. The current crisis has dem-
136
necessary component, but such action may be coun-terproductive unless it is followed by efforts to or-ganize small-scale farmers into viable institutionsand to give them access to technical and financialinputs. The problems of the very small farmers,which constitute the nucleus of the developing coun-tries' food production problem, cannot be resolveduntil they group themselves into larger units for atleast some of their activities. An acceleration of thetransfer of modern agricultural technology cannotcome about simply by multiplying the number ofbureaucrats in rural areas; instead, rural people needto be organized to do things for themselves inimproving their farms, in creating supplementaryrural employment and in modernizing their villages ---so that they voluntarily request advice rather thanhave it thrust upon them. Through these methodsthe rural communities are more likely to acquireboth the desire and the capacity to accelerate therate of growth of food production.
All in all, it can be concluded from the examplespresented above that the insufficient growth rates ofproduction, in developing market economy countries,extrapolated up to 1985, could be significantly ac-celerated by better exploitation of the existing phys-ical and human resources. Some of the programmesto achieve this will have a long gestation periodbefore they produce results; others could accomplishsignificant transformations well before 1985. Somewill require large amounts of investment; others canbe realized by setting up or improving appro-priate institutions. The attack should begin simul-taneously on many different fronts. What is certainis that man has the knowledge and the organiza-tional ability to harness all these resources muchmore effectively than in the past.
onstrated that the reserves held by the nations of theworld are no longer sufficient to meet such aneventuality. This actual and potential enlargementin the scope of world trade in foodgrains requiresthe evolution of a new system of exchange of dataand information, more effective food reserve policies,flexible trading arrangements and harmonious adjust-ment policies.
The need for international action was voiced in1973 by ECOSOC at its 54th Session and by the FAOConference at its 17th Session. An InternationalUndertaking for World Food Security, prepared byFAO and revised by an intergovernmental working

party in May 1974, was endorsed in principle bythe FAO Council during its 63rd Session in July 1974.After final adoption by the FAO Council in No-vember 1974, with the report of the FAO Com-mittee on Commodity Problems and the views andrecommendations of the United Nations World FoodConference having been taken into account, the finaldraft of the undertaking was formally submitted toindividual governments, inviting their adherence.The central feature of this international undertakingis the adoption by individual countries of nationalstockpiling policies which will, in aggregate, maintainat least a minimum safe level of basic foodstocksabove all, cereals for the world as a whole.
Sometimes, as has happened recently in the Sahe-lian zone and Ethiopia, adverse weather limited toparticular countries or groups of countries causesfood emergencies. In such circumstances the estab-lishment in each country of national food reservescan help prevent acute shortages especially sinceinadequate transport facilities for bringing neededsupplies to affected areas often prove to be a majorbottleneck. To deal with emergency needs whichare too large to be covered by the national stocks ofaffected countries, some form of international emer-gency food reserve earmarked for such purposes ap-pears to be required.
Another issue that needs to be examined concernsthe future role of food aid and the ways of ex-panding it to meet part of the deficit of developingcountries, a gap which commercially financed im-ports could not entirely fill. The usefulness of foodaid has been demonstrated by its important con-tributions to development, nutrition and employment.But it could be undertaken in a much more meaning-ful way, provided it is accepted that food aid willcontinue to be, at least for some time to come, anessential element of world food security and inter-national assistance for development. However, itseffectiveness in yielding the desired results will begreatly enhanced if the concept of forward planningis agreed upon and if there is some assurance of con-tinuity of food supplies at a minimum level, with theburden being shared between various countries on anequitable basis.
It is not only the possibility of severe fluctuationsin food supplies and the dangers of periodic familieswhich necessitate action. In many developing coun-tries, hunger and malnutrition are endemic amongthe lowest income groups, particularly in rural areasand, within these groups, especially among womenand children. The longer-term solution of this prob-lem lies in the elimination of poverty through higherand better-distributed incomes. However, this willtake time, and not all governments may be able toadopt the measures required to achieve this objectivewithin a reasonably short period. In the meantime
137
there are many opportunities for direct short-termaction to ameliorate the nutritional condition ofchildren and other vulnerable groups. A reorienta-tion of government programmes in this field andthe inclusion of adequate food and nutritional oblx-tives in national development plans would certainlyhelp diminish hunger and malnutrition.
The most fundamental conclusion arising from theassessment is however the need for the developingcountries to accelerate their food production suf-ficiently to meet the rising requirements of rapidlygrowing populations. In the preceding decade, de-spite successful efforts in several countries to in-crease agricultural productivity, the food deficits ofdeveloping countries as a whole have given rise tolarger import requirements. The analysis has alsoshown that if recent trends of demand and supplywere to continue, the food deficit of most developingcountries would increase further. A staggeringly largevolume of cereal and other food imports would beneeded by 1985 to meet these deficits, and there isno likelihood of transfers on such a scale beingfinanced by the international community. Thus theonly viable solution in the long run will be increasedfood production within the developing countriesthemselves.
One of the most important elements in any pro-gramme to increase food production and to sustainthe momentum of the "green revolution" is theadequate availability of crucial inputs, especiallyfertilizers. The present shortages and high prices offertilizers have clouded the prospects of increasingfood production at a sufficiently fast rate in manydeveloping countries. An important policy issuewhich needs urgent consideration is how to dealwith the short-term crisis in supplies.
Another conclusion which clearly emerges is thatthe developing countries do have the potential toproduce much larger quantities of food. In manyparts of the world there are large, untapped landand water resources that can be mobilized in orderto expand the volume of food production and closethe potential food gap in developing countries. Toexploit these resources will however require massiveinvestment, running into thousands of millions ofdollars per annum for the developing countries asa whole, to create access to cultivable lands in remoteareas, to harness rivers and underground water forirrigation, to finance research in plant breeding, soilmanagement, plant protection, animal husbandry andmany other technical problems of tropical and sub-tropical farming, to modernize marketing, to reducewaste and to build up the working capital and in-stitutional capacity for a greatly expanded flow ofcredit, particularly to the small farmer.
But increased food production by itself may notlead to corresponding increases in consumption, par-

ticularly of the lowest income groups, unless invest-ment programmes are complemented by programmesto provide farmers with new techniques and otherinputs together with programmes for employmentand integrated development of rural areas. Alongsidethe classical and often costly approaches of extension,new techniques will have to be more widely tried formobilizing the energy and enterprise of the millionsof small-scale food producers in socially meaningfulinstitutions.
While these efforts to increase food production byincreasing investment in agriculture and improvingrural institutions and structures are being initiated,the problems of meeting a fluctuating demand forfood imports from developed and developing coun-tries will have to be tackled.
How can food-exporting countries, developing aswell as developed, meet these demands on their agri-cultural resources? How can the transfer every yearof a volume of food imports far exceeding the devel-oping countries' capacity to pay be financed? Theseissues might have to be dealt with from several anglessimultaneously: price stabilization schemes, removalof trade barriers, special preferences extended toagricultural products, more flexible commodity agree-ments and financial consortia for especially weakcountries.
These interrelated aspects of production, trade,stocks and prices are of interest to all countries,
138
developed and developing. Consumers in every coun-try want some guarantee of supplies at reasonableprices, while producers need market outlets andprices which will cover their production costs andprotect their incomes. Fluctuations in supplies andprices cannot be eliminated altogether, and attemptsto totally prevent them through rigid internationalarrangements are not likely to succeed. At the sametime the security of world food supplies cannot beleft entirely to haphazard market forces. There isneed, rather, for some broad parameters of objectives,policies and approaches within which market forcescan operate, but which at the same time can ef-fectively deal with situations of extreme fluctuationsin prices and supplies through flexible arrangements.
The above represents only a few of the policy im-plications which emerge from the foregoing analysisof the world food crisis. They are sufficient to in-dicate two main points. First, it is entirely wit'ninman's capacity to solve the food problem in bothits short- and its long-term aspects; the tools forthe job are available, even if some of them needimproving. Secondly, however, a prodigious effortfor the mobilization of resources physical, financialand human is called for, based on the realizationthat human society is indeed confronting in foodand population two of the most crucial problems thathave been of fundamental importance throughout itshistory.

139
Annex to Chapter 3
TABLE 3-A. - RATES OF GROWTH OF POP ULM ION, FOOD PRODUCTION AND DOMESTIC DENIAND, SHOWING PER CAPUT SUPPLIES OF ENERGYAND PROTEIN, FOR INDIVIDUAL COUNI RIES
Annual rates ofgrowth Per caput daily Annual rates of
growth Per caput daily
Dom- Dom-Food estic Pro- Food estic Pro-
Popu- pro- de- Dietary energy tein Popu- pro- de- Dietary energy tejolation duc- mand supply 3,4 sup- lation duc- mand supply 3,4 sup-
tion 1 for ply 3,4 tion 1 for PlY 3,4fO0d2 , 3 fO0d2,3
Percent5 Percent Percent5 PercentKilo-
caloriesof
require-G.'a" Kilo-
caloriesof
require- "'rams',lent° ment6
DEVELOPED Angola . . 1.8 2.7 3.0 2 000 85 42COUNTRIES Argentina . . 1.7 1.8 2.0 3 060 115 100
klbania . . . . 2.8 3.6 4.6 2 390 99 74 Bangladesh 7 3.5 7 1.6 . . . 1 840 80 40kustralia . . . 2,1 3.7 2.4 3 280 123 108 Barbados . . . 0.6 -0.1 . . . . . . . . . . . .
kustria . . . . 0.4 2.5 1.1 3 310 126 90 Bolivia . . . 2.3 5.0 2.7 1 900 79 46Belgium-Luxem- Botswana . . . 2.0 23 . . . 2 040 87 65
bourg . 0.6 2.1 1.2 3 380 128 95 Brazil 3.0 4.4 4.0 2 620 110 65Bulgaria . . . . 0.8 4.3 2.8 3 290 132 100 Burma . . . . 2.2 2.4 3.3 2 210 102 50Canada . . . . 2.2 2.2 2.5 3 180 129 101 Burundi . . . 2.0 2.4 2.4 2 040 88 62Czechoslovakia 0.9 1.8 1.9 3 180 129 94 Cameroon . . . 1.8 3.3 2.5 2 410 104 64Denmark . . . 0.7 1.6 1.3 3 240 120 93 Central AfricanFinland . . . . 0.8 2.4 1.1 3 050 113 93 Republic . . 1.8 2.8 1.1 2 200 98 49
France . . . . 1.0 3.0 2.0 3 210 127 105 Chad 2.1 0.9 1.2 2 110 89 75
3erman Demo- Chile 2.5 2.2 3.3 2 670 109 77cratic Republic -0.3 1.6 0.8 3 290 126 87 China 1.7 2.3 . .. 2 170 91 60
Liermany, Federal Colombia . . . 3.3 3.1 3.9 2 200 95 51Republic of . 1.0 2.5 1.9 3 220 121 89 Congo . . . . 1.9 2.2 3.7 2 260 102 44
3reece . . . . 0.3 4.0 2.3 3 190 128 113 Costa Rica . . . 3.8 5.4 4.8 2 610 116 66Hungary . . . 0.5 3.0 1.9 3 280 125 100 Cuba 2.2 1.1 2.0 2 700 117 63Ireland . . . . 0.1 1.7 0.3 3 410 136 103 Cyprus . . . . 1.1 5.4 2.3 2 670 108 6Israel 3.4 7.7 4.9 2 960 115 93 Dahomey . . . 2.3 1.5 0.1 2 260 98 56Italy 0.7 2.9 2.3 3 180 126 100 Dominicantapan 1.1 4.3 3.7 2 510 107 79 Republic . . 3.3 2.2 3.6 2 120 94 48Malta 0.1 3.2 1.2 2 820 114 39 Ecuador . . . . 3.3 5.4 4.0 2 010 88 47
Netherlands . . 1.3 3.0 1.7 3 320 123 87 Egypt 2.6 3.4 3.8 2 500 100 69
New Zealand . . 2.1 2.7 2.0 3 200 121 109 El Salvador . . 3.0 3.6 4.1 1 930 84 52
Norway . . . . 0.9 1.3 1.3 2 960 110 90 Ethiopia . . . 1.8 2.3 3.0 2 160 93 72Poland . . . . 1.4 3.0 2.3 3 280 125 101 Gabon . . . . 0.6 3.6 2.4 2 220 95 57
Portugal . . . 0.6 1.7 2.3 2 900 118 85 Gambia . . . . 1.8 4.4 ... 2 490 104 64
Romania . . . 1.1 3.2 2.7 3 140 118 90 Ghana . . . . 2.9 3.9 3.2 2 320 101 49iouth Africa . . 2.4 3.9 3.2 2 740 112 78 Guatemala . . 3.0 4.1 4.2 2 130 97 59
ipain 0.9 3.4 3.0 2 600 106 81 Guinea . . . . 2.0 2.0 3.4 2 020 88 45iweden . . . . 0.7 0.9 1.0 2 810 104 86 Guyana . . . . 3.0 2.5 3.6 2 390 105 58
;witzerland . . 1.5 1.7 1.9 3 190 119 91 Haiti 2.3 1.0 2.2 1 730 77 39U.S.S.R. . . . 1.5 3.9 3.0 3 280 131 101 Honduras . . . 3.3 4.0 4.2 2 140 94 56
'United Kingdom 0.5 2.8 0.7 3 190 126 92 India 2.1 2.4 3.0 2 070 94 52
United States 1.5 2.0 1.6 3 330 126 106 Indonesia . . . 2.5 2.0 2.6 1 790 83 38
Yugoslavia . . 1.2 4.5 2.4 3 190 125 94 Iran . . . . 2.8 3.3 5.4 2 300 96 60Iraq 3.3 2.8 5.2 2 160 90 60
DEVELOPING Ivory Coast . . 2.2 4.9 2.6 2 430 105 56COUNTRIES Jamaica . . . . 1.9 1.9 3.3 2 360 105 63
kfghanistan . . 1.9 1.7 2.2 1 970 81 58 Jordan . . . . 3.2 1.8 6.6 2 430 99 65Algeria . . . . 2.4 -0.8 3.4 1 730 72 46 Kenya . . . . 3.0 2.6 4.7 2 360 102 67

TABLE 3-A. - RATES OF GROWTH OF POPULATION, FOOD PRODUCTION AND DOMESTIC DEMAND, SHOWING PER CAPUT SUPPLIES OP ENERGYAND PROTEIN, FOR INDIVIDUAL COUNTRIES (concluded)
1 Food component of crop and livestock prodt ction o ly (i.e., excluding fish production). - 2 Ca ciliated on basis of growth ofpopulation and per caput income, and estimates of income e asticity of farm value of demand in FAO Agr'cultural commodity projections,1970-1980, Rome, 1971. - 3 Total food, including fish. - 4 1969-71 average. -- 3 Exponential trend, 1952-72. - 6 Revised standards ofaverage requirements (physiological requirements plus 10% for waste at household level). - 7 1962-72.
140
Annual rates ofgrowth Per caput daily Annual rates of
growth Per caput daily
Dom- Dom-Food estic Pro- Food estic Pro-
Popu- pro- de- Dietary energy tein Popu- pro- de- Dietary energy teinlation duc- mand supply 3,4 sup- lation duc- mand supply 3,4 sup-
tion 1 for ply 3,4 tion 1 for ply 3,4fO0d2,3 fO0d2,3
Percern5 Percent Perm, f 5 PercentKilo-alories
ofrequire- Grams Kilo-
caloriesof
require- Gramsment6 ment6
DEVERLOPINGCOUNTRIES
Rhodesia . . . 3.4 3.9 4.1 2 660 111 76Rwanda . . . . 2.6 1.8 1.9 1 960 84 58
Khmer Republic 2.8 3.5 4.3 2 430 109 55 Saudi Arabia . . 2.4 2.9 5.0 2 270 94 62Korea, Dem. Senegal 2.2 3.3 1.2 2 370 100 65
People's Rep. of 2.7 . .. ... 2 240 89 73 Sierra Leone 2.0 2.4 3.9 2 280 99 51Korea, Republicof
LaosLebanon
2.72.42.8
4.83.75.0
4.73.73.1
2 5202 1102 280
1079592
684963
Somalia . . .
Sri Lanka . .
SudanSurinam . .
2.22.52.93.1
1.13.64.3. ..
1.53.13.94.0
1 8302 1702 1602 450
799892
109
56486359Lesotho . . . 1.6 0.5 . .. ... ... Syrian ArabLiberia . . . 1.5 1.1 1.8 2 170 94 39 Republic . 3.0 1.8 4.6 2 650 107 75Libyan Arab
Republic .
Madagascar .
Malawi . . .
3.62.42.5
5.32.84.7
...2.13.7
2 5702 5302 210
10911195
625863
TanzaniaThailandTogoTrinidad and
2.43.12.3
3.15.35.4
3.04.62.4
2 2602 5602 330
98115101
635656
Malaysia (Wes ) 3.0 5.2 4.3 2 460 110 54 Tobago . . 2.5 1.9 4.8 2 380 98 64Mali 2.1 1.6 4.3 2 060 88 64 Tunisia . . 2.9 0.8 4.3 2 250 94 67Mauritania 2.0 2.4 3.0 1 970 85 68 Turkey . . 2.7 3.0 3.8 3 250 129 91Mauritius . . 2.6 1.3 3.0 2 360 104 48 -Uganda 2.4 1.8 3.2 2 130 91 61Mexico . . 3.4 5.3 4.3 2 580 111 62 Upper Volta . 1.8 4.7 1.2 1 710 72 59Mongolia . . 2.9 ... ... 2 380 106 106 Uruguay 1.3 0.8 1.2 2 880 108 100Morocco . . 3.0 2.8 3.3 2 220 92 62 Venezuela . . . 3.5 6.1 4.0 2 430 98 63Mozambique . 1.7 2.7 3.2 2 050 88 41 Viet-Nam, Demo-Nepal 1.8 0.1 2.1 2 080 95 49 cratic RepublicNicaragua 3.0 4.9 3.9 2 450 109 71 2 350 114 53NigerNigeria
2.82.4
4.12.0
2.23.1
2 0802 270
8996
7463
Viet-Nam,Republic of .
Yemen Arab2.5 4.3 3.2 2 320 107 53
Pakistan 3.0 3.0 4.2 2 160 93 56 Republic 2.4 -0.2 3.9 2 040 84 61Panama . . . 3.2 4.3 4.8 2 580 112 61 Yemen,Paraguay . . 3.1 2.6 3.4 2 740 119 73 Democratic . 2.4 1.6 -1.0 2 070 86 57Peru 2.9 2.9 3.9 2 320 99 60 Zaire 2.0 0.2 2.3 2 060 93 33Philippines 3.2 3.2 4.2 1 940 86 47 Zambia . 2.9 4.3 4.8 2 590 112 68

TABLE 3-B. - GgowTH RATES AND DENSITY OF POPULATION, GROWTH RATES OF PRODUCTION AND DEMAND FOR FOOD AND CEREALS,AND INSTABILITY INDICES OF FOOD AND CEREAL PRODUCTION FOR INDIVIDUAL COUNTRIES
141
Population 1 Density '2
All food Cereals
Production I Demand 3 Instabilityindex 4 Production I Demand 3 Instability
index 4
DEVELOPED COUNTRIES
klbania 2.8 3.8 3.6 4.6 10 5.1 2.7 23kustralia 2.1 0.3 3.7 2.4 11 4.7 1.8 43kustria 0.4 4.4 2.5 1.1 6 4.1 -0.9 13
3elgium-Luxembourg . . . 0.6 11.0 2.1 1.2 4 2.8 -0.5 II3ulgaria 0.8 1.9 4.3 2.8 8 4.4 -1.3 11
l'anada 2.2 0.5 2.2 2.5 12 1.6 1.4 28:zee hoslovakia 0.9 2.8 1.8 1.9 6 2.9 - 93enmark 0.7 1.8 1.6 1.3 3 2.8 -0.5 8'Inland 0.8 1.7 2.4 1.1 5 3.8 -0.7 17qrance 1.0 2.6 3.0 2.0 4 4.6 -0.7 83 erman Democratic
Republic --0.3 3.6 1.6 .8 6 2.3 -1.0 12
3 ermany, Federal Republic of 1.0 7.3 2.5 1.9 4 2.7 -0.1 11
3 reece 0.8 2.5 4.0 2.3 7 2.6 -0.6 15lungary 0.5 1.8 3.0 1.9 9 4.3 -0.5 19reland 0.1 2.6 1.7 0.3 4 0.8 -0.9 10
srael 3.4 7.0 7.7 4.9 6 3.1 2.0 56taly 0.7 3.6 2.9 2.3 5 1.1 -0.3 10
rapan 1.1 18.5 4.3 3.7 6 - 0.4 10
VIalta 0.1 20.0 3.2 1.2 9 -3.5 -0.6 15
letherlands 1.3 15.0 3.0 1.7 4 -0.2 0.1 12
1ew Zealand 2.1 3.7 2.7 2.0 2 8.2 1.6 19
\lorway 0.9 4.8 1.3 1.3 4 3.8 -0.1 21
'oland 1.4 2.1 3.0 2.3 4 2.6 0.3 10
'ortugal 0.6 2.2 1.7 2.3 7 - - 15
lomania I .1 1.9 3.2 2.7 13 3.4 -0.2 23
3outh Africa 2.4 1.7 3.9 3.2 10 5.0 2.2 29
>pain 0.9 1.6 3.4 3.0 6 2.4 -0.4 17
3weden 0.7 3.9 0.9 1.0 6 3.1 -0.4 203witzerland 1.5 15.6 1.7 1.9 3 2.1 -0.5 15
U.S.S.R. 1.5 1.7 3.9 3.0 7 3.3 -0.2 20United Kingdom 0.5 7.7 2.8 0.7 3 3.5 0.1 8
United States 1.5 1.2 2.0 1.6 3 2.6 1.0 9
Yugoslavia 1.2 2.5 4.5 2.4 20 5.4 -0.4 34
DEVELOPING COUNTRIES
Afghanistan 1.9 1.9 1.7 2.2 4 1.4 2.1 10
Algeria 2.4 2.0 -0.8 3.4 15 -1.3 3.1 51
Angola 1.8 6.1 2.7 3.0 1 2.5 2.8 15
Argentina 1.7 0.9 1.8 2.0 9 2.4 1.5 22
Barbados 0.6 9.2 -0.1 . . . 15 - -Bolivia 2.3 1.6 5.0 2.7 8 5.0 2.7 22
Botswana 2.0 1.2 2.3 . 18 5.2 155
Brazil 3.0 3.1 4.4 4.0 3 4.8 3.4 8
Burma 2.2 1.7 2.4 3.3 6 1.7 2.5 10
Burundi 2.0 3.0 2.4 2.4 8 4.3 2.4 15
Cameroon 1.8 0.8 3.3 2.5 6 2.2 2.5 14
Central African Republic . . 1.8 0.3 2.8 1.1 3 12.0 0.6 34
Chad 2.1 0.5 0.9 1.2 3 -1.8 1.6 8
Chile 2.5 2.1 2.2 3.3 6 2.0 2.9 12
China 1.7 7.7 2.3 2.2 . . . 2.1 2.0 4
Colombia 3.3 4.0 3.1 3.9 3 2.9 3.9 8
Congo 1.9 1.5 2.2 3.7 7 1.4 . . . 25
Costa Rica 3.8 1.8 5.4 5.4 5 3.2 4.5 25
Cuba 2.2 2.4 1.1 2.0 18 -1.4 2.0 31
CYprus 1.1 1.5 5.4 2.3 12 1.2 0.8 48
Dahomey 2.3 1.8 1.5 0.1 12 2.6 0.5 22
Dominican Republic . . . . 3.3 4.1 2.2 3.6 7 3.6 3.7 7
Ecuador 3.3 1.6 5.4 4.0 3 2.7 3.9 14
EgYpt 2.6 11.7 3.4 3.8 5 2.8 2.9 10
El Salvador 3.0 5.5 3.6 4.1 4 1.8 3.4 18
Ethiopia 1.8 2.0 2.3 3.0 2 3.3 2.7 3
Gabon 0.6 3.9 2.6 2.4 4 0.2 5.7 27
Gambia 1.8 2.9 4.4 . . . 12 3.8 . . . 15
Ghana 2.9 3.1 3.9 3.2 8 3.3 3.4 146

TABLE 3-B. - GROWTH RA I ES AND DENSITY OE POP U L ATION , GROWTH RATES OF PRODUCTION AND DEMAND FOR FOOD AND CEREALSAND INSTABILITY INDICES OF FOOD AND CEREAL PRODUCTION FOR INDIVIDUAL COUNTRIES (continued)
142
Population 1 Density '2
All food Cereals
Production 4 Demand 11Instability
4index Production I Demand 3 Instabilityindex 4
DEVELOPING COUNTRIES
Guatemala 3.0 3.5 4.1 4.2 4 3.5 3.4 9Guinea 2.0 2.6 2.0 3.4 4 4.5 3.2 19Guyana 3.0 0.9 7.5 3.6 7 1.8 3.4 19Haiti 2.3 13.2 1.0 2.2 2 1.3 7.2 3Honduras 3.3 3.1 4.0 4.2 5 2.6 3.6 7India 2.1 3.4 2.4 3.0 4 2.7 2.6 8Indonesia 2.5 3.8 2.0 2.6 6 2.8 2.6 11Iran 2.8 2.5 3.3 6.4 4 3.6 4.6 12Iraq 3.3 1.3 2.8 5.2 15 1.8 4.4 44Ivory Coast 2.2 0.6 4.9 2.6 10 5.7 2.7 29Jamaica 1.9 8.3 1.9 3.3 7 9.0 3.0 30Jordan 3.2 1.7 1.8 6.6 37 1.6 4.5 117Kenya 3.0 6.5 2.6 4.7 4 3.3 4.2 12Khmer Republic 2.8 2.4 3.5 4.3 14 2.7 3.6 20Korea, Democratic People's
Republic of 2.7 10.5 . . . . . . 3.4 4.3 13Korea, Republic of . 2.7 14.0 4.8 4.7 11 3.2 4.0 11Kuwait . . . . . . 3.2 . . . 8 . . .Laos 2.4 3.1 3.7 3.7 11 3.6 3.2 14Lebanon 2.8 8.4 5.0 3.1 9 -4.1 2.9 22Lesotho 1.6 2.7 0.5 ... 4 -0.7 . . 12Liberia 1.5 0.3 1.1 1.8 4 -0.5 1.6 14Libyan Arab Republic . . . 3.6 0.7 5.3 . . 17 3.0 . .. 93Madagascar 2.4 2.1 2.8 2.1 4 3.2 2.2 6Malawi 2.5 1.5 4.7 3.7 8 6.3 3.5 12Malaysia (West) 3.0 1.8 5.2 4.3 4 6.2 3.5 11Mali 2.1 0.4 1.6 4.3 6 0.2 3.2 15Mauritania 2.0 4.5 2.4 3.0 3 2.2 3.4 33Mauritius 2.6 8.0 1.3 3.0 30 . . . . . . . . .Mexico 3.4 2.1 5.3 4.3 3 6.4 2.9 sMongolia 2.9 ... . . . . . ... 12.7 2.9 54Morocco 3.0 2.8 2.8 3.3 19 2.7 3.1 49Mozambique 1.7 2.8 2.7 3.2 5 2.0 2.8 7Nepal 1.8 5.7 0.1 2.1 4 -0.3 1.9 6Nicaragua 3.0 2.3 4.9 3.0 5 3.8 3.5 13Niger 2.8 0.3 4.1 2.2 8 1.6 2.5 20Nigeria 2.4 3.1 2.0 3.1 4 0.7 4.0 17Pakistan (excluding Ban-
gladesh) 3.0 4.6 3.0 4.2 4 3.0 3.5 9Panama 3.2 2.6 4.3 4.8 5 1.1 3.9 12Paraguay 3.1 2.5 2.6 3.4 5 4.9 3.4 24Peru 2.9 4.8 2.9 3.9 4 2.4 3.6 10Philippines 3.2 4.5 3.2 4.2 3 3.4 3.5 6Rhodesia 3.4 2.9 3.9 4.1 2 0.7 4.0 33Rwanda 2.6 4.8 1.8 1.9 14 0.5 1.8 26Saudi Arabia 2.4 6.5 2.9 5.0 2 4.3 4.7 6Senegal 2.2 0.7 3.3 1.2 15 3.2 1.8 25Sierra Leone 2.0 0.7 2.4 3.9 3 3.6 3.6 24Somalia 2.2 2.9 1.1 1.5 4 1.1 1.6 111Sri Lanka 2.5 6.3 3.6 3.1 7 5.0 3.1 17-Sudan 2.9 2.2 4.3 3.9 7 4.0 3.6 32Surinam 3.1 10.3 . . . 4.0 ... 4.7 . . . 163yrian Arab Republic 3.0 1.0 1.8 4.6 22 0.2 3.5 72Tanzania 2.4 0.8 3.1 3.0 6 5.0 2.8 32Thailand 3.1 3.1 5.3 4.6 12 5.1 3.7 18rogo 2.3 0.9 5.4 2.4 11 2.9 2.4 10Trinidad and Tobago . . . 2.5 7.6 1.9 4.8 7 1.7 3.8 15Tunisia 2.9 1.1 0.8 4.3 21 1.0 3.7 38Turkey 2.7 1.3 3.0 3.8 7 2.2 2.1 18Uganda 2.4 1.7 1.8 3.2 3 3.6 2.8 11Upper Volta 1.8 1.0 4.7 1.2 13 5.5 1.5 13Uruguay 1.3 1.5 0.8 1.2 10 -1.7 1.2 34Venezuela 3.5 2.1 6.1 4.0 3 5.6 3.8 12Viet-Nam, Democratic Re-
public of 2.7 . . . 3.4 4.3 13

TABLE 3-B. - GROWTH RATES AND DENSITY OF POPULATION, GROWTH RATES OF PRODUCTION AND DEMAND FOR FOOD AND CEREALS,AND INSTABILITY INDICES OF FOOD AND CEREAL PRODUCTION FOR INDIVIDUAL COUNTRIES (concluded)
DEVELOPING COUNTRIES(concluded)
Populatioi Density 2Production
143
All food
Demand 3
in which xt -) Xt +2
k,( ) Xtn
k,(Xi - fC-)2 xt +
Xt st + 1 XtnXt = 1952 production, a: = 1972 production.
- k
Instabilityindex 4 Production
Cereals
Demand 3
, where k is the rate of growth of xt, xt + 1,
Instabilityindex 4
Viet-Nam, Republic of . 2.5 5.9 4.3 3.2 9 4.2 3.8 12Yemen Arab Republic . . . 2.4 4.8 -0.2 3.9 3 0.6 21Yemen, Democratic . . 2.4 5.1 1.6 ---1.0 5 4.9 32Zaire 2.0 2.4 0.2 2.3 5 -0.7 2.3 14Zambia 2.9 0.9 4.3 4.8 12 3.0 3.8 12
land (excluding permanent meadows and pastures) aroundincome and estimates of farm value elasticity of demand
4 Calculated on the basis of the Formula Inst Index
I Exponential rates of growth, 1952-72. - 2 Persons per hectare of agricultural1970. - 3 Calculated on the basis of growth rates of population and per caputgiven in FAO Agricultural conzmoclity projections, 070-1980, Romc, 1971. -

TABLE 3-C. - AVERAGE PER CAPUT ENERGY AND PROTEIN SUPPLIES BY COUNTRY, 1961 AND 1970
144
Energy(kilocalories)
Protein(grams)
Energy as percentof
lequirement
Protein/energyratio
1961 1970 1961 1970 1961 1970 1961 1970
DEVELOPED COUNTRIES
Albania 2 370 2 370 71.3 71.3 98 98 12.0 12.1)Australia 3 140 3 050 89.1 101.1 118 115 11.3 13.1Austria 3 150 3 340 86.7 89.1 120 127 11.0 10.6Belgium-Luxembourg . . . 3 160 3 390 91.3 94.0 120 128 11.5 11.0Bulgaria 2 680 3 300 79.2 97.2 107 132 11.8 11.7Canada 3 010 3 190 91.6 97.8 113 1 0 12.1 12.2Czechoslovakia 2 980 3 190 81.8 89.7 121 129 10.9 11.2Denmark 3 340 3 230 87.5 90.6 124 120 10.4 11.2Finland 3 130 3 020 93.1 91.3 115 111 11.8 12.0France 3 140 3 210 102.0 104.3 125 127 12.9 12.9German Democratic
Republic 2 730 3 400 67.0 83.6 104 130 9.8 9.8Germany, Federal Republic of 3 120 3 230 84.0 88.4 117 121 10.7 10.9Greece 3 000 2 900 98.7 98.9 120 116 13.1 13.6Hungary 3 030 3 180 91.7 98.0 115 121 12.1 12.3Ireland 3 240 3 420 100.4 102.5 142 136 11.7 11.9Israel 2 790 2 970 83.8 91.5 109 116 12.0 12.3ItalY 2 770 3 170 87.5 100.2 110 126 12.6 12.6Japan 2 340 2 470 71.9 76.2 100 106 12.2 12.3Malta 2 680 2 680 86.0 86.0 108 108 12.8 12.8Netherlands 3 250 3 290 86.3 83.8 121 122 10.6 10.1New Zealand 3 510 3 330 108.4 107.3 133 126 12.3 12.8Norway 2 910 2 920 86.8 87.1 109 109 11.9 11.9Poland 3 350 3 270 92.9 98.6 128 125 11.0 12.0Portugal 2 620 2 890 76.6 84.8 107 118 11.6 11.7Romania 2 780 3 120 80.5 92.1 105 118 11.5 11.8South Africa 2 820 2 730 80.2 77.0 115 1 1 1 11.3 11.2Spain 2 630 2 620 78.9 80.6 107 107 12.0 12.3Sweden 2 990 2 800 85.9 83.8 I 1 1 104 11.4 11.9Switzerland 3 330 3 250 95.7 91.4 124 121 11.4 11.2U.S.S R 3 000 3 280 87.0 101.0 117 128 11.6 12.3United Kingdom 3 180 3 140 91.2 90.2 126 125 11.4 11.4United States 3 120 3 270 92.4 97.3 118 124 11.8 11.9Yugoslavia 2 930 3 140 90.9 92.2 115 124 12.4 11.7
DEVELOPING COUNTRIES
Afghanistan 2 110 1 950 62.6 57.9 86 80 11.8 11.8Algeria 1 740 1 710 47.0 44.7 73 71 10.8 10.4Angola 1 910 1 910 39.9 39.9 81 81 8.3 8.3Argentina 3 060 3 150 97.7 98.6 115 119 12.7 12.5Bolivia 1 640 1 840 43.2 45.8 69 77 10.5 9.9Botswana 1 990 2 040 64.0 65.1 85 87 12.8 12.7Brazil 2 430 2 600 60.7 63.8 102 109 9.9 9.8Burma 1 910 2 230 43.0 49.2 88 103 9.0 8.8Burundi 1 910 2 330 47.0 61.0 82 100 9.8 10.4Cameroon 2 230 2 230 58.9 58.9 96 96 10.5 10.5Central African Republic . . 2 170 2 170 47.5 47.5 96 96 8.7 8.7Chad 2 230 2 060 76.6 72.8 94 86 13.7 14.1Chile 2 350 2 460 66.8 70.9 96 101 11.3 11.5China 2 010 2 370 54.3 63.2 85 100 10.8 10.6Colombia 2 180 2 250 49.8 50.8 94 97 9.1 9.0Congo 2 160 2 160 39.8 39.8 97 97 7.3 7.3Costa Rica 2 200 2 470 54.9 63.0 98 110 9.9 10.2Cuba 2 500 2 500 62.8 62.8 108 108 10.0 10.0Cyprus 2 460 2 460 77.8 77.8 99 99 12.6 12.6Dahomey 2 200 2 250 53.5 55.2 96 98 9.7 9.8Dominican Republic . . 2 080 2 060 45.7 50.1 92 91 8.7 9.7Ecuador 1 850 2 040 46.2 49.0 81 89 9.9 9.6Egypt 2 220 2 360 66.0 66.1 88 94 11.8 11.2El Salvador 1 870 1 890 53.1 51.3 82 82 11.3 10.8Ethiopia 2 060 2 150 65.6 68.6 88 92 12.7 12.7Gabon 2 180 2 210 51.0 55.7 93 94 9.3 10.0Gambia 2 230 2 370 60.0 62.6 94 100 10.7 10.5Ghana 2 050 2 200 45.1 46.3 89 96 8.8 8.4Guatemala 1 890 2 120 53.4 58.7 86 97 11.3 11.0

TABLE 3-C. - AVERAGE PER CAPUT ENERGY AND PROTEIN SUPPLIES BY COUNTRY, 1961 AND 1970 (concluded)
145
Energy(kilocalories)
Protein(grams)
Energy as percentof
requirement
Protein/energyratio
1961 1970 1961 1970 1961 1970 1961 1970
DEVELOPING COUNTRIES
Guinea 2 030 2 040 45.3 43.9 88 88 8.9 3.6Guyana 2 290 2 080 35.1 47.4 101 92 6.1 9.1Haiti I 820 1 720 40.2 38.7 81 76 8.8 9.0Honduras 1 900 2 180 52.5 57.7 84 96 11.0 10.5[ndia 2 100 2 060 55.2 52.6 95 93 10.5 10.2Indonesia 1 930 1 920 42.5 42.8 89 89 8.8 8.9[ran 1 990 20S0 51.9 52.6 82 86 10.4 10.1Iraq 2 010 2 250 55.9 62.4 83 93 11.1 11.0Ivory Coast 2 170 2 490 52.2 60.3 94 108 9.6 9.6Jamaica 1 940 2 300 46.0 56.0 87 103 9.4 9.7fordan 2 210 2 310 57.1 60.0 90 94 10.3 10.3Kenya 2 380 2 350 75.2 70.9 103 101 12.6 12.0Khmer Republic 2 270 2 410 58.6 61.6 102 109 10.3 10.2Korea, Democratic People's
Republic of 2 190 2 240 82.8 73.2 87 89 15.1 13.0Korea, Republic of . 1 990 2 420 53.4 65.3 85 103 10.7 10.7Laos 1 790 2 080 39.1 46.1 81 94 8.7 8.8Lebanon 2 120 2 380 59.8 69.5 85 96 11.2 11.6Liberia 1 990 2 040 35.2 36.1 86 88 7.0 7.0Libyan Arab Republic . . . 1 780 2 540 44.1 61.3 75 108 9.9 9.6Madagascar 2 350 2 350 55.3 52.9 104 104 9.4 9.0Malawi 2 000 2 150 50.4 54.4 86 93 10.0 10.1Malaysia (West) 2 270 2 400 50.7 51.7 101 107 8.9 8.6Mali 2 120 2 170 66.2 68.9 90 92 12.4 12.7Mauritania 1 970 2 060 73.2 75.0 85 89 14.8 14.5Mauritius 2 330 2 370 47.2 49.5 103 104 8.1 8.3Mexico 2 500 2 560 65.0 65.1 107 110 10.4 10.1Mongolia 2 280 2 520 118.8 108.7 102 113 20.8 17.2Morocco 1 700 2 400 43.3 63.6 70 99 10.1 10.6Mozambique 2 130 2 190 40.6 41.0 91 94 7.6 7.4Nepal 2 020 2 050 51.0 51.7 92 93 10.0 10.0Nicaragua 2 100 2 380 67.8 70.1 93 106 12.9 11.7Niger 2 180 2 180 73.9 72.2 93 93 13.5 13.2Nigeria 2 440 2 290 65.5 59.9 103 97 10.7 10.4Pakistan (excluding Ban-
gladesh) 1 940 2 280 54.8 59.4 84 99 11.2 10.4Panama 2 560 2 520 59.1 60.5 1 I 1 109 9.2 9.6Paraguay 2 580 2 800 76.1 73.5 112 121 11.7 10.5Peru 2 290 2 310 61.0 61.5 97 98 10.6 10.6Philippines 1 880 1 920 43.8 44.5 83 85 9,3 9.2Rhodesia 2 350 2 550 73.2 73.2 107 107 12.4 11.4Rwanda 2 030 2 160 55.0 61.5 88 93 10.8 11.3Saudi Arabia 2 080 2 080 56.2 56.2 86 86 9.8 10.4ienegal 2 300 2 300 64.0 64.0 97 97 11.1 11.1iierra Leone 2 040 2 240 46.1 49.0 89 97 9.0 3.7Somalia 1 770 1 770 56.9 56.9 77 77 12.8 12.8Sri Lanka 2 040 2 240 45.4 49.6 92 101 8.9 8.8Sudan 1 900 2 130 53.5 63.2 81 91 11.2 11.8iurinam 1 910 2 360 44.2 56.1 84 103 9.7 9.5Syrian Arab Republic 2 530 2 530 73.5 70.2 102 102 11.6 11.0Tanzania 1 600 1 700 42.3 42.5 69 73 10.5 10.0Thailand 2 120 2 330 46.9 52.2 95 105 8.8 8.9Togo 2 040 2 160 47.5 51.4 89 94 9.3 9.5Trinidad and Tobago . . . 2 360 2 360 63.9 63.9 98 97 10.8 10.8Tunisia 2 050 2 060 53.7 53.6 86 86 10.4 10.4Turkey 2 770 2 770 78.2 78.2 110 110 11.2 11.2Uganda 2 170 2 230 55.9 55.3 93 96 10.3 9.9Upper Volta 2 010 1 940 65.5 65.9 85 82 13.0 13.5Uruguay 3 070 2 860 110.2 95.6 115 107 14.3 13.3Venezuela 2 230 2 460 58.6 62.3 90 100 10.5 10.1Viet-Nam, Democratic Re-
public of 2 170 2 070 47.6 46.9 105 100 8.7 9.0Viet-Nam, Republic of . . . 2 140 2 340 49.3 52.4 99 108 9.2 8.9Yemen Arab Republic 1 990 1 970 64.8 62.0 82 81 13.0 12.5Yemen, Democratic . . . . 2 020 2 020 56.3 56.3 84 84 11.1 11.1Zaire 2 040 2 040 32.7 32.7 92 92 6.4 6.4Zambia 2 000 2 040 62.9 63.6 87 88 12.5 12.4

Income(cruzeiros per
householdper year)
TAI3LE 3-D. DAILY ENERGY INTAKE PER CAPUT BY INCOME OR EXPENDITURE GROUPS POR SELECTED COUNTRIES
SOURCE: Food consut iption in Brazil: fa nily budget surveys in the early 1960s. The Getulio Val gas Foundation, Brazil, 1970.
Income(rupees per household per
month)Percent ofhouseholds
Urban
Pakistan (1962-66)
Kcals percaput/day
Percent ofhouseholds
146
Rural
Kcals percaput/day
Percent ofhouseholds
Urban
Bangladesh (1962-66)
Kcals percaput/day
Percent ofhouseholds
Rural
Keats percaput/day
SOURCES: Pakistan: Nutrition strvey of West Pakistan, Feb. 1965-Nov. 1966. Directorate of Nutrition and Research, Pakistan, 1970.East Pakistan nutrition survey, 1962-63 (Preliminary Report). Directorate of Nutrition and Research, Pakistan, 1965.
SOURCES: India: Unpublished source, Maharashtra, 1971. Madagascar: Budgets et alinzetztation des ménages ruraux en 1962. MinistCredes finances et du commerce, Madagascar. Tunisia: La consommation et les depenses des nulnages en Tunisie 1965-68.Secrdtariat d'état au plan et à Peconomie nationale, Taisia, 1968.
India(Maharashtra, 1971)
Madagascar(Rural, 1962)
Tunisia(Rural, 1965-68)
Income(rupees
per caputper month)
Percent ofhouseholds
Kcals percaput/day
Income (Fmcr householdo per
year)Percent ofhouseholds
Kcals percaput/day
Totalexpenditure(dinars per
aput per year)
Percent ofhouseholds
Kcals percaput/day
Less than 1515-2525-3535-4545-5555-6565-75More than 75
1
23261815854
9401 5401 9502 2402 5903 1503 1102 990
1-2020-4040-8080-130
130-190190-390390-590
Other groups
552811
421
0.30.2
2 1502 2902 2502 3602 3502 3402 360
. . .
Less 2020-2727-3232-4545-5353-6464-102
102-150150-200
More than 200
8
8
82011
129922
1 7802 1202 1902 4302 6202 7503 1803 1803 2503 150
Percentof house-
holds
Keatsper
caput/day
Percentof house-
holds
KcaIsper
caput/day
Percentof house-
holds
Kcalsper
caput/day
Percentof house-
holds
Kcalsper
caput/day
Percentof house-
holds
Kcalsper
caput/day
Percentof house-
holds
Kcalsper
capoday
Less than 100 9 1 240 18 1 500 5 1 180 7 1 420 1 1 480 4 2 380100- 149 13 1 500 14 1 810 5 1 530 10 2 100 3 1 740 4 2 900150- 249 26 2 000 25 2 140 17 1 880 20 2 210 11 1 970 16 2 500250- 349 17 2 320 13 1 820 14 2 090 15 2 720 13 2 050 15 1 860350- 499 14 2 420 10 2 280 17 2 220 13 2 670 20 2 360 18 2 970500- 799 11 2 860 11 2 370 20 2 630 13 2 920 22 2 470 21 3 000800-1 199 5 3 310 5 3 380 11 2 820 8 3 060 14 2 780 9 3 7801 200-2 499 4 4 040 3 2 870 9 3 270 11 3 040 12 3 080 10 4 160More than 2 500 1 4 290 2 900 2 3 750 3 4 100 4 3 170 3 4 770
Less than 99 25 1 700 46 2 000 19 1 550 44 2 050100-199 38 1 780 32 2 140 25 1 750 34 2 260200-299 15 1 750 11 2 200 19 1 720 14 2 400300-399 7 1 800 3 2 460 10 1 810 4 2 660400-499 4 2 090 1 2 110 8 1 800 2 2 640More than 500 7 1 960 3 2 460 19 1 840 2 3 060
Brazil (1960)
Northeast East South
Urban Rural Urban Rural Urban Rural

Classification of countries by food zones Technical note on the application of energy and proteinrequirements to the assessment of malnutrition
GROUP A Animal foods: Australia, Austria, Canada, Den-mark, Finland, Iceland, Ireland, Netherlands, NewZealand, Norway, Panama, Paraguay, PuertoRico, Sweden, United States, Uruguay.
GROUP B Animal foodslwheat: Albania, Argentina, Bel-gium-Luxembourg, Bolivia, Bulgaria, Chile, CostaRica, Cuba, Czechoslovakia, France, GermanDemocratic Republic, Federal Republic of Ger-many, Greece, Hungary, Israel, Italy, Jamaica,Malta, Peru, Poland, Portugal, Romania, Spain,Switzerland, Trinidad and Tobago, U.S.S.R.,United Kingdom, Venezuela, Yugoslavia.
Gitout, C Animal foodskereals other than wheat: Colombia,Dominican Republic, El Salvador, Guyana, HongKong, Japan, Mongolia, Philippines, Singapore,Somalia, South Africa, Sudan, Surinam, Tanzania,People's Democratic Republic of Yemen.
GRouP D Wheat: Afghanistan, Algeria, Cyprus, Egypt,Iran, Iraq, Jordan, Lebanon, Libyan Arab Repub-lic, Morocco, Pakistan, Syrian Arab Republic,Tunisia, Turkey.
GROUP E Rice: Bangladesh, Burma, Indonesia, Khmer Re-public, Laos, Liberia, Madagascar, Malaysia(West), Sabah, Sarawak, Sierra Leone, Sri Lanka,Thailand, Democratic Republic of Viet-Nam, Re-public of Viet-Nam.
GROUP F Mixed cereals: Burundi, China, Ethiopia, Guinea,India, Democratic People's Republic of Korea,Republic of Korea, Mauritius, Mozambique,Nepal, Saudi Arabia.
GROUP G Millet: Chad, Mali, Mauritania, Niger, UpperVolta, Yemen Arab Republic.
GROUP H Maize: Kenya, Malawi, Mexico, Rhodesia,Zambia.
GROUP 1 Animal foods' rootskerealsIptilses: Angola, Brazil,Cameroon, Central African Republic, People'sRepublic of Congo, Dahomey, Ecuador, Gabon,Gambia, Ghana, Guatemala, Haiti, Honduras,Ivory Coast, Nicaragua, Nigeria, Rwanda, Senegal,Togo, Uganda, Zaire.
TABLE 3-E. -- PERCENTAGE CONTRIBUliON OF DIFFERENT FOODS TO TOTAL INTAKE OF ENERGY AND PROTEIN IN CLASSIFIED FOOD ZONES
147
The energy requirement is very simply defined as theenergy intake that is considered adequate to meet the energyexpenditure of a healthy person of a specified age and sex.Some individuals of the same age and sex will of courseneed more than the average requirement and others willneed less. Apart from age and sex, physical activity andbody size and composition are the most important variablesaffecting energy requirement. In childhood and adolescencethere are additional energy needs for growth, and for womenthe needs also increase during pregnancy and lactation. Theclimate influences energy expenditure indirectly through itseffect on the level of physical activity, although when hardphysical exercise is performed in high temperatures, a directincrease in energy expenditure may occasionally occur.
Much of the energy utilized by the body is expended inbasal metabolism, which is subject to relatively small indi-vidual variation. Hence, the factor that most affects thetotal daily energy expenditure is physical activity, and it isthis that makes the concept of energy requirement moredifficult than the requirement concepts of many nutrients.
To produce a scale of requirements for the population,use is made of the concept of a "reference man" and a"reference woman," defined with respect to weight and age.These references (in common with most standards) are arbi-trarily selected as convenient starting points for extrapolation.They have no other significance and are not intended tosuggest ideal standards. The reference man and woman arebetween 20 and 39 years old, and although their body weightsmay not be ideal, they consume an adequate, well-balanceddiet and are neither gaining nor losing weight.
Body composition as well as body weight may affect energyexpenditure. Since the resting metabolic rate is correlatedwith the fat-free mass, this rate when expressed in relationto gross body weight may be lower for an obese person thanfor a thin person. In general, the fat-free mass of individualsdoes not vary as much as their gross body weights, and there-fore it cannot be assumed that a low body weight, of itself,signifies undernutrition. When expressing energy require-ments in relation to the mean body weight of a population,the mean body weight used should be that of those membersof the population who are healthy and adequately nourishedand neither obese nor excessively slim. In practice the meanbody weight may refer to the mean of a group that includesboth obese and undernourished persons. Depending on therelative numbers of these categories, the mean may be higheror lower than the "ideal" mean.
Percentof in-take
Foodwnes
Cereals Starchy roots Sugar Pulses andnuts
Fruits andvegetables
Meat andfish
Eggs andmilk
Fats andoils
Cal-ores
Pro-teins
Cal-ores
Pro-teins
Cal-ores
Pro-teins
Cal-ores
Pro-teins
Cal-ores
Pro-teins
Cal-ores
Pro-teins
Cal-ores
Pro-teins
Cal-ores
Pro-teins
k...C...EFG...El . .
I
203951647168735636
173941676460625437
4771
78
23
25
3
5
21
3
4
1
12
17131210
5
5
3
9
3
3
445
7
128
8
44
11
71218201820
5
45
5
3
21
46
5
46
5
3
41
1
4
2011
8
3
3
446
6
412627
8
139
11
1719
1410
6
5
223
43
30221312
5
5
698
17
137
8
4425
7

TAI3LE 3-F. EFFECE OF BODY SIZE, AGE AND SEX ON PER CAPUT ENERGY REQUIREMENTS FOR A MODERATELY ACTIVE POPULATION
SOURCE: Energy and protein requirements, Report of a Joint FAO/WHO Ad Hoc Expert Committee, FAO, Rome, 1973.
The energy requirements per unit of body weight arehigher for men than for women of the same total weightwho engage in the same level of activity. This is due to thefact that women at a given weight or height have a largeproportion of fat in their bodies and tend to work at lowerloads than men.
The energy requirement of a person is also linked withage. This is very marked for children and adolescents, whorequire less energy per kilogram of body weight as theyget older (although total requirement rises, as body weightrises faster than the drop in the requirement per kilogram).The energy requirement of adults alters with age because ofchanges in body composition and in the basal metabolicrate. A decline in physical activity and the increasing preva-lence of diseases and disabilities also cause energy require-ments to diminish in later life. (See Table 3-F.)
In the case of children it is important to link the require-ment to age rather than weight, because if a significantproportion of children are underweight due to previousnutritional deficiencies, it is necessary to provide for "catch-up" growth and weight gain. This only applies up to theage of puberty, as older children are unlikely to be able tomake up for previous physical retardation and the consump-tion of food above the requirement for their present bodyweight will only lead to obesity.
148
During pregnancy, extra energy is needed to support thegrowing foetus and other tissues and to provide for increasedenergy expenditure.
When all the above factors affecting energy requirementshave been taken into account, there is still a great differencein the energy requirement of individuals owing to the widevariation in their levels of activity. Even within a singleoccupation the activity level of individuals varies, not onlyin terms of work accomplished, but even more so becauseof the very different ways in which leisure time is utilized.Nevertheless, the main differences in levels of physical ac-tivity are due to the occupations of individuals, ranging fromsedentary jobs to exceptionally physically demanding jobs,such as lumberjack or rickshaw puller. The energy requiredby a very active 65-kilogram man is more than 1 000 kilo-calories greater than that required by a 65-kilogram manengaged in only light activity.
When comparing the energy supply of a population withthe requirement, it is important to bear in mind the difficultyof defining the requirement when such factors as the meanbody weight and composition of healthy individuals in thepopulation and the mean level of physical activity of thepopulation are not known with any precision. Where apopulation is of small stature for various reasons, includingpast dietary deficiency, and/or where a substantial proportion
Age group(years)
Adult males 53 kgCountry 1: Adult females 46 kg
Adult males 65 kgCountry 2: Adult females 55 kg
Individualrequirements Distribution
Contribution tototal requirementsper 100 persons
Individualrequirements
DistributionContribution tototal requirementsper 100 persons
CHILDREN, BOTH SEXES
Up to 1 year1-34-67-9
MALE ADOLESCENTS ANDADULTS
10-1213-1516-1920-3940-4950-5960-6970 and over
FEMALE ADOLESCEN1S ANDADULTS
10-1213-1516-19
20-3940-4950-5960-6970 and over
Kilocalories
1 0901 3601 8302 190
2 6002 3702 4902 4402 3182 1961 9521 708
2 3502 0801 9321 8401 7481 6561 4721 288
Percent
2.511.410.58.7
3.93.43.8
13.63.82.61.50.7
3.93.43.7
13.53.82.71.60.9
Kilocalories
2 72515 50419 21519 053
10 1408 0589 462
33 1848 8085 7102 9281 196
9 1657 0727 148
24 8406 6424 4712 3551 159
Kilocalories
1 0901 3601 8302 190
2 6002 9003 0703 0002 8502 7002 4002 100
2 3502 4802 3102 2002 0901 9801 7601 540
Percent
2.05.85.85.9
3.23.03.5
15.64.34.63.21.6
3.12.93.3
15.75.35.13.72.3
Kilocalories
2 1807 888
10 61412 921
8 3208 700
10 74546 80012 25512 4207 6803 360
7 2857 1927 623
34 54011 07710 0986 5123 542
_
TotalPer caputl
198 835
1 990(8.33 Mi)
TotalPer caput
231 7522 320
(9.71 MI)

is underemployed or unemployed, energy requirements willbe low. However, the provision of diets which do no morethan satisfy these requirements would merely maintain thepresent unsatisfactory condition of the population, woulddo nothing to improve the physical status of the next gener-ation and would be inadequate if employment and leisure-time opportunities improved.
To obtain a total national requirement, the age/sex struc-ture of the population is taken into account. Assuming thatthe population is on the average moderately active, the meanbody weights of the reference man and woman have to beadopted, usually on the basis of group data (e.g., youngarmy recruits). The requirement of children up to the ageof puberty is not based on their actual weight, but is calcu-lated with an allowance for "catch-up" growth of under-weight children.
The estimated national requirement is therefore sufficientgiven perfectly equitable distribution (which, of course,
is never the case) to enable all the population to lead ahealthy, moderately active life and the young children tomaintain or regain a growth curve regarded as usual for awell-nourished child.
MAINTENANCE COST AS CRITICAL LIMIT
In assessing the number of people risking energy deficiencythe average requirement is not a suitable base, for muchof the population will have true requirements ranging wellbelow the average due to differences not only in body com-position but, more important, in activity. The true variationin individual activity is not known; neither is the extent ofthe possible skewness in the requirement distribution curve.
The Ad Hoc Expert Committee on Energy and ProteinRequirements convened by FAO and wHo reported that forpractical purposes the energy cost of maintenance can be setat 1.5 times the basal metabolic rate (Bw). If the foodavailable to the individual provides energy at a level lessthan 1.5 BMR, it may be said that such an individual islikely to be undernourished. However, even when individualvariations due to activity have been removed, there still existsindividual variation in BMR; it has been estimated that somepeople may have a BMR as low as 20% under the norm.Therefore, if one wishes to use this variable as an indicatorof the number of undernourished without including someindividuals who are in fact meeting their rather lower thanaverage maintenance cost, it is necessary to fix the limit at1.5 BMR minus 20%. By using this very conservative levelthe global estimate of over 400 million undernourished in-dividuals referred to in the text was obtained.
It should be noted also that the figures for BMR are basedon the measurement of 2 200 persons in one laboratory inBoston over a period of fifteen years. The applicability ofthese and the use of the factor 1.5 in assessing maintenancecost are still subject to debate. The method is used in thetext as but one indicator in a series of independent indicatorsof nutritional problems.
PROTEIN REQUIREMENTS
Early estimates of protein needs were based on directobservation of actual intakes, mainly in developed countries.The Health Committee of the League of Nations in 1936and the United States Food and Nutrition Board in 1945recommended I gram of protein per kilogram of bodyweight, and it was assumed that a considerable proportionof this would come from animal sources. This distinctionindicated awareness that the quality of protein for nutritionalpurposes varies according to the food source. The physio-logical approaches have led to much lower estimates ofprotein requirements. Various Expert Committees have
149
made a distinction in their approach to protein requirementsas opposed to energy requirements. It is recognized thatan intake of excess energy above requirement is harmful,leading to obesity and other physiological disturbances.However, there is no evidence that consumption of excessprotein leads to harmful results (at least within reasonablelimits), and so it is thought appropriate to recommend,rather than a mean requirement, a "safe level" of proteinintake that is, an intake that allows for variations inindividual requirements. This safe level is obtained byadding twice the coefficient of variation to the mean require-ment.1
Even at this safe level the requirement is only 0.57 gramof protein per kilogram of body weight for an adultreference man, although it is much more for children whoneed high protein intakes to ensure satisfactory growth.
In assessing the protein intake of populations against re-quirements, corrections have to be made for the quality ofthe protein in the diet consumed. The quality of the proteinis mainly determined by its amino acid composition, butother factors such as digestibility can also be important.Inadequate processing or storage can lead to significant lossin the protein quality of foods.
Infectious diseases affect protein requirements because ofan increase in the breakdown of body protein (increasedmetabolism), a decrease in absorption when diarrhoea is partof the symptoms, or food refusal and a loss of appztitethat does not permit a full coverage of energy needs. Theselosses cannot always be prevented while the infection persists,but they will later need to be replaced by a higher proteinintake. The effects of infections on protein needs cannot bequantified as they vary with the frequency, severity and na-ture of the infection and the nutritional status of the in-dividual.
The most important factor affecting the interpretation ofprotein requirement is its dependence on energy intake. Be-cause of the interrelationship between energy intake and ni-trogen balance, a reduction in energy intake below require-ments will lead to a loss of body protein or a reduction ingrowth rate.
Indicators of the incidence of undernutrition
In order to assess the incidence of undernutrition fromdata on food intake, in the absence of information on theactual requirement of any given individual, it is necessaryto adopt as an indicator of the level of undernutrition theproportion of the population whose food consumption failsto meet some selected critical limit. Three such indicatorshave been used in this study. These are briefly describedbelow.
Sukhatme 2 was the first to attempt to measure the inci-dence of undernutrition from a comparison of the energyintake distribution with an assumed distribution of require-ments, which he states is required to define the bivariatefrequency distribution f(x,y) for intake x and requirement y.
1 The mean requirement itself is 30% above the value givenby a factorial method using estimates of obligatory nitrogenlosses and the amount of nitrogen needed for the formation ofnew tissue, recognizing that even with an excellent protein source,such as milk or egg, larger amounts of nitrogen are needed tosecure equilibrium or maintain growth than the amount ascalculated using the factorial method.
2 P.V. Sukhatme, The world's hunger and future needs in foodsupplies, Journal of the Royal Statistics Society, Series A (Gen-eral), 124(4), 1961.

Given such a distribution with reference to a sufficiently longperiod, the number of undernourished can be expressed as
= f f f(x,y) dx dyx<y
As data on the frequency distribution f(x,y) are not avail-able, Sukhatme estimated u using the separate distributionof x and y. He postulated that in a healthy, active popu-lation, in which no one is underfed, only a negligible pro-portion of the population would have an intake belowC-3Gy where C = mean requirement and cy -=- standarddeviation of requirement.
Consequently, Sukhatme argued, in any observed intakedistribution the proportion of households below C-3oy couldbe taken as an estimate of the incidence of undernutrition.Sukhatme has expanded this approach in many subsequentpapers without any major modification of the basic assump-tions. He has however suggested 3 that in view of the likelytruncation of the requirement distribution the proportionbelow C-2Gy should be taken instead of C 3Gy. Thosewho consume more than C 3cy, but nevertheless have arequirement above their intake are not included.
An alternative approach aims at providing an estimate ofthe minimum proportion of undernourished. This is achievedby imposing the conditions that for x>y, xi yi is a mini-mum and that for x<y, yi xi is a maximum.
This approach leads to a minimum estimate of the num-ber of undernourished that is given by
u (Mill) = f g(x) dx f f(y) dy
x<d y<d
where d is chosen so as to maximize the expression.These two estimates will provide in normal circumstances
a conservative approximation of the level of undernutritionin a population. To use them, however, the moments off(y) must be known, and it is doubtful that this can beclaimed. Even the mean requirement depends on accurateknowledge of the characteristics of the population understudy, including activity levels, and evidence for the stan-dard deviation of individual requirements is very uncertain.
It may therefore be more appropriate to compare energyintakes against a limit, or limits, determined by physiologicalconsiderations rather than a limit based on an assumeddistribution of average requirements. It is suggested thatthe energy cost of maintenance is 1.5 sma, where WAR,defined as the amount of body heat produced under resting,fasting conditions, is a measure of the rate at which bodysubstance is oxidized in order to support the continuedmaintenance of life. Basal metabolic rates are based onlaboratory measurements of 2 200 persons over a period offifteen years. The suggested coefficient of variation of BMRiS 10%; hence, 0.8 X 1.5 BMR =, 1.2 insAR may be used as alower limit of the maintenance cost of energy. Such a limitmakes no allowance for physical activity other than theminimum level of activity incurred by a resting subjectin washing and performing other essential functions. Anindicator of the likely level of undernutrition is even moredifficult to establish for countries for which the distributionof food intakes is not available.
In the following discussion it is assumed that the intakedistribution refers to the distribution of "consumer units"
that is, individuals standardized by age and sex to areference man, whose energy requirement is based on the
3 P.V. Sukhatme, The calorie gap, Journal of Nutrition andDietetics, 10(4), p. 118-207.
150
normal body weight, in a particular country, of a youngmale adult leading a moderately active life.
Food balance sheets have been calculated for most coun-tries. From these balance sheets it is possible to calculatethe mean supply of food per consumer unit. Although thismean may be in error because of inaccuracies in the balancesheet, it is most likely the best indicator of food supplyat present available. It is now necessary to assume that themean supply per consumer unit equals the mean intake perconsumer unit. Whereas wastage down to the retail levelhas already been allowed for in the food balance sheet,domestic wastage has not been deducted from supply; how-ever, in supply certain items, including "wild" sources offood, are probably underestimated. A comparison of themean intake from food consumption surveys with the meanfood supply from food balance sheets shows that, in general,the mean intake is within 100-300 calories of the meansupply. For example, in Sri Lanka and Madagascar thedifference is just over 100 calories. Differences of thisorder seem reasonable since the various sources of error inboth estimates pull to some extent in opposite directions(i.e., an underestimation of intake from food consumptionsurveys and an overestimation of intake from food supplyat the retail level).
The range of individual energy intake is assumed to belimited in reality. A lower limit of 1 000 calories for aconsumer unit seems practical, as even a man weighing25 kilograms has a basal metabolic rate in excess of this.Similarly, 5 500 calories seem to be a realistic upper limit,as an 80-kilogram man engaged in an exceptionally activeoccupation, such as a lumberjack, has a requirement below5 000 calories. Assuming this range, one estimate of thestandard deviation of the intake distribution would be 750calories that is, one sixth of the range an approxi-mation that is reasonable for normal or moderately sym-metrical distributions.4
The available evidence from food consumption surveysindicates clearly and almost without exception that the intakedistribution is skewed. Normally it is positively skewed,but for special groups within the population the skewnessmay occasionally disappear or even become negative. Tosum up, a moderately skewed distribution of Pearson Type 1,for which the mean is known and the range and standarddeviation can reasonably be approximated, is therefore re-quired.5 Hence the appropriate distribution may be ex-pressed as a beta distribution of the form
F (p q)f (x)= x2)-1 (b-x)(1-1 0<x<b
bP+q-1 F (p) F (q)
The parameter p and q may be estimated as follows 5
lei (WI w2/b)
11/2 W/2
(h (!t12 IL'21b)
1,r2 wi2
where !VI and 13.'2 are the first two moments about the origin.
4 U.G. Yule and M.G. Kendall, An introduction to the theoryof statistics, London, Griffin, 1950, p. 134.
5 R. Pearson, Tables of the incomplete beta-function, Cam-bridge University Press, 1968, p. xxvii.

This beta distribution has been fitted to each country,using the mean as given by the food balance sheet for 1970and a range of 4 500 calories and for various values of thestandard deviation (about the mean) between 600 and 1 000calories. By using the beta distribution it is possible toobtain the percentage of consumer units below the criticallimits (Pearson's Tables of the incomplete beta-function).However, this procedure will give grossly inaccurate resultsif the intake distribution departs radically from the premisesoutlined above; in particular, if the intake distribution istruncated at the lower end owing to, let us say, a socialwelfare policy which ensures that even the poorest receivea minimum ration of food, then the percentages given bythe beta distribution will overestimate the extent of under-nutrition.
Energy and protein intake of households: Sri Lankacase study
Evidence derived from food consumption data has beenpresented for several countries. The evidence is sufficientto warrant the conclusion that the problem of extensivemalnutrition among the poor is common to most developingcountries. It is instructive to give more detailed results fromone major survey, not necessarily because the country inquestion is typical, but in order to examine more closely thelevels and causes of malnutrition. The data on which thefollowing presentation is based relate to Sri Lanka, havingbeen collected in 1969/706 in a survey of nearly 10 000households. The food consumption data, collected by arecall method, agree fairly well with the results from a smallsample in which the food was weighed and a sample analysed.The tables below do not include all households, as someminor groups of no relevance to the present study and someother households in which the energy or protein intakeseemed impossibly high or low have been excluded.
Table 3-G presents the average energy intake per consumerunit by income group and location.
TABLE 3-G. - ENERGY INTAKE PER CONSUMER UNIT BY INCOMEGROUP AND LOCATION IN SRI LANKA
Socio-econamic survey uf Sri Lanka, 1969170. All data inthis and the following tables have been retabulated and madeavailable to FAO by the Government of Sri Lanka.
151
The income and urban/rural effect on food consumptionis clear, even from the mean intakes per consumer unit.Rural dwellers have higher mean intakes than urban dwellers.In general, within one income group the rural dwellers haveintakes approximately 150 calories per consumer unit higherthan the urban dwellers, although this difference seems todisappear in the top income groups. Residents of Colombohave slightly lower mean intakes than those living in otherparts of Sri Lanka. Residents on estates and plantationsin Sri Lanka have higher intakes than others with similarincomes, presumably because of the provision of rations toestate workers.
Table 3-H shows the percentage frequency distribution ofenergy intakes in Sri Lanka classified by urban, rural andestate households.
Slightly more than 20% of the households in the urbansector have an average intake per consumer unit below2 100 calories. In the rural sector 18.5% of the householdsare in this category, whereas in the estate sector only 12% ofthe households have such low mean intakes. At the other
TABLE, 3-H. - FREQUENCY DISTRIBUTION OF ENERGY INTAKESIN SRI LANKA
TABLE 3-I. - FREQUENCY DISTRIBUTION OF ENERGY INTAKES BYINCOME GROUP IN SRI LANKA
Income inrupees Location Number of
households intake in. Mean .
calories
Less than 200 Colombo: Urban 353 2 450Rural 185 2 850
Other: Urban 471 2 600Rural 1 368 2 650
Estates 824 2 900
200-399 Colombo: Urban 745 2 600Rural 264 2 750
Other: Urban 643 2 650Rural 1 076 2 800
Estates 571 2 850
400-599 Urban 682 2 750Rural 416 2 900
600 and more Urban 841 2 950Rural 196 2 950
Energy intake perconsumer unit
in calories
Percentage of households by income ,group
Less than200 rupees
200-399rupees
400-599rupees
600rupees
and more
Less than 1 500I 500-1 699
3.94.9
2.22.4
1.31.5
1.41.0
1 700-1 899 6.6 6.1 3.5 2.91 900-2 099 8.1 6.8 7.4 4.82 100-2 299 9.3 9.9 8.8 7.42 300-2 499 10.4 12.4 12.2 10.3
2 500-2 699 10.0 11.7 11.2 11.0
2 700-2 899 9.4 10.8 13.2 12.7
2 900-3 099 8.8 9.3 10.5 11.5
3 100-3 299 7.6 8.9 8.2 8.6
3 300-3 499 . 5.2 6.1 6.1 7.3
3 500 and more 15.8 13.4 16.1 21.1
Total 100.0 100.0 100.0 100.0
Energy intake perconsumer unit
in calories
Percentage of households
Urban Rural Estates Total
Less than 1 500 2.6 2.7 2.7 2.71 500-1 699 3.4 3.3 1.3 3.01 700-1 899 6.3 5.6 3.7 5.61 900-2 099 8.1 6.9 5.0 7.22 100-2 299 10.3 9.1 7.0 9.22 300-2 499 12.3 11.4 8.6 11.42 500-2 699 10.7 11.2 10.9 10.92 700-2 899 11.2 10.4 10.5 10.82 900-3 099 9.3 9.2 10.8 9.43 100-3 299 7.2 8.1 11.7 8.33 300-3 499 . . 5.0 5.7 9.1 5.93 500 and more 13.6 16.4 18.7 15.6
Total 100.0 100.0 100.0 100.0

TABLE 3-J. PERCENTAGE OF HOUSEEIOLDS IN SRI LANKA WITH AMEAN INTAKE BELOW 1.2 I3MR BY LOCATION AND INCOME GROUP l'OOR URBAN HOUSEHOLDS IN COLOMI30 BY NUMBER OF CHILDREN
end of the intake scale, while just over 18% of urbanhouseholds have mean intakes per consumer unit greater than3 300 calories, this figure rises to 22% for rural householdsand nearly 28% for estate households.
Table 3-1 shows the percentage frequency distribution ofenergy intake in Sri Lanka classified by income group.
In the lowest income group 23.5% of the householdshave a mean intake per consumer unit below 2 100 calories.This figure falls to 17.5% for the next income group, to13.7% for the 400-599 rupee income group and finally to10% for the top income group. Of the poorer households,21% have mean intakes per consumer unit in excess of 3 300calories, whereas over 28% of the richer households are inthis category.
The approximate lower level of maintenance cost of energyof the Sri Lanka consumer unit is 1 900 calories. Usingthis minirnum maintenance cost of energy as a critical limit,'Fable 3-J shows the percentage of households with meanintakes per consumer unit below this figure.
Even in the upper income groups between 5 and 6% of thehouseholds have intakes per consumer unit below the lowerphysiological limit, compared with 15% for the lowest incomegroups. Nevertheless, even though malnutrition has a func-tional relationship with poverty, not all the poor are mal-nourished. Which then of the poorer households may besaid to run the greater risk of malnutrition?
Part of the answer to this question is revealed by an exami-nation of malnourished and well-nourished households withinthe same income group and in the same locality. Since themean requirement per consumer unit in Sri Lanka is ap-proximately 2 500 calories, households with a mean intakebelow 1 800 calories are almost certainly malnourished.These households are therefore compared with those in whichthe average intake per consumer unit is above 2 800 caloriesand are thus termed "adequately nourished.'
152
TABLE 3-K. DISTRIBUTION OF LOW-INTAKE AND HIGH-INTAKE
Percentageof households Energy intake
In the lowest income uotip of urban Colombo there wereseventy-two households with a mean intake per consumerunit below 1 800 calories and ninety-two households witha mean intake per consumer unit above 2 800 calories.Table 3-K shows the percentage distribution of these house-holds by the number of children in them.
Nearly all the better-nourished households had three chil-dren or less living in them; indeed, more than 50% of thesehouseholds contained no children at all. More than 50%of the households with an average intake of 1 800 caloriesper consumer unit consisted of four children or more. Themodal group contained five children.
The same major difference is revealed by groups other thanthe poorest urban dwellers. Table 3-L shows the distributionfor other socioeconomic groups in the Colombo district.
TABLE 3-L. -- DISTRI I3UT ION OF LOW-INTAKE AND HIGH-INTAKEHOUSEHOLDS IN THE COLOMBO DIS I RICT ISY NUMBER OF CHILDREN:
SELECTED GROUPS
Number ofchildren
Rural UrbanHigh
incomePoor Medium
incomeMediumincome
1 800calo-
ries
2 800calo-ries
1 800calo-
ries
2 800calo-
ries
1 800calo-
ries
2 800calo-
ries
1 800calo-ries
2 800calo-
ries
0-12-34-55 or more .
18
383210
7520
5
641
3518
5535
8
2
7
343326
5733
9
1
18233227
5336
92
Numberof children 1 800 calories 2 800 calories
0-1 18 852-3 28 14
4-5 46 1
6 or more 8
Total 100 100
LOCATION
Urban 12.3Rural 11.6Estates 7.7
INCOME
Less than 200 rupees 15.4200-399 rupees 10.7400-599 rupees 6.3600 rupees and more 5.3

Definitions of regions and subregions
Norart AMERICA:
WESTERN EUROPE:
OCEANIA
U.S.S.R. AND EASTERNEUROPE:
OTHER DEVELOPEDMARICET ECONOMIES:
LATIN AMERICA
Central America:
Caribbean:
South America:
SOUTH ASIA:
Canada, United States of America.
Andorra, Austria, Belgium, Den-mark, Faeroe Islands, Finland,France, Federal Republic of Ger-many (including West Berlin), Gi-braltar, Greece, Holy See, Iceland,Ireland, Italy, Liechtenstein, Lux-embourg, Malta, Monaco, Nether-lands, Norway, Portugal, San Ma-rino, Spain, Svalbard and JanMayen Islands, Sweden, Switzer-land, United Kingdom, Yugoslavia.
Australia, New Zealand.
Albania, Bulgaria, Czechoslova-kia, German Democratic Repub-lic (including East Berlin), Hun-gary, Poland, Romania.
Israel, Japan, South Africa.
Nlexico, other Central Americancountries (Costa Rica, El Salva-dor, Guatemala, Honduras, Nica-ragua, Panama) and others(British Honduras and PanamaCanal Zone).
Cuba, Dominican Republic, Haiti,Jamaica, Puerto Rico, Trinidadand Tobago, and others (Antigua,Bahamas, Barbados, CaymanIslands, Dominica, Granada, Gua-deloupe, Martinique, Montserrat,Netherlands Antilles, St. Kitts-Nevis-Anguilla, St. Lucia, St. Vin-cent, Turks and Caicos Islands,Virgin Islands (U.K.) and VirginIslands (U.S.).
Brazil, the River Plate countries(Argentina, Paraguay, Uruguay),other South American countries(Bolivia, Colombia, Ecuador,Guyana, Peru, Surinam, Vene-zuela) and others (British Antarc-tic Territory, Falkland Islandsand French Guiana).
Bangladesh, India, Nepal, Paki-stan, Sri Lanka, and others (Bhu-tan, Maldive Islands and Sikkim).
153
EAST ANO SOUTHEASTASIA:
NEAR EAST
Near East in Africa:
Near East in Asia:
AFRICA
Northwestern Africa:
Western Africa:
Central Africa:
Eastern Africa:
Southern Africa:
Burma, China, Hong Kong, Indonesia, Khmer Republic, Repub-lic of Korea, Laos, Malaysia,Philippines, Singapore, Thailand,Republic of Viet-Nam, and others(Bonin Islands, Brunei, Macau,Portuguese Timor, Ryukyu Islandsand West Irian).
Arab Republic of Egypt, LibyanArab Republic, Democratic Re-public of the Sudan.
Afghanistan, Cyprus, Iran, Iraq,Jordan, Lebanon, Saudi Arabia,Syrian Arab Republic, Turkey,Yemen Arab Republic, People'sDmlocratic Republic of Yemen,and others (Bahrain, Gaza Strip,Kuwait, Oman, Qatar and UnitedArab Emirates).
Algeria, Morocco, Tunisia, andothers (Spanish Sahara, SpanishNorth Africa).
Dahomey, Gambia, Ghana, Gui-nea, Ivory Coast, Liberia, Mali,Mauritania, Niger, Nigeria, Sene-gal, Sierra Leone, Togo, UpperVolta, and others (Cape VerdeIslands, Portuguese Guinea andSt. Helena).
Angola, Cameroon, Central Afri-can Republic, Chad, People's Re-public of Congo, Gabon, Zaire,and others (Equatorial Guinea andSao Tomé and Principe).
Burundi, Ethiopia, Kenya, Mada-gascar, Malawi, Mauritius, Mo-zambique, Rhodesia, Rwanda, So-malia, Tanzania, Uganda, Zambia,and others (British Indian OceanTerritory, Comoro Islands, FrenchTerritory of Afars and Issas, Réu-nion and Seychelles).
Botswana, French Southern andAntarctic Territories, Lesotho,Namibia, Swaziland.
Bibliography to Chapter 3
BERGNER, L. & SUSSER, M.W. Low birth weight and prenatal1970 nutrition. Pediatrics. 46: 946-966.
BHATTACHARIEE, J.P. Underemployment among Indian farm-1961 ers: an analysis of its nature and extent based on
data for Bihar. Artha Vijilazza, 3(3): 246-278.
BOSERUP, E. The conditions of agricultural growth. London,1965 Allen & Unwin.
CATHOLIC INFORMATION OFFICE. World population year.1974 Middlesex, England.
CLARK, C. Population growth and land use. London,1967 Macmillan.
CRA/vIER, H.H. Plant protection and world crop production.1967 Leverkusen, Farbenfabriken Bayer.
DEN HARTOG, A. Unequal distribution of food within house-1972 holds. Nutrition Newsletter (FAo), 10(4): 8-17.
FAo. Trade in agricultural commodities in the first United1964 Nations Development Decade. FAO Coninzodity
Review, 1964, Special supplement. Rome.
FAO. Provisional Indicative World Plan for Agricultural De1970 velopment. Rome.
FAO. Agricultural commodity projections, 1970-1980. Rome.1971a CCP 71/20. Rome.
FAO. Review of world consumption surveys, 1970. Rome.197 lb
FAo. Income elasticities of demand for agricultural products.1972a Rome.
FAO. Perspective study of agricultural development for South1972b America (Provisional). Vol. 1. eswAD/01. Rome.
FAO. Annual fertilizer review 1972. Rome.1973
FAO. FAO commodity review and outlook, 1972-1973. Rome.1973a
FAO. Production yearbook 1972. Rome.1973b
FAO. Trade yearbook 1972. Rome.1973e
FAO/WHO. Energy and protein requirements. Report of a1973 Joint FAOIWHO Ad Hoc Expert Committee.
Rome, FAO.
GOMEZ, F. et al. Malnutrition in infancy and childhood1955 with special reference to kwashiorkor. In Advances
in Pediatrics, Vol. 7, p. 131. New York, YearbookPub! ishers.
154
HAY, F.G. & SINHA, R.P. Analysis of food expenditure1972 patterns of industrial workers and their families
in a developing country. Journal of DevelopmentStudies, 8(4): 425-446.
INTERNATIONAL BANK FOR RECONSTRUCTION AND DEVELOPMENT.1973 Size distribution of income: compilation of data.
Washington, D.C.
ITERNATIONAL LABOUR OFFICE. Distribution of land owner-1972 ship. ILO Mission to Kenya, 1972. Geneva.
KHANDKAR, R.H. Distribution of income and wealth in1973 Pakistan. Pakistan Economic and Social Review,
11(1): 1-39.
NATIONAL INSTITUTE OF NUTRITION. Diet atlas of India.Delhi, Indian Council of Medical Research.
NicoL, B.M. The calorie requirements of Nigerian peasant1959a farmers. British Journal of Nutrition, 13: 293-306.
NicoL, B.M. The protein requirements of Nigerian peasant1959b farmers. British Journal of Nutrition, 13: 307-320.
PRAIS, S.J. & HOUTHAKKER, H.S. The analysis of family1971 budget. London, Cambridge University Press.
SINHA, R.P. Some determinants of the demand for food.1968 Farm Economist, 11: 281-293.
SUKHATME, P.V. The world's hunger and future needs in1961 food supplies. Journal of the Royal Statistical
Society, Series A, 124(4): 463-508.
TANNER, J.M. Earlier maturation in man. Scientific Anzeri-1968 can, 218: 21-27.
UNITED NATIONS. World population project, 1965-1985, as1969 assessed in 1968. New York. Working Paper No. 30.
UNITED NATIONS. Yearbook of national accounts statistics,1973 1971. New York.
UNITED NATIONS/FAO/ILO. Progress in !mid reform: fifth1970 report. New York, United Nations. (Also first to
fourth reports)
U.S. DEPARTMENT OF AGRICULTURE. Austria: projectedlevel of supply, demand, and trade of agriculturalproducts in 1965 and 1975. Washington, D.C. nits,Foreign 62.
U.S. GOVERNMENT. The world food problem. Report of1967 the President's Science Advisory Committee. Vol. 2.
Washington, D.C.
WALKER, A.R. & RICHARDSON, B.D. International and local1973 growth standards. American Journal of Clinical
Nutrition, 26: 897-900.
WORLD HEALTH ORGANIZATION. Childhood. Report of the1973 Inter-American investigation of mortality in child-
hood. Washington, D.C., wHo/Pan American HealthOrganization. Scientific Publication No. 262.

ANNEX TABLES
1 Volume of production of major agricul-tural, fishery and forest products . . . 157
2 Indices of food and agricultural produc-tion, by countries 163
3 Volume of exports of major agricultural,fishery and forest products 170
4 World average export unit values of se-lected agricultural, fishery and forestproducts 177
5 Volu.me of imports of major agricultural,fishery and forest products 179
6 Indices of value of exports of agricultural,fishery and forest products 185
7 Indices of volume of exports of agricul-tural, fishery and forest products . . 187
3 Indices of value of imports of agriculturaland forest products 189
9 Indices of volume of imports of agricul-tural and forest products 191
10 Stocks of selected agricultural products 193
11 Annual changes in consumer prices: allitems and food 194
12 Main features of current developmentplans 196

ANNEX TABLE 1. - VOLUME OF PRODUCTION OF MAJOR AGRICULTURAL, FISHERY AND FOREST PRODUCTS
See notes at end of table.
157
1961 1962 1963 1964 1965 1966 1967 1968 1969 1970 1971 1972
1973(Pre-lim-
inary)
Million metric tons
World
AGRICULTURAL ggoDucrs
Wheat 228.47 258.98 239.58 277.11 267.37 310.11 298.92 331.25 315.19 318.44 353.88 347.22 375.24
Barley 82.15 98.91 101.83 109.31 106.32 117.27 118.60 131.05 137.03 139.55 151.55 152.67 169.12
Oats 50.50 50.26 47.36 44.31 46.64 48.56 50.83 54.37 55.39 55.56 57.75 51.30 54.30
Maize 206.95 210.46 221.96 215.90 227.81 242.25 266.87 252.70 267.60 261.31 305.00 303.89 311.78
Rice (milled equivalent) 1 157.67 159.42 165.94 172.63 166.80 165.64 180.37 185.07 190.77 200.70 199.10 190.26 208.48
Sugar (centrifugal) 53.72 51.28 53.03 62.80 63.76 64.15 66.14 66.19 67.08 74.18 74.92 73.98 78.92
Apples 15.36 19.88 18.69 19.63 19.54 19.20 22.18 20.51 23.13 21.41 21.15 19.40 21.79
Citrus fruit 23.86 24.48 24.53 25.41 27.59 30.81 33.66 33.11 36.74 37.53 39.45 41.63 43.95
Bananas 21.03 21.63 22.82 24.31 26.32 27.13 27.97 28.11 29.56 30.75 33.84 33.81 34.98
Olive oil 1.50 1.00 1.95 1.00 1.36 1.36 1.50 1.58 1.35 1.52 1.67 1.57 1.56
Soybeans 31.10 30.87 31.69 32.38 36.52 39.08 40.71 44.00 45.20 46.54 48.67 52.31 62.88
Groundnuts 14.69 15.53 16.17 17.09 16.22 16.35 17.64 15.95 16.96 18.21 19.04 16.34 17.33
Cottonseed 18.03 19.30 20.48 21.23 21.94 20.31 20.00 21.65 21.36 21.77 22.73 24.05 23.80
Copra 3.46 3.21 3.38 3.44 3.39 3.58 3.26 3.40 3.41 3.48 3.96 4.29 5.94
Total vegetable oils and oilseeds(oil equivalent) 25.39 25.89 28.75 29.00 30.40 30.88 32.10 32.91 33.29 35.54 36.67 36.05 36.66
Coffee 4.67 4.30 4.09 3.68 5.06 3.89 4.51 3.88 4.34 3.95 4.70 4.56 4.19
Cocoa 1.18 1.20 1.25 1.55 1.22 1.33 1.39 1.23 1.42 1.52 1.61 1.48 1.36
Tea 1.05 1.06 1.09 1.12 1.13 1.19 1.19 1.24 1.26 1.30 1.40 1.52 1.54
Wine 21.93 28.52 25.83 28.52 28.86 26.30 28.53 28.33 27.75 30.21 28.73 28.20 35.01
Tobacco 3.75 4.13 4.51 4.88 4.58 4.59 4.89 4.76 4.62 4.68 4.52 4.87 4.83
Cotton (lint) 9.67 10.52 11.07 11.47 11.91 10.92 10.61 11.56 11.44 11.73 12.18 13.05 12.92
Jute 2 3.61 3.09 3.32 3.30 3.46 3.71 3.79 2.66 3.68 3.56 3.30 3.64 3.96
Sisal, henequen and other agaves 0.80 0.83 0.87 0.91 0.90 0.89 0.84 0.81 0.82 0.83 0.79 0.80 0.84
Wool (greasy) 2.55 2.58 2.58 2.60 2.66 2.64 2.72 2.72 2.78 2.81 2.76 2.71 2.63
Rubber 2.14 2.17 2.22 2.32 2.40 2.47 2.43 2.64 189 2.94 3.03 3.07 3.45
Milk (total) 345.70 349.13 346.63 354.73 370.03 378.45 387.37 391.67 393.43 395.42 398.98 410.93 418.42
Meat 3 77.39 80.33 83.34 83.77 87.33 91.24 95.31 98.23 100.41 104.22 107.62 109.54 110.12
Eggs 15.63 16.02 16.40 16.95 17.42 17.96 19.22 19.74 20.55 21.45 22.14 22.56 22.68
Fisi ICILY PRODUCTS 4,5
Freshwater and diadromous fish 6.96 6.09 6.57 7.58 8.55 9.18 8.96 9.27 9.80 11.11 11.68 11.95 12.01
Marine fish 32.19 34.04 34.92 39.54 39.64 42.99 45.95 48.66 47.22 52.49 52.04 46.63 46.80
Crustacca, molluscs and otherinvertebrates 3.52 3.77 4.15 3.90 4.17 4.30 4.54 4.97 4.76 4.94 4.89 5.19 5.10
Seals and miscellaneous aquaticmammals - - - - 0.01 - - 0.01 0.01 0.01 0.01 0.01
Miscellaneous aquatic animalsand residues 0.20 0.24 0.22 0.27 0.24 0.14 0.15 0.13 0.10 0.13 0.12 0.13 0.13
Aquatic plants 0.69 0.79 0.69 0.58 0.65 0.68 0.83 0.82 0.77 0.87 0.92 0.89 0.90
FOREST PRODUCTS 4
Fuelwood 6 1030 1035 1060 1080 1090 1097 1096 1108 1115 1120 1135 1129 1150
Industrial roundwood ' 1019 1038 1056 1113 1133 1153 1179 1205 1234 1276 1292 1306 1350
Sawn softwood " 263.2 265.3 273.3 288.5 293.0 290.1 292.6 305.3 310.5 311.3 327.0 335.6 345.0
Sawn hardwood ' 73.3 74.5 78.4 81.3 82.3 84.2 85.7 87.8 93.5 93.0 92.1 93.5 98.0
Plywood a 16.5 18.1 20.1 22.2 24.2 25.2 26.4 29.6 30.6 32.6 35.8 38.6 42.0
Particle board 6 3.9 4.8 6.0 7.5 9.2 11.0 12.6 14.9 17.4 19.5 28.3 27.5 30.6
Fibreboard 4.6 4.9 5.5 6.1 6.4 6.3 6.5 7.1 7.6 7.8 8.4 9.0 10.0
Mechanical wood pu p . 18.6 19.1 19.7 20.9 21.8 22.9 22.5 23.9 25.6 26.4 26.4 27.3 28.0
Chemical wood pulp 44.1 46.2 50.3 54.8 57.9 62.3 64.5 70.3 75.1 78.0 78.2 82.3 87.0
Newsprint 14.3 14.5 14.9 16.2 17.0 18.3 18.5 19.3 20.8 21.5 21.1 21.6 23.0
Printing and writing paper . . 15.6 16.3 17.4 18.7 19.7 21.9 22.5 24.4 26.5 27.6 27.9 30.4 34.0
Other paper and paperboard . 47.5 50.0 53.2 57.2 61.0 64.5 65.9 71.4 76.8 79.0 80.8 86.2 91.0

ANNEX TABLE 1. - VOLUME OF PRODUCTION OF MAJOR AGRICULTURAL, FISHERY AND FOREST PRODUCTS (continued)
Sec notes at end of table.
158
1961 1962 1963 1964 1965 1966 1967 1968 1969 1970 1971 1972
1973(Pre-
inary)
Million metric tons
Western Europe
AGRICULTURAL PROD UC ES
Wheat 37.64 47.88 41.55 46.84 48.90 44.61 52.16 51.83 50.14 47.69 58.44 56.56 63.03Barley 22.54 25.92 28.50 29.53 30.90 32.57 37.95 37.91 39.49 35.96 42.04 44.15 44.96Oats 12.96 12.63 12.62 11.96 11.86 11.89 13.40 13.09 12.53 11.96 13.89 12.62 11.96Rye 5.41 6.03 5.85 6.34 5.40 4.86 5.56 5.59 5.12 4.74 5.38 5.19 4.67Maize 13.20 12.45 15.21 15.44 14.90 18.29 17.89 19.32 21.72 23.43 25.54 25.56 28.72Sugar (centrifugal) 7.30 7.34 8.56 10.21 9.08 9.47 10.15 10.39 11.13 10.80 12.47 11.62 12.18Potatoes 73.07 74.02 80.64 68.48 63.17 65.04 69.01 66.43 59.88 63.68 60.85 56.74 55.39Apples 7.87 11.93 10.02 10.44 10.75 9.79 12.16 10.65 12.18 11.06 10.67 9.11 11.30Citrus fruit 4.07 3.25 4.26 4.44 4.55 5.15 4.93 5.15 5.91 5.47 5.61 6.40 6.23Olive oil 1.23 0.80 1.63 0.65 1.10 1.06 1.18 1.21 1.16 1.21 1.32 1.17 1.21Rapeseed 0.38 0.53 0.41 0.65 0.77 0.61 0.94 1.02 0.98 1.06 1.29 1.47 1.44Total vegetable oils and oilseeds(oil equivalent) 7 1.55 1.20 2.18 1.25 1.69 1.61 1.84 1.82 1.80 1.82 2.19 2.11 2.36Wine 14.22 19.93 16.69 19.74 19.44 18.34 18.83 18.62 17.67 20.44 17.63 17.54 23.37Tobacco 0.21 0.26 0.34 0.38 0.37 0.33 0.37 0.32 0.29 0.31 0.30 0.33 0.34Cotton (lint) 0.20 0.21 0.20 0.15 0.16 0.18 0.17 0.18 0.17 0.17 0.17 0.19 0.18Milk (total) 106.92 108.24 107.64 110.33 114.03 116.64 119.27 119.00 118.52 117.12 116.84 122.50 124.60Meat 3 14.84 15.59 15.86 16.07 16.60 17.17 17.95 18.67 18.82 21.19 22.03 21.76 21.84Eggs 3.44 3.55 3.70 3.91 3.82 3.96 4.06 4.20 4.42 4.61 4.64 4.75 4.82
FISHERY PRODUCTS 5 7.96 8.24 8.50 9.17 10.25 10.91 11.30 11.01 10.41 11.00 11.08 11.23 11.36
Fo REST PRODUCTS
Fuelwood 6 74.6 72.5 70.9 64.4 62.6 58.2 55.2 52.9 48.7 46.9 45.1 43.0 43.0Coniferous logs , 71.0 70.5 66.9 75.1 76.0 74.5 75.1 74.9 80.0 85.2 86.7 86.8 89.5Broadleaved logs 6 20.3 20.5 21.2 22.5 23.0 23.7 23.6 23.2 24.2 25.6 23.4 23.0 22.6Other industrial roundwood " 81.9 83.1 78.1 81.9 83.0 84.8 90.6 80.4 90.0 98.8 102.2 92.7 95.5Sawn softwood , 40.4 39.8 39.1 42.1 42.0 41.3 41.9 43.3 46.0 47.5 49.0 48.9 52.5Sawn hardwood 6 9.3 9.1 9.4 10.2 10.6 10.8 10.9 11.1 11.5 11.7 12.1 12.0 13.1Plywood , 2.1 2.2 2.5 2.6 2.6 2.6 2.7 2.8 3.1 3.1 3.2 3.6 3.9Particle board 6 2.4 2.8 3.5 4.3 5.1 5.8 6.6 7.8 9.3 10.7 17.3 14.6 16.5Fibreboard 1.7 1.7 1.8 1.9 2.0 1.9 1.9 2.0 2.1 2.2 2.2 2.3 2.5Mechanical wood pulp 5.6 5.6 5.8 6.2 6.4 6.7 6.5 7.1 7.6 8.0 7.6 7.9 9.0Chemical wood pulp 10.6 10.8 11.8 13.1 13.8 13.9 14.6 15.1 16.3 17.0 16.5 17.3 18.8Newsprint 4.1 4.1 4.1 4.4 4.7 4.9 4.9 5.0 5.3 5.6 5.2 5.3 5.1Printing and writing paper 4.8 4.8 5.3 5.7 6.0 6.7 7.1 8.1 9.0 9.6 9.6 10.4 11.5Other paper and paperboard . 12.3 12.7 13.9 14.8 15.5 15.9 16.1 17.5 19.2 19.8 19.7 20.9 22.9
Eastern Europe and U.S.S.R.
AGRICULTURAL PRODUCTS
Wheat 80.04 84.70 63.15 88.83 78.25 118.59 98.08 114.43 100.57 118.99 123.44 111.82 135.74Rye 28.06 26.73 21.92 23.73 27.64 23.65 23.65 25.58 21.66 20.58 23.26 20.58 21.66Barley 19.28 25.96 25.95 34.73 27.18 34.89 32.39 36.92 41.53 46.77 45.00 47.89 67.01Oats 14.30 10.82 8.79 9.48 10.37 13.70 16.61 16.47 18.25 19.04 19.92 19.19 22.45Millet and sorghum 3.00 2.89 1.96 3.62 2.31 3.27 3.36 2.77 3.43 2.20 2.14 2.21 4.45Maize 27.67 25.86 23.27 26.82 19.34 23.32 22.27 22.26 27.66 23.22 24.48 29.10 30.73Pulses 4.98 8.51 8.99 12.05 7.86 8.27 7.65 7.93 8.72 8.51 7.82 7.79 9.17Cotton (lint) 1.54 1.51 1.78 1.82 1.96 2.09 2.07 2.01 1.93 2.37 2.37 2.43 2.57Flax (fibre) 0.49 0.54 0.48 0.44 0.53 0.56 0.61 0.51 0.59 0.55 0.59 0.56 0.55Sugar (centrifugal) 10.26 9.73 9.63 14.39 12.55 12.85 14.45 13.78 12.20 12.93 11.96 12.67 13.61Total vegetable oils and oilseeds(oil equivalent) 7 2.99 3.10 3.18 3.90 3.86 4.35 4.64 4.65 4.24 4.45 4.40 4.07 5.18Sunflowerseed 5.65 5.74 5.26 7.03 6.45 7.35 7.89 7.97 7.77 7.42 7.09 6.55 8.93Potatoes 148.45 130.91 141.52 167.15 152.14 159.11 169.23 177.53 155.38 169.30 152.57 149.79 181.60Milk- (total) 7 92.37 92.72 89.94 92.53 103.54 109.16 114.18 117.03 116.45 118.12 118.71 120.17 124.85Meat 3 13.70 14.46 15.03 13.42 15.48 16.42 17.50 17.95 18.06 18.60 19.88 20.88 21.09Wool (greasy) 0.44 0.45 0.45 0.42 0.44 0.45 0.48 0.51 0.48 0.51 0.52 0.51 0.52Eggs 2.62 2.62 2.51 2.49 2.69 2.85 3.03 3.13 3.26 3.54 3.86 4.03 4.23

ANNEX TABLE 1. - VOI.UME OF PRODUCTION OF MAJOR AGRICULTURAL, FISHERY AND FOREST PRODUCTS (CO/WU/led)
See notes at end of table
159
1961 1962 1963 1964 1965 1966 1967 1968 1969 1970 1971 1972
1973(Pre-lim-
inary)
Million metric tons
FISHERY PRODUCTS 5 3.63 4.02 4.47 5.05 5.73 6.01 6.54 6.94 7.40 8.24 8.41 3.83 9.82
FOREST PRODUCTS
Fuelwood 3 113.7 112.5 118.1 124.5 120.7 117.9 112.5 106.8 103.6 101.4 101.6 100.5 101.5Coniferous logs" 171.5 171.3 173.0 178.1 145.5 144.4 154.7 156.2 157.9 166.6 166.5 167.5 174.0Broadleaved logs 6 32.5 34.1 34.4 35.5 30.4 30.6 32.5 33.1 33.7 34.5 35.6 35.7 38.5Other industrial roundwood, 100.9 104.1 113.0 116.7 150.4 151.1 155.0 157.9 152.1 156.8 157.3 154.6 167.0Sawn softwood6 104.1 104.3 105.1 111.4 111.7 108.5 110.2 111.3 113.1 116.5 119.1 119.3 120.0Sawn hardwood 20.2 20.6 21.1 19.1 19.0 18.8 19.3 19.5 19.8 20.4 20.8 20.8 20.6Plywood 6 2.0 2.2 2.2 2.4 2.4 2.5 2.6 2.6 2.8 2.9 2.7 2.7 2.9Particle board 6 0.7 0.9 1.2 1.5 1.8 3.0 2.7 3.1 3.4 3.8 4.4 4.8 4.9Fibreboard 0.5 0.6 0.7 0.9 1.0 1.1 1.2 1.3 1.4 1.5 1.6 1.7 1.9
Mechanical wood pulo 1.6 1.6 1.7 1.7 1.8 2.0 2.0 2.1 2.1 2.1 2.2 2.4 2.5Chemical wood pulp 3.8 4.2 4.3 4.3 4.6 5.1 5.6 6.0 6.3 6.9 7.3 7.2 7.6Newsprint 0.7 0.8 0.8 0.9 1.0 1.2 1.3 1.3 1.4 1.4 1.5 1.5 1.5Printing and writing paper 1.3 1.4 1.4 1.5 1.5 1.6 1.8 1.9 1.9 1.9 2.0 2.1 2.2Other paper and paperboard . 4.0 4.2 4.4 4.7 5.2 5.7 6.0 6.4 6.7 7.3 7.7 8.1 8.2
North America
AGRICULTURAL PRODUCTS
Wheat 41.25 45.11 50.90 51.28 53.48 58.22 57.57 60.58 58.36 45.81 58.44 56.56 63.04Barley 11.00 12.93 13.37 12.07 13.29 15.12 13.53 16.29 17.46 18.11 23.19 20.51 19.47Oats 19.04 22.29 20.89 17.72 19.62 17.41 16.15 19.23 19.52 18.99 18.40 14.67 14.68Maize 92.13 92.45 103.01 89.85 105.26 106.27 122.79 113.66 118.27 108.03 146.24 144.10 146.12Sorghum 12.20 12.96 14.87 12.44 17.09 18.16 19.20 18.79 18.98 17.36 22.25 20.56 23.79Rice (milled equivalent) , 1.60 1.95 2.01 2.16 2.25 2.51 2.64 3.07 2.68 2.47 2.53 2.52 2.74Sugar (centrifugal) 4.08 4.28 5.04 5.25 4.87 4.94 4.93 5.51 5.20 5.21 5.58 5.90 5.50Potatoes 15.32 14.15 14.40 13.10 15.30 16.42 15.99 15.75 16.51 17.29 16.72 15.36 15.63
Apples 2.92 2.99 3.08 3.28 3.17 2.99 2.89 2.88 3.51 3.24 3.16 3.06 3.13Citrus fruit 6.93 7.89 5.95 5.67 6.95 7.96 10.37 7.56 10.18 10.31 10.83 11.04 12.62
Soybeans 18.65 18.39 19.16 19.27 23.23 25.52 26.78 30.27 30.86 30.96 32.29 34.96 43.03Cottonseed 5.42 5.57 5.62 5.66 5.52 3.59 2.91 4.21 3.69 3.69 3.85 4.89 4.49Total vegetable oils and oilseeds(oil equivalent) 7 4.96 5.01 5.41 5.38 6.37 6.34 6.30 7.30 7.57 8.03 8.24 8.58 10.04
Tobacco 1.03 1.14 1.15 1.08 0.92 0.96 0.99 0.88 0.93 0.97 0.87 0.88 0.91
Cotton (lint) 3.12 3.24 3.34 3.31 3.26 2.09 1.62 2.38 2.18 2.22 2.28 2.98 2.82Milk (total) 65.35 65.61 65.16 65.99 64.66 62.73 62.14 61.51 61.27 61.37 61.84 62.60 60.65
Meat5 18.71 18.77 19.74 21.01 20.88 21.89 22.94 23.34 23.63 24.67 25.56 25.48 24.90
Eggs 4.09 4.12 4.07 4.15 4.17 4.21 4.43 4.40 4.40 4.48 4.56 4.44 4.24
FISHERY PRODUCTS 3 3.95 4.10 3.97 3.83 3.96 3.89 3.73 3.95 3.87 4.14 4.08 3.82 3.82
FOREST PRODUCTS
Fuelwood 6 48.3 39.4 36.5 37.6 36.8 34.8 26.8 26.0 24.9 19.4 18.0 17.2 17.2
Coniferous logs o 176.6 193.5 196.8 208.8 212.5 216.5 214.8 233.7 227.8 227.7 246.1 263.0 276.0Broadlcaved logs' 33.4 35.7 38.7 39.3 41.7 41.7 39.7 38.1 38.8 38.9 38.4 40.5 42.0
Other industrial roundwood" . . 125.0 124.3 119.7 127.9 135.2 145.1 142.5 145.2 161.1 163.3 151.5 154.7 160.0
Sawn softwood" 79.6 82.5 87.8 91.0 93.1 91.6 89.1 96.5 95.3 90.0 100.7 106.2 108.0Sawn hardwood ' 15.1 15.8 17.0 18.4 18.9 19.4 18.9 18.4 21.4 17.9 17.6 18.5 19.0
Plywood ' 9.7 10.6 11.9 13.1 14.5 14.8 14.9 16.5 15.6 16.0 18.3 20.0 22.0
Particle board 6 0.6 0.8 0.9 1.2 1.6 2.2 2.4 2.9 3.4 3.4 4.8 6.1 6.4
Fibreboard 1.9 2.0 2.2 2.4 2.4 2.3 2.4 2.7 3.0 2.9 3.2 3.6 3.9
Mechanical wood plop 9.6 9.9 10.1 10.8 11.1 11.8 11.4 12.1 13.0 13.1 13.7 13.8 14.0
Chemical wood pulp 25.0 26.4 28.5 31.1 33.0 35.9 36.3 40.3 42.7 43.0 43.1 45.4 46.0
Newsprint 8.0 8.0 8.0 8.7 9.0 9.9 9.8 10.1 11.1 11.0 10.8 11.0 11.2
Printing and writing paper . 6.9 7.3 7.6 3.1 8.8 9.8 9.7 10.3 10.9 10.8 11.1 12.1 12.6
Other paper and paperboard 23.9 25.1 26.2 28.0 29.9 31.6 31.4 34.1 36.0 35.5 36.5 39.2 40.8

ANNEX 'CABLE I. - VOLUME OF PRODUCTION OF MMOR AGRICULTURAL, FISHERY AND FOREST PRODUCTS (continued)
See notes at end of table.
160
1961 1962 1963 1964 1965 1966 1967 1968 1969 1970 1971 19721973
yi'mre -
inary)
Million metric tons
Oceania
AGRICULTURAL PRODUCTS
Wheat 6.98 8.57 9.17 10.31 7.32 12.99 7.89 15.25 I 1.00 8.18 8.83 7.04 12.35Sugar (centrifugal) 1.55 2.13 2.06 2.29 2.30 2.69 2.67 3.17 2.52 2.52 2.79 2.82 2.53Wool (greasY) 1.00 1.05 1.04 1.09 1.12 1.07 1.13 1.13 1.21 1.26 1.22 1.20 1.06Milk (total) 11.65 12.15 12.31 12.66 13.14 13.26 13.75 13.18 13.61 13.48 13.19 13.20 13.38Meat 3 2.32 2.51 2.58 2.65 2.58 2.53 2.71 2.86 3.07 3.11 3.25 3.55 3.65
FISHERY PRODUCTS 5 0.11 0.11 0.11 0.12 0.13 0.14 0.15 0.16 0.14 0.16 0.18 0.18 0.19
FOREST PRODUCTS
Fuclwood 6 7.6 7.6 7.5 7.5 7.4 7.4 7.3 7.3 7.3 7.2 7.4 7.4 7.4Industrial roundwood ' 15.8 15.0 16.0 17.3 17.6 18.1 18.2 19.0 19.8 20.3 20.9 21.5 22.2Sawn softwood 6 2.2 2.1 2.2 2.5 2.5 2.5 2.3 2.4 2.5 2.6 2.4 2.6 2.4Sawn hardwood a 2.6 2.4 2.5 2.6 2,8 2.7 2.6 2.8 2.6 2.7 2.8 2.8 2.8Particle board 6 0.01 0.02 0.04 0.06 0.10 0.15 0.18 0.23 0.27 0.32 0.34 0.33 0.41Mechanical wood Pulo 0.30 0.31 0.38 0.42 0.46 0.43 0.44 0.46 0.53 0.61 0.59 0.60 0.60Chemical wood pulp 0.31 0.33 0.38 0.41 0.44 0.49 0.54 0.54 0.67 0.69 0.71 0.80 0.80Newsprint 0.18 0.21 0.26 0.28 0.29 0.28 0.30 0.30 0.33 0.39 0.40 0.39 0.39Paper and paperboard other thannewsprint 0.45 0.49 0.55 0.59 0.69 0.71 0.77 0.78 0.89 0.97 0.99 1.10 1.0
Latin America
AGRICULTURAL PRODUCIS
Whcat 9.51 9.74 12.80 15.61 10.48 10.55 11.74 10.46 12.79 11.07 11.76 12.31 11.94Maize 24.34 25.53 26.10 27.38 31.08 32.70 35.14 33.57 32.95 38.17 39.14 35.18 40.28Rice (milled equivalent) 1 5.26 5.51 5.54 6.04 7.03 5.87 6.68 6.76 6.68 7.69 7.08 7.76 7.67Sugar (centrifugal) 18.04 15.92 15.56 16.77 19.94 17.83 19.98 18.73 18.71 25.54 21.86 21.51 23.84Citrus fruit 5.59 5.87 6.22 6.29 6.66 7.31 7.53 8.05 8.65 8.87 9.57 9.36 10.24Bananas 12.04 12.28 12.84 13.93 14.75 15.01 15.81 15.90 17.03 18.01 19.79 19.88 20.35Groundnuts 1.04 1.29 1.11 1.02 1.37 1.51 1.29 1.22 1.17 1.38 1.51 1.37 1.21Cottonseed 2.38 2.77 2.88 2.90 2.98 2.96 2.66 3.02 3.08 2.82 2.53 3.00 3.02Sunflowerseed 0.68 0.97 0.59 0.57 0.84 0.94 1.23 1.03 0.97 1.23 0.90 0.91 0.97Copra 0.27 0.28 0.24 0.25 0.25 0.24 0.25 0.25 0.25 0.22 0.21 0.24 0.23Palm kernels 0.16 0.18 0.18 0.20 0.22 0.22 0.22 0.22 0.23 0.25 0.26 0.26 0.27Total vegetable oils and oilseeds(oil equivident)0 1.82 2.12 2.21 2.28 2.52 2.69 2.61 2.61 2.77 3.05 2.98 3.24 3.53Coffee 3.68 3.08 2.77 1.87 3.62 2.54 2.87 2.42 2.61 2.28 3.00 2.86 2.52Cocoa 0.33 0.32 0.31 0.32 0.32 0.33 0.37 0.35 0.38 0.38 0.41 0.41 0.38Tobacco 0.44 0.48 0.52 0.50 0.54 0.50 0.54 0.55 0.55 0.57 0.54 0.58 0.51Cotton (lint) 1.32 1.54 1.61 1.63 1.67 1.65 1.50 1.71 1.70 1.56 1.40 1.66 1.69Sisal 0.20 0.21 0.21 0.22 0.24 0.23 0.22 0.21 0.21 0.27 0.28 0.30 0.33Wool (greasY) 0.34 0.33 0.34 0.35 0.34 0.37 0.35 0.34 0.34 0.34 0.32 0.30 0.31Milk (total) 18.42 18.73 19.34 20.51 21.20 22.10 22.11 23.09 23.81 23.96 25.74 26.71 27.63Meat 3 7.64 8.03 8.39 8.00 8.26 8.65 8.99 9.72 10.17 10.45 10.12 10.72 10.75Eggs 0.97 0.98 1.02 1.06 1.15 1.25 1.31 1.36 1.46 1.53 1.63 1.71 1.78
FISHERY PRODUCTS 5 6.78 8.75 8.90 11.67 9.64 11.64 12.82 13.66 11.96 15.52 13.98 7.63 5.20
FOREST PRODUCTS
FUCIWOOd a 187.8 193.5 204.6 209.1 209.8 215.9 216.2 221.3 221.4 221.8 228.4 228.4 230.0Industrial roundwood ° 34.0 36.2 34.5 36.4 37.9 39.6 40.4 43.7 45.5 50.4 51.4 52.7 57.0Sawn softwood 0 5.1 5.3 5.0 5.5 5.7 6.2 6.2 6.6 7.0 7.3 7.4 7.5 7.7Sawn hardwood 0 6.3 6.6 6.4 6.8 6.7 7.1 7.2 7.4 7.8 8.6 3.9 8.5 9.2Plywood a 0.33 0.37 0.37 0.38 0.39 0.40 0.44 0.49 0.53 0.67 0.77 0.77 0.80Particle board ' 0.05 0.07 0.10 0.14 0.16 0.19 0.21 0.30 0.38 0.59 0.63 0.68 0.68All wood pulp 0.67 0.75 0.86 0.94 1.09 1.31 1.34 1.46 1.52 1.72 1.80 1.98 2.40All paper and paperboard . . . 1.77 1.90 2.01 2.30 2.60 2.80 2.90 3.10 3.40 3.80 4.00 4.40 4.70

ANNEX TABLE 1. VOLUME OF PRODUCTION OF MAJOR AGRICULTURAL, FISHERY A NL) FOREST PRODUCTS (continued)
See notes at end of table.
161
1961 1962 1963 1964 1965 1966 1967 1968 1969 1970 1971 19721973(Pre-lim-
inary)
Million metric tons
Far East
AGRICULTURAL l'RODUCTS
Wheat 15.32 16.61 15.41 14.57 17.43 14.96 16.35 23.62 25.99 28.15 31.03 33.97 33.11Maize 10.16 11.48 10.83 12.50 11.37 13.00 13.61 13.85 13.66 16.20 13.89 13.43 15.46Millet and sorghum 16.65 18.58 17.99 19.21 15.04 17.84 19.99 17.99 19.84 21.35 18.01 14.58 18.12Rice (milled equivalent) ' . . . 79.06 77.72 84.04 87.44 78.16 78.14 86.39 91.48 95.62 98.07 97.57 89.85 104.78Sugar (centrifugal) 6.80 6.45 6.99 6.57 7.60 8.10 6.36 6.42 8.41 8.56 8.37 7.39 8.85Sugar (noncentri fugal) 7.84 7.73 7.49 8.13 8.88 8.99 8.00 8.05 9.16 9.89 9.88 9.38 9.13Pulses 1° 14.28 13.42 13.36 12.07 13.92 11.52 10.54 13.76 12.39 13.88 13.30 12.59 11.67Soybeans 0.69 0.65 0.61 0.66 0.68 0.70 0.76 0.80 0.76 0.82 0.77 0.32 0.82Groundnuts 6.09 6.23 6.32 7.13 5.34 5.61 6.99 5.97 6.51 7.48 7.56 5.16 7.10Copra 2.73 2.46 2.65 2.70 2.69 2.85 2.53 2.65 2.63 2.84 3.27 3.64 3.30Total vegetable oils and oilseeds(oil equivalent) 11 5.59 5.64 6.79 6.79 6.41 6.38 7.04 6.98 7.22 7.91 8.38 7.64 8.41Tea 0.69 0.69 0.70 0.72 0.73 0,73 0.74 0.76 0.75 0.74 0.77 0.81 0.82Tobacco 0.69 0.76 0.76 0.79 0.80 0.80 0.88 0.95 0.93 0.89 0.82 0.94 0.89Cotton (lint) 1.26 1.49 1.60 1.50 1.46 1.52 1.72 1.64 1.64 1.56 2.01 1.92 1.94Jute 2 3.17 2.65 2.79 2.72 2.87 3,09 3.14 2.00 2.99 2.88 2.51 2.84 3.09Rubber (natural) 1.93 1.95 2.01 2.08 2.16 2.25 2.24 2.44 2.68 2.70 2.77 2.80 3.16Milk (total) 26.27 26.37 26.48 26.52 26.41 26.17 26.85 27.46 28.56 29.60 30.59 31.64 32.81Meat 3 2.72 2.77 2.36 3.03 3.12 3.27 3.30 3.31 3.44 3.58 3.86 3.74 3.85Eggs 0.53 0.55 0.58 0.62 0.66 0,68 0.70 0.76 0.35 0.87 0.92 1.02 1.06
F1SIIERY PRODUC FS 3 4.56 4.74 5.20 5.87 6.11 6.59 6.95 7.70 8.16 8.43 9.01 9.39 10.01
FOREST PRODUCTS
Fuelwood 6 243.1 249.1 253.7 261.1 267.4 274.2 280.9 288.9 295.1 302.0 308.5 308.6 312.0Industrial roundwood G 37.3 38.6 43.9 46.0 49.6 50.8 55.3 61.2 64.1 66.5 68.7 73.9 79.0Sawn softwood 6 0.6 0.9 1.1 1.3 1.4 1.2 1.3 1.4 1.4 1.4 1.6 1.7 1.7
Sawn hardwood 6 8.4 8.5 9.4 9.8 10.1 10.5 11.7 11.2 12.3 12.7 12.0 13.1 14.0
Plywood 6 0.3 0.4 0.5 0.5 0.7 0.8 1.0 1.4 1.5 1.6 1.8 2.2 2.3
All wood pulp 0.08 0.08 0.11 0.12 0.15 0.16 0.16 0.21 0.23 0.25 0.25 0.30 0.30
All paper and paperboard 0.80 0.87 0.96 1.05 1.16 1.23 1.28 1.44 1.63 1.79 1.89 2.17 2.34
China and other Asian centrallyplanned countries
FISHERY l'RODUCTS 5 4.93 5.44 6.24 6.82 7.16 6.75 7.03 7.20 7.97 3.63 8.67 8.70
AGRICULTURAL PRODUC I S
Wheat 16.73 21.62 22.20 25.94 26.40 26.04 28.40 27.30 28.72 31.34 32.93 34.73 35.52
Maize 21.73 24.21 24.65 25.72 27.45 27.40 27.78 27.88 29.29 31.11 31.23 29.59 30.90
Millet and sorghum 15.51 16.91 17.61 18.21 19.40 19.40 19.69 19.70 20.62 22.42 23.44 22.45 23.53
Rice (milled equivalent) i 58.04 58.97 59.12 61.85 64.72 63.91 66.44 65.92 68.67 73.37 74.30 71.46 74.43
Sugar (centrifugal) 2.15 1.98 2.12 2.71 3.19 3,33 3.23 3.42 3.56 3.66 3.99 4.04 4.13
Sugar (noncentrifugal) 0.36 0.29 0.28 0.61 0.68 0.70 0.71 0.78 0.79 0.79 0.79 0.79 0.81
Pulses '0 6.92 7.24 7.51 7.84 7.83 7.84 7.85 7.77 8.18 8.29 8.49 3.60 8.65
Soybeans 10.64 10.49 10.69 11.46 11.26 11.26 11.42 11.00 11.23 11.89 11.99 11.49 12.03
Groundnuts 1.84 1.77 2.03 2.45 2.47 2.52 2.48 2.30 2.50 2.62 2.72 2.54 2.74
Total vegetable oils and oilseeds(oil equivalent) "2 3.34 3.33 3.65 4.11 4.15 4.23 4.28 4.07 4.08 4.29 4.34 4.14 4.35
Tea 0.18 0.18 0.18 0.18 0.18 0.18 0.19 0.19 0.20 0.20 0.26 0.29 0.31
Tobacco 0.61 0.66 0.78 0.83 0.34 0.85 0.91 0.91 0.84 0.85 0.35 0.90 1.01
Cotton (lint) 0.92 0.89 1.02 1.39 1.54 1.68 1.81 1.68 1.61 1.70 1.65 1.41 1.55
Jute 2 0.33 0.33 0.38 0.43 0.47 0.49 0.51 0.50 0.54 0.53 0.64 0.63 0.71
Milk (total) 4.50 4.55 4.63 4.70 4.76 4.80 4.85 4.90 4.96 5.19 5.25 5.37 5.41
Meat 3 11.84 12.17 12.55 12.82 13.17 13.49 13.88 14.15 14.37 14.68 14.90 15.27 15.64
Eggs 2.49 2.59 2.87 2.88 3.01 298 3.34 3.39 3.44 3.47 3.52 3.57 3.62
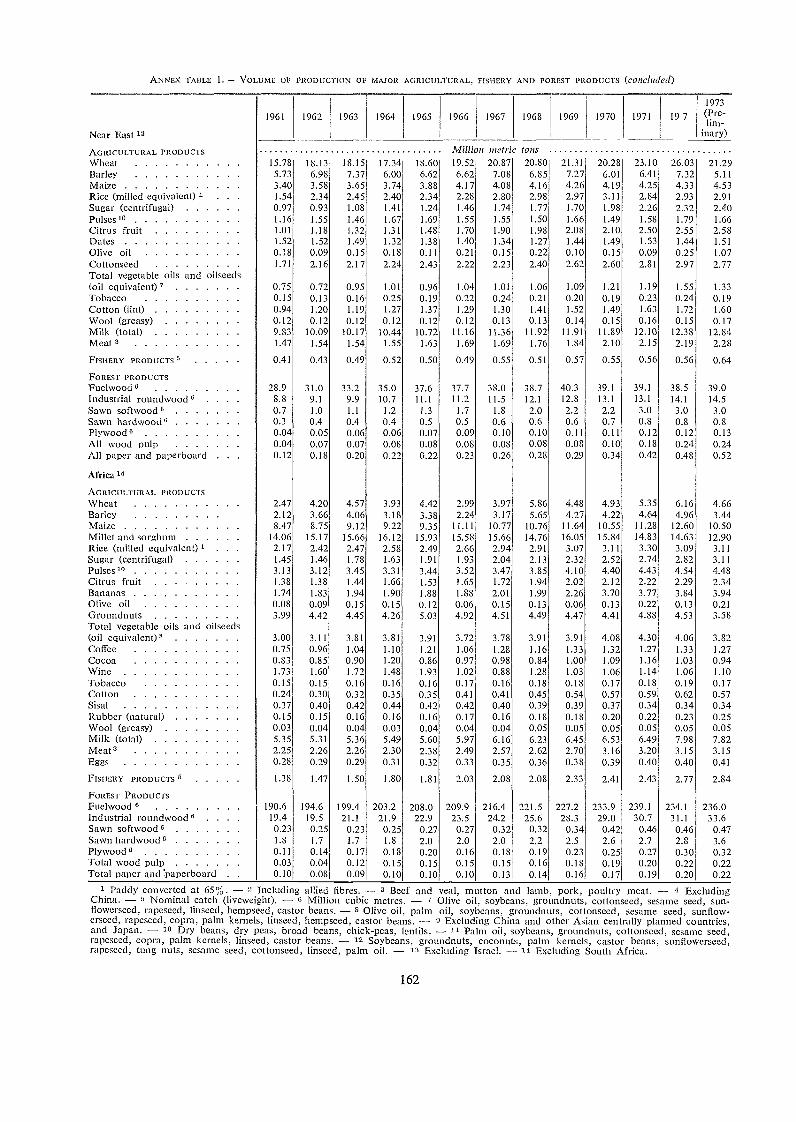
ANNEX TABLE 1. - VOLUME OE PRODUCTION OF MAJOR AGRICULTURAL, FISHERY ANO FOREST PRODUCTS (concluded)
Paddy converted at 65%. - Including allied fibres. - 3 Beef and veal, mutton and lamb, pork, poultry meat. - 4 ExcludingChina. - 5 Nominal catch (livewe ght). - 6 Million cubic metres. - 7 Olive oil, soybeans, groundnuts, cottonseed, sesame seed, sun-flowerseed, rapeseed, linseed, hempseed, castor beans. - s Olive oil, palm oil, soybeans, groundnuts, cottonseed, sesame seed, sunflow-erseed, rapeseed, copra, palm kernels, linseed, hempseed, castor beans. - 0 Excluding China and other Asian centrally planned countries,and Japan. - 10 Dry beans, dry peas, broad beans, chick-peas, lentils. - 11 Palm oil, soybeans, groundnuts, cottonseed, sesame seed,rapeseed, copra, palm kernels, linseed, castor beans. - 12 Soybeans, groundnuts, coconuts, palm kernels, castor beans, sunflowerseed,rapeseed, tung nuts, sesame seed, cottonseed, linseed, palm oil. - 13 Excluding Israel. - 14 Excluding South Africa.
162
Near East 13
1961 1962 1963 1964 1965 1966 1967 1968 1969 1970 1971 1971973(Pre-11m-
inary)
AGRICULTURAL PRODUCTS Million metric tonsWheat 15.78 18.13 18.15 17.34 18.60 19.52 20.87 20.80 21.31 20.28 23.10 26.03 21.29Barley 5.73 6.98 7.37 6.00 6.62 6.62 7.08 6.85 7.27 6.01 6.41 7.32 5.11Maize 3.40 3.58 3.65 3.74 3.88 4.17 4.08 4.16 4.26 4.19 4.25 4.33 4.53Rice (milled equivalent), 1.54 2.34 2.45 2.40 2.34 2.28 2.80 2.98 2.97 3.11 2.84 2.93 2.91Sugar (centrifugal) 0.97 0.93 1,08 1.41 1.24 1.46 1.74 1.77 1.70 1.98 2.26 2.32 2.40Pulses 15 1.16 1.55 1.46 1.67 1.69 1.55 1.55 1.50 1.66 1.49 1.58 1.79 1.66Citrus fruit 1.01 1.18 1.32 1.31 1.48 1.70 1.90 1.98 2.08 2.10 2.50 2.55 2.58Dates 1.52 1.52 1.49 1.32 1.38 1.40 1.34 1.27 1.44 1.49 1.53 1.44 1.51Olive oil 0.18 0.09 0.15 0.18 0.11 0.21 0.15 0.22 0.10 0.15 0.09 0.25 1.07Cottonseed 1.71 2.16 2.17 2.24 2.43 2.22 2.23 2.40 2.62 2.60 2.81 2.97 2.77Total vegetable oils and oilseeds(oil equivalent)? 0.75 0.72 0.95 1.01 0.96 1.04 1.01 1.06 1.09 1.21 1.19 1.55 1.33Tobacco 0.15 0.13 0.16 0.25 0.19 0.22 0.24 0.21 0.20 0.19 0.23 0.24 0.19Cotton (lint) 0.94 1.20 1.19 1.27 1.37 1.29 1.30 1.41 1.52 1.49 1.63 1.72 1.60wool (greasY) 0.12 0.12 0.12 0.12 0.12 0.12 0.13 0.13 0.14 0.15 0.16 0.15 0.17Milk (total) 9.83 10.09 10.17 10.44 10.72 11.16 11.36 11.92 11.91 11.89 12.10 12.33 12.84MCBY 3 1.47 1.54 1.54 1.55 1.63 1.69 1.69 1.76 1.84 2.10 2.15 2.19 2.28
FISIIERY PRODUCTS 5 0.41 0.43 0,49 0.52 0.50 0.49 0.55 0.51 0.57 0.55 0.56 0.56 0.64
FOREST PRODUCTSFuclwood 6 28.9 31.0 33.2 35.0 37.6 37.7 38.0 38.7 40.3 39.1 39.1 38.5 39.0Industrial roundwood " 8.8 9.1 9.9 10.7 11.1 11.2 11.5 12.1 12.8 13.1 13.1 14.1 14.5Sawn softwood 0.7 1.0 1.1 1.2 1.3 1.7 1.8 2.0 2.2 2.2 3.0 3.0 3.0Sawn hardwood' 0.3 0.4 0.4 0.4 0.5 0.5 0.6 0.6 0.6 0.7 0.8 0.8 0.8Plywood 6 0.04 0.05 0.06 0.06 0.07 0.09 0.10 0.10 0.11 0.11 0.12 0.12 0.13All wood pulp 0.04 0.07 0.07 0.08 0.08 0.08 0.08 0.08 0.08 0.10 0.18 0.24 0.24All paper and paperboard . 0.12 0.18 0,20 0.22 0.22 0.23 0.26 0.28 0.29 0.34 0.42 0.48 0.52
Africa 1"
AGRICULTURAL PRODUCTSWheat 2.47 4.20 4.57 3.93 4.42 2.99 3.97 5.86 4.48 4.93 5.35 6.16 4.66Barley 2.12 3.66 4.06 3.18 3.38 2.24 3.17 5.65 4.27 4.22 4.64 4.96 3.44Maize 8.47 8.75 9.12 9.22 9.35 11.11 10.77 10.76 11.64 10.55 11.28 12.60 10.50Millet and sorghum 14.06 15.17 15.66 16.12 15.93 15.58 15.66 14.76 16.05 15.84 14.83 14.63 12.90Rice (milled equivalent) l 2.17 2.42 2,47 2.58 2.49 2.66 2.94 2.91 3.07 3.11 3.30 3.09 3.11Sugar (centrifugal) 1.45 1.46 1,78 1.63 1.91 1.93 2.04 2.13 2.32 2.52 2.74 2.82 3.11Pulses '° 3.13 3.12 3.45 3.31 3.44 3.52 3.47 3.85 4.10 4.40 4.43 4.54 4.48Citrus fruit 1.38 1.38 1.44 1.66 1.53 1.65 1.72 1.94 2.02 2.12 2.22 2.29 2.34Bananas 1.74 1.83 1.94 1.90 1.88 1.88 2.01 1.99 2.26 3.70 3.77 3.84 3.94Olive oil 0.08 0.09 0,15 0.15 0.12 0.06 0.15 0.13 0.06 0.13 0.22 0.13 0.21Groundnuts 3.99 4.42 4.45 4.26 5.03 4.92 4.51 4.49 4.47 4.41 4.88 4.53 3.58Total vegetable oils and oilseeds(oil equivalent)S 3.00 3.11 3.81 3.81 3.91 3.72 3.78 3.91 3.91 4.08 4.30 4.06 3.82Coffee 0.75 0.96 1.04 1.10 1.21 1.06 1.28 1.16 1.33 1.32 1.27 1.33 1.27Cocoa 0.83 0.85 0.90 1.20 0.86 0.97 0.98 0.84 1.00 1.09 1.16 1.03 0.94Wine 1.73 1.60 1.72 1.48 1.93 1.02 0.88 1.28 1.03 1.06 1.14 1.06 1.10To bacco 0.15 0.15 0.16 0.16 0.16 0.17 0.16 0.18 0.18 0.17 0.18 0.19 0.17Cotton 0.24 0.30 0.32 0.35 0.35 0.41 0.41 0.45 0.54 0.57 0.59 0.62 0.57Sisal 0.37 0.40 0.42 0.44 0.42 0.42 0.40 0.39 0.39 0.37 0.34 0.34 0.34Rubber (natural) 0.15 0.15 0,16 0.16 0.16 0.17 0.16 0.18 0.18 0.20 0.22 0.23 0.25Wool (greasy) 0.03 0.04 0.04 0.03 0.04 0.04 0.04 0.05 0.05 0.05 0.05 0.05 0.05Milk (total) 5.35 5.31 5.36 5.49 5.60 5.97 6.16 6.23 6.45 6.53 6.49 7.98 7.82Meat 3 2.25 2.26 2.26 2.30 2.38 2.49 2.57 2.62 2.70 3.16 3.20 3.15 3.15Eggs 0.28 0.29 0.29 0.31 0.32 0.33 0.35 0.36 0.38 0.39 0.40 0.40 0.41
FISHERY PRODUCTS 5 1.33 1.47 1.50 1.80 1.81 2.03 2.08 2.08 2.33 2.41 2.43 2.77 2.84
FOREST PRODUCTSFuelwood 6 190.6 194.6 199.4 203.2 208.0 209.9 216.4 221.5 227.2 233.9 239.1 234.1 236.0Industrial roundwood ' 19.4 19.5 21.1 21.9 22.9 23.5 24.2 25.6 28.3 29.0 30.7 31.1 33.6Sawn softwood° 0.23 0.25 0.23 0.25 0.27 0.27 0.32 0.32 0.34 0.42 0.46 0.46 0.47Sawn hardwood' 1.8 1.7 1.7 1.8 2.0 2.0 2.0 2.2 2.5 2.6 2.7 2.8 3.6Plywood 6 0.11 0.14 0.17 0.18 0.20 0.16 0.18 0.19 0.23 0.25 0.27 0.30 0.32Total wood pull') 0.03 0.04 0.12 0.15 0.15 0.15 0.15 0.16 0.18 0.19 0.20 0.22 0.22Total paper and 'paperboard . . 0.10 0.08 0.09 0.10 0.10 0.10 0.13 0.14 0.16 0.17 0.19 0.20 0.22

WESTERN EUROPE
Food production
EUROPEAN ECONOMIC COMMUNITY
Belgium 116 119 129 125 127 +2 Ill 115 125 119 121 +2Denmark 99 95 99 97 97 + I 94 91 94 91 91France 114 117 123 126 133 +3 107 110 113 116 118 +2Germany, Fed. Rep. of . 115 116 121 115 116 +1 109 108 114 108 109 +1Ireland 117 115 127 121 122 114 II I 122 115 114 IItaly 119 120 120 115 121 +5 113 114 113 107 Ill +4Luxembourg 105 98 100 100 102 +2 101 93 94 94 95 +1Netherlands 117 128 138 134 142 +6 109 118 125 120 126 +5United Kingdom 109 116 119 120 120 106 112 115 115 115
OTHER WESTERN EUROPE
Austria 115 110 112 109 113 -14 112 107 108 104 107 +3Finland 111 Ill 119 119 113 ---5 107 107 115 116 III --5Greece 128 146 138 144 142 I 123 140 130 136 133 2Iceland 102 101 100 107 109 +2 93 91 90 95 96 +1Malta 131 142 148 150 155 +3 132 142 148 150 154 +3Norway 104 104 106 108 112 +4 99 98 100 101 104 +3Portugal 105 110 103 107 109 12 99 104 96 99 100 +2Spain 121 125 129 132 141 +6 114 117 119 121 127 +5Sweden 94 104 106 107 105 2 90 99 100 101 98 3Switzerland 113 108 115 113 119 5 104 99 104 101 106 14Yugoslavia 138 117 131 127 135 7 130 109 121 116 123 +6
REGIONAL t 115 117 121 121 124 +3 j 09 III 114 113 115 +2
Agricultural production
EUROPEAN ECONOMIC COMMUNITY
BelgiumDenmarkFranceGermany, Fed. Rep. ofIrelandItalyLuxembourgNetherlandsUnited Kingdom
OTHER WESTERN EUROPE
AustriaFinlandGreeceIcelandMaltaNorwayPortugalSpainSwedenSwitzerlandYugoslavia
REGIONAL
ANNEX 'CABLE 2. INDICES OF FOOD ANO AGRICULTURAL PRODUCTION, BY COUNTRIES
1969 1970 1971
Total
1969 1970
Per eanut
1971 1972
1961-65 average -- 100 Percent
114 117 128 123 125 +2 110 113 123 117 119 +199 95 99 97 97 +1 94 91 94 90 91
113 117 121 126 129 -1 3 107 109 112 116 118 +2115 116 121 115 116 +1 108 108 114 105 109 +1116 114 127 121 121 113 110 112 114 113 1119 120 120 115 120 1-5 113 114 113 107 111 -1 4
105 98 100 100 102 +2 101 93 94 94 95 +1116 127 137 132 141 +6 108 116 124 119 125 +5109 115 119 120 120 105 1 1 1 114 114 114
115 110 112 109 113 +4 112 106 107 104 107 +3Ill 111 119 119 113 5 107 107 115 116 Ill 5122 139 132 138 137 1 117 133 125 129 127 1102 97 97 103 105 +2 93 88 87 92 93 +1131 142 148 150 155 +3 132 142 148 150 154 +3104 103 106 108 112 +4 99 98 99 100 104 +3104 110 102 106 109 -1-2 99 103 95 98 100 +2119 123 127 130 138 +6 112 115 117 119 125 +594 104 106 107 105 2 90 98 99 101 98 3
113 108 115 113 119 +5 104 99 104 101 106 +4136 116 129 126 134 +7 128 108 119 115 122 +6
114 117 121 120 123 +3 I 109 110 113 112 114 +2
163
1973 Change(Pre- 1972lim- to
inary) 1973
1973 Change1972 (Pre- 1972
lim- toinary) 1973
1961-65 average = 100 Percent
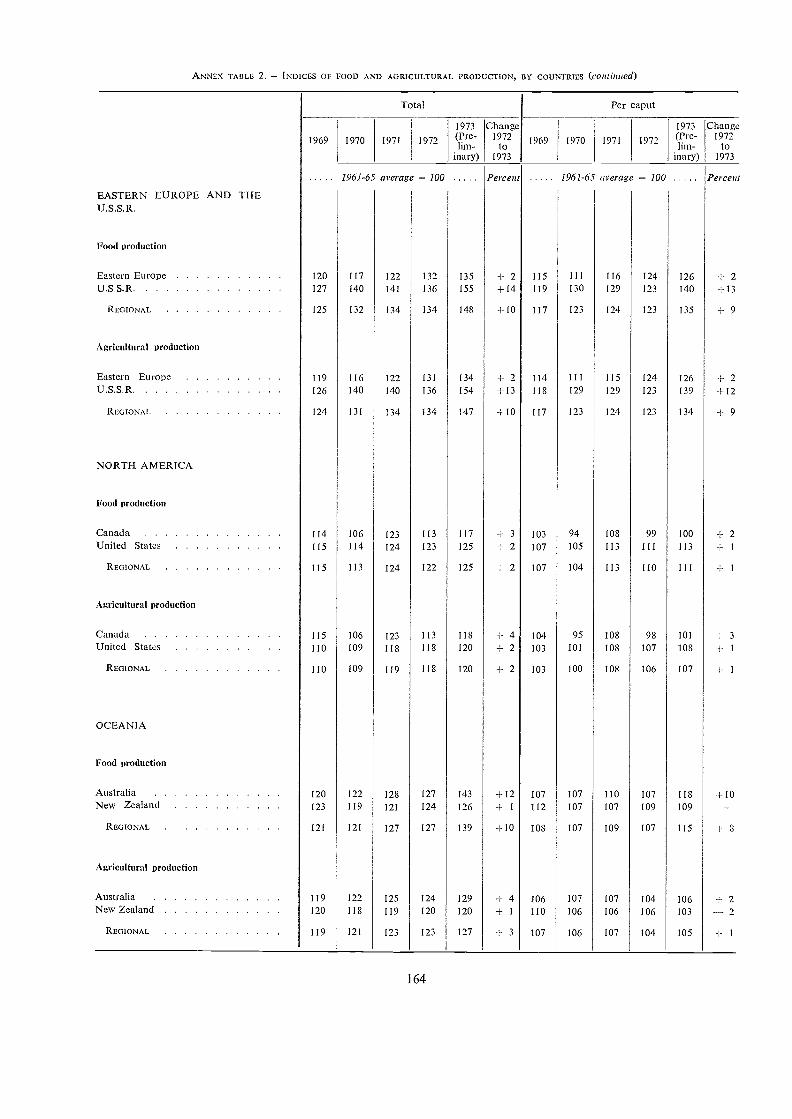
ANNEX TABLE 2. INDICES OF FOOD AND AGRICULTURAL PRODUCTION, BY COUNTRIES (continued)
164
NORTH AMERICA
Food production
Canada 114 106 123 113 117 + 3 103 94 108 99 100 -I- 2United States 115 114 124 123 125 + 2 107 105 113 111 113 -f-
REGIONAL 115 113 124 122 125 + 2 107 104 113 110 I 1 I -I- 1
Agricultural production
Canada 115 106 123 113 118 -I- 4 104 95 108 98 101 + 3United States 110 109 118 118 120 +2 103 101 108 107 108 +
REGIONAL 110 109 119 118 120 + 2 103 100 108 106 107 -1 I
1969 1970 1971 1972
1973(Pre-lim-
inary)
Change1972
to1973
1969 1970 1971 1972
1973(Pre-lim-
inary)
Change1972
to1973
1961-65 average 100 Percent 1961-65 average 100 Percent
EASTERN EUROPE AND THEU.S.S.R.
Food production
Eastern Europe 120 117 122 132 135 +2 115 111 116 124 126 + 2U.S.S.R . 127 140 141 136 155 +14 119 130 129 123 140 + 13
REGIONAL 125 132 134 134 148 -I-lo 117 123 124 123 135 + 9
Agricultural production
Eastern Europe 119 116 122 131 134 -E 2 114 111 115 124 126 -F 2U.S.S R 126 140 140 136 154 + 13 118 129 129 123 139 -1-12
REGIONA 124 131 134 134 147 +10 117 123 124 123 134 -I 9
OCEANIA
Food production
Australia 120 122 128 127 143 +12 107 107 110 107 118 + 10New Zealand 123 119 121 124 126 +1 112 107 107 109 109
REGIONAL 121 121 127 127 139 ±10 108 107 109 107 115 +8
Agricultural production
Australia 119 122 125 124 129 + 4 106 107 107 104 106 -F 2New Zealand 120 118 119 120 120 +1 110 106 106 106 103 2
REGIONAL 119 121 123 123 127 3 107 106 107 104 105 +
Total Per caput

LATIN AMERICA
Food production
CENTRAL AMERICA
ANNEX TABLE 2. INDICES OF FOOD AND AIRICULTURAL PRODUCTION, BY COUNTRIES (continued)
1969 1970
1961-65 average = 100
1971
165
1972
1973(Pre-lim-
inary)
Change1972to
1973
Farce t 1961-65 average 100
1969 1970 1971 1972
1973(Pre-lim-
inary)
Change1972to
1973
Percent
Costa Rica 148 158 171 181 183 +1 118 122 126 129 126 3El Salvador 120 126 137 127 144 +13 99 101 106 95 103 +9Guatemala 124 130 138 139 147 +6 105 107 110 108 111 + 3Honduras 138 147 165 160 175 +10 113 117 126 118 125 +6Mexico 126 132 138 138 144 +5 103 104 105 101 102 +1Nicaragua 131 134 144 146 148 +2 110 109 114 112 110 2Panama 149 141 152 152 156 +2 123 112 117 113 112 1
CARIBBEAN
Barbados 88 97 88 78 82 +6 83 97 88 77 SI +5Cuba 97 143 116 103 113 +9 86 123 97 84 90 +6Dominican Republic 121 133 137 146 147 +1 99 105 104 107 105 3Haiti 107 110 113 114 116 +2 93 93 93 92 91 1
Jamaica 101 104 112 107 105 3 88 89 94 88 84 4SOUTH AMERICA
Argentina 118 114 108 109 112 2 107 102 96 95 96 +Bolivia 125 130 135 142 148 +5 109 110 112 115 117 +2Brazil 124 128 134 144 148 105 105 107 112Chile 113 121 123 122 108 98 103 102 99 86 13Colombia 118 124 130 130 131 97 98 99 96 94 3Ecuador 110 121 125 118 116 2 90 96 95 87 83 5Guyana 126 120 132 125 134 7 106 97 105 97 101 +4ParaguayPeruUruguayVenezuela
114119112142
124129116147
12813096
148
127130
96151
133135
95158
+5+4-+ 5
9499
104117
98104106117
98102
87114
949986
112
9510084
114
+1+12+1
REGIONAL 120 125 125 128 131 +3 101 102 100 99 99
Agricultural production
CENTRAL AMERICA
Costa Rica 148 157 169 179 182 +1 118 121 125 128 125 3El Salvador 108 113 125 122 135 +11 89 90 96 91 97 +7Guatemala 127 127 134 142 152 +7 107 104 107 110 115 -F 4Honduras 138 144 161 158 173 +9 113 114 123 117 124 +6Mexico 120 122 129 129 133 +3 98 96 98 95 95Nicaragua 129 122 133 144 145 -1-1 109 100 106 111 108 2Panama 149 141 151 152 155 +2 123 112 117 113 112 1
CARIBBEAN
BarbadosCubaDominican RepublicHaitiJamaica
8896
118101101
97141130108104
88114134111112
78103143112107
82111146115104
+6+8+2+2-2
8385979288
971221029189
8896
1029294
7784
1059088
8189
1049084
+5+524
SOUTfi AMERICA
ArgentinaBoliviaBrazilChileColombiaEcuadorGuyanaParaguayPeruUruguayVenezuela
116126125113120110126116112109141
113130128121126121120123121111146
10613613212113112413212512196
148
107145143119132118121127119
89151
110156146106134116134138125
89158
+3+8+ 211+22-I- 7+8+5+5
106109106989990
1069593
101116
10111010510210096989897
102116
94113105100100
95105959587
114
94117
96988797949080
112
95123110
849683
101989278
114
-I- 1+511325+4+4
+ 2-2+ 1
REGIONAL 119 122 122 125 128 2 100 101 98 97 97 -1
Total Per caput

ANNEX TABLE 2. INDICES OF FOOD AND AGRICULTURAL PRODUCTION, BY COUNTRIES (continued)
166
1969 1970 1971 1972
1973(Pre-lim-
inary)
ange1972
to1973
1969 1970 1971 1972
1973(Pre-lim-
inary)
Change1972
to1973
1961-65 average -- 100 Percent 1961-65 average -- 100 Pe,cent
FAR EAST
Food production
SOUTH ASIA
Bangladesh 123 117 107 106 122 +15 101 92 81 78 86India 116 123 123 117 127 + 8 101 105 103 96 102 4- 6
Nepal 108 I 1 1 118 102 119 +17 95 96 99 84 96 +14Pakistan 141 147 144 148 153 -I- 4 IIS 120 113 113 114 + I
Sri Lanka 113 113 116 117 115 --2 98 99 96 94 90 4
EAST AND SOUTHEAST ASIA
Burma 106 110 II! 103 114 +10 93 94 92 84 91 + 8Indonesia 113 123 126 125 134 + 7 96 102 101 97 101 4Khmer Republic 107 147 114 96 64 ---34 91 121 91 75 48 ----36Korea, Rep. of 131 129 130 131 137 -1- 4 113 108 106 105 107 1- 2
Laos 149 152 144 145 154 + 6 129 128 118 116 120 + 3Malaysia
Sabah 146 148 171 214 212 1 117 115 129 155 148 5
Sarawak 135 132 140 146 152 4- 4 112 105 108 108 108
West Malaysia 137 144 158 166 179 + S 116 120 128 131 137 + 5Philippines 121 127 128 130 144 +10 100 101 99 97 103 + 6Thailand 127 129 136 121 148 +23 105 104 105 90 107 +19Viet-Nam, Rep. of 105 114 122 124 127 -I- 3 91 97 102 101 102 + 1
Developing countries 118 124 124 120 130 4- 9 102 104 102 96 101 + 6
China 116 122 126 124 129 I 5 104 108 109 106 109 -I 3
Japan 122 120 114 122 122 114 I 1 1 105 1 1 1 109 -2
Agricultural production
SOUTH ASIA
Bangladesh 123 116 103 106 119 +13 100 92 79 78 85 -I- 9
India 115 121 123 117 126 + 8 101 104 103 96 101 + 6Nepal 108 111 118 103 120 +17 95 96 100 85 97 -I-14Pakistan 141 147 148 150 154 + / 119 120 117 115 114Sri Lanka 114 119 117 117 115 2 99 101 96 94 90 ----- 4
EAST AND SOUT EAST ASIA
Burma 106 110 III 105 116 +11 93 94 92 85 92Indonesia 113 122 124 124 133 4- 7 96 101 100 96 100 - 4Khmer Republic 108 140 107 93 63 --32 92 115 86 72 47 - -34Korea, Rep. of 133 131 132 137 143 + 4 115 110 108 110 112 - 2Laos 149 152 145 146 154 + 6 129 128 119 117 120 3Malaysia
Sabah 137 141 150 173 185 -I- 7 111 110 113 125 129 - 4Sarawak 115 92 94 97 127 +30 95 74 72 72 91 25West Malaysia 147 152 162 166 187 +13 124 126 131 131 143 10
Philippines 120 125 127 129 142 +10 99 100 98 96 102 6Thailand 128 130 137 124 150 +22 106 104 106 93 109 18
Viet-Nam, Rep. of 102 I 1 1 119 119 123 3 88 94 100 98 99
Developing countries 118 123 124 120 130 + 8 102 104 102 96 101 ; 6
China 117 123 126 124 130 + 5 105 108 110 106 109 -i 3
Japan 121 119 113 120 120 113 110 104 109 107 ---
Total Per caput

ANNEX TABLE 2. - INDICES OF FOOD AND AGRICULTURAL PRODUCTION, BY COUNTRIES (continued)
Agricultural production
NEAR EAST IN AFRICA
167
1969 1970 1971 1972
1973(Pre-lim-
inary)
Change1972
to1973
1969 1970 1971 1972
1973(Pre-lim-
inary)
Change1972
to1973
1961-65 averag = 100 Percent 1961-65 average- 100 PercentNEAR EAST
Food production
NEAR EASI IN AFRICA
Egypt 124 125 129 133 134 +1 105 104 104 104 102 2Libyan Arab Republic 145 123 104 133 149 18 119 97 79 134 106 21Sudan 141 147 153 157 154 2 118 120 121 119 113 5
NEAR EAST IN ASIA
Afghanistan 115 107 106 122 129 + 5 101 92 88 99 102 + 3
Cyprus 161 156 177 169 157 7 153 148 165 157 144 8
Iran 128 139 129 140 145 -4- 3 109 114 103 108 108 -Iraq 135 132 128 179 131 27 110 105 98 132 94 29Jordan 72 46 65 75 48 35 60 37 51 56 35 ---38Lebanon 116 122 136 138 135 2 98 100 108 106 101 - 5Saudi Arabia 127 130 133 137 139 + 1 108 108 108 107 106 - 1
Syrian Arab Republic II 1 81 85 140 107 24 93 66 66 106 78 - -27Turkey 118 126 131 137 130 5 101 105 106 108 100 - - 7Yemen Arab R.epublic 100 90 111 119 118 -1 86 75 89 93 89 -4Yemen, People's Dem. Rep. of 121 114 126 128 131 -I- 2 103 95 102 101 100 - I
Developing countries 122 125 127 139 134 4 104 103 102 108 101 - 6
Israel 136 144 166 177 174 2 115 119 133 139 133 4
EgYIA 123 123 127 130 132 + 105 102 102 102 100 2Libyan Arab Republic 144 124 107 180 149 17 117 98 81 132 106 20Sudan 143 150 155 157 152 4 119 121 122 120 112 7
NEAR EAST IN ASIA
Afghanistan 115 108 107 123 129 + 5 101 92 89 99 102 + 2
Cyprus 159 154 174 167 155 7 152 145 163 154 142 8
Iran 128 137 128 141 145 + 2 108 112 102 109 108 -- 1Iraq 134 133 130 176 133 --25 110 105 99 130 95 --27Jordan 74 48 67 76 51 33 62 39 52 57 37 --35Lebanon 117 123 137 139 136 2 99 101 109 107 102 5
Saudi Arabia 127 130 133 137 139 + 1 108 108 108 107 106 1
Syrian Arab Republ e 109 85 89 134 109 19 91 69 69 101 79 22Turkey 119 126 134 139 131 6 102 105 108 110 101 -- 8Yemen Arab Republic 100 90 111 121 119 1 85 74 90 95 91 ----4Yemen, People's Dem. Rep. of 117 111 124 125 127 + 2 100 92 100 98 97 -- 1
Dev'eloping countrie.s. 122 124 128 139 133 4 104 103 102 108 100 7
Israel 140 146 167 179 176 2 118 120 134 140 135 4
Total Per caput

AFRICA
Food production
NORTHWEST AFRICA
ANNEX TABLE 2. INDICES OF FOOD AND AGRICULTURAL PRODUCTION, BY COUNTRIES (continued)
1969 1970 1971
Total
1972
1961-65 average -- 100
168
1973(Pre-lim-
inary)
Change1972to
1973
Percent
Per caput
1971 1972
1961-65 average = 100
1973(Pre-lim-
inary)
Change1972
to1973
Percent
Algeria 103 108 103 123 103 16 87 88 81 94 76 19Morocco 125 143 147 148 136 8 105 117 117 115 103 10Tunisia 94 117 138 126 143 +13 79 95 109 97 106 +10
WEST AFRICA
Dahomey 124 129 126 120 113 6 107 108 104 95 88 8
Gambia 119 107 116 108 110 + 2 106 94 100 91 91
Ghana 112 126 137 133 119 10 94 103 108 102 88 13Guinea 119 120 122 119 110 8 105 103 102 98 88 10Ivory Coast 134 129 143 145 142 2 117 110 119 118 112 5Liberia 99 104 108 110 108 2 90 92 94 94 90 4Mali 113 106 117 84 74 --12 99 90 97 68 59 14Mauritania 113 113 110 101 86 15 100 97 93 83 69 17Niger 115 113 103 90 70 23 97 93 82 70 52 25Nigeria 110 107 108 109 98 10 95 90 89 87 76 13Senegal 104 82 109 66 78 +19 91 70 91 53 62 +16Sierra Leone 124 124 129 128 128 110 107 108 105 103 2
Togo 122 135 135 128 109 15 105 114 1 1 1 102 85 17Upper Volta 116 116 I 1 1 108 99 8 103 101 94 90 81 10CENTRAL AFRICA
Angola 119 121 125 123 124 1 106 105 107 103 102 1
Cameroon 125 128 130 135 137 + 1 112 Ill Ill 113 112 -Central African Republic 106 108 113 113 115 + 1 94 94 95 94 93 -Chad 99 97 97 72 70 -- 2 87 83 81 59 56 5Congo 88 84 83 77 77 78 73 70 63 62 -- 2Gabon 121 124 128 131 133 1 116 118 121 122 123
Zaire 134 138 131 140 139 -- 1 118 119 110 115 112
EAST AFRICA
Burundi 122 150 169 221 245 10 107 129 142 181 195 + 8Ethiopia 116 119 122 127 125 1 103 104 104 106 102 3Kenya 132 131 130 136 130 5 110 106 102 104 96 8Madagascar 118 118 117 118 118 101 98 95 93 90 3Malawi 140 128 142 149 154 + 3 121 108 117 120 120 + 1
Mauritius 116 101 110 120 128 + 7 101 85 90 95 100 + 5Mozambique 114 118 122 127 141 +10 102 103 104 106 115 + 8Rhodesia 115 107 127 140 114 19 94 85 97 104 81 22Rwanda 135 144 148 144 147 + 2 114 118 118 Ill Ill I
Somalia 117 119 120 125 119 5 103 102 100 102 95 7
Tanzania 122 132 134 135 134 1 105 111 109 108 104 -- 4Uganda 129 128 124 126 121 4 111 108 101 100 94 6Zambia 127 121 123 129 121 6 107 99 97 99 90 9
SOUTHERN AFRICA
Botswana 110 110 124 125 139 +11 97 94 104 103 112 -1- 8
Lesotho 106 101 103 79 94 +20 95 89 89 67 79 +17Swaziland 161 175 183 200 198 1 137 144 146 155 149 4
Developing countries 117 119 122 124 119 4 102 101 101 99 93
South Africa 123 128 148 154 132 15 107 109 122 125 103 --17
1969 1970

ANNEX TABLE 2. INDICES OF UOOD AND AGRICULTURAL PRODUCTION, BY COUNTRIES (concluded)
169
1969 1970 1971 1972
1973(Pre-lim-
inary)
Change1972to
1973
1969 1970 1971 1972
1973(Pre-lim-
inary)
Change1972
to1973
1961-65 averag 100 Percent 1961-65 average 100 Percent
Agricultural production
NORTHWEST AFRICA
Algeria 105 109 105 124 105 16 88 89 82 95 77 19Morocco 125 142 147 148 136 8 105 116 117 114 103 10Tunisia 95 118 138 126 143 +13 80 96 109 97 106 + 9
WEST AFRICA
Dahomey 127 134 134 127 122 5 110 113 109 102 94 7Gambia 119 107 116 108 110 + 2 106 94 100 91 91Ghana 112 127 137 133 119 10 94 103 108 102 88 13Guinea 119 120 122 119 110 8 104 103 102 98 88 10Ivory Coast 136 131 146 149 145 2 119 112 122 121 115 5Liberia 115 130 135 136 134 1 105 116 117 116 112 3Mali 115 109 120 89 76 14 100 93 100 72 61 16Mauritania 113 113 110 101 86 15 100 97 93 83 69 17Niger 115 114 103 90 70 23 97 93 82 70 52 25Nigeria 110 106 108 109 98 10 95 89 88 87 76 12Senegal 105 83 1 1 I 67 80 +18 91 70 92 54 63 +15Sierra Leone 124 124 128 128 128 109 106 108 105 102 2Togo 122 136 135 129 109 16 106 114 111 103 85 18Upper Volta 119 119 113 111 104 7 106 104 96 93 84 9CENTRAL AFRICA
Angola 120 122 127 125 126 + 1 107 107 108 104 103 1
Cameroon 127 127 130 136 136 114 111 111 113 111 2Central African Republic 110 112 115 116 117 + 1 98 97 98 96 95 1Chad 102 99 100 76 72 6 90 84 83 62 57 8Congo 89 85 84 77 77 78 73 70 63 62 2Gabon 121 124 128 131 133 + 1 116 118 121 122 123
Zaire 133 137 130 139 138 117 118 109 114 111 3EAST AFRICA
Burundi 122 150 169 220 244 +11 107 129 141 180 194 +8Ethiopia 116 120 123 128 126 1 103 104 105 106 103 3Kenya 129 128 127 133 128 4 108 104 100 101 94 7Madagascar 114 118 118 119 119 102 98 95 94 91 3Malawi 134 129 144 153 152 116 109 119 122 119 3Mauritius 115 101 110 120 129 + 7 101 85 90 95 100 +5Mozambique 115 118 120 126 140 +10 102 103 102 105 114 +8Rhodesia 105 99 115 126 101 20 86 79 88 93 72 22
Rwanda 135 144 148 144 147 + 3 114 118 118 111 111 -- 1
Somalia 117 119 120 125 119 5 103 102 100 102 95 7Tanzania 120 129 129 129 129 104 108 106 103 100 3Uganda 127 128 123 125 121 4 110 107 100 99 93 6Zambia 124 118 121 127 120 5 104 96 96 98 90 8SOUTHERN AFRICA
Botswana 110 108 123 125 138 +11 97 94 104 103 111 + 8Lesotho 106 103 105 85 99 +16 95 91 92 73 83 +14Swaziland 160 173 183 200 199 1 136 143 146 155 149 4
Developing countries 117 119 122 124 119 4 102 101 100 99 93 7South Africa 122 124 141 146 126 14 106 105 116 118 99 16
Total Per caput

ANNEX TABLE 3. - VOLUME OF EXPORTS OF MAJOR AGRICULTURAL, FISHERY ANO FOREST PRODUCTS
See notes at end of table.
170
1961 1962 1963 1964 1965 1966 1967 1968 1969 1970 1971 1972
1973
Vile:
Mary)
Million metric tons
World 1
AGRICULTURAL PRODUCTS
Wheat and wheat flour (wheatequivalent) 46.13 44.87 49.67 59.19 56.37 62.73 52.87 53.27 48.60 57.13 58.48 64.33 81.14Barley 7.20 6.64 5.70 7.99 8.06 6.41 7.21 6.39 7.11 10.36 11.12 14.02 12.19Maize 14.00 19.91 21.10 22.30 25.03 25.80 27.52 23.83 27.39 29.42 30.82 37.28 49.68Oats 1.26 1.44 1.24 1.34 1.73 1.37 1.20 1.03 0.99 1.51 1.62 2.13 1.63Rye 1.85 2.12 1.53 0.67 0.46 0.76 0.80 0.57 0.55 0.62 1.03 0.68 1.92Millet and sorghums 2.43 3.92 3.99 3.88 5.36 9.17 7.75 5.27 4.74 6.57 6.63 6.43 9.29Rice (milled equivalent)2 6.62 6.44 7.42 7.86 8.11 7.84 7.47 7.94 8.45 8.82 9.31 9.45 9.24Sugar (raw equivalent) 3 20.54 18.77 17.68 17.13 19.94 19.28 21.00 21.24 20.29 21.79 21.35 22.19 23.76Potatocs 2.79 3.37 2.94 3.63 3.78 3.56 3.37 3.41 3.59 3.80 3.04 5.13 3.92Pulses (drY) 1.13 1.38 1.51 1.46 2.24 2.05 1.68 1.80 2.15 1.78 1.75 2.04 2.06Apples 1.59 1.71 1.52 1.73 1.99 1.90 1.97 2.09 2.26 2.12 2.27 2.63 2.44Bananas 3.88 3.95 4.22 4.26 4.70 5.12 5.14 5.59 5.60 5.93 6.46 6.71 6.64Citrus fruit 4 3.24 3.64 3.35 4.21 4.27 4.28 4.48 4.39 4.63 5.06 4.93 5.36 5.57Grapes (fresh) 0.62 0.76 0.74 0.76 0.97 0.79 0.81 0.78 0.94 0.87 0.99 0.30 0.90Dates 0.26 0.30 0.42 0.36 0.35 0.38 0.35 0.33 0.36 0.44 0.36 0.40 0.41Vegetable oils and oilseeds (oilequivalent) 6 5.99 6.49 6.60 6.99 7.05 7.51 7.60 8.13 8.30 9.02 9.40 10.41 10.30Oilseed cake and meal 5.47 6.58 6.90 7.27 3.19 8.82 8.88 9.18 9.68 11.08 11.63 12.63 14.06Cattle 0 4.90 4.36 4.96 4.70 5.31 4.93 5.34 5.98 6.34 6.51 6.49 7.04 6.42Sheep, lambs and goats' 7.35 7.68 8.06 7.88 8.70 9.22 3.23 9.67 9.79 9.81 10.35 10.53 10.64Pigs 6 2.61 2.67 2.37 2.96 3.80 3.40 3.19 3.40 3.92 4.42 5.31 5.32 5.71Meat 7 2.13 2.58 2.96 2.89 3.04 3.11 3.34 3.43 3.77 4.54 4.67 4.27 5.42Milk (condensed, evaporated andPowdered) 0.56 0.58 0.60 0.64 0.62 0.63 0.66 0.69 0.68 2.16 2.17 2.01 2.35Eggs (in the shell) 0.54 0.48 0.41 0.36 0.35 0.32 0.33 0.34 0.37 0.41 0.45 0.46 0.46Coffee (green) 2.70 2.85 3.07 2.83 2.74 3.08 3.15 3.36 3.41 3.27 3.30 3.51 3.65Cocoa beans 1.02 1.03 1.04 1.04 1.30 1.12 1.08 1.05 1.00 1.13 1.19 1.25 1.16Tea 0.58 0.60 0.61 0.62 0.65 0.62 0.63 0.72 0.67 0.75 0.75 0.75 0.77Wine 2.80 2.95 2.39 2.67 2.53 2.85 2.36 2.56 3.27 3.68 3.53 4.12 4.41Pepper and pimento 0.13 0.14 0.15 0.13 0.14 0.15 0.19 0.19 0.18 0.17 0.19 0.20 0.18Tobacco (unmanufactured) . . 0.88 0.87 0.90 1.01 0.98 0.96 1.03 1.00 1.00 0.98 1.03 1.20 1.19Wool (actual weight) 1.45 1.45 1.43 1.40 1.44 1.48 1.37 1.50 1.52 1.54 1.43 1.48 1.33Cotton (lint) 3.75 3.40 3.76 3.92 3.76 4.00 3.84 3.84 3.70 3.94 4.02 4.05 4.61Jute and kenaf 0.71 1.03 1.27 1.05 1.15 1.39 1.26 0.92 0.92 1.00 0.91 1.00 0.96Rubber (natural) 8 0.85 0.99 0.80 0.89 0.95 0.93 0.87 2.67 2.94 2.84 2.92 2.89 3.37
FISHERY PRODUCTS 9
Fresh, chilled or frozen fish . . 1.15 1.34 1.48 1.71 1.72 1.80 1.79 1.82 1.80 2.02 2.04 2.17 2.45Dried, salted or smoked fish . . 0.55 0.55 0.54 0.50 0.50 0.50 0.50 0.49 0.50 0.52 0.48 0.51 0.50Crustacea and molluscs, fresh,frozen, dried, salted, etc . 0.25 0.27 0.27 0.30 0.30 0.30 0.32 0.34 0.38 0.44 0.52 0.62 0.60Fish products and preparations,whether or not in airtight con-tainers 0.52 0.54 0.51 0.58 0.52 0.57 0.55 0.61 0 59 0.61 0.63 0.68 0.72Crustacean and mollusc productsand preparations, whether or notin airtight containers 0.04 0.05 0.05 0.06 0.06 0.06 0.07 0.07 0.07 0.07 0.07 0.08 0.09Oils and fats, crude or refined, ofaquatic animal origin 0.62 0.67 0.74 0.63 0.72 0.68 0.81 0.33 0.70 0.64 0.71 0.75 0.56Meals, solubles and similar ani-mal feedstuffs of aquatic animalorigin 1.36 1.72 1.78 2.44 2.47 2.48 3.02 3.55 3.03 3.00 3.00 2.97 1.57
FOREST PRODUCTS 9
PUIDWOOd /9 12.9 12.2 11.6 13.2 13.8 14.2 14.7 14.1 15.9 18.6 16.3 14.9 16.4Coniferous logs " 5.9 6.4 8.7 9.9 11.6 13.8 17.2 21.1 20.4 24.7 21.9 25.8 30.0Broadleaved logs 10 14.0 14.6 13.0 20.0 21.2 23.8 25.2 30.1 35.0 38.8 40.9 43.5 52.2Sawn softwood 10 36.3 38.2 41.4 44.6 44.0 42.6 42.8 47.5 47.3 49.5 51.7 59.4 64.0Sawn hardwood " 4.3 4.3 4.6 5.4 5.6 5.8 5.7 6.3 6.9 7.2 7.1 3.4 9.5Plywood and veneers " 1.9 2.1 2.4 3.0 3.1 3.5 3.8 4.7 5.0 5.3 6.0 7.2 7.9

ANNEX 'FABLE 3. - VOLUME OF EXPORTS OF MAJOR AGRICULTURAL, FISHERY ANO FOREST PRODUCTS (continued)
FOREST PRODUCTS 9 (concluded)
FibreboardMechanical wood pulpChemical wood pulpNewsprintOther paper and paperboard
Western Europe
AGRICULTURAL PRODUCTS
Wheat and wheat flour (wheatequivalent) .....BarleyMaizeRyeSugar (raw equivalent) 3PotatoesPulses (dry)ApplesCitrus fruit 4 .
Grapes (fresh)Vegetable oils and oilseeds (oilequivalent) 11Oilseed cake and mealCattle 6Sheep, lambs and goats 8 . . .
PigsMeat (fresh, chilled and frozen),Bacon, ham and salted pork .
Milk (condensed, evaporated andpowdered)ButterCheeseEggs (in the shell)WineVVool (actual weight)
FISHERY PRODUCTS
Fresh, chilled or frozen fish . .
Dried, salted or smoked fish .
Crustacea and molluscs, fresh,frozen, dried, salted, etc. .
Fish products and preparations,whether or not in airtight con-tainersCrustacean and mollusc productsand preparations, whether or notin airtight containersOils and fats, crude or refined,of aquatic animal origin . . .
Meals, solubles and similar ani-mal feedstuffs of aquatic animalorigin
FOREST PRODucTs
PIJIDWOOdConiferous logs"Broadleaved logs 10Pitprops 1°Sawn softwood 15
See notes at end of table.
171
1961 1962 1963 1964 1965 1966 1967 1968 1969 1970 1971 19721973(Pre-lim-
inary)
Milli n metric tons
0.9 0.9 1.0 1.1 1.1 1.1 1.2 1.3 1.4 1.4 1.5 1.6 1.71.3 1.2 1.3 1.4 1.4 1.4 1.2 1.3 1.3 1.3 1.0 1.2 1.38.5 9.0 10.1 11.1 11.1 12.0 12.4 13.7 14.9 15.6 14.0 15.2 17.17.7 7.5 7.8 8.5 9.0 9.7 9.4 9.7 10.6 10.6 10.3 10.8 11.1
5.3 5.9 6.9 7.5 8.4 8.8 10.2 11.9 12.8 13.2 14.5 16.7
3.19 3.69 5.07 5.29 6.99 6.45 6.16 8.42 10.91 9.39 7.13 10.14 12.712.51 1.69 2.29 3.16 2.63 3.37 4.08 4.20 4.32 4.39 3.78 5.31 5.421.09 0.34 0.94 1.27 1.89 2.11 2.77 2.54 3.23 3.88 5.30 4.60 5.63
0.31 0.18 0.16 0.05 0.05 0.06 0.05 0.09 0.14 0.20 0.39 0.39 0.541.47 1.26 1.59 1.45 1.54 1.27 1.15 1.66 1.45 1.97 2.02 2.82 2.801.75 1.33 1.64 1.70 2.26 1.98 1.86 1.86 2.41 2.22 1.90 2.76 2.470.19 0.22 0.17 0.15 0.17 0.19 0.24 0.29 0.23 0.26 0.26 0.29 0.300.84 0.88 0.53 0.73 0.88 0.76 0.78 0.86 0.95 0.94 1.06 1.31 1.161.45 1.73 1.22 2.00 1.91 1.97 1.94 1.79 1.92 2.29 1.98 2.26 2.180.31 0.34 0.29 0.38 0.41 0.41 0.42 0.41 0.41 0.44 0.48 0.41 0.46
0.38 0.40 0.37 0.42 0.32 0.36 0.49 0.53 0.72 0.98 1.15 0.94 1.210.91 0.92 0.89 1.03 1.07 1.13 1.28 1.19 1.34 1.56 1.79 2.14 2.721.80 1.37 1.85 1.83 1.74 1.46 2.00 2.34 2.48 2.60 2.74 3.10 2.571.53 1.30 1.35 0.87 0.85 0.58 0.72 0.93 0.98 0.63 0.72 0.74 0.600.58 0.49 0.39 0.66 0.82 0.49 0.83 1.17 1.90 2.35 2.29 2.45 2.510.58 0.74 0.81 0.79 0.92 0.91 1.10 1.21 1.26 1.55 1.81 1.82 1.930.36 0.37 0.35 0.35 0.36 0.36 0.35 0.35 0.34 0.35 0.35 0.34 0.32
0.64 0.69 0.72 0.75 0.90 1.01 1.17 1.38 1.34 1.44 1.51 1.41 1.790.26 0.23 0.24 0.23 0.27 0.27 0.31 0.35 0.33 0.49 0.45 0.36 0.780.34 0.36 0.38 0.40 0.42 0.47 0.48 0.52 0.53 0.57 0.61 0.67 0.740.29 0.28 0.23 0.19 0.15 0.14 0.13 0.15 0.19 0.23 0.26 0.27 0.281.01 1.01 1.14 1.12 1.19 1.30 1.31 1.32 1.45 1.78 2.36 2.86 2.920.11 0.12 0.13 0.10 0.11 0.11 0.10 0.11 0.11 0.10 0.10 0.12 0.11
Thousand metr c tons
684.5 771.7 849.9 877.0 907.7 876.5 861.2 905.8 971.7 1098.4 1035.0 1061.0 1094.0333.3 353.8 334.3 314.7 323.2 317.4 312.9 311.9 337.2 338.4 314.8 345.6 332.5
112.5 123.4 114.0 118.9 108.8 113.7 116.4 130.8 133.8 151.6 188.2 244.0 197.0
183.7 211.7 196.7 209.1 221.4 211.3 193.6 195.5 172.8 183.7 175.7 214.0 234.0
8.0 9.0 9.0 13.0 13.0 13.0 12.6 13.3 15.4 19.2 20.1 24.9 26.0
218.8 243.9 199.8 190.0 266.2 340.1 391.5 260.1 270.0 171.7 149.1 196.0 271.6
286.2 240.2 306.9 434.8 555.0 576.8 810.7 787.5 657.9 606.2 726.1 839.7 796.0
Million metric tons
5.93 4.28 3.34 3.62 3.61 3.01 3.82 4.17 5.22 6.71 6.23 5.51 6.331.30 1.14 1.05 1.06 1.03 1.35 1.55 1.37 1.23 1.46 1.35 1.39 2.250.98 0.93 0.91 0.97 1.02 1.10 1.17 1.20 1.23 1.35 1.47 1.55 1.571.81 1.37 1.07 0.83 0.56 0.54 0.36 0.39 0.49 0.57 0.49 0.43 0.43
14.24 13.86 13.86 14.62 13.57 12.72 12.85 15.05 16.24 16.21 16.55 18.09 20.20

ANNEX TAL3LE 3. - VOLUME OF EXPORTS OF MAJOR AGRICULTURAL, FISHERY AND FORES"F PRODUCTS (continued)
See notes at end of table.
172
1961 1962 1963 1964 1965 1966 1967 1968 1969 1970 1971 19721973(Pre-lim-
inary)
Million metric tons
0.93 0.96 0.98 1.14 1.21 1.26 1.23 1.35 1.44 1.51 1.52 1.77 2.300.65 0.66 0.73 0.83 0.86 0.88 0.92 1.05 1.16 1.21 1.23 1.30 1.410.76 0.79 0.84 0.88 0.82 0.75 0.82 0.87 0.90 0.88 0.87 0.90 0.960.35 0.43 0.48 0.56 0.80 0.89 1.04 1.20 1.45 1.69 2.20 2.43 3.281.06 0.97 1.05 1.15 1.12 1.13 1.00 1.06 1.04 1.04 0.77 0.86 1.004.54 4.83 5.35 5.85 5.78 6.27 6.20 6.54 6.76 6.74 5.63 6.34 7.601.62 1.63 1.71 1.88 1.97 2.07 2.10 2.31 2.43 2.56 2.49 2.69 2.803.57 3.77 4.24 4.75 5.13 5.55 5.67 6.49 7.74 8.17 8.36 9.34 11.80
5.46 5.18 4.98 2.52 2.32 4.51 7.68 6.91 7.97 6.80 9.27 5.93 6.671.18 0.61 0.69 0.76 2.14 0.39 0.53 0.67 0.82 0.72 0.92 0.86 0.611.36 2.33 1.78 1.93 1.38 0.83 1.60 0.74 1.54 1.12 0.88 0.95 1.611.15 1.35 0.89 0.17 0.06 0.32 0.44 0.28 0.30 0.25 0.22 0.04 0.373.19 3.28 2.19 1.71 2.02 2.17 2.42 2.68 2.14 2.11 1.71 0.96 1.130.44 0.70 0.50 1.18 0.79 0.77 0.70 0.71 0.30 0.63 0.34 1.51 0.530.17 0.22 0.15 0.27 0.22 0.35 0.49 0.47 0.56 0.33 0.23 0.21 0.140.42 0.39 0.24 0.08 0.16 0.43 0.40 0.34 0.34 0.04 0.020.20 0.27 0.27 0.17 0.24 0.25 0.45 0.43 0.41 0.31 0.34 0.36 0.390.09 0.11 0.10 0.06 0.08 0.10 0.12 0.12 0.10 0.11 0.05 0.04 0.070.13 0.11 0.08 0.08 0.11 0.09 0.11 0.10 0.08 0.09 0.11 0.11 0.100.39 0.35 0.32 0.39 0.46 0.52 0.55 0.57 0.45 0.52 0.55 0.65 0.73
Thousand met ic tons
17.9 33.7 80.9 88.9 178.3 229.5 216.0 236.1 230.6 306.5 338.4 332.8 370.731.7 40.5 44.4 35.3 39.9 28.6 36.0 25.4 23.1 21.6 16.7 16.0 14.6
0.2 0.3 0.6 1.1 1.2 1.3 1.3 0.6 0.9 1.7 1.4 1.6 2.0
25.3 24.3 19.3 18.9 19.6 22.7 24.2 27.1 28.8 29.4 28.1 28.5 30.7
3.7 3.0 5.0 5.6 4.9 5.0 5.0 4.7 3.4 3.8 3.5 3.4 2.1
18.2 15.2 32.2 40.0 57.1 71.9 58.3 59.6 64.0 34.5 14.6 17.1 5.3
4.9 3.7 3.8 4.2 7.2 14.2 38.3 30.6 32.6 13.5 12.2 18.7 13.1
Millioz metric tons
3.54 4.40 5.13 6.00 6.38 7.32 7.49 6.88 7.57 8.68 7.57 7.28 8.201.99 2.62 2.89 3.43 4.72 5.04 5.01 6.12 6.38 7.57 7.38 8.00 10.501.24 1.36 1.58 1.53 1.58 1.31 0.96 0.85 0.88 0.97 0.88 0.82 0.827.23 8.47 9.49 10.96 11.17 11.44 10.88 10.93 10.74 11.01 10.76 11.07 11.070.21 0.25 0.28 0.29 0.38 0.38 0.40 0.45 0.45 0.47 0.43 0.44 0.470.33 0.34 0.32 0.37 0.37 0.39 0.47 0.51 0.57 0.55 0.55 0.61 0.65
30.82 25.97 31.89 38.26 32.38 40.23 29.11 27.84 21.10 30.59 31.15 37.07 51.342.40 2.59 1.62 2.48 2.11 2.04 2.02 1.03 0.80 4.15 5.16 5.75 5.177.35 10.81 11.12 12.14 15.21 15.60 12.97 14.96 13.96 14.41 12.89 22.41 33.22
FOREST PRODUCTS (concluded)
Sawn hardwood 1°Plywood and veneers 10FibreboardParticle boardMechanical wood pulpChemical wood pulpNewsprintOther paper and paperboard
Eastern Europe and U.S.S.R.
AGRICULTURAL PRODUCTS
Wheat and wheat flour (wheatequivalent)BarleyMaizeRyeSugar (raw equivalent) 3PotatoesSunflowerseedOilseed cake and mealMeat (fresh, chilled and frozen) ,ButterEggs (in the shell)Cotton
FISHERY PRODUCTS
Fresh, chilled or frozen fish .
Dried, salted or smoked flsh .
Crustacea and molluscs, fresh,frozen, dried, salted, etcFish products and preparations,whether or not in airtight con-tainersCrustacean and mollusc productsand preparations, whether or notin airtight containersOils and fats, crude or refined, ofaquatic animal originMeals, solubles and similar ani-mal feedstuffs of aquatic animalorigin
FOREST PRODUCTS
Pulpwood ,°Coniferous logs 1°Pitpropsl°Sawn softwood 10Plywood and veneers i°Wood pulp
North America
AGRICULTURAL PRODUCTS
Wheat and wheat flour (wheatequivalent)BarleyMaize

ANNEX TABLE 3. - VOLUME OF EXPORTS OF MAJOR AGRICULTURAL, FISHERY AND FOREST PRODUC TS (continued)
See notes at end of table.
173
1961 1962 1963 1964 1965 1966 1967 1968 1969 1970 1971 1972
1973(Pre-lim-
inary)
Millio metric tons
1.64 2.79 2.94 2.55 4.38 7.40 5.80 3.55 2.70 3.81 2.89 3.92 5.650.34 0.57 0.48 0.29 0.18 0.35 0.31 0.18 0.09 0.15 0.41 0.24 1.000.80 1.05 1.20 1.33 1.36 1.16 1.51 1.37 1.23 1.75 1.48 2.04 1.630.30 0.27 0.26 0.30 0.33 0.37 0.42 0.27 0.39 0.39 0.39 0.46 0.490.16 0.26 0.34 0.28 0.30 0.32 0.30 0.27 0.35 0.40 0.33 0.31 0.42
1.32 1.69 1.71 2.16 2.23 2.04 2.11 2.19 2.33 3.27 3.35 3.53 3.480.79 1.37 1.69 1.95 2.47 2.60 2.75 3.00 3.28 3.97 4.43 4.01 4.95
0.44 0.48 0.61 0.69 0.50 0.29 0.27 0.29 0.31 0.36 0.32 0.23 0.180.24 0.23 0.25 0.26 0.23 0.27 0.28 0.29 0.29 0.26 0.24 0.30 0.311.45 0.87 0.99 1.19 0.86 0.82 0.90 0.88 0.55 0.68 0.94 0.70 1.25
Thousand met.ic tons
141.9 157.3 159.1 197.5 216.4 240.0 224.9 252.1 225.4 211.2 224.6 233.8 264.165.3 59.9 70.0 61.4 54.3 53.6 56.2 56.7 51.9 54.1 60.2 57.9 57.8
19.0 18.9 22.8 24.5 25.6 23.7 24.2 26.9 34.0 36.1 38.4 36.2 47.3
24.2 26.4 31.2 42.8 36.0 37.1 42.4 34.6 36.4 31.3 31.6 38.0 45.2
4.5 6.6 7.2 7.7 10.4 10.6 11.5 9.7 9.5 8.5 9.8 9.4 10.0
61.2 61.7 129.8 87.4 58.7 41.1 46.7 37.6 103.8 94.8 118.1 95.1 120.7
38.8 46.2 54.3 60.4 57.5 51.7 51.3 66.0 73.0 77.4 71.8 42.3 63.0
Million metric tons
3.17 3.20 2.88 3.14 3.44 3.52 3.07 2.64 2.66 2.84 2.10 1.70 1.452.28 2.24 4.33 4.85 5.25 6.42 9.25 11.84 10.93 13.39 10.85 14.10 14.800.31 0.40 0.41 0.38 0.45 0.52 0.52 0.51 0.43 0.37 0.34 0.50 0.55
13.28 14.50 16.68 17.36 17.43 16.51 17.25 19.16 18.27 20.06 22.02 25.71 27.500.55 0.60 0.59 0.69 0.74 0.91 0.81 0.66 0.75 0.67 0.79 1.01 1.070.21 0.29 0.31 0.45 0.50 0.60 0.62 0.67 0.72 0.68 0.80 0.90 1.000.22 0.24 0.23 0.26 0.29 0.24 0.22 0.22 0.25 0.28 0.23 0.27 0.293.48 3.59 4.08 4.47 4.59 4.86 5.21 5.97 6.91 7.59 6.88 7.31 7.765.84 5.68 5.74 6.29 6.60 7.19 6.85 6.90 7.60 7.47 7.24 7.49 7.650.99 1.04 1.22 1.57 1.76 2.01 2.22 2.64 2.83 3.03 3.33 3.48 3.48
5.02 6.29 4.82 7.81 6.47 5.68 6.97 6.99 5.37 7.38 9.48 8.71 5.630.77 0.71 0.23 0.40 0.38 0.23 0.43 0.12 0.45 0.63 1.12 1.83 0.790.34 0.35 0.32 0.30 0.37 0.25 0.40 0.18 0.33 0.22 0.56 0.33 1.140.81 0.86 1.17 1.14 1.29 1.27 1.67 1.63 2.07 1.39 1.57 2.01 1.120.23 0.32 0.40 0.41 0.44 0.39 0.37 0.38 0.40 0.51 0.52 0.59 0.770.41 0.41 0.43 0.48 0.47 0.47 0.46 0.55 0.58 0.59 0.60 0.69 0.530.25 0.24 0.27 0.28 0.27 0.28 0.32 0.27 0.29 0.30 0.28 0.24 0.230.11 0.12 0.12 0.13 0.12 0.12 0.14 0.12 0.13 0.13 0.13 0.12 0.120.89 0.89 0.91 0.92 0.90 0.92 0.88 0.94 1.01 1.06 0.98 0.98 1.00
Thousand nzet-ic tons
3.0 3.0 3.0 4.0 4.4 5.0 3.0 3.8 4.1 7.8 10.0 14.4 13.6
5.0 6.0 6.0 7.0 8.0 8.0 10.1 13.0 12.9 13.6 16.3 17.5 16.7
AGRICULTURAL PRODUCTS (con-eluded)
Millet and sorghumsRyeRice (milled equivalent) 2 .
Citrus fruit ',Pulses (dry)Vegetable oils and oilseeds (oilequivalent) '2Oilseed cake and mealMilk (condensed, evaporated andpowdered)Tobacco (unmanufacturcd)Cotton (lint)
FISHERY PRODUCTS
Fresh, chilled or frozen fish . .
Dried, salted or smoked fish . .
Crustacca and molluscs, fresh, fro-zen, dried, salted, etc .Fish products and preparations,whether or not in airtight con-tainersCrustacean and molluscs productsand preparations, whether or notin airtight containersOils and fats, crude or refined, ofaquatic animal originMeals, solubles and similar ani-mal feedstuffs of aquatic animalorigin
FOREST PRODUCTS
Pulpwood '0Coniferous logs "Broadleaved logsSawn softwood "Sawn hardwood '0Plywood and veneersMechanical wood pulpChemical wood pull)NewsprintOther paper and paperboard
Oceania
AGRICULTURAL PRODUCTS
Wheat and wheat flour (wheatequivalent)BarleyOatsSugar (raw equivalent) 3Beef and vealMutton and lambButterCheeseWool (actual we ght)
FISHERY PRODUCTS
Fresh, chilled or frozen fish . .
Crustacea and molluscs, fresh,frozen, dried, salted, etc
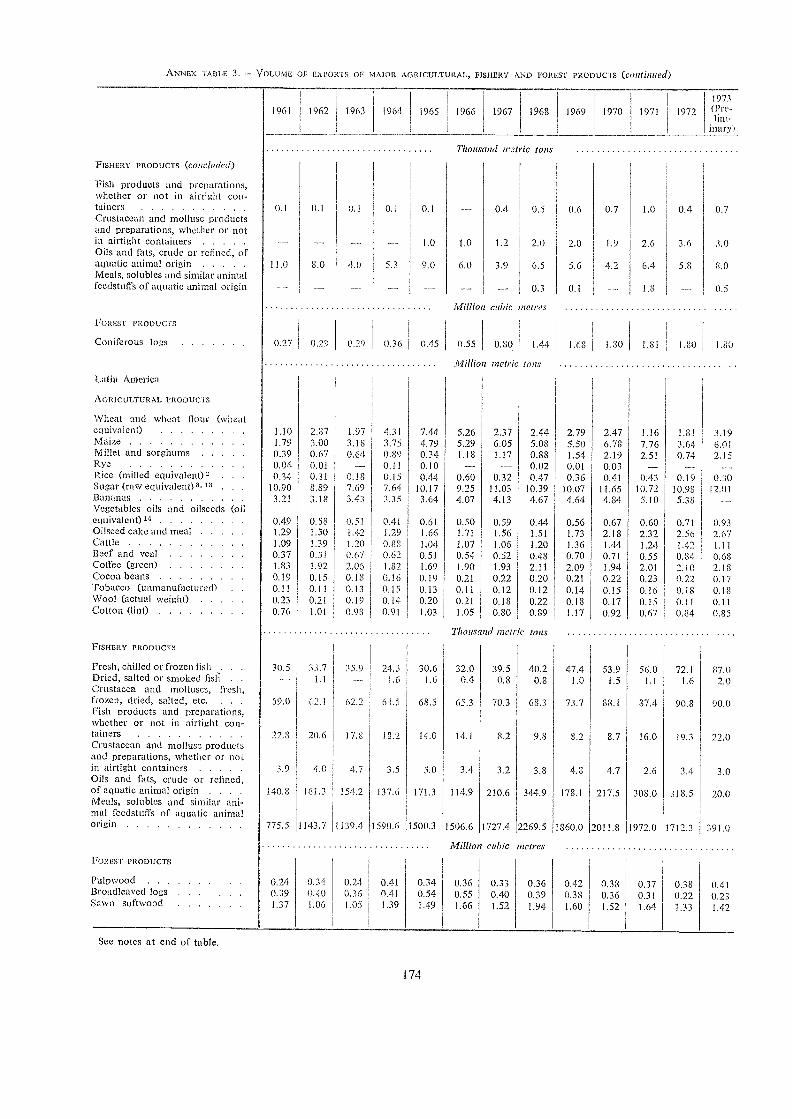
See notes at end of table.
ANNEX TABLE 3. - VOL UME OF EX PORI S OF MAJOR AG RICULTURAL, FISHERY AND FOREST PRODUCTS (CO/Hi/Wed)
1963 1964 1965
174
1966 1967
Thousand ¿r,/ríe tons
1968 1969 1970 1971
1973(Pre-
inary t
1972
Millio metric tons
1.10 2.87 1.97 4.31 7.44 5.26 2.37 2.44 2.79 2.47 1.16 1.81 3.191.79 3.00 3.18 3.75 4.79 5.29 6.05 5.08 5.50 6.78 7.76 3.64 6.010.39 0.67 0.64 0.89 0.34 1.18 1.17 0.88 1.54 2.19 2.51 0.74 2.1:50.04 0.01 0.11 0.10 -- 0.02 0.01 0.03 - -0.34 0.31 0.18 0.15 0.44 0.60 0.32 0.47 0.36 0.41 0.43 0.19 0.10
10.90 8.89 7.69 7.64 10.17 9.25 11.03 10.39 10.07 11.65 10.72 10.98 1201.3.21 3.18 3.43 3.35 3.64 4.07 4.13 4.67 4.64 4.54 5.10 5.38
0.49 0.58 0.51 0.41 0.61 0.50 0.59 0.44 0.56 0.67 0.60 0.71 0.931.29 1.50 1.42 1.29 1.66 1.71 1.56 1.51 1.73 2.18 2.32 2.56 2.671.09 1.39 1.20 0.88 1.04 1.07 1.06 1.20 1.36 1.44 1.24 1.42 1.110.37 0.51 0.67 0.62 0.51 0.54 0.52 0.48 0.70 0.71 0.55 0.84 0.681.83 1.92 2.06 1.82 1.69 1.90 1.93 2.11 2.09 1.94 2.01 2.10 2.180.19 I 0.15 0.18 0.16 0.19 0.21 0.22 0.20 0.21 0.22 0.23 0.22 0.170.11 0.11 0.13 0.15 0.13 0.11 0.12 (1.12 0.14 0.15 0.16 0.18 0.180.23 0.21 0.19 0.14 0.20 0.21 0.18 0.22 0.18 0.17 0.15 0.11 0.110.76 1.01 0.98 0.91 1.03 1.05 0.80 0.89 1.17 0.92 0.67 0.84 0.85
Thousand metric tons
30.5 33.7 35.9 24.3 30.6 32.0 39.5 40.2 47.4 53.9 56.0 72.1 87.01.1 1.6 1.6 0.4 0.8 0.8 1.0 1.5 1 1 1.6 2.0
59.0 02.1 62.2 64.5 68.5 65.3 70.3 68.3 73.7 88.1 87.4 90.8 90.0
22.8 20.6 17.8 18.2 14.0 14.1 8.2 9.8 8.2 8.7 16.0 (9.3 22.()
3.9 4.0 4.7 3.5 5.0 3.4 3.2 3.8 4.8 4.7 2.6 3.4 3.0
140.8 161.3 154,2 137.6 171.3 114.9 210.6 344.9 178.1 217.5 308.0 318.5 20.0
775.5 1143.7 1139.4 1590.6 1500.3 1506.6 1727.4 2269.5 1860.0 2011.8 1972.0 1712.3 391.0
Million cubic une/res
0.24 0.34 0.24 0.41 0.34 0.36 0.33 0.36 0.42 0.38 0.37 0.38 0.410.39 0.40 0.36 0.41 0.54 0.55 0.40 0.39 0.38 0.36 0.31 0.22 0.231.37 1.06 1.05 1.39 1.49 1.66 1.52 1.94 1.60 1.52 1.64 1.33 1.42
0.1 (1.1 0.1 0.1 0.1 0.4 0.5 0.6 0.7 1.0 0.4 0.7
1.0 1.0 1.2 2.0 2.0 1.9 2.6 3.6 3.0
1.0 8.0 4.0 5.3 9.0 6.0 3.9 6.5 5.6 4.2 6.4 5.8 8.0
0.3 0.1 1.8 0.5
Milk)n cubic netres
0.27 0.29 0.29 0.36 0.45 0.55 0.80 1.44 1.68 1.30 1.81 1.80 1.80
FISHERY l'RODUCTS (conc(uded)
Fish products and preparations,whether or not in airtight con-tainersCrustacean and mollusc productsand preparations, whether or notin airtight containersOils and fats, crude or refined, ofaquatic animal originMeals, solubles and similar animalfeedstuffs of aquatic animal origin
FOREST P ROD U CTS
Coniferous logs
Lado America
A G RIC ULTUR AL PRODUCTS
Wheat and wheat flour (wheatequivalen t)NlaizeMillet and sorghumsRyeRice (milled equivalent)2Sugar (raw equivalent) 3' 13
13an an asVegetables oils and oilseeds (oilequivalent) 14
Oilseed cake and mealCattleBeef and vealCoffee (green)Cocoa beansTobacco (unmanufacto red) .
Wool (actual weight)Cotton (lint)
FISHERY PRODUCTS
Fresh, chilled or frozen tish . . .
Dried, salted or smoked fisI3 . .
Crustacea and molluscs, fresh,Frozen, dried, salted, etc. . . .
Fish products and preparations,whether or not in airtight con-tainersCrustacean and mollusc productsand preparations, whether or notin airtight containersOils and fats, crude or refined,of aquatic animal origin . . .
Meals, solubles and similar ani-mal fecdstuffs of aquatic animalorigin
FOREST PRODUCTS
PulpwoodBroadlcaved logsSawn softwood

See notes at end of table.
ANNEX TAI3LE 3. - VOLUME OF EXPORTS OF MAJOR AGRICULT URAL, FISHERY ANO FOREST PRODUCTS (continued)
1961 1962 1963 1964 1965 1966 1967
175
1968 1969 1970 1971 19721973
uni-_
c tons
Mary)
Million metr
0.73 0.69 0.94 1.31 0.93 1.47 1.35 1.67 1.73 1.75 2.15 1.95 1.414.11 3.87 4.54 4.56 4.32 3.70 2.93 2.30 2.32 2.72 2.93 3.27 2.191.55 1.62 1.98 1.75 1.62 1.64 1.22 1.17 1.20 1.62 2.23 1.86 2.110.16 0.16 0.20 0.16 0.22 0.22 0.19 0.18 0.23 0.23 0.26 0.23 0.25
1.54 1.49 1.60 1.60 1.47 1.70 1.44 1.75 1.64 1.73 2.17 2.61 2.531.05 1.33 1.57 1.66 1.48 1.43 1.35 1.46 1.29 1.55 1.57 1.84 1.960.16 0.13 0.17 0.12 0.17 0.16 0.25 0.18 0.26 0.22 0.20 0.20 0.180.45 0.47 0.48 0.47 0.48 0.44 0.48 0.48 0.43 0.48 0.48 0.46 0.460.10 0.11 0.11 0.09 0.08 0.10 0.13 0.14 0.12 0.11 0.13 0.13 0.120.15 0.17 0.27 0.26 0.22 0.21 0.21 0.20 0.24 0.15 0.23 0.34 0.260.75 0.99 0.89 1.00 1.11 1.19 1.21 0.87 0.87 0.94 0.85 0.96 0.930.77 0.90 0.71 0.81 0.86 0.83 0.80 0.94 1.04 2.59 2.67 2.63 3.11
Thousand metric tons
54.7 74.9 84.2 99.5 93.3 107.9 214.0 140.9 130.4 137.9 140.3 158.9 219.052.3 43.9 40.7 37.6 33.9 46.0 44.0 44.3 44.9 58.6 53.3 41.3 51.8
33.3 35.1 39.2 53.8 56.9 58.5 64.7 67.3 83.8 106.2 132.7 161.5 184.0
7.6 3.5 4.3 5.6 9.0 8.1 6.0 7.1 10.5 9.3 10.0 6.4 12.()
9.8 10.2 9.2 9.6 10.7 11.3 12.5 12.7 12.0 15.3 15.3 2.1.7 30.0
1.1 0.4 0.1 0.4 0.3 0.5 0.6 0.9 0.6 0.4
8.1 11.9 12.4 14.8 21.9 29.2 25.8 23.7 25.7 39.0 40.5 62.6 74.0
Millio 1 cubic netres.
7.78 8.30 10.91 11.89 13.34 15.76 17.13 21.04 24.57 29.07 30.77 32.99 41.000.99 0.94 1.10 1.45 1.48 1.50 1.59 2.07 2.33 2.52 2.48 3.07 3.200.09 0.11 0.18 0.27 0.34 0.50 0.57 1.01 1.14 1.38 1.70 2.10 2.38
Milli n metric tons
0.04 0.01 0.15 0.19 0.24 0.16 0.08 0.06 0.02 -- -
0.59 0.65 0.79 0.98 1.07 1.50 1.40 1.02 1.03 1.94 2.28 2.43
0.80 0.90 0.90 1.18 1.21 1.31 1.02 0.93 0.70 0.50 0.66 0.65 0.640.05 0.04 0.04 0.05 0.05 0.06 0.05 0.06 0.06 0.05 0.05 0.05 0.05
0.04 0.29 0.23 0.26 0.09 0.10 0.12 0.25 0.07 0.04 0.03 0.63 0.60
0.16 0.76 0.54 0.29 0.47 0.19 0.07 0.15 0.36 0.22 0.02 0.14 0.020.23 0.14 0.38 0.54 0.37 0.36 0.44 0.58 0.78 0.68 0.55 0.49 0.32
0.14 0.24 0.20 0.19 0.18 0.23 0.24 0.21 0.25 0.29 0.25 0.28 0.31
0.09 0.18 0.18 0.20 0.31 0.14 0.18 0.12 0.13 0.11 0.12 0.14 0.16
0.15 0.16 0.13 0.19 0.23 0.23 0.27 0.33 0.41 0.43 0.60 0.50 0.73
0.22 0.26 0.37 0.31 0.30 0.32 0.30 0.28 0.33 0.40 0.32 0.35 0.35
0.37 0.43 0.50 0.54 0.59 0.62 0.61 0.70 0.70 0.77 0.62 0.83 0.65
0.88 1.51 1.55 1.63 1.90 1.61 1.23 1.36 1.20 1.23 1.15 0.93 1.09
0.66 0.70 0.84 0.80 0.83 1.00 0.90 0.87 0.86 1.09 1.10 1.05 1.05
Far Ea6t 15
AGRICULTURAL PRODUCTS
MaizeRice (milled equivalent) 2 .
Sugar (raw equivalent)3 . .
Pulses (dry)Vegetable oils and oilseeds (oilequivalent) 848Oilseed cake and mealCoffee (green)TeaPepper and pimentoCotton (lint)Jute and kenafRubber (natural) 8
FISHERY PRODUCTS
Fresh, chilled or frozen fish . .
Dried, salted or smoked fishCrustacea and molluscs, fresh,frozen, dried, salted, etc. . . .
Fish products and preparations,whether or not in airtight con-tainersCrustacean and mollusc productsand preparations, whether or notin airtight containersOils and fats, crude or relined, ofaquatic animal originMeals, solubles and similar ani-mal feedstuffs of aquatic animalo rigin
FORES r PRODUCTS
Broadleaved logsSawn hardwoodPlywood
China and other Asian centrallyplanned countries
AGRICULTURAL PRODUCTS
MaizeRice (milled equivalent)2 .
Sugar (raw equivalent)2 . . .
Tea
Near East 17
AGRICULTURAL PRODUCTS
Wheat and wheat flour (wheatequivalent)BarleyRice (milled equivalent)2PotatoesPulses (drY)Citrus fruit 4DatesOilseed cake and meal .
Sheep, lambs and goats 6 .
Cotton (lint)

FISHERY PRODUCTS
Fresh, chilled or frozen fish . .
Dried, salted or smoked fish .
Crustacea and molluscs, fresh,frozen, dried, salted, etc. . .
Fish products and preparations,whether or not in airtight con-tainersCrustacean and mollusc productsand preparations, whether or notin airtight containersOils and fats, crude or refined, ofaquatic animal origin
Africa-19
AGRICULTURAL PRODUC1S
Wheat and wheat flour (wheatequivalent) "BarleyMaizeSugar (raw equivalent) 3BananasCitrus fruit 4Pulses (drY)Groundnuts and oil (oil equivalent)Palm lcernels and oil (oil equi-valent)Palm oilOilseed cake and mealCattle 6Sheep, lambs and goats GCoffee (green)Cocoa bcansWineTobacco (unmanufactured)Cotton (lint)SisalRubber (natural)
FISHERY PRODUCTS
Fresh, chilled or frozen fish . .
Dried, salted or smoked fish . .
Crustacea and molluscs, fresh,frozen, dried, salted, etc. . . .
Fish products and preparations,whether or not in airtight con-tainersCrustacean and mollusc productsand preparations, whether or notin airtight containersOils and fats, crude or refined, ofaquatic animal originMeals, solubles and similar animalfeedstuffs of aquatic animal origin
FOREST PRODUCTS
Broadleaved logsSawn hardwood
ANNEX TABLE 3. - VOLUME OF EXPORTS OF MAJOR AGRICULTURAL, FISHERY AND FOREST PRODUCTS (C0//Ch/ded)
176
I Including the U.S.S.R., eastern Europe, and China and °the' Asian central y planned countries. - 2 Including piddy convertedat - 8 Including refilled sugar converted at 108.7%. - 1 Oranges, mandarins and lemons. - 5 Excluding reexports of coprafrom Malaysia, but including unrecorded shipments of copra from Indonesia and the Philippines to Malaysia. - 6 Million head.
Beef and veal, mutton and lamb, pork, poultry meat. - 8 Excluding imports into Malaysia for reexport and exports from FlongKong. but including unrecorded shipments from Indonesia to Malaysia. - 9 Excluding China. -10 MillI011 ClIbIC metres. - 1 I Linseed,sunflowerseed, olive oil, groundnut oil, coconut oil, paint oil, palm-kernel oil, soybean oil, sunflowerseed oil, castor oil, cottonseedoil, linseed oil. - 12 Groundnuts, soybeans, sunflowerseed, linseed, cottonseed, groundnut oil, coconut oil, soybean oil, linseed oil,castor oil, cottonseed oil. - 13 Excluding trade between the United States and its territories. - 11 GrOUTId111.1IS, copra, palio kernels,soybeans, sunflowerseed, linseed, castor bean,,, cottonseed, olive oil, groundnut oil, coconut oil, palm oil, palm-kernel oil, sun-llowerseed oil, linseed oil, castor oil, cottonseed oil. - 19 Excluding Japan, and China and other Asian centrally planned countries. -16 Groundnuts, copra, palm kernels, soybeans, cottonseed, groundnut oil, coconut oil, palm oil, palm-kernel oil, soybean oil, cottonseedoil. -- " Excluding Israel. - is Excluding South Africa. - 19 Including coarse ground flour.
1961 1962 1963 1964 1965 1966 1967 1968 1969 1970 1971 1972
1973(Pre-lim-
inary)
Thousand metric tons10.7 8.9 9.5 10.9 14.7 13.5 9.8 9.8 9.7 10.4 8.1 8.2 11.07.7 4.7 6.2 6.7 8.3 9.9 5.3 6.7 6.5 8.0 10.1 10.1 10.3
2.8 5.1 4.0 3.5 3.6 2.8 4.6 4.9 4.8 2.9 5.4 4.7 8.4
0.6 0.6 0.6 0.3 0.4 0.7 0.8 0.8 0.5 0.6 0.9 0.8 1.0
0.9 0.9 0.5 0.1 0.1 1.2
0.1 0.1 0.1 0.3 0.3 0.1 0.1 - 0.5 0.3 1.0 1.0
Million metric tons
0.18 0.19 0.25 0.26 0.21 0.22 0.08 0.10 0.09 0.15 0.07 0.08 0.090.04 0.04 0.28 0.35 0.02 0.07 0.01 0.01 0.14 0.13 0.01 -0.46 0.62 0.43 0.22 0.29 0.34 0.73 0.84 0.62 0.27 0.35 0.54 0.290.90 0.98 1.07 1.08 1.20 1.14 1.13 1.24 1.24 1.25 1.10 1.27 1.390.35 0.43 0.47 0.44 0.43 0.38 0.38 0.37 0.38 0.39 0.40 0.46 0.420.61 0.64 0.67 0.75 0.66 0.68 0.69 0.75 0.79 0.84 0.76 0.91 1.020.21 0.27 0.31 0.36 0.30 0.28 0.26 0.40 0.37 0.39 0.30 0.46 0.460.67 0.68 0.71 0.71 0.70 0.82 0.75 0.89 0.66 0.55 0.33 0.48 0.40
0.36 0.32 0.32 0.33 0.33 0.34 0.24 0.26 0.26 0.28 0.29 0.25 0.220.36 0.31 0.31 0.31 0.28 0.27 0.18 0.20 0.18 0.22 0.20 0.16 0.140.57 0.52 0.52 0.84 0.67 0.72 0.82 0.85 0.81 0.81 0.65 0.90 0.750.93 0.98 0.99 1.00 0.99 0.99 0.98 1.00 1.03 0.96 0.97 0.91 0.822.55 2.78 2.80 2.98 2.90 3.06 2.54 3.62 3.71 3.70 3.79 3.93 3.620.67 0.76 0.78 0.85 0.85 0.92 0.91 0.99 0.98 1.01 0.99 1.08 1.120.80 0.86 0.83 0.84 1.08 0.88 0.83 0.82 0.75 0.86 0.92 0.98 0.951.60 1.78 1.04 1.29 1.08 1.21 0.72 0.84 1.37 1.43 0.67 0.72 0.970.11 0.11 0.11 0.14 0.16 0.14 0.11 0.08 0.08 0.08 0.10 0.11 0.100.27 0.20 0.28 0.28 0.28 0.31 0.33 0.31 0.32 0.45 0.41 0.38 0.360.36 0.41 0.40 0.39 0.36 0.37 0.34 0.34 0.31 0.37 0.30 0.29 0.250.14 0.15 0.15 0.14 0.15 0.16 0.15 0.17 0.18 0.19 0.19 0.20 0.19
Thousand mettle tons
20.4 36.2 33.5 17.8 17.2 19.2 17.1 19.4 18.6 30.7 41.9 50.8 70.550.2 38.3 36.8 33.7 42.3 38.7 35.0 36.6 34.4 40.2 36.4 29.9 24.0
2.4 2.9 2.9 3.5 3.8 3.3 5.2 6.6 7.8 9.7 11.5 13.9 13.0
32.3 59.4 56.3 63.0 37.6 56.7 52.7 61.8 62.3 60.0 69.4 60.4 82.0
0.8 0.7 0.6 0.5 0.3 0.2 0.1 0.2 0.2
7.0 7.6 8.3 12.7 6.5 11.1 13.1 14.9 16.6 16.9 11.7 24.9 31.0
70.7 49.6 49.0 77.1 77.2 92.8 63.5 83.6 121.1 91.5 76.6 150.7 132.0
Million cubic metres
4.73 4.48 5.17 6.06 5.64 5.60 5.61 6.46 7.84 6.85 6.99 7.17 7.950.57 0.59 0.58 0.71 0.73 0.77 0.71 0.75 0.74 0.76 0.65 0.69 0.79

ANNEX TABLE 4. - WORLD AVERAGE EXPORT UNIT VALUES OF SELECTED AGRICULTURAL, FISHERY AND FOREST PRODUCTS
See notes at end of table.
177
1961 1962 1963 1964 1965 1966 1967 1968 1969 1970 1971 19721973
(1re-lim-
inary)
U.S. dollars per metric ton
AgTicultural products
VVheat 64 66 66 66 61 63 67 64 65 62 65 69 103VVheat flour 83 85 85 86 86 89 86 85 85 86 91 92 132Barley 47 57 57 57 63 69 67 64 58 53 60 57 93Nlillze 51 51 55 56 58 58 57 52 56 60 64 63 86Rice (milled) 111 123 126 125 125 134 158 175 164 131 117 138 212
Sugar (raw) 110 97 133 142 99 99 95 95 102 118 127 148 188
Apples 130 142 148 133 142 153 153 147 157 157 167 186 244Bananas 82 78 75 83 92 91 92 86 89 86 86 90 95()ranges 122 117 133 117 117 127 125 121 129 127 142 150 178Raisins 227 275 301 357 368 360 339 341 344 348 326 365 730Dates 88 121 105 109 106 104 111 126 105 108 121 148 163
Cottonseed 76 68 62 63 68 74 76 72 69 66 79 72 101Copra 247 143 157 164 189 162 159 189 161 178 168 126 211Palm kernels 124 118 134 136 165 147 126 159 136 146 137 112 171Soybeans 97 95 101 101 107 114 109 103 98 103 115 126 215Groundnuts (shelled) 176 171 168 175 192 185 172 158 189 209 226 249 342Olive oil 531 561 793 548 622 636 660 694 637 667 685 780 1 118Cottonseed oil 301 298 265 255 297 299 295 285 270 303 363 316 355Coconut oil 233 222 255 278 307 262 262 316 275 307 288 210 301Palm oil 214 196 189 202 237 203 193 146 144 226 227 189 251Palm-kernel oil 236 215 217 240 296 261 241 321 267 299 302 248 333Soybean oil 285 244 239 243 293 313 272 220 225 278 316 288 362Cinyundnut oil 345 300 306 323 339 314 321 272 316 341 393 376 430
Cattle1 116 108 121 139 142 130 133 126 142 156 174 232 275Pigs1 44 42 38 36 36 38 36 40 45 49 48 55 64Beef and veal 558 522 561 679 756 760 754 780 814 910 1 069 1 265 1 561Mutton and lamb 390 382 422 442 529 503 493 464 483 551 556 588 937Poultry rneat 629 649 660 669 686 705 641 643 678 673 668 748 1 039Bacon, ham, salted pork . 659 657 712 761 752 867 327 740 806 864 855 1 009 1 479Canned nwat 958 1 000 946 1 035 1 080 1 106 1 069 1 065 1 087 1 130 1 235 1 319 1 546
Milk, condensed and evaporated 313 307 311 333 340 338 325 305 310 312 357 427 481
Milk, powdered 321 286 283 286 379 388 399 336 369 355 480 590 620Butter 730 773 827 879 916 848 791 740 752 733 976 1 219 1 075Cheese 707 785 693 745 817 835 849 831 894 939 1 071 1 254 1 442
Potatoes 51 66 59 49 62 67 63 54 67 74 66 70 114
Coffee 674 648 643 830 800 768 712 753 721 944 833 922 1 081
Cocoa 475 452 488 499 381 406 542 604 782 767 626 572 828
Tea 1 138 1 101 1 127 1 106 1 073 1 047 1 034 941 884 934 930 972 985
Wine 198 184 219 219 236 233 267 271 254 271 295 352 452
Tobacco (inmanufactured) . 1 152 I 151 1 251 1 191 1 199 1 261 1 276 1 275 1 303 1 294 1 269 1 380 1 480
Linseed 126 135 125 125 121 114 120 127 122 112 104 120 257
Linseed oil 254 230 200 208 201 188 174 210 213 213 196 194 302
Castor beans 126 109 111 116 107 107 117 145 126 116 121 156 337
Castor oil 285 276 256 249 213 245 321 333 259 265 325 451 906
Cotton 637 605 622 618 629 604 598 632 616 628 694 772 878
Jute and kenaf 240 211 159 193 222 206 205 229 224 218 228 257 242
Sisal 195 198 296 287 182 163 140 126 138 127 124 156 310
VVool (greasY) 1 109 1 137 1 233 1 456 1 217 1 197 1 169 989 1 056 964 801 927 2 116Rubber (natural) 505 426 485 450 440 432 361 329 419 392 333 304 551

ANNEX TALILE 4. WORLD AVERAGE EXEOISI UNIT VALUES OF SELECTED AGRICULTURAL, FISHERY AND FOREST PRODUCTS (concluded)
Fishery products 2
Fresh, chilled or frozen fishDried, salted or smoked fishCrustacea and molluscs, fresh,frozen, dried, salted, etcFish products and preparations,whether or not in airtight con-tainersCrustacean and mollusc prod-ucts and preparations, whetheror not in airtight containers .
Oils and fats, crude or refined,of aquatic animal origin .
Meals, solubles and similar ani-mal feedstuffs of aquatic animalorigin
Forest products 2
Fuelwood 3CharcoalConiferous logs',BroacileavedPulpwood 3PitpropsSawn softwood 3Sawn hardwood 3Veneer sheets 3Plywood 3Particle boardFibreboard, compressedMechanical wood pulpChemical wood pulpNcwsprintOther printing and writing papel
1961 1962 1963 1964
178
1965 1966 1967 1968
U S. dollars per metric ton
1969 1970 1971
301 315 297 289 329 353 325 347 396 424 491331 345 361 391 427 455 470 456 468 517 633
684 758 846 796 892 989 1 033 1 127 1 248 1 230 1 324
601 659 649 639 703 682 733 706 725 771 882
1 151 1 146 1 211 1 283 1 319 1 469 1 453 1 486 1 579 1 672 1 869
173 133 137 183 194 182 129 93 122 201 212
87 104 108 110 125 145 119 109 129 164 167
1972
618778
1 380
977
1 U.S. dollars per head. Excluding China and other Asian centrally planned cou ttries. 5 U.S. dollars per cubic metre.
1973(Pre-lim-
inary)
8031 029
1 591
1 211
1 889 2 273
195 264
175 410
8 8 9 9 9 10 8 8 9 9 10 11 1438 37 39 45 46 46 47 46 39 49 54 53 719 20 16 17 18 18 19 21 22 24 24 26 4524 24 25 24 24 23 24 25 25 23 24 25 4312 12 11 11 12 11 11 11 11 12 14 13 2214 14 13 14 15 16 16 15 16 17 18 20 3437 36 36 37 39 39 38 39 43 44 47 50 6859 61 61 61 63 63 62 64 65 67 63 80 108
282 274 249 247 255 247 242 233 256 265 233 247 296144 147 146 142 141 144 144 140 146 145 151 166 19959 56 55 56 53 59 59 58 63 67 66 76 9184 84 85 90 94 92 89 88 91 97 100 113 13666 66 65 65 69 69 68 69 70 77 79 78 91
123 117 117 126 129 123 123 120 127 149 155 154 180129 128 126 127 125 127 130 132 135 141 147 151 172238 234 227 235 236 243 246 245 243 255 266 277 316

Western Europe
AGRICULTURAL PRODUCTS
Wheat and wheat flour (wheatequivalent)BarleyMaizeOatsRyeMillet and sorghumsRice (milled equivalent) , . .
Sugar (raw equivalent)2 .
PotatoesPulses (drY)ApplesBananasCitrus fruitGrapes (fresh)Vegetable oils and oilseeds (oilequivalent) 4Oilseed cake and mealCattle 6Sheep, lambs and goats .
Pigs 5Meat (fresh, chilled and frozen),ButterCheeseCoffee (green)Cocoa beansTeaWineTobacco (unmanufactured)Wool (actual weight)Cotton (lint)SisalRubber (nalurtil)
FISHERY PRODUCTS
Fresh, chilled or frozen fish . .
Dried, salted or smoked fish .
Crustacea and molluscs, fresh,frozen, dried, salted, etc. .
Fish products and preparations,whether or not in airtight con-tainersCrustacean and MOLLUSC prOdUCISand preparations, whether or notin airtight containersOils and fats, crude or refined,of aquatic animal origin . . .
Meals, solubles and similar ani-mal feedstuffs of aquatic animalorigin
FOREST PRODUCTS
Pulpwood 7Coniferous logs 7Broadleaved logs 7Pitprons YSawn softwood 7Sawn hardwood 7Plywood and veneers
See notes at end of table.
ANNEX TABLE 5. - VOLUME OF IMPORTS OF MAJOR AGRICULTURAL, FISHERY AND FOREST PRODUCTS
1961 1962 1963 1964
179
1965 1966 1967 1968 1969 1970 1971 1972
1 73(Pre-lira-
inaryi
metr'c tons
15.13 13.32 12.07 10.59 12.66 12.42 10.45 10.94 13.57 13.57 13.34 13.49 14.074.19 4.72 3.63 4.51 4.84 5.02 4.95 4.10 4.62 6.40 6.68 5.69 5.509.43 12.91 13.87 14.48 16.95 18.69 19.38 18.76 16.63 17.47 19.60 20.17 23.380.86 1.32 1.07 0.97 1.32 1.28 1.05 1.02 0.96 1.23 1.24 1.05 1.200.75 1.02 0.74 0.46 0.36 0.41 0.41 0.27 0.24 0.22 0.27 0.27 0.371.77 2.88 2.03 2.18 2.74 3.20 2.43 1.49 0.84 1.36 1.93 0.89 1.420.54 0.58 0.58 0.59 0.61 0.73 0.58 0.71 0.70 0.63 0.69 0.76 0.803.99 4.22 5.32 4.97 4.54 4.97 4.84 4.67 4.42 4.49 4.66 4.98 0.841.48 1.97 1.72 1.56 2.39 2.06 1.95 1.85 2.36 2.32 2.05 2.55 2.370.45 0.61 0.68 0.66 1.03 1.00 0.81 0.97 1.16 0.94 0.88 1.09 1.131.11 1.23 0.96 1.13 1.36 1.28 1.24 1.30 1.34 1.27 1.41 1.64 1.461.66 1.75 1.73 1.74 2.13 2.28 2.28 2.23 2.22 2.12 2.31 2.56 2.562.71 2.98 2.71 3.30 3.21 3.31 3.19 3.14 3.43 3.61 3.43 3.63 3.760.37 0.43 0.37 0.44 0.50 0.48 0.49 0.48 0.51 0.51 0.55 0.46 0.50
3.62 3.61 3.90 3.85 3.90 4.20 4.21 4.32 4.52 4.88 5.38 5.71 5.574.60 5.67 5.91 6.17 7.00 7.99 7.48 7.44 8.05 9.11 9.82 10.37 10.581.83 1.49 2.02 2.03 2.03 2.03 2.56 2.99 3.33 3.29 3.53 3.93 3.270.88 1.35 1.32 1.37 1.93 1.79 1.74 2.16 2.53 2.54 2.82 3.01 2.721.04 0.96 0.74 0.91 1.24 1.25 1.14 1.30 1.83 2.13 2.37 3.00 2.801.27 1.44 1.72 1.81 1.89 1.91 2.06 2.04 2.26 2.72 2.86 3.35 3.450.47 0.49 0.51 0.56 0.52 0.52 0.57 0.54 0.53 0.59 0.55 0.51 0.590.36 0.39 0.42 0.43 0.46 0.47 0.48 0.50 0.50 0.54 0.59 0.60 0.630.99 1.04 1.12 1.19 1.18 1.24 1.28 1.39 1.47 1.50 1.51 1.61 1.680.52 0.56 0.56 0.54 0.59 0.60 0.55 0.54 0.55 0.53 0.55 0.60 0.610.29 0.29 0.30 0.29 0.30 0.28 0.32 0.34 0.28 0.32 0.31 0.29 0.302.33 2.55 1.95 2.10 1.92 2.16 1.62 1.68 1.97 2.49 2.05 2.62 2.920.48 0.52 0.52 0.54 0.53 0.52 0.56 0.54 0.57 0.58 0.63 0.65 0.680.36 0.88 0.86 0.81 0.80 0.80 0.73 0.79 0.83 0.78 0.73 0.78 I 0.571.59 1.46 1.44 1.54 1.39 1.57 1.45 1.41 1.44 1.35 1.26 1.28 1.520.36 0.39 0.40 0.37 0.38 0.39 0.34 0.37 0.36 0.34 0.33 0.32 0.330.78 0.76 0.75 0.74 0.76 0.76 0.76 0.81 0.91 0.94 0.94 0.95 1.00
Thousand metr'c tons
598.9 648.8 727.2 747.3 820.9 792.5 816.9 869.7 814.3 894.9 967.7 980.2 1065.0207.8 203.2 200.6 188.9 196.9 202.3 211.8 198.0 195.4 211.5 210.1 232.1 182.0
104.4 117.3 100.0 136.8 138.1 132.0 143.1 151.3 160.3 176.4 195.8 248.3 237.0
219.0 261.8 254.3 269.4 272.8 256.6 255.8 269.0 244.9 245.5 254.4 281.4 307.0
13.4 17.6 21.8 28.1 31.6 34.0 31.7 34.5 35.7 42.5 43.5 43.6 54.0
570.7 596.0 640.9 593.6 623.9 568.3 742.4 766.6 662.7 599.4 619.4 662.9 566.0
960.2 1165.6 1195.5 1496.2 1564.7 1469.5 1723.0 1997.1 2082.9 1904.2 1752.6 1 881.0 1 091.0
Million metric tons
8.55 7.47 6.92 8.78 9.42 8.99 9.14 9.78 11.00 14.53 12.08 9.24 11.502.28 2.25 2.44 2.23 2.25 2.52 2.51 2.53 2.38 2.52 2.25 2.78 4.155.78 5.51 6.08 6.76 6.21 6.41 6.30 7.00 8.34 7.78 8.19 9.00 10.501.82 1.44 1.30 1.34 1.16 0.87 0.44 0.40 0.54 0.59 0.40 0.29 0.29
19.62 20.22 21.68 24.25 23.57 21.85 22.09 23.66 23.88 24.40 23.54 25.47 28.702.03 1.91 2.20 2.48 2.60 2.67 2.65 3.10 3.36 3.54 3.43 3.99 5.600.90 0.98 1.10 1.33 1.40 1.33 1.65 1.38 2.01 2.25 2.19 2.53 3.20
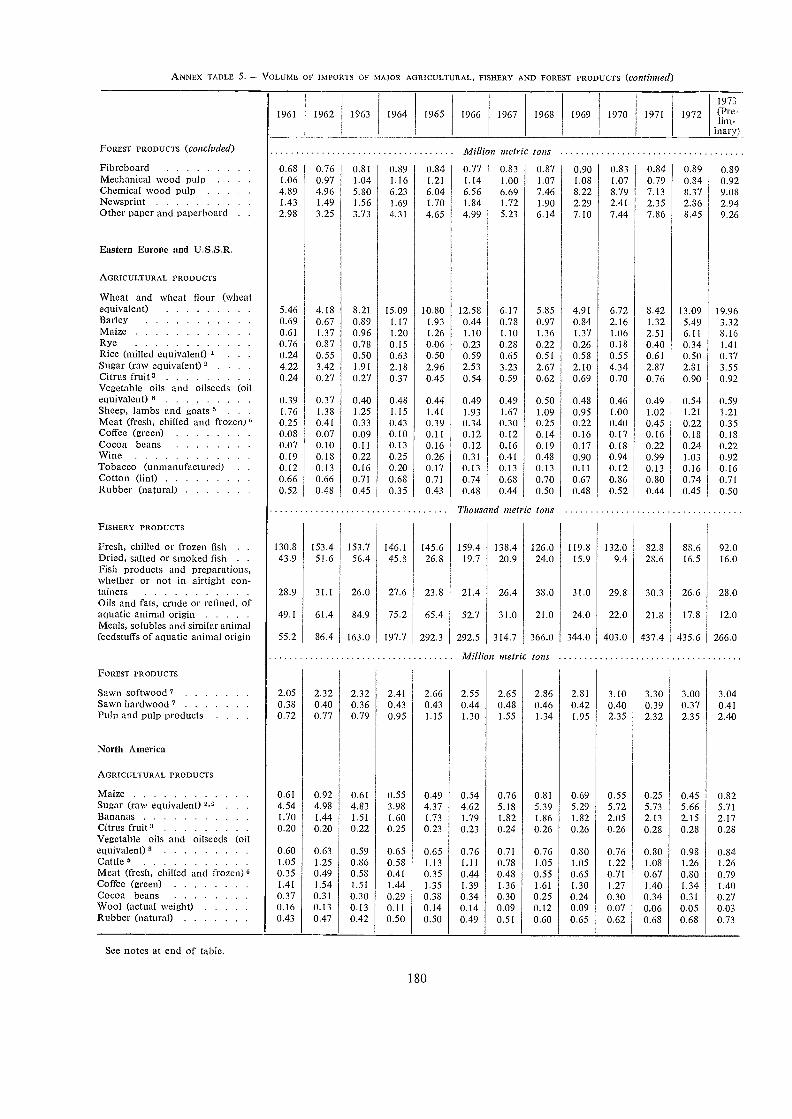
See notes at end of table.
ANNEX TABLE 5. - VOLUME OF IMPORTS OF MAJOR AGRICULTURAL, FISHERY AND FOREST PRODUCTS (continued)
180
1961 1962 1963 1964 1965 1966 1967 1968 1969 1970 1971 1972
1973(Pre-lim-
inary)
FOREST PRODUCTS (concluded) 7v! illion metric tons
Fibreboard 0.68 0.76 0.81 0.89 0.84 0.77 0.83 0.87 0.90 0.83 0.84 0.89 0.89Mechanical wood pulp 1.06 0.97 1.04 1.16 1.21 1.14 1.00 1.07 1.08 1.07 0.79 0.84 0.92Chemical wood pulp 4.89 4.96 5.80 6.23 6.04 6.56 6.69 7.46 8.22 8.79 7.13 8.37 9.08Newsprint 1.43 1.49 1.56 1.69 1.70 1.84 1.72 1.90 2.29 2.41 2.35 2.86 2.94Other paper and panel board 2.98 3.25 3.73 4.31 4.65 4.99 5.23 6.14 7.10 7.44 7.86 8.45 9.26
Eastern Europe and U.S.S.R.
AGRICULTURAL l'RODUCTS
Wheat and wheat flour (wheatequivalent) 5.46 4.13 8.21 15.09 10.30 12.58 6.17 5.85 4.91 6.72 8.42 13.09 19.96Barley 0.69 0.67 0.89 1.17 1.93 0.44 0.78 0.97 0.84 2.16 1.32 5.49 3.32Maize 0.61 1.37 0.96 1.20 1.26 1.10 1.10 1.36 1.37 1.06 2.51 6.11 8.16Rye 0.76 0.87 0.78 0.15 0.06 0.23 0.28 0.22 0.26 0.18 0.40 0.34 1.41Rice (milled equivalent) 0.24 0.55 0.50 0.63 0.50 0.59 0.65 0.51 0.58 0.55 0.61 0.50 0.37Sugar (raw equivalent)2 . 4.22 3.42 1.91 2.18 2.96 2.53 3.23 2.67 2.10 4.34 2.87 2.81 3.55Citrus fruit 3 0.24 0.27 0.27 0.37 0.45 0.54 0.59 0.62 0.69 0.70 0.76 0.90 0.92Vegetable oils and oilseeds (oilequivalent) 8 0.39 0.37 0.40 0.48 0.44 0.49 0.49 0.50 0.48 0.46 0.49 0.54 0.59Sheep, lambs and goats 5 . 1.76 1.38 1.25 1.15 1.41 1.93 1.67 1.09 0.95 1.00 1.02 1.21 1.21Meat (fresh, chilled and frozen). 0.25 0.41 0.33 0.43 0.39 0.34 0.30 0.25 0.22 0.40 0.45 0.22 0.35Coffee (green) 0.08 0.07 0.09 0.10 0.11 0.12 0.12 0.14 0.16 0.17 0.16 0.18 0.18Cocoa beans 0.07 0.10 0.11 0.13 0.16 0.12 0.16 0.19 0.17 0.18 0.22 0.24 0.22Wine 0.19 0.18 0.22 0.25 0.26 0.31 0.41 0.48 0.90 0.94 0.99 1.03 0.92Tobacco (unmanufacturcd) 0.12 0.13 0.16 0.20 0.17 0.13 0.13 0.13 0.11 0.12 0.13 0.16 0.16Cotton (lint) 0.66 0.66 0.71 0.68 0.71 0.74 0.68 0.70 0.67 0.86 0.80 0.74 0.71Rubber (natural) 0.52 0.48 0.45 0.35 0.43 0.48 0.44 0.50 0.48 0.52 0.44 0.45 0.50
Thousand metric tons
FISHERY PRODUCTS
Fresh, chilled or frozen fish . . 130.3 153.4 153.7 146.1 145.6 159.4 138.4 126.0 119.8 132.0 82.8 88.6 92.0Dried, salted or smoked fish . . 43.9 51.6 56.4 45.8 26.8 19.7 20.9 24.0 15.9 9.4 28.6 16.5 16.0Fish products and preparations,whether or not in airtight con-tainers 28.9 31.1 26.0 27.6 23.8 21.4 26.4 38.0 31.0 29.8 30.3 26.6 28.0Oils and fats, crude or refined, ofaquatic animal origin 49.1 61.4 84.9 75.2 65.4 52.7 31.0 21.0 24.0 22.0 21.8 17.8 12.0Meals, solubles and similar animalfeedstuffs of aquatic animal origin 55.2 86.4 163.0 197.7 292.3 292.5 314.7 366.0 344.0 403.0 437.4 435.6 266.0
Milli 71 metric tons
FOREST PRODUCTS
Sawn softwood 7 2.05 2.32 2.32 2.41 2.66 2.55 2.65 2.86 2.81 3.10 3.30 3.00 3.04Sawn hardwood 7 0.38 0.40 0.36 0.43 0.43 0.44 0.48 0.46 0.42 0.40 0.39 0.37 0.41Pulp and pulp products 0.72 0.77 0.79 0.95 1.15 1.30 1.55 1.34 1.95 2.35 2.32 2.35 2.40
North America
AGRICULTURAL PRODUCTS
Maize 0.61 0.92 0.61 0.55 0.49 0.54 0.76 0.81 0.69 0.55 0.25 0.45 0.82Sugar (raw equivalent) 2,' 4.54 4.98 4.83 3.98 4.37 4.62 5.18 5.39 5.29 5.72 5.73 5.66 5.71Bananas 1.70 1.44 1.51 1.60 1.73 1.79 1.82 1.86 1.82 2.05 2.13 2.15 2.17Citrus fruit 3 0.20 0.20 0.22 0.25 0.23 0.23 0.24 0.26 0.26 0.26 0.28 0.28 0.28Vegetable oils and oilseeds (oilequivalent) 8 0.60 0.63 0.59 0.65 0.65 0.76 0.71 0.76 0.80 0.76 0.80 0.98 0.84Cattle 5 1.05 1.25 0.86 0.58 1.13 1.11 0.78 1.05 1.05 1.22 1.08 1.26 1.26Meat (fresh, chilled and frozen), 0.35 0.49 0.58 0.41 0.35 0.44 0.48 0.55 0.65 0.71 0.67 0.80 0.79Coffee (green) 1.41 1.54 1.51 1.44 1.35 1.39 1.36 1.61 1.30 1.27 1.40 1.34 1.40Cocoa beans 0.37 0.31 0.30 0.29 0.33 0.34 0.30 0.25 0.24 0.30 0.34 0.31 0.27Wool (actual we ght) 0.16 0.13 0.13 0.11 0.14 0.14 0.09 0.12 0.09 0.07 0.06 0.05 0.03Rubber (natural) 0.43 0.47 0.42 0.50 0.50 0.49 0.51 0.60 0.65 0.62 0.68 0.68 0.73

See notes at end of table.
ANNEX TABLE 5. - VOLUME OF IMPORTS OF MAJOR AGRICULTURAL, FISHERY AND FOREST PRODUCTS (continued)
181
1961 1962 1963 1964 1965 1966 1967 1968 1969 1970 1971 19721973(Pre-lim-
inary)
Thousand inetr'c tonsFISHERY PRODUCTS
Fresh, chilled or frozen fish 282.9 348.4 322.1 340.2 361.1 432.7 394.3 502.7 492.0 526.7 530.9 726.7 792.0Dried, salted or smoked fish . 39.8 37.7 36.5 36.0 35.8 33.4 32.8 33.2 30.3 33.0 33.8 32.1 32.6Crustacea and molluscs, fresh,frozen, dried, salted, etc 91.6 99.7 110.7 100.6 104.8 113.5 114.2 122.4 128.6 137.4 129.2 148.1 136.0Fish products and preparations,whether or not in airtight con-tainers 69.6 72.5 63.1 68.2 67.7 88.9 82.4 38.4 82.5 101.3 86.8 108.3 104.0Crustacean and mollusc productsand preparations, whether or notin airtight containers 13.1 14.3 15.5 22.3 23.2 21.5 24.9 26.2 26.3 27.8 23.9 31.0 32.0Oils and fats, crude or refined, ofaquatic animal origin 50.3 59.6 49.8 35.7 43.3 38.5 31.3 32.0 26.5 31.0 28.4 10.0 5.7Meals, solubles, and similar ani-mal feedstuffs of aquatic animalorigin 210.2 234.7 350.6 406.9 250.3 410.1 595.3 779.9 326.8 227.8 257.0 356.8 62.6
Million metric tons
FOREST PRODUCTS
PUIDWOOli 7 3.43 3.39 3.08 1.85 1.33 1.98 1.86 1.65 1.64 1.37 1.06 1.10 0.90Coniferous logs 0.97 1.21 1.23 1.20 1.56 1.24 1.30 1.58 1.50 1.79 1.79 2.39 1.97Broadleaved logs 0.22 0.28 0.24 0.51 0.50 0.53 0.59 0.53 0.47 0.48 0.41 0.46 0.47Sawn softwood 9.86 11.15 12.11 11.73 11.73 11.39 11.69 13.98 14.06 13.86 17.38 21.52 21.65Sawn hardwood 0.83 0.97 0.97 1.00 1.08 1.26 1.20 1.09 1.36 1,01 1.12 1.43 1.63Plywood 7 0.51 0.66 0.73 0.90 0.97 1.16 1.19 1.75 2.04 1.90 2.42 3.12 3.12Wood pulp 2.28 2.58 2.58 2.73 2.92 3.08 2.88 3.22 3.68 3.21 3.24 3.45 3.60Newsprint 4.96 4.97 4.91 5.40 5.74 6.34 5.99 5.86 6.16 6.02 6.24 6.44 6.83Other paper and paperboard 0.28 0.30 0.28 0.31 0.33 0.42 0.41 0.43 0.48 0.56 0.62 0.70 0.72
Oceania
AGRICULTURAL PRODUCTS
Wheat and wheat flour (wheatequivalent) 0.17 0.19 0.18 0.18 0.17 0.15 0.10 0.05 0.01 0.02 0.08 0.04 0.05Sugar (raw equivalent) 2. . . 0.14 0.12 0.13 0.13 0.11 0.13 0.13 0.15 0.15 0.14 0.16 0.18 0.17Rubber (natural) 0.04 0.05 0.04 0.04 0.03 0.03 0.03 0.03 0.03 0.05 0.04 0.05 0.06
Thousand metr c tons
FISFIERY PRODUCTS
Fresh, chilled or frozen fish . . 15.8 14.4 5.1 19.1 21.0 28.0 27.0 27.0 33.0 32.0 39.7 22.2 25.8Dried, salted or smoked fish . 4.0 5.0 5.0 4.9 4.0 5.0 3.0 4.0 5.0 4.0 4.6 4.3 3.0Crustacea and molluscs, fresh,frozen, dried, salted, etc 0.5 0.5 1.0 1.2 1.0 1.0 1.0 1.0 1.0 1.6 1.1 4.0Fish products and preparations,whether or not in airtight con-tainers 24.7 19.1 18.8 27.4 24.5 25.1 27.0 27.0 27.0 28.0 29.0 14.7 15.0Crustacean and mollusc productsand preparations, whether or notin airtight containers 0.6 0.3 0.3 0.6 0.7 2.0 2.0 2.0 2.0 3.0 2.5 3.0 3.2Oils and fats, crude or refilled,of aquatic animal origin . . . 3.5 3.3 2.9 3.9 7.3 8.0 4.0 5.0 4.0 4.0 4.3 1.1 1.2Meals, solubles and similar ani-mal feedstuffs of aquatic animalorigin 9.4 6.2 5.7 8.5 11.0 11.0 14.0 28.0 30.0 27.0 32.0 27.4 14.1
Milli n metric tons
FOREST PRODUCTS
Sawn softwood 0.71 0.60 0.58 0.73 0.69 0.72 0.70 0.69 0.77 0.72 0.73 0.74 0.81
Newsprint 0.30 0.20 0.22 0.26 0.29 0.28 0.28 0.30 0.30 0.28 0.29 0.22 0.27Other paper and paperboard 0.20 0.15 0.17 0.17 0.18 0.17 0.18 0.20 0.21 0.25 0.27 0.30 0.28

ANNEX TABLE 5. - VOLUME UP IMPORTS OF MAJOR AGRICULIURAL, FISHERY AND FOREST PRODUCTS (CO/t/iM/Cd)
See notes at end of table.
1961 1962 1963 1964 1965 1966
Million metric tons
182
1967 1968 1969 1970 1971 1972
1973(Pre-lim-
4.19 4.90 5.16 5.72 5.12 6.07 6.36 6.72 6.62 5.68 6.38 6.89 8.930.22 0.36 0.63 0.66 0.40 0.41 0.37 0.63 0.66 1.52 0.86 1.20 2.400.35 0.31 0.34 0.50 0.55 0.45 0.37 0.40 0.39 0.41 0.49 0.42 0.450.51 0.24 0.27 0.22 0.27 0.31 0.25 0.17 0.41 0.18 0.21 0.33 0.560.27 0.23 0.24 0.24 0.25 0.25 0.23 0.24 0.26 0.29 0.24 0.19 0.210.17 0.13 0.16 0.19 0.16 0.19 0.21 0.21 0.21 0.18 0.20 0.22 0.240.61 0.67 0.66 0.57 0.53 0.56 0.61 0.53 0.56 0.50 0.49 0.46 0.460.09 0.12 0.29 0.14 0.07 0.09 0.11 0.13 0.12 0.13 0.18 0.11 0.07
0.18 0.20 0.23 0.24 0.24 0.23 0.28 0.30 0.29 0.32 0.34 0.34 0.350.09 0.07 0.08 0.08 0.08 0.08 0.08 0.09 0.09 0.11 0.12 0.14 0.14
Thousand metric tons
2.3 3.1 16.4 16.4 20.0 16.3 22.7 28.3 31.0 26.4 42.3 39.9 53.065.5 68.5 78.2 81.1 59.6 31.6 90.2 90.8 102.0 96.7 82.0 68.7 70.0
0.5 0.8 0.9 1.0 1.4 3.5 4.8 6.5 8.0 8.5 8.1 6.7 6.0
16.3 21.8 20.7 25.9 22.8 28.1 24.6 22.6 25.4 25.0 28.9 40.0 41.0
0.5 0.5 0.5 0.6 1.4 1.5 1.1 0.8 0.7 0.4 1.3 1.0 1.0
10.3 2.3 7.5 13.5 18.3 32.5 19.7 37.3 41.9 27.0 29.0 14.5 24.0
31.0 48.5 53.8 72.7 77.1 91.9 104.7 137.1 134.2 160.0 220.7 174.0 102.0
Milli it metric tons
0.28 0.23 0.22 0.25 0.37 0.35 0.31 0.23 0.21 0.22 0.20 0.19 0.221.32 1.09 0.99 1.23 1.43 1.51 1.36 1.60 1.59 1.56 1.58 1.40 1.330.49 0.38 0.41 0.49 0.50 0.54 0.49 0.62 0.63 0.70 0.61 0.61 0.670.64 0.58 0.54 0.56 0.60 0.66 0.67 0.76 0.85 0.87 0.72 0.72 0.760.31 0.28 0.29 0.44 0.43 0.57 0.63 0.82 0.80 1.06 0.97 0.97 0.98
AGRICULTURAL PRODUCTS
Wheat and wheat flour (wheatequivalent) 6.24 5.99 8.21 9.21 10.75 11.52 11.34 10.76 8.34 8.90 7.79 6.94 12.53Barley 0.16 0.09 0.21 0.20 0.11 0.01 0.01 0.16 0.12 0.04 0.08 0.39 0.51Maize 0.36 0.47 0.54 0.34 0.37 0.30 0.58 0.35 0.56 0.85 1.05 1.31 1.42Millet and sorghums 0.02 0.03 0.02 0.02 0.07 1.59 2.17 0.46 0.46 0.07 0.08 0.09 1.04Rice (milled equivalent) . 4.10 3.71 4.37 4.29 3.79 3.92 4.18 4.04 3.88 4.99 4.24 4.72 4.69Sugar (raw equivalent), . 0.92 1.01 0.90 0.91 1.07 1.24 1.24 1.55 1.90 1.57 1.63 1.35 1.75Dates 0.07 0.05 0.08 0.08 0.08 0.08 0.09 0.10 0.09 0.11 0.07 0.06 0.06Vegetable oils and oilseeds (oilequivalent) 8 0.41 0.39 0.42 0.50 0.42 0.40 0.37 0.38 0.49 0.54 0.70 0.66 0.64Milk (condensed, evaporated andpowdered) 0.38 0.40 0.43 0.41 0.39 0.41 0.36 0.39 0.42 0.39 0.38 0.37 0.36Cotton (lint) 0.45 0.44 0.40 0.44 0.45 0.46 0.52 0.58 0.50 0.59 0.63 0.56 0.70Jute and kenaf 0.10 0.09 0.06 0.07 0.16 0.10 0.03 0.08 0.03 0.01 0.14 0.25 0.19Rubber (natural)11 0.12 0.13 0.12 0.09 0.10 0.10 0.12 0.11 0.13 0.04 0.05 0.05 0.05
Latin America
AGRICULTURAL PRODUCTS
Wheat and wheat flour (wheatequivalent)MaizeRice (milled equivalent)"Sugar (raw equivalent)2BananasPulses (dry)Cattle 5Sheep, lambs and goatsMilk (condensed, evaporated andpowdered)Rubber (natural)
FISHERY PRODUCTS
Fresh, chilled or frozen fish .
Dried, salted or smoked fish .
Crustacea and molluscs, fresh,frozen, dried, salted, etc. . . .
Fish products and ¡preparations,whether or not in airtight con-tainersCrustacean and mollusc productsand preparations, whether or notin airtight containersOils and fats, crude or refined,of aquatic animal origin . .
Meals, solubles and similar animalfeedstuffs of aquatic animal origin
FOREST PRODUCTS
Broadleaved logs,Sawn softwoodWood pulpNewsprintOther paper and papei board
Far East"

FISHERY PRODUCTS
Fresh, chilled or frozen fishDried, salted or smoked fish . .
Crustacea and molluscs, fresh,frozen, dried, salted, etc. . .
Fish products and preparations,whether or not in airtight con-tainersCrustacean and mollusc productsand preparations, whether or notin airtight containersOils and fats, crude or refilled, ofaquatic animal originMeals, solubles and similar ani-mal feedstuffs of aquatic animalorigin
FOREST PRODUCTS
Coniferous logs.'Broadleaved logs7Sawn softwood 7Sawn hardwood ,Wood pulpNewsprintOther paper and mi.rierbottrd
China and other Asian centrallyplanned countries
AGRICULTURAL PRODUCTS
Wheat and wheat flour (wheat
ANNEX TABLE 5. - VOLUME OF INIPORTS OF MAJOR AGRICUL1 URAL, FISHERY AND FOREST PRODUCTS (continued)
See notes at end of table.
183
1961 1962 1963 1964 1965 1966 1967 1968 1969 1970 1971 19721973(Pre-lim-
inary)
Thouscnd metr'c tons
76.0 89.1 97.8 107.7 109.4 115.6 113.9 110.9 102.0 121.8 116.5 121.1 138.080.1 57.5 64.4 62.0 55.8 72.0 57.8 62.7 60.9 61.1 61.8 62.0 46.0
36.3 34.2 43.3 42.0 39.5 42.5 40.3 36.6 35.9 43.9 50.9 52.0 53.0
96.6 62.9 67.8 67.1 64.2 73.8 82.4 92.9 102.2 89.5 97.0 83.6 81.0
17.9 17.9 20.1 17.2 17.1 12.6 21.8 23.9 22.6 27.8 16.0 15.5 15.0
1.6 1.9 1.8 1.6 1.6 2.1 5.2 5.9 6.9 8.6 7.4 4.7 4.0
44.8 44.3 42.7 49.2 52.8 55.8 70.9 86.2 112.0 119.5 125.9 87.2 58.0
n metric tons
0.01 0.11 0.19 0.23 0.14 0.25 0.31 0.48 0.23 0.29 0.44 0.33 0.590.69 1.04 0.93 1.74 2.05 2.82 3.10 4.28 4.46 5.16 5.74 5.72 6.850.03 0.05 0.02 0.02 0.02 0.02 0.04 0.01 0.01 0.01 0.04 0.04 0.040.09 0.12 0.12 0.35 0.30 0.37 0.40 0.65 0.47 0.47 0.48 0.56 0.510.19 0.24 0.26 0.23 0.19 0.23 0.22 0.31 0.37 0.36 0.38 0.48 0.540.29 0.24 0.26 0.26 0.27 0.34 0.32 0.40 0.46 0.43 0.55 0.45 0.480.37 0.35 0.39 0.47 0.45 0.53 0.59 0.67 0.72 0.76 0.86 0.74 0.90
equivalent) 3.89 5.14 4.89 5.99 5.85 7.13 4.22 6.14 4.52 6.62 5.66 6.28 7.45Barley 1.12 0.50 0.03 0.58 0.03 0.03 0.05 0.09 0.24 0.32 0.46 0.28Maize 0.06 0.52 0.05 0.41 0.23 0.09 0.27 0.38 0.41 0.60 0.55 1.99 2.90Millet and sorghums 0.04 0.01 0.03 - - - - - 0.03 0.04 0.04Rice (milled equivalent)i 0.13 0.03 0.11 0.13 0.17 0.07 0.06 1.08 1.31 0.90 1.26 1.11 1.41Sugar (raw equivalent), 1.56 0.97 0.56 0.46 0.53 0.68 0.74 0.65 0.73 0.79 0.79 0.99 0.99Dates 0.03 0.06 0.07 0.06 0.04 0.06 0.06 0.06 0.06 0.06 0.06 0.09 0.10Vegetable oils and oilseeds (oilequivalent)" 0.07 0.05 0.06 0.08 0.06 0.06 0.10 0.10 0.12 0.15 0.14 0.19 0.25Milk (condensed, evaporated andpowdered) 0.01 0.01 0.01 0.01 0.01 0.01 0.01 0.02 0.02 0.02 0.03 0.02Cotton (lint) 0.11 0.13 0.22 0.17 0.25 0.19 0.19 0.17 0.20 0.21 0.27 0.32 0.57Jute and kenaf 0.01 0.02 0.03 0.06 0.06 0.06 0.07 0.06 0.05 0.05 0.05 0.05 0.09Rubber (natural, diy) . . . . 0.10 0.10 0.13 0.15 0.16 0.18 0.16 0.24 0.30 0.21 0.20 0.23 0.29
Near East 12
AGRICULTURAL PRODUCTS
Wheat and wheat flour (wheatequivalent) 3.95 3.56 4.23 3.43 4.43 4.39 4.62 4.57 3.38 4.98 7.85 4.85 4.79Maize 0.18 0.33 0.28 0.53 0.25 0.31 0.34 0.35 0.20 0.26 0.28 0.41 0.43Rice (milled equivalent)1 0.31 0.37 0.28 0.36 0.37 0.39 0.32 0.34 0.38 0.45 0.63 0.55 0.91Sugar (raw equivalent) 1.46 1.10 0.88 1.27 1.82 1.54 1.36 1.09 0.99 1.05 1.29 1.19 1.44Dates 0.06 0.06 0.07 0.07 0.06 0.05 0.07 0.06 0.06 0.07 0.11 0.03 0.10Vegetable oils and oilseeds (oilequivalent) 8 0.16 0.24 0.27 0.22 0.21 0.22 0.25 0.26 0.34 0.37 0.43 0.50 0.43Sheep, lambs and goats 5 . 2.16 2.68 2.60 2.86 4.87 3.32 2.14 3.88 3.72 3.77 3.93 4.28 4.56

ANNEX TABLE 5. - VOLUME OF IMPORTS OF MAJOR AGRICULTURAL, FISHERY AND FOREST PRODUCTS (concluded)
1961 1962 1963 1964 1965 1966 1967 1968
Thousa met,. c tons
FISHERY PRODUCTS
1969 1970 1971 1972
1973(Pre-lim-inary)
1 Including paddy converted at 65%. - 2 Including refined sugar co werted at 108.7%. -- 3 Oranges, mandarins and lemons. -4 Groundnuts, copra, palm kernels, soybeans, suntlowerseed castor beans, cottonseed, olive oil, groundnut oil, coconut oil, palm oil,palm-kernel oil, soybean oil, sunflowerseecl oil, castor oil, cottonseed oil. - 5 Million head. - O Beef and veal, mutton and lamb,pork, poultry meat. - 7 MilliOn CUbiC metres. - S Groundnuts, copra, palm kernels, soybeans, sunflowerseed, castor beans, linseed,cottonseed, olive oil, groundnut oil, coconut oil, palm oil, palm-kernel oil, soybean oil, sunfiowersced oil, castor oil, linseed oil, cottonseedoil. - 9 Excluding trade between the United States and its territories. - 10 Excluding Japan, and China and other Asian centrallyplanned countries. - 11 Excluding imports into Malaysia for reexport. - 12 Excluding Israel. - 13 Excluding South Africa.
184
Fresh, chilled or frozen fish . . 5.6 6.5 6.9 8.5 13.7 23.8 21.5 13.6 9.0 8.0 8.6 8.3 8.0
Dried, salted or smoked fish . . 4.0 2.8 2.1 2.9 2.9 8.8 2.8 3.5 2.4 2.2 2.0 1.8 2.0
Crustacca and molluscs, fresh,frozen, dried, salted, etc. . . . 0.2 0.1 0.2 0.1 0.2 0.2 0.4 0.4 0.3 0.4 0.5 0.6 1.0
Fish products and preparations,whether or not in airtight con-tainers 10.1 10.9 9.1 9.0 6.9 5.5 7.7 8.6 9.2 12.7 11.8 13.9 18.0
Oils and fats, crude or refilled, ofaquatic animal origin 0.8 0.7 0.6 0.4 0.8 0.9 0.5 0.3 1.8 1.0 1.5 1.4 1 0
Meals, solubles and similar ani-mal feedstuffs of aquatic animalorigin - 2.5 5.2 4.5 7.8 5.4 6.8 6.0 1.0
Million metric tons
FOREST PRODUCTS
Sawn softwood 7 0.83 0.83 0.84 1.02 1.06 1.24 1.05 0.90 0.93 1.22 1.19 1.60 1.60
All paper and paperboard . 0.27 0.28 0.28 0.27 0.31 0.37 0.46 0.46 0.52 0.49 0.62 0.53 0.54
Africa 13
AGRICULTURAL PRODUCTS
Wheat and wheat flour (wheatequivalent) 2.04 2.04 1.59 1.57 1.74 2.53 3.07 2.78 2.18 2.87 3.40 3.53 4.18
Barley 0.37 0.24 0.01 0.02 0.04 0.09 0.12 0.05 0.07 0.02 0.03 0.08 0.14
Rice (milled equivalent) 1 0.47 0.56 0.52 0.60 0.74 0.70 0.63 0.60 0.59 0.72 0.85 0.81 0.78
Sugar (raw equivalent)' . . 1.22 1.30 1.10 1.17 1.23 1.32 1.30 1.23 0.97 1.27 1.32 1.35 1.39
Potatoes 0.35 0.27 0.23 0.22 0.17 0.17 0.12 0.16 0.14 0.17 0.18 0.17 0.18
Cattle 5 0.79 0.84 0.91 0.89 0.89 0.87 0.85 0.81 0.91 0.91 0.90 0.82 0.72Sheep, lambs and goats 5 2.38 2.29 2.52 2.34 2.29 2.36 2.34 2.36 2.38 2.35 2.43 2.29 2.14Wine 0.24 0.22 0.23 0.25 0.25 0.27 0.25 0.26 0.24 0.22 0.20 0.19 0.19
Thousand /net .ic tons
FISHERY PRODUCTS
Fresh, chilled or frozen fish .. 55.0 55.7 72.8 62.8 65.9 81.6 58.1 56.8 62.0 79.5 98.3 94.5 95.0Dried, salted or smoked fish .. 99.7 97.0 101.0 91.8 85.8 97.3 85.9 71.6 62.1 63.4 62.4 48.9 51.0
Crustacea and molluscs, fresh,frozen, dried, salted, etc. . . . 3.9 1.9 1.2 2.1 0.7 0.8 0.7 0.6 1.5 1.0 0.9 1.0 1.0
Fish products and preparations,whether or not in airtight con-tainers 39.5 31.3 31.1 29.6 33.8 32.8 26.7 29.9 30.8 37.2 43.2 52.5 43.0Crustacean and mollusc productsand preparations, whether or notin airtight containers 0.1 0.1 0.1 0.1 0.8 0.8 0.4 0.4 0.6 0.8 1.0
Oils and fats, crude or refined, ofaquatic animal origin . . . . 1.0 1.9 1.7 2.3 1.7 0.8 0.8 1.7 3.6 4.8 4.8 4.7 4.0Meals, solubles and similar ani-mal feedstuff's of aquatic animalorigin 7.9 7.6 8.7 6.2 9.4 10.1 11.5 11.0 15.0 15.0 16.1 16.0 10.0
Million metric tons
FOREST PRODUCTS
Sawn softwood' 0.50 0.44 0.44 0.55 0.48 0.54 0.57 0.63 0.71 0.91 0.94 0.95 0.91Sawn hardwood 0.12 0.12 0.13 0.12 0.17 0.19 0.17 0.18 0.17 0.18 0.18 0.24 0.27Newsprint 0.05 0.05 0.05 0.03 0.04 0.05 0.04 0.03 0.03 0.04 0.05 0.05 0.05Other paper and paperboard 0.15 0.15 0.18 0.21 0.23 0.24 0.26 0.28 0.31 0.37 0.38 0.38 0.38
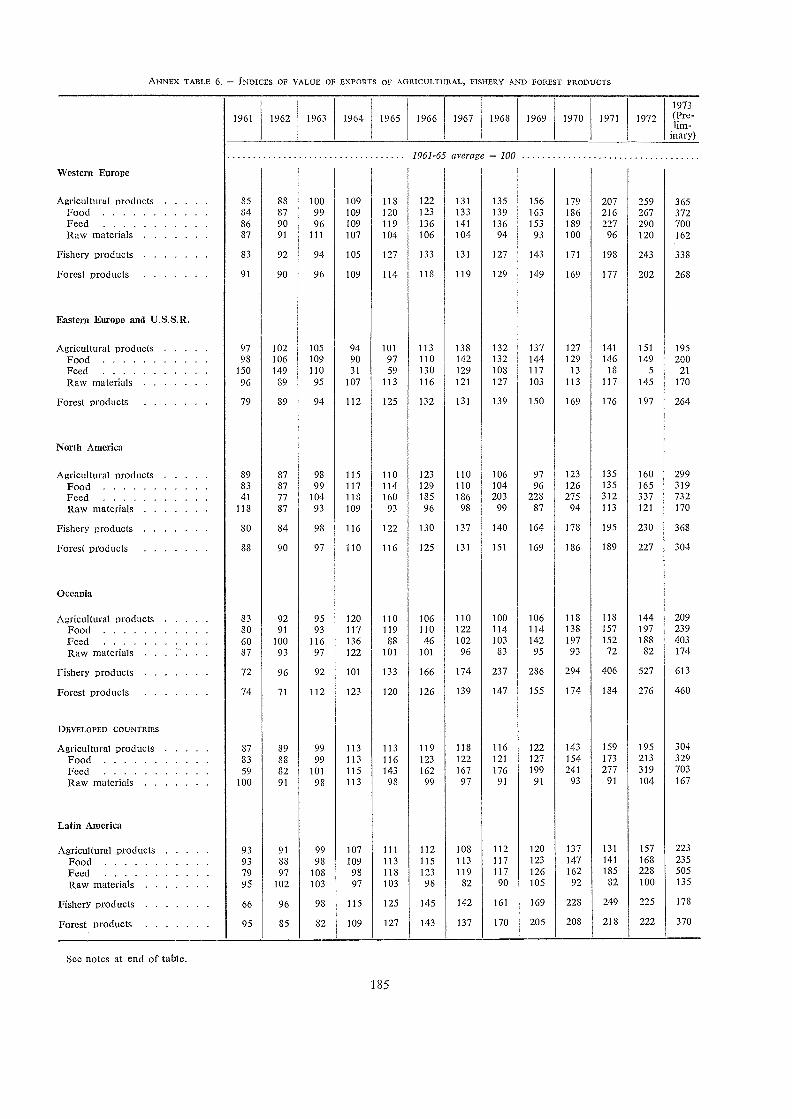
ANNEX TABLE 6. INDICES OF VALUE OF EXPORTS OF AGRICULTURAL, FISHERY AND FOREST PRODUCTS
See notes at end of table.
185
1961 1962 1963 1964 1965 1966 1967 1968 1969 1970 1971 1972
1973
(Pre-lim-
inary)
1961-65 average = 100
Western Europe
kgricultural products 85 88 100 109 118 122 131 135 156 179 207 259 365Food 84 87 99 109 120 123 133 139 163 186 216 267 372Feed 86 90 96 109 119 136 141 136 153 189 227 290 700Raw materials 87 91 111 107 104 106 104 94 93 100 96 120 162
Fishery products 83 92 94 105 127 133 131 127 143 171 198 243 338
Forest products 91 90 96 109 114 118 119 129 149 169 177 202 268
Eastern Europe and U.S.S.R.
Agricultural products 97 102 105 94 101 113 138 132 137 127 141 151 195Food 98 106 109 90 97 110 142 132 144 129 146 149 200Feed 150 149 110 31 59 130 129 108 117 13 18 5 21
Raw materials 96 89 95 107 113 116 121 127 103 113 117 145 170
Forest products 79 89 94 112 125 132 131 139 150 169 176 197 264
North America
kgricultural products 89 87 98 115 110 123 110 106 97 123 135 160 299Food 83 87 99 117 114 129 110 104 96 126 135 165 319Feed 41 77 104 118 160 185 186 203 228 275 312 337 732Raw materials 118 87 93 109 93 96 98 99 87 94 113 121 170
Fishery products 80 84 98 116 122 130 137 140 164 178 195 230 368
Forest products 88 90 97 110 116 125 131 151 169 186 189 227 304
Dceania
Agricultural 'products 83 92 95 120 110 106 110 100 106 118 118 144 209Food 80 91 93 117 119 110 122 114 114 138 157 197 239Feed 60 100 116 136 88 46 102 103 142 197 152 188 403Raw materials 87 93 97 122 101 101 96 83 95 93 72 82 174
Fishery products 72 96 92 101 133 166 174 237 286 294 406 527 613
Forest products 74 71 112 123 120 126 139 147 155 174 184 276 460
DEVELOPED COUNTRIES
Agricultural products 87 89 99 113 113 119 118 116 122 143 159 195 304Food 83 88 99 113 116 123 122 121 127 154 173 213 329
Feed 59 82 101 115 143 162 167 176 199 241 277 319 703
Raw materials 100 91 98 113 98 99 97 91 91 93 91 104 167
Latin America
Agricultural products 93 91 99 107 111 112 108 112 120 137 131 157 223
Food 93 88 98 109 113 115 113 117 123 147 141 168 235
Feed 79 97 108 98 118 123 119 117 126 162 135 228 505
Raw materials 95 102 103 97 103 98 82 90 105 92 82 100 135
Fishery products 66 96 98 115 125 145 142 161 169 228 249 225 178
Forest products 95 85 82 109 127 143 137 170 205 208 218 222 370

ANNEX TABLE 6. INDICES OF VALUE OF EXPO S OF AGRICULTURAL, FISHERY AND FOREST PRODUCTS (concluded)
I Excluding Japan, and China at d other Asian centrally planned countries. -- 2 Excluding Israel. 3 Exclu ing South Africa. --3 Excluding Eastern Europe and U.S.S.R., China and other Asian centrally planned countries.
186
1961 1962 1963 1964 1965 1966 1967 1968 1969 1970 1971 1972
1973
(Pre-lim-
inary)
1961-65 average 100
Far East
Agricultural products 96 94 103 103 101 99 93 92 98 101 103 110 150Food 92 91 107 107 102 100 98 97 88 99 109 112 132Feed 64 94 114 117 110 106 91 94 30 108 108 121 209Raw materials 103 101 99 98 99 100 88 89 113 103 94 106 171
Fishery products 71 87 101 118 123 146 166 184 231 284 349 479 560
Forest products 73 82 105 113 126 149 169 234 260 295 331 384 640
Near East 2
Agricultural products 87 94 103 104 111 115 112 116 125 134 146 165 208Food 76 103 103 106 114 105 112 122 147 128 134 163 222Feed 68 84 102 116 129 137 137 133 137 166 137 191 224Raw materials 95 90 104 102 109 118 1 1 1 112 113 135 152 164 199
Fishery products 93 91 92 103 122 129 139 144 114 156 169 211 290
Forest products 86 87 92 94 141 169 170 205 224 267 272 284 475
Africa 3
Agricultural products 92 92 99 110 107 105 101 Ill 115 130 118 134 161
Food 89 91 99 III 109 113 111 123 124 139 130 148 179Feed 86 85 90 110 129 123 145 149 137 149 125 162 230Raw materials 96 86 106 107 104 86 80 78 83 97 99 105 115
Fishery products 101 102 96 106 95 117 1 1 1 120 137 154 173 202 279
Forest products 83 81 101 120 114 113 114 130 158 147 148 178 300
DEVELOPING COUNTRIES
Agricultural products 93 93 101 106 107 108 103 107 114 125 122 139 187Food 91 90 101 109 109 110 109 114 117 133 131 149 196Feed 74 93 107 108 118 119 115 115 113 142 144 176 328Raw materials 98 97 102 100 103 101 90 92 107 106 103 116 159
World
Agricultural products 90 91 100 109 110 115 114 114 120 134 142 163 246Food 87 90 100 110 112 118 119 120 125 143 154 182 265Feed 70 91 104 108 126 138 138 142 151 180 196 230 477Raw materials 99 94 100 106 101 102 96 95 101 101 100 114 167
Fishery products 4 80 95 96 109 121 131 131 137 151 179 206 245 309
Forest products 87 89 97 110 117 124 128 143 164 182 189 220 306

ANNEX TAIILE 7. INDICES OF VOLUME OF EXPORTS OF AGRICULTURAL, I ISHERY ANO FOREST PRODUCTS
See notes at end of table.
187
1961 1962 1963 1964 1965 1966 1967 1968 1969 1970 1971 1972
1973
(Pre-lim-
inary)
1961-65 average = 100
Western Europe
Agricultura! products 93 93 99 103 I 1 1 114 125 136 145 161 172 186 204Food 93 93 98 104 113 114 127 141 151 168 177 188 209Feed 97 91 93 107 111 120 129 129 144 170 194 230 293Raw materials 96 96 105 100 104 106 109 105 102 103 102 113 111
Fishery products 91 97 97 103 112 113 119 116 116 118 117 132 133
Forest products 91 92 99 108 109 114 116 129 143 149 147 153 188
Easterii Europe and U.S.S.R.
Agricultural products 102 106 99 89 103 116 141 139 140 123 131 125 131
Food 103 112 101 84 99 112 145 141 147 122 132 119 124
Feed 168 150 102 30 52 122 116 99 97 12 10 4 3
Raw materials 99 89 92 105 114 124 127 131 107 116 117 133 144
Forest products 78 39 98 113 121 130 132 139 143 159 155 161 161
North America
Agricultural products 91 88 99 115 108 118 105 104 94 117 122 139 174
Food 85 83 100 116 112 123 104 102 93 122 123 146 184
Feed 46 81 101 117 155 166 164 186 208 246 269 255 310
Raw materials 117 87 95 111 91 95 100 101 83 87 101 100 122
Fishery products 83 88 103 114 113 116 116 122 130 124 133 135 159
Forest products 87 90 99 110 115 123 128 141 151 161 161 175 216
Oceania
Agricultural products 90 98 98 103 106 103 108 111 114 124 127 134 125
Food 84 96 96 112 112 104 116 115 115 128 141 148 137
Feed 58 98 124 138 80 35 88 91 123 186 112 132 188
Raw materials 97 100 100 104 99 102 99 106 114 120 111 119 110
Fishery products 81 89 84 101 134 136 153 205 207 223 278 316 299
Forest products 70 71 111 129 119 131 155 182 199 218 212 238 282
DEVELOPED COUNTRIES
Agricultura! products 92 93 99 109 103 112 112 117 116 134 141 155 173
Food 88 92 99 110 111 115 115 120 119 140 147 163 185
Feed 64 86 98 115 137 144 149 162 183 215 237 244 297
Raw materials 106 95 98 105 96 99 100 103 98 101 103 109 112
Latin America
Agricultural products 95 100 100 96 107 111 110 112 11S 121 114 118 126
Food 96 99 100 97 107 111 114 114 119 125 120 124 133
Feed 89 103 101 96 110 115 110 107 121 144 149 157 164
Raw materials 93 105 101 93 108 106 92 97 116 100 83 83 87
Fishery products 85 106 105 125 79 119 139 174 146 164 168 160 85
Forest products 100 86 83 107 124 138 135 163 170 174 177 187 294

ANNEX TABLE 7. INDICES OF VOLUME OF EXPORTS OF AGRICULTURAL, FISHERY ANO FOREST PRODUCTS(concluded)
1 Excluding Japan, and China and °the - Asian centrally planned countries. 2 Excluding Israel. 3 Excluding South Africa. -4 Excluding China and other Asian centrally planned countries.
188
1961 1962 1963 1964 1965 1966 1967 1968 1969 1970 1971 1972
1973
(Pre-11m-
inary)
1961-65 average = 100
Far East 1
Agricultural products 93 97 104 104 101 102 99 101 104 107 115 120 122Food 97 96 105 103 100 100 93 93 91 98 108 113 106Feed 75 95 111 116 103 99 93 103 93 111 113 122 133Raw materials 90 100 103 104 103 106 106 113 123 117 123 128 142
Fishery products 87 90 95 112 116 129 170 144 154 180 198 235 255
Forest products 74 79 100 118 129 154 169 222 253 293 318 363 570
Near East 3
Agricultural products 87 99 103 103 108 116 110 111 116 129 131 138 135Food 79 104 102 104 110 94 95 104 125 110 113 126 125Feed 73 90 101 114 121 123 126 139 142 163 129 162 131Raw materials 92 96 104 102 106 127 117 113 110 136 139 142 139
Fishery products 105 101 95 90 109 121 99 95 94 101 107 102 154
Forest products 76 92 116 95 122 154 149 176 220 257 281 230 360
Africa 3
Agricultural products 94 98 98 104 106 105 97 105 104 109 100 111 107Food 91 98 99 103 108 108 102 111 106 108 103 116 112Feed 98 89 92 112 112 118 130 134 130 131 110 143 120Raw materials 95 88 99 107 111 98 95 92 95 113 109 108 101
Fishery products 100 106 101 106 88 105 98 115 129 131 141 167 196
Forest products 87 85 98 116 113 113 112 127 145 134 134 140 220
DEVELOPING COUNTRIES
Agricultural products 93 99 101 101 106 107 104 107 111 115 113 119 122Food 94 98 101 100 106 107 105 108 109 115 114 120 122Feed 84 97 103 107 109 I 1 1 109 113 115 133 129 145 144Raw materials 91 99 102 102 106 109 102 106 116 115 113 117 121
World
Agricultural products 93 96 100 104 108 II 1 1 1 1 114 115 124 127 137 147Food 91 96 100 104 109 113 114 117 117 128 131 142 154Feed 79 94 101 107 119 126 127 135 145 166 174 186 210Raw materials 98 96 100 103 103 105 103 106 107 109 109 115 119
Fishery products 4 87 96 98 110 109 110 118 125 122 130 130 141 145
Forest products 87 90 99 110 115 122 126 141 155 163 164 176 185

ANNEX TABLE 8. INDICES OF VALUE OF IMPORTS OF AGRICULTURAL AND FOREST PRODUCTS
Sec notes at end of table.
189
1961 1962 1963 1964 1965 1966 1967 1968 1969 1970 1971 1972
1973
(Pre-lim-
inary)
1961-65 average 100
Western Europe
Agricultural products 88 93 100 107 111 116 113 109 120 131 144 169 236Food 85 91 100 103 116 121 120 116 128 143 161 138 258Feed 70 96 103 108 123 143 134 130 138 164 186 207 377Raw materials 100 98 101 105 95 98 90 88 96 91 87 103 143
Forest products 87 86 96 113 118 120 119 130 151 172 174 204 284
Eastern Europe and U.S.S.R.
Agricultural products 88 86 94 116 116 114 102 103 105 129 132 161 240Food 79 81 92 127 121 117 105 101 100 127 133 175 268Feed 40 61 92 145 166 176 172 192 187 221 252 342 744Raw materials 106 96 98 97 104 104 90 95 96 114 109 111 156
Forest products 91 95 92 104 119 121 141 156 171 199 216 225 313
North America
Agricultural products 93 98 102 105 102 110 109 122 121 139 139 154 207
Food 92 98 103 105 102 112 113 128 127 150 152 167 222
Feed 81 104 112 100 103 108 103 105 123 145 131 157 262
Raw materials 99 101 99 103 99 93 88 88 90 77 68 77 113
Forest products 90 96 97 106 112 122 118 137 151 139 103 202 270
Oceania
Agricultural products 95 83 99 114 109 105 99 92 101 112 114 117 133
Food 87 86 99 120 108 114 106 100 105 120 128 128 143
Feed 25 10 66 160 239 532 492 688 453 631 677 514 540
Raw materials 107 80 99 105 108 90 86 74 90 94 36 93 108
Forest products 110 83 98 98 110 104 110 113 121 140 150 137 183
DEVELOPED COUNTRIES
Agricultural products 89 93 101 108 110 117 114 114 123 136 147 171 242
Food 85 91 101 109 114 121 122 122 131 150 165 190 264
Feed 72 94 103 108 124 141 130 128 136 165 182 202 379
Raw materials 101 96 101 105 97 101 93 92 98 94 90 108 156
Latin America
Agricultural products 85 93 101 114 107 115 117 121 123 131 144 165 251
Food 84 93 102 114 106 113 119 122 124 133 145 168 262
Feed 72 101 90 137 100 107 113 124 156 157 317 294 413
Raw materials 89 91 97 110 113 122 102 108 109 111 123 130 171
Forest products 103 91 87 105 113 127 124 146 163 185 185 185 310
Far East 1
Agricultural products 88 88 101 110 113 122 132 130 125 130 135 141 226
Food 85 86 102 113 114 127 136 131 124 129 129 132 228
Feed 92 96 110 94 108 86 90 101 132 158 180 197 265
Raw materials 102 98 94 97 109 102 116 128 129 135 160 176 216
Forest products 93 95 96 110 106 134 142 172 192 218 255 238 400

ANNEX TABLE 8. INDICES OF VALUE OF IMPORTS OF AGRICULTUP,AL ANO FOREST PRODUCES (concluded)
1961 1962
1973
liiui-in ry)
1 Excluding Japan, and China and other Asian centrally planned countries.-2 Excluding Israel.-3 Excluding South Africa.
190
1961-65 average ---- 100
Near East2
Agricultora l products 87 83 99 112 115 119 115 113 108 130 179 176 232Food 87 87 99 112 115 120 115 114 107 130 183 177 233Feed 66 105 90 101 139 191 178 159 189 346 522 563 675Raw materials 86 99 97 105 113 107 109 105 119 122 124 156 200
Forest products I 100 101 84 99 117 133 132 127 143 165 192 204 332
Africa 3
Agricultural products 97 97 92 104 110 110 111 108 107 126 143 157 102Food 97 98 92 103 109 110 111 105 106 123 144 157 206Feed 51 67 88 119 178 166 183 177 219 276 332 405 409Raw materials 87 77 81 126 129 128 139 149 142 176 132 210 246
Forest products 91 89 96 104 119 127 135 143 165 205 217 217 364
DEVELOPING COUNTRIES
Agricultural producls 89 91 99 110 111 118 122 121 119 130 147 157 230Food 88 90 100 112 111 119 123 121 118 130 146 155 234Feed 81 97 101 109 112 106 110 117 149 181 260 270 353Raw materials 96 95 94 103 112 109 114 122 123 131 149 166 206
World
Agricultural products 89 92 100 109 110 116 114 114 120 134 144 167 241Food 85 90 100 111 114 120 120 120 125 143 157 181 258Feed 70 91 102 Ill 126 142 133 133 141 170 191 216 407ItaW materials 100 96 100 103 101 102 95 95 101 102 100 116 165
Forest products 88 89 96 110 117 125 128 145 164 181 189 218 366

ANNEX TABLE Y. INDICES OF VOLUME OF IMPORTS OF AGRICULTURAL AND FoREsT PRODUCTS
See notes at end of table.
191
1961 1962 1963 1964 1965 1966 1967 1968 1969 1970 1971 1972
1973
(Pre-lim-
inary)
1961-65 average = 100
Western Europe
Agricultural products 93 99 100 102 106 Ill 110 111 116 121 124 132 134Food 91 97 100 102 109 113 115 116 121 126 132 139 144Feed 79 99 101 106 116 131 125 126 137 153 164 173 177Raw materia s 100 141 100 101 93 101 97 99 103 101 98 102 99
Forest products 88 90 99 111 112 Ill 117 131 144 152 146 161 198
Eastern Europe and U.S.S.R.
Agricultural products 89 89 94 113 114 112 100 103 104 126 129 153 174Food 85 86 90 121 119 113 97 95 92 116 122 161 198Feed 45 62 94 136 163 179 161 189 184 214 239 300 337Raw materials 99 96 101 99 104 104 96 104 100 117 111 111 1 1 I
Forest products 90 94 91 105 120 129 150 166 181 205 208 205 205
North America
Agricultural products 97 104 102 97 99 106 107 117 I 1 1 115 117 124 128Food 97 105 104 96 98 106 108 119 112 118 120 125 129Feed 88 105 108 103 96 92 87 87 108 114 104 111 I I 1
Raw materials . 102 98 95 104 104 102 100 109 101 92 89 100 99
Forest products 89 96 98 105 Ill 121 117 128 138 131 146 167 205
Oceania
Agricultural products 100 90 99 104 107 108 103 101 107 11 1 114 120 11 I
Food 95 95 100 106 104 115 103 105 107 114 113 122 113
Feed 29 71 157 243 500 400 600 400 529 557 414 371
Raw materials 107 83 99 100 110 96 93 90 103 102 103 114 104
Forest products 113 82 93 100 112 106 110 114 120 132 135 132 162
DEVELOPED COUNTRIES
Agricultural products 94 98 100 102 106 112 111 115 118 124 127 135 140
Food 91 98 101 102 108 115 116 120 123 130 135 143 149
Feed 80 97 101 106 116 129 121 123 126 153 158 168 176
Raw materials 101 98 100 101 100 103 101 104 106 105 103 110 109
Latin America
Agricultural products 90 95 101 110 104 112 113 122 123 129 134 143 186
Food 39 96 102 110 102 111 114 121 123 130 132 143 193
Feed 85 100 83 129 101 100 105 117 149 162 296 260 273Raw materials 91 91 97 110 Ill 115 Ill 125 120 118 132 135 137
Forest products 104 90 86 107 113 129 130 160 166 193 175 174 274
Ear East 1
Agricultural products 91 91 101 107 110 120 124 125 120 125 124 123 150Food 89 88 103 109 112 124 125 120 117 122 118 116 146
Feed 96 96 109 96 101 75 82 97 134 151 170 184 162Raw materials 101 102 94 96 106 104 124 145 139 136 150 150 164
Forest products 86 89 96 117 112 141 148 183 191 200 232 220 346

ANNEX TABLE 9. INDICES OF VOLUME OF IMPORTS OF AGRICULTURAL AND FOREST PRODUCTS (concluded)
192
Excluding Japan, and China and other Asian centrally planned countrics.-2Excluding Israel.-3 Excluding South Africa.
1961 1962 1963 1964 1965 1966 1967 1968 1969 1970 1971 1972
1973(Pre-lim-
inary)
1961-65 average 100
Near East"'
Agricultural products 92 95 97 101 115 119 117 119 114 136 169 152 158Food 93 94 97 101 115 119 115 117 112 134 171 147 155Feed 71 114 91 103 123 157 146 149 183 308 422 439 406Raw materials 83 98 97 104 118 118 129 137 136 147 149 188 177
Forest products 91 97 92 103 118 130 135 131 152 155 175 177 278
Africa 3
Agricultural products 102 102 93 98 105 112 113 113 109 123 134 135 141Food 103 103 94 96 104 112 116 112 109 123 136 136 144Feed 62 71 87 112 161 154 170 165 196 248 278 308 270Raw materials 86 75 82 134 123 125 138 162 144 158 170 181 181
Forest products 95 89 95 105 115 121 128 136 149 178 184 186 292
DEVELOPING COUNTRIES
Agricultural product 93 94 99 105 108 116 119 121 119 128 136 135 156Food 93 93 100 106 108 118 119 119 116 127 135 132 156Feed 89 98 99 108 107 95 101 112 148 174 234 236 221Raw materials 96 97 94 103 110 109 122 140 133 134 147 154 160
World
Agricultural products 93 96 99 104 107 113 111 114 116 124 128 137 147Food 91 96 99 105 109 115 114 117 118 128 133 142 155Feed 78 94 101 108 119 131 123 128 131 158 170 182 192Raw materials 99 97 100 101 103 104 102 107 109 109 109 115 118
Forest products 87 91 98 110 114 122 126 143 154 164 164 179 206

ANNEX TABLE 10. - STOCKS OF SELECTED AGRICULTURAL PRODUCTS
1 July until 1967 included (except Federal Republic of Germany, 1 June). - 1 Commercial stocks. - 3 Government (or official agency)stocks only. - , Barley, oats, maize, sorghum and rye. - 5 Maize and sorghum, 1 October. - 6 Maize, 1 April. - 7 Governmentstocks only. - 8 November. - 1 31 October. - 10 Old crop for export. - 11 September. - 12 31 January 1971. - 13 Includingpaddy converted to milled rice at 69.5%. - 14 Excluding Italy and Luxembourg. - 15 Finland, Norway, Sweden, Switzerland. -lc Excluding Italy. - 17 1963-65.
193
Date 1961-65average 1967 1968 1969 1970 1971 1972 1973
1974(csti-
ma ted)_
Mill.011 Mell'iC 1011S
Nheat
EXPORTING COUNTRIES
Jnited States 1 July 30.7 11.6 14.7 22.2 24.1 19.9 23.5 11.9 6.8:anada 1 Aug. 13.3 15.7 18.1 23.2 27.5 20.0 16.0 9.9 10.6krgentina 1 Dec. 1.5 0.2 1.0 0.3 0.8 0.7 0.5 0.1 o.1.s.ustralia 1 Dec. 0.6 2.2 1.4 7.3 7.2 3.4 1.4 0.5 0.5-Luropean Econorn e Community(1961-67,original members;1958-74, nine member states) 1 Aug. 6.5 15.4 9.2 9.1 5.5 6.1 7.5 34.8 26.0
TOTAL OF Al3OVE 52.6 35.1 44.4 62.1 65.1 50.1 48.8 27.2 24.0
MPOI3TING COUNTRIES
ndia 3 31 Dec. ... 0.8 2.1 2.3 3.1 5.0 3.5 ... ...
2.oarse grains 4
EXPORTING COUNTRIES
United States 5 1 July 62.7 34.2 44.4 46.0 44.6 30.9 45.1 30.3 18.9Canada 1 Aug. 4.3 4.9 4.4 6.7 7.1 5.4 6.2 5.7 5.9Argentina 5 1 Dec. 0.4 0.6 1.8 1.7 1.8 - 702 70.1 70.6Australia 1 Dec. 0.2 0.9 0.3 1.2 1.2 1.6 1.0 0.5 0.6
TOTAL OF ABOVE 67.6 39.6 51.4 55.6 54.7 37.9 52.5 36.6 26.0
Rice (milled equivalent)
EXPORTING COUNTRIES
Pakistan 3Fhailand 10United States"
31 Dec.31 Dec.31 July
...
. ..0.24
80.02-0.27
0.1980.060.21
0.24110.30
0.52
90.38191.10
0.52
.90.260.890.59
90.38
o..
90.10
0:1.6
...6.25
Japan 7 31 Oct. - - - 9.36 9.50 7.03 5.22 3.71
TOTAL OF ABOVE 0.24 0.29 0.46 10.42 11.40 10.03 5.96 3.97 0.25
IMPORTING COUNTRIES
lndia3Japan,
31 Dec.31 Oct.
...3 .19
...5.85
1.037.03
1.64- 1.83- 2.31- 1.36- 1.44- ......
TOTAL OF ABOVE 3.19 5.85 8.06 1.64 1.83 2.31 1.36 1.44 ...
Butter
Canada and United States . . . 0.13 0.11 0.08 0.08 0.09 0.07 0.06 0.04 ...European Economic Community:
original members" 0.09 0.20 0.33 0.34 0.16 0.13 0.34 è 0.29new members 0.04 0.06 0.08 0.05 0.03 0.04 0.09 1
Other western Europe 19 . . . . 0.01 0.02 0.02 0.03 0.02 0.02 0.01 0.02 ...Australia and New Zealand . 0.07 0.06 0.07 0.09 0.07 0.05 0.05 0.07 ...
TOTAL OF ABOVE 31 Dec. 0.34 0.45 0.58 0.59 0.37 0.30 0.55 0.41 ...
Dried skim milk
United States 0.18 0.12 0.13 0.10 0.06 0.04 0.02 0.03 ...European Economic Community:
original members19new members
...0.03
0.20 0.310.04
0.390.02
0.180.02
0.100.02
0.190.10 0.33
TOTAL OF ABOVE 31 Dec. 0.21 0.32 0.48 0.51 0.26 0.16 0.31 0.36 ...
Sugar (raw value)
WORLD TOTAL 1 Sept. 14.1 19.1 20.6 19.3 21.4 19.1 17.2 15.8 15.7
Coffee
EXPORTING COUNTRIES . . . . End of crop sea-son, mainly be-tween 31 Marchand 30 Sept.
174.30 5.00 4.73 4.15 3.55 2.90 2.70 2.69 2.12

See notes at end of table.
ANNEX TABLE I I. - ANNUAL CHANGES IN CONSUMER PRICES: ALL rrEms ANO FOOD
All items Food
194
Developed countries
Percent per year
WESTERN EUROPE
Austria 3.9 133 4.7 6.3 7.5 4.4 I 2.1 3.8 5.8 7.8Belgium 2.5 3.5 4.4 5.4 7.0 2.9 3.5 1.9 6.9 8.0Denmark 5.5 7.5 5.3 6.6 9.3 4.2 7.5 5.9 9.3 13.0Finland 5.3 246 6.5 7.1 11.7 5.9 252 4.4 9.3 12.5France 3.3 4.3 5.5 5.9 7.3 4.3 3.8 6.5 6.7 9.4Germany, Fed. Rep. or 2.8 2.4 5.1 5.8 6.9 2.6 3 2.4 3.8 6.2 7.6Greece 1.6 2.5 3.0 4.3 15.4 2.5 2.6 5.2 3.8 21.3Iceland 11.0 12.8 6.4 10.3 20.1 15.2 13.3 2.0 16.6 27.9Ireland 4.2 5.3 8.9 8.7 11.3 3.9 4.3 7.4 11.8 16.4Italy 4.9 3.0 4.8 5.7 10.8 4.6 2.2 4.0 6.3 12.0Netherlands 3.5 4.8 7.6 7.3 7.9 4.0 4.3 4.2 6.6 7.9Norway 4.1 5.0 6.3 7.2 7.5 4.5 5.3 6.0 7.2 7.0Portugal 2.6 6.4 12.0 10.7 12.9 2.8 5.2 3.9 9.9 9.2S pai n 7.0 5.1 8.3 8.3 11.4 7.7 3.7 7.8 9.1 12.6Sweden 3.6 4.5 7.4 6.0 6.8 5.3 4.5 9.2 9.1 5.8Switzerland 3.2 3.4 6.6 6.7 8.7 2.9 0.9 6.4 6.5 6.0United Kingdom 3.6 4.6 9.5 7.1 9.2 3.6 4.6 11.1 8.8 15.1Yugoslavia 13.6 10.5 15.6 18.4 21.4 17.3 9.0 16.6 23.1 25.9
Noicrit AMERICA
Cailada 1.6 3.8 2.9 4.3 7.6 2.2 3.4 1.1 7.6 14.5United States 1.3 4.2 4.3 3.3 6.2 1.4 4.0 3.0 1.3 14.5
OCEANIA
Australia 1.8 3.1 6.0 5.9 9.4 2.0 2.1 3.9 3.8 15.2New Zealand 2.7 4.1 10.4 6.9 8.2 2.4 4.1 9.1 4.8 11.3
OTHER DEVELOPED COUNTRIES
Israel 7.1 4.0 12.0 8.7 19.9 5.6 3.1 13.6 12.9 20.7Japan 6.0 5.4 6.1 4.5 11.7 7.2 6.1 6.0 3.8 13.0South Africa 2.1 3.4 6.1 6.5 9.5 7.6 3.0 4.8 7.1 15.2
Developing countries
LATIN AMERICA
Argentina 23.0 19.4 34.7 58.5 60.3 23.0 18.3 41.7 63.1 55.1Bolivia 5.1 5.9 3.7 6.5 4 20.9 2.1 7.8 4.0 6.3 4 21.1Brazil 60.0 28.0 21.1 ... 512.4 60.0 26.0 23.9 ... 2 16.1Chile 27.0 26.0 20.1 77.8 333.0 30.0 26.0 23.3 115.2 376.0Colombia 12.4 10.1 7.1 14.3 22.8 13.4 9.2 7.5 19.2 31.9Costa Rica 2.3 7.5 3.0 4.7 15.2 2.2 3.8 3.7 1.2 21.6Dominican Republic 2.7 1.0 2.3 7.8 15.1 2.5 0.1 5.1 6.0 18.4Ecuador 4.0 4.6 3.4 7.9 12.9 4.9 6.0 6.5 11.1 20.3El Salvador 0.2 1.1 0.3 1.8 6.4 1.1 2.2 0.3 1.1 7.5Guatemala 0.1 1.5 -0.5 0.7 14.4 0.1 1.7 -1.9 -0.3 19.2Guyana 1.9 1.5 2.1 4.5 8.9 2.3 2.8 2.3 6.0 18.4Haiti 3.7 1.7 10.3 3.2 22.7 4.1 1.8 6.1 10.2 27.4Honduras 2.7 1.6 2.3 5.2 3.2 3.2 1.8 3.8 8.1 2.0Jamaica 2.9 4.3 6.7 5.8 19.9 2.4 4.7 7.9 3.2 25.8Mexico 1.9 3.5 3.2 6.4 16.4 1.6 3.8 1.9 6.3 13.7Panama G 1.1 1.6 1.8 5.6 6.9 " 1.4 1.7 2.4 4.6 9.9Paraguay 1.2 5.0 9.2 12.8 ... 0.3 8.6 11.1 21.6Peru 9.4 7 7.8 6.3 7.2 9.5 10.5 7 7.1 6.9 7.4 10.1
1960 1965 1970 1971 1972 1960 1965 1970 1971 1972to to to to to to to to to to
1965 1970 1971 1972 1973 1972 19731965 1970 1971

195
4 1963-65.
1960to
1965to
All items
1972to
Food
1970to
1971to
1960to
1965to
1970to
1971to
1972to
1965 1970 1971 1972 1973 1965 1970 1971 1972 1973
Percent per year
LATIN AMERICA (concluded)
Puerto Rico 2.2 3.2 4.3 3.2 7.3 3.0 4.1 5.7 3.6 12.6Trinidad and Tobago 2.2 3.8 3.5 9.3 14.9 2.1 3.7 4.6 11.5 19.0Uruguay 8 16.2 60.0 23.9 76.5 97.0 s 13.1 60.0 24.5 93.8 102.8Venezuela 6 1.7 1.6 2.7 3.0 4.3 1.7 0.9 2.9 5.9 9.2
FAR EAST
India 6.1 p8.9 3.3 6.3 16.8 6.5 59,g 1.5 6.4 21.3Indonesia 100.0 4.3 6.4 31.1 . . . 100.0 2.6 10.4 43.4Khmer Republic 4.3 4.5 71.4 25.4 157.9 2.7 6.7 94.4 28.4 186.4Korea, Rep. of 15.4 12.3 13.5 11.9 3.2 18.3 12.5 18.9 3.5 2.6Laos 38.0 6.0 1.3 25.2 30.7 39.0 4.0 0.7 34.9 40.4Malaysia, W,. st 0.5 20.4 1.5 2.6 10.6 0.6 20.4 1.0 3.0 15.3Nepal 6.2 2.0 8.4 11.4 7.2 -3.5 9.0 11.7Pakistan 2.6 5.6 4.7 8.0 22.6 3.8 6.0 5.2 10.8 28.8Philippines 4.8 13.6 15.7 7.1 6.8 1 5.2 ... 18.0 4.6Sri Lanka 1.7 4.2 2.6 6.4 9.6 1.3 4.9 2.0 6.0 12.7Thailand 1.5 2.5 2.0 4.0 11.7 2.0 4.2 0.6 6.4 14.4
NEAR. EAST
Cyprus 0.3 22.9 4.1 4.9 7.8 0.2 2 3.2 4.8 6.8 8.5Egypt 3 3.2 3.1 '° 2.9 6.5 3 6.2 5.4 ... 1047Iran 2.0 1.4 4.1 6.5 9.8 3.1 0.9 0.7 8.6 6.8Iraq 3.5 3.6 5.2 4.9 3.1 4.2 5.2 4.9Jordan 2 2.8 4.2 8.2 10.5 25.1 6.2 11.1 18.9Lebanon , 1.8 1.6 4.9 6.0 7 2.0 2.6 8.7 9.7Libyan Arab Rel ublic 1 6.1 -2.7 -1.4 11 6.3 1 8.3 -11.1 -4.4 11 8.5
Sudan 3.3 13,4 1.3 11.8 17.0 4.2 128 0.8 8.1 16.3Syrian Arab Republic 1.3 4.2 4.9 0.8 20.0 ° 1.3 4.7 3.8 - 22.1
Turkey 3.6 3 7.1 16.3 13.0 16.0 4.3 3 8.7 14.0 11.0 20.0
AFRICA
Ethiopia ... 7 3.0 0.5 -6.1 8.9 . .. 7 3.5 -0.2 -12.0 12.9
Gabon 6 4.4 3.0 3.4 1253 03,3 2.1 6.4 12 8.2
Ghana 11.8 3.7 2.6 14.0 4 8.8 14.0 2.1 2.7 17.7 4 12.2Ivory Coast 2.6 4.9 -0.8 0.4 119,3 2.8 5.9 -1.8 -1.1 11 16.0
Kenya 2.0 1.7 1.9 . .. 8.2 1.9 2.0 2.4 4.8
Liberia 4.4 0.2 4.0 19.6 ... 3.4 -9.2 - 30.2
Madagascar 2.3 5.4 6.7 6.1 2.2 5.3 6.2 9.3
Malawi 3 2.0 8.1 3.9 5.1 . .. 3 3.4 11.2 4.3 6.8
Mauritius 6 1.0 3.0 0.3 5.4 13.5 00.6 3.0 0.1 6.2 15.7
Morocco 4.0 0.6 4.1 3.7 4.5 4.6 0.1 6.3 5.1 5.4
Mozambique 131.9 3.7 15.6 7.1 5.4 130.7 4.7 13.6 14.0 -1.7Niger .. . 3.8 4.3 9.7 11.7 4.4 5.5 16.3 17.2
Nigeria 3.2 5.6 13.5 2.9 3.6 2.0 8.8 26.2 1.5 -2.4Sierra Leone 1339 4.3 -2.3 3.9 11 5.7 13 0.6 4.8 -5.7 7.5 11 10.8
Somalia 7.4 7 2.5 0.3 -2.9 114,5 7.5 7 2.8 -0.6 -2.4 118.4
Tanzania 1.2 93,7 3.7 9.9 5.1 1.2 p2.5 5.0 10.7 5.0
Togo . . . 7 2.1 6.3 7.7 3.8 . .. 7 2.6 6.8 8.3 117,3
Tunisia 74,5 2.9 5.7 2.2 4.4 7 4.8 3.1 10.3 2.4 6.6
Uganda 5.4 4.0 15.7 -3.0 11 16.5 7.3 3.5 24.7 _5.5 119.1
Zaire 1415.6 23.0 4.9 15.1 15.7 1419.0 22.0 10.5 17.6 16.6
Zambia 2.4 p8.7 6.1 5.2 5.8 2.4 9 8.8 6.6 4.6 5.7
1965-69. - 2 1967-70. - 3 1968-70. - Average January-June. - 5 Average January-J - 6 1962-65. - 7 1966-70. - 8 1960-62.- 5 1965-68. - 10 Average January-August. - 11 Average January-September. - 12 Average Janua ry-October. - 13 1961-65. -
ANNEX FAIlLE 1l. ANNUAL CI-IANGES IN ((INSUS 'ES: ALL II EMS AND FOOD (concluded)

ANNEX TABLE 12.- MAIN FEATURES OF CURRENT DEVELOPMENT PLANS
NOTE: Where possible, data refer to net investment. In many cases, howeve , no distinction is made in t le plan, and data may referto gross investment or may incluCe some elements of recurrent expenditure. The agricultural sectoi includes animal production,fisheries, forestry, irrigation, land reclamation, community development and agricultural extension.
C = comprehensive; PS = public sector. - 2 Gross domestic product. - 3 Capital expenditures. - 4 Gross material product. -1972 sucres. - 6 Low and high hypotheses. - 7 As revised by Mid-Term Review of the Plan. - s West Malaysia only. - 9 Water
resource development only. - 19 Planned investments are to be exceeded. - 11 From draft Plan. - 12 Excludes investment in semi-public interprise.
196
Investment
For-eig nex-
Share ofagriculture
Planned growth rate of:
Dura- ,-. change Agricultural Export Employ-
Currency lion a COM- production earning!: mentPub-of oo ponent
plan c.",
Total Public
oftotal
invest-ment
Totalinvest-ment
licin-
vest-ment
GNP
Total Ce-reals
To-tal
Agri-cul-
tural
To-tal
Agri-cul-tural
Million cn rency units Percent Percent per yearLATIN AMERICA
Argentina . . Pesos 1974-77 C 410 500 172 060 ... 14.3 ... 2 7.5 6.5 ... 19.6 ... ... ...Barbados . . . EC S 1972-76 C ... ... . . ... ... . . ... ... ... ... ... ...Bolivia . . . . Pesos 1971-75 C . .. .. . . ... ... ... ... ... ...Brazil . . . . Cruzeiros 1972-74 C 179 2.46 3 53 517 . 8.7 311.2 2 9.0 7.5 ... 10.0 ... 3.1 1.2Costa Rica . . Colones 1974-78 C 14 657 4 093 24.8 15.0 . .. 2 7.5 4.7 ... 9.6 4.8 4.2 2.1Cuba Pesos 1971-75 C ...
'
.. ...Dominican Rep.Ecuador . . .
PesosSucres
1970-741973-77
PSC ' 78 92 2
36' 31 743 .
..15.7
..1'7.6
. .15..4
2 6.62 9.9
5.65.3
...
...1. 2.48.7 .
.
3.9.4.53.5 .. 26
El Salvador . . Colones 1973-77 PS 876 47.9 ... . . 6.9 5.0 ... .. ... ... ...Guatemala . Quetzales 1971-75 C 1 828 403 29.7 ... 14.7 2 6.2 4.8 ... .3.6 ... ... ...Guyana . . Guy 5 1972-76 C 1 150 650 . .. ... .. 2 8.5 ... ... ... ... ... ...Haiti Gourdes 1972-76 PS ... 453 47.0 ... 21.0 2 7.7 ... ... ... ... ... ...Honduras . . . Lempiras 1974-78 C ... ... ... ... ... ... .8.1 ... ... ... ... ...Nicaragua . Corclodas 1972-76 PS ... ... ... ... .. . ... ... ... ... ... ...Panama . . . Balboas 1971-75 PS ... 1/26 8.0 8.0 .. ... ... ... ... .
Paraguay . . . Guaranis 1972-77 C ... . ... ... 24.5 2 6.0 5.0 ... 8.2 ... ... . .
Peru Soles 1973-74 C ... 75 6c..... ... 14.8 2 7.6 4.5 ... ... ... 6.7 4.3
iurinam . . Guilders 1972-76 C ... 335 83.3 ... 19.4 2 8.3 7.1 ... . . ... ... ..Uruguay . . .
Venezuela . .
PesosBolivares
1973-771970-74
PSC 60 919 24 311 1.2
...7.6 ..2 6.8
. ..
6.1
4.0/5.02 6.3
'3.814.6 .10.2
10.04.1
. .14.0
..
.
4.01.90.9
FAR EAST
Bangladesh . . Taka 1973-78 C 4 455 3 952 27.0 24.0 26.3 5.5 4.6 6.4 10.3 ... ... 4.5India . . . . Rupees 1974/75-
19711/79 C 47 561 31 400 5.0 i 14.4 12.7 5.5 4.7 4.0 7.6 ... . .. ...Indonesia . . . 2.upialls 1974/75-
1978/79 C 4 859 000 -Korea, Rep. or. Wons 1972-76 C 4 524 500 ... 20.9 11.8 ... 8.6 4.5 6.7 24.3 2.23 .2.31.6Laos Kips 1969/70-
1973/74 C 20 579 5 729 ... - ... - - -Malaysia . . : M 5 1971-75 C 7 15 015 7 6 691
. ..
*
. 732.8 7 6..9 .7.17 7 6.3 7 6.4 ... .83.4 7,81.8Nepal . . . Rupees 1970-75 C 2 930 2 280 65.0 32.9 26.1 4.0
.
. . 3.0 . . . . . . . . .ilippines . . Pesos 1971-74I'h.C 23 550 4 638 10.0 . . '16.7 5.6 6.2 6.2 8.5 ... alo
..
iri Lanka . . . Rupees 1972-76 C 15 000 7 038 19.3 20.0 24.0 6.0 4.9 7.1 6.2 ... 3.4 215Fhailand . . . Bahts 197 1/72-
1975/76 C 100 000 69 000 ... ... ... 7.0 5.1 ... 7.0 ... ... ...',TEAR EAST
kfghaniStall . . AfghaniS 1973-77 C 33 400 27 700 ... . 39.0 4.8 3.9 ... ... ... . ...Egypt . . . . E pounds 1973-32 C 8 400,ran Rials 1973-78 C 192400 000 '1520 666 ... 14.0 2;115 11.4 5.4 ... ... ...raq Dinars 1970-74 C 19 1 144 1° 859 ... 19.7 24.5 7.1 7.0 ... 2.7
... .43 4.1i
fordan . . . Dinars 1973-75 C 179 100 ... 15.5 23.7 2 8.0 6.4 ... 16.0 20.0 5.9 2.6Lebanon . . . L pounds 1972-77 C 7 200 1 740 ... ... 22.0 7.0 5.0 ... 7.3 5.5 3.4 ...-ibyan Arab
Rep. . . . . Dinars 1973-75 C 2 170 1 813 ... 14.4 15.9 210.4 16.0 ... 5.1 ... 7.0 3.8iaudi Arabia . S Rials 1971-75 Chidan . . . . Sd pounds 1971-75 C 376 200 27.9 37.2 7.6 10.0 11.4 16.6 10. 2.6 1.iyrian Arab Rep. S pounds 1971-75 C 8 000 6 450 ... 31.5 39.0 8.2 5.1 ... 6.5
'.. 4.7 2.8
furkey . . . . Liras 1973-77 C 291 200 .. 12.0.
.. 279 4.6 ... 9.4 3.0 ... . ..Yemen Arab Rep. Rials 1974-76 C 1 610 323 5.3.4 ... 17.0 6.0 6.0 ... ... ... ... ...AFRICA
Algeria . . . Dinars 1974-77 C3otswana . . . Rands 1970-75 PS 136
. . .ameroon . . CFA t'rancs 1971-76 C 280 000 145 300 ... 10.5 1.5.5 6.7 4 .6 ... 9. 4- ... ... ...--'entral African
Republic . CFA frailes 1971-75 C 63 779 16 690 ... ... 25.1 8.8 ... ... ... ... ... ...Tiabon . . . . CFA francs 1971-75 C 150 000 65 000 ... 1.2 1.2 ... ... ... ... ... ... ...juinea . . . . Sylis 1973-78 C 59 488 21 045 ... ... 9.4 ... . . ... . .. ... ...vory Coast . . CFA francs 1971-75 C 505 000 210 000 ... 11.0 22.0 7.7 4.1 ... 618 .3.0 5.5 4.0(coya " K 1974-78 PS ...-esotho . . . Rands 1970/71-
1974/75 C 60 288 ... . 23.0 5.0 3.1 ... ... ... .. ...vlauritius . . . Rupees 1971-75 C 1 052 536 ... 20.0 21.0 7.0
'..
... . . . 6.0 5.0
vtorocco . . . Dirhams 1973-77 C 26 300 12 11 200 ... 15.8 26.2 275 3.6 3.5 16.0 4.7 4.0 1.0Niger . . . . CFA francs 1971-74 PS 47 631 ... 15.0 . . ... ... ... ... ... ...sligeria . . . . N £ 1970-74 C 1 595;enegal . . . . CFA francs 1973-77 C ... ... ... ... ... ... ... ... ... ... ... ...Iwaziland . .
Tanzania . . .
RandsT £
1973-771969-74
PSC 46 4
...296
...
... . 133 23.0 6.7 43 ... ... ... 5.6 ...Cogo . . . . CFA francs 1971-75 C 75 889 56 203 .. 15.0 10.0 7.7 6.6 . ... ... ... ...Tunisia . . . . Dinars 1973-76 C 1 194 707 24.3 14.9 14.5 26.6 5.8 6..4 5.3 7.1 ... ...jganda . . . U shillings 1972-76 C 7 890Jpper Volta . . CFA francs 1972-76 C ...

FAO SALES AGENTS AND BOOKSELLERS
Australia Hunter Publications, 58A Gipps Street, Collingwood, Vic. 3066; The Assistant Director,Sales and Distribution, Australian Government Publishing Service, P.O. Box 84, Canberra,A.C.T. 2600, and Australian Government Publications and Inquiry Centres in CanberraCity, Melbourne, Sydney, Perth, Adelaide and Hobart.
Austria Wilhelm Frick Buchhandlung, Graben 27, Vienna 1.
Bangladesh Shilpa Niketan, 29 D.I.T. Super Market, Mymensingh Road, Dacca-2.
Belgium Agence et Messageries de la 'Presse, 1 rue de la Petite-Ile, Brussels 7.
Brazil Livraria Mestre Jou, Rua Guaipà 518, So Paulo 10; Rua Senador Dantas 19-S205/206,Rio de Janeiro.
Ca nada Information Canada, Ottawa.
Chile Biblioteca, FAO Oficina Regional para América Latina, Av. Providencia 871, Casilla 10095,Santiago.
China China National Publications Import Corporation, P.O. Box 88, Peking.
Colombia Litexa Colombiana Ltda., Carrera 15, N° 51-79, Bogotá.
Costa Rica Imprenta y Librería Trejos S.A., Apartado 1313, San José.
Cuba Instituto del Libro, Calle 19 y 10 N° 1002, Vedado.
Cyprus MAM, P.O. Box 1722, Nicosia.
Denmark Ejnar Munksgaard, Norregade 6, Copenhagen S.
Dominican Republic Librería Dominicana, Calle Mercedes 45-47-49, Santo Domingo.
Egypt Al Ahram, El Galaa St., Cairo.
Finland Akateeminen Kirjakauppa, 2 Keskuskatu, Helsinki.
France Editions A. Pedone, 13 rue Soufflot, 75005 Paris.
Germany, F. R. Alexander Horn Internationale Buchhandlung, Spiegelgasse 9, Postfach 2163, Wiesbaden.
Ghana Ghana Publishing Corporation, P.O. Box 3632, Accra.
Greece "Eleftheroudakis," 4 Nikis Street, Athens.
Guatemala Agencia de Representaciones "Orbe," Apartado Postal 753, Guatemala.
Haiti Max Bouchereau, Librairie "A la Caravelle," B.P. 111B, Port-au-Prince.
Hong Kong Swindon Book Co., 13-15 Lock Road, Kowloon.
Iceland Snaebjörn Jonsson and Co. h.f., Hafnarstraeti 9, P.O. Box 1131, Reykjavik.
India Oxford Book and Stationery Co., Scindia House, New Delhi; 17 Park Street, Calcutta.
Indonesia P.T. Gunung Agung, 6 Kwitang, Djakarta.
Iran Economist Tehran, 99 Sevom Esfand Avenue, Tehran.
Iraq Mackenzie's Bookshop, Baghdad.
Ireland The Controller, Stationery Office, Dublin.
Israel Emanuel Brown, P.O. Box 4101, 35 Allenby Road, and Nachlat Benyannin Street, Tel Aviv;9 Sblomzion Hamlka Street, Jerusalem.
Italy Libreria lnternazionale Rizzoli, Largo Chigi, 00187 Rome; Libreria Scientifica Dott. L. DeBiasio "Aeiou," Via Meravigli 16, 20123 Milan; Libreria Commissionaria Sansoni, S.p.A.,Via Lamarmora 45, 50121 Florence; Libreria Macchiaroli, Via Carducci 55/59, 80121Naples.
Japan Maruzen Company Ltd., P.O. Box 5050, Tokyo Central 100-31.
Kenya The E.S.A. Bookshop, P.O. Box 30167, Nairobi.
Korea, Rep. of The Eul-Yoo Publishing Co. Ltd., 5 2-Ka, Chong-ro, Seoul.
Kuwait All Prints Distributors and Publishers, P.O. Box 1719, Kuwait.

Lebanon
Malaysia
MauritiusMexico
Morocco
Netherlands
New Zealand
Nigeria
Norway
Pakistan
Panama
Philippines
Poland
Portugal
Romania
Saudi Arabia
Singapore
Somalia
Spain
Sri Lanka
Sweden
Switzerland
Syrian Arab Rep.
Tanzania
Thailand
Togo
Turkey
Uganda
United Kingdom
United Statesof America
Yugoslavia
Other countries
FAO SALES AGENTS AND BOOKSELLERS
Dar Al-Maaref Liban S.A.L., place Riad EI-Solh, B.P. 2320, Beirut.
Caxton Stationers Ltd., 13-15 Leboh Pasar Besar, Kuala Lumpur; Parrys Book Centre,25 Lobby Arcade, K.L. Hilton, Iln. Treacher, Kuala Lumpur.
Nalanda Company Limited, 30 Bourbon Street, Port-Louis.
Dilitsa, Pueblo 182-D, México 7, D.F.
Librairie "Aux Belles Images," 281 avenue Mohammed V, Rabat.
N.V. Martinus Nijhoff, Lange Voorhout 9, The Hague.
Government Printing Office: Government Bookshops at Rutland Street, P.O. Box 5344,Auckland; Mu!grave Street, Private Bag, Wellington; 130 Oxford Terrace, P.O. Box 1721,Christchurch; Princes Street, P.O. Box 1104, Dunedin; Alma Street, P O. Box 857,Hamilton.
University Bookshop Nigeria Ltd., University College, lbadan.
Johan Grundt Tanum Forlag, Karl Johansgt. 43, Oslo.
Mirza Book Agency, 65 The Mall, Lahore 3.
Agencia Internacional de Publicaciones J. Menéndez, Apartado 2052, Panama.
The Modern Book Company, 928 Rizal Avenue, Manila.
Ars Polona-Ruch, Krakowskie Przedmiescie 7, Warsaw.
Livraria Bertrand, S.A.R.L., Apartado 37, Amadora; Galeria ltau, Rua de Entrecampos 66-A,Lisbon 5.
Rompresfilatelia, P.O. Box 2001, Bucharest (periodicals only); Romlibri, Str. Biserica Amzei3-5, Bucharest (nonperiodical publications).
Khazindar Establishment, King Faysal Street, Riyadh.
Parrys Book Centre, 25 Lobby Arcade, K.L. Hilton, Iln. Treacher, Kuala Lumpur (Malaysia).
"Samater's," P.O. Box 936, Mogadishu.
Librerfa Mundi-Prensa, Castellò 37, Madrid; Librerfa Agrícola, Fernando VI 2, Madrid 4.
M.D. Gunasena and Co Ltd., 217 Norris Road, Colombo 11.
C.E. Fritze, Fredsgatan 2, 103 27 Stockholm 16.
Librairie Payot S.A., Lausanne and Geneva; Hans Raunhardt, Kirchgasse 17, Zurich 1.
Livrairie Internationale, B. P. 2456, Damascus.
Dar es Salaam Bookshop, P.O. Box 9030, Dar es Salaam.
Suksapan Panit, Mansion 9, Rajadamnern Avenue, Bangkok.
Librairie du Bon Pasteur, B.P. 1164, Lomé.
Librairie Hachette, 469 Istiklal Caddesi, Beyoglu, Istanbul.
The E.S.A. Bookshop, P.O. Box 2615, Kampala.
Her Majesty's Stationery Office, 49 High Holborn, London, W.C.1; P.O. Box 569, London,S.E.1 (trade and London area mail orders); 13a Castle Street, Edinburgh EH2 3AR;109 St. Mary Street, Cardiff CF1 1JW; 7 Linenhall Street, Belfast BT2 8AY: BrazennoseStreet, Manchester M60 8AS; 258 Broad Street, Birmingham 1; 50 Fairfax Street,Bristol BS1 3DE.
UNIPUB, 650 First Avenue, P.O. Box 433, Murray Hill Station, New York, N.Y. 10016.
Jugoslovenska Knjiga, Terazije 27/11, Belgrade; Cankarjeva Zalozba, P.O. Box 201 - IV, Ljubljana.
Requests from countries where sales agents have not yet been appointed may be sent to:Distribution and Sales Section, Food and Agriculture Organization of the United Nations,Via delle Terme di Caracalla, 00100 Rome, Italy.
PP/F3350/E/5 75/1/7000