the star (science and technology in america’s...
TRANSCRIPT

The STAR (Science and Technology in America’s
Recovery) Project And Beyond
The STAR (Science and Technology in America’s
Recovery) Project And Beyond
2
Background: Roadmap
Science of Science Policy Interagency Task Group
The SoSP Roadmap– Published in November, 2008– Four guiding themes– Ten key questions
December, 2008 Workshop– Engage the current community of
practice– Interactive evaluation of Roadmap

3
Background: Workshop Results
Finding: There currently is no data infrastructure that meets the Federal need for evidence based science policy decisions
Recommendation: Create such a data infrastructure
Action: Identification of set of investments for new administration

4
Building an Empirical Framework for Science Policy
Start with correct unit of analysis– Science is done by scientists. Need to identify universe of
individuals funded by federal agencies (PI, co-PI, RAs, graduate students etc.)
Include full description of input measures
Include full description of outcomes (economic, scientific and social)
Combine inputs and outcomes
Create appropriate metrics that capture all dimensions of science investments

5
The Basic Approach: Organizing Principles
Operational– Minimum Burden: Leverage existing information at academic
institutions and agencies; do not interfere with existing systems– Minimum Cost: Leverage existing investments in administrative
records, patent and citation data– Full confidentiality protections: Best practices
Analytical– Utilize existing investments in data: Statistics of Income,
Webscraping; Visualization– Create open and transparent approach to knowledge creation:
Collaboratory
Initial Application: ARRA Reporting
Automatically generate job creation measures– Create administrative tracking system
• Existing payroll management systems• Unemployment insurance wage records
– External validation and accountability• Credible researchers• External tagging
Evidence based full impact metrics– Short term (initial direct and indirect job creation impact)– Match to other sources

Agency
Institution
Agency Budget
Award
StateFunding
Personnel Vendor Contractor
HR SystemProcurement
SystemSubcontracting
System
EndowmentFunding
Financial System
ExistingInstitutionalReporting
Hire Buy Engage
Disbursement
Award
Record
ResearchProject
Start-Up
Papers
Patents
AcquisitionAnd Analysis
DirectBenefit
Analysis
IntellectualPropertyBenefit
Analysis
InnovationAnalysis
Institution STAR
DetailedCharacterization
andSummary
Download
State
Jobs,Purchases,Contracts
BenefitAnalysis
STARPilot
Project

Request from universities
Transaction based file – every month– Personid– Internal Award number– Date– Amount Paid– Hours– Full/time part/time– Occupational classification (sometimes on separate file)
Cross reference table
– Internal award number– Agency– Agency Award number– Grant short title– Grant type– CFDA codes
8
Current Status
Partner with FDP sites– Provide administrative records– Partner in development of metrics
Seven have been visited:– Delaware, Pennsylvania, George Mason, Texas (Austin),
Alabama (Tuscaloosa), CalTech, Massachusetts– Texas, GMU, Delaware, Caltech and UA data have been
provided and analyzed – preliminary report available
9

10
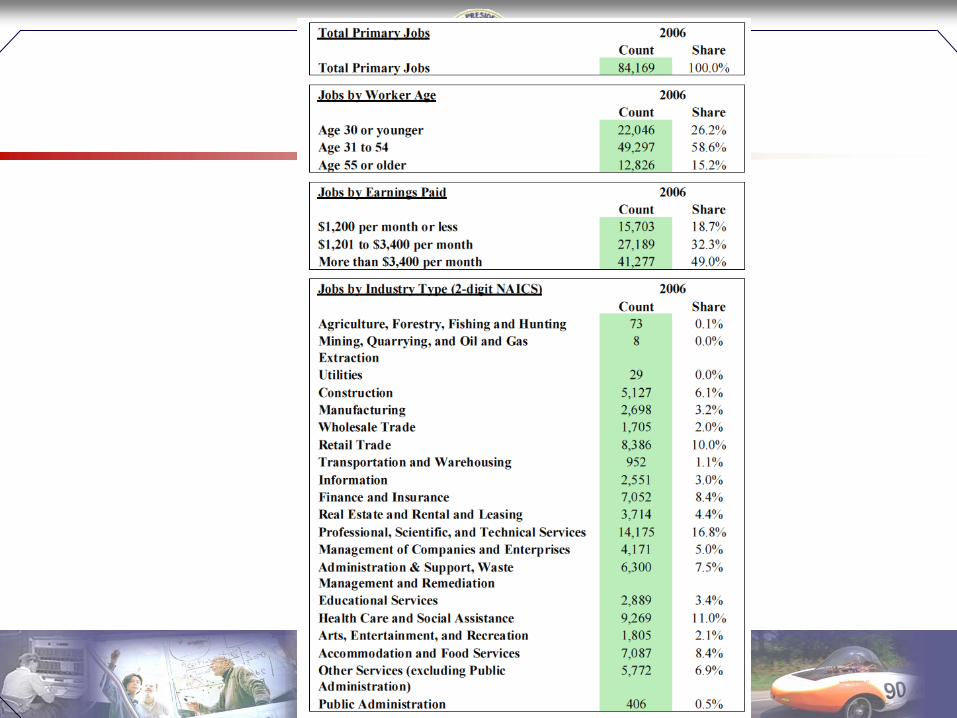
The Following Is What Our Volunteer Grant Recipient Communities Data
Has Revealed (Preliminary)

Initial results: Example of University XX
11

12

13

Results so Far
Have identified systemic and idiosyncratic data issues
Relatively clean data
Some anomalies that will need to be coded up in next stage
Response of pilot universities
Doable
Very supportive and responsive
Briefing of Ed Deseve and Frank DiGiammarino
– Enthusiastic reception– Noted that the approach is exactly in line with the ARRA Section 1512 guidance,
which calls for recipients to use payroll and finance data to do their estimates– Full agreement with pilot approach and timeline
14

Next set of requests
Mapping to standardized occupational categories– Teaching faculty, research faculty; postdocs; grad
students; undergrad students; tech support; administrative support
Universities will send employment records for the twelve months previous to the current month.
Report on indirect costs to cognizant agencies– so we can allocate overhead to labor costs
Standardization of report format
15

16
Glimpse of the future: Building on the framework
Framework: a collection of integrated databases
• Agency records transmitted on a flow basis • University records transmitted on a flow basis
Reduce Burden on PI’s and Universities– Automated webscraping and reporting of outcomes to agencies,
state legislatures and other constituencies– Systematized, standardized and validated ongoing measurement
of long term impact of science• Economic: Patents, patent applications, new businesses• Scientific Outcomes: Creation and uptake of ideas: e.g. citations,
new fields• Social outcomes: Health, welfare, environment…


Examples of Research Possibilities

Modeling Policy Outcomes: Mapping Innovation Pathways

Motivation: regional advantage• Why is Silicon Valley successful?
• What is the role of funding and ocial networks?• Large sample data source: All U.S. Patents, 1975-present
Silicon Valley’s Largest Component in 1990Boston’s Largest Component in 1990

21
Despite similarities, Boston and Valley structures diverge in 1990s
.005043
.74558
19791980
19811982
19831984
19851986
19871988
19891990
19911992
19931994
19951996
19971998
1999
Proportion of MSA Inventors in Largest Component Boston Silicon Valley
Proportion of MSA Inventors in Largest Component Boston Silicon Valley
Summary and Next Steps
Current:– Actual, administratively based, externally verifiable, measures of
job creation for six universities
Future:– Participating universities will send one full year of data,
standardized occupations, in a standardized format to STAR team to start prototype production
– Additional universities invited to participate in scaling up of job creation components
– Pilot universities invited to participate in matching exercise with citations, patents and other economic/scientific outcome metrics
– Report to OSTP and participating agencies scheduled for March 2009
22

Prior Experience
This Provides a Way
To Report Job Creation
From Already Produced
And Mandated Sources