the spatial organization of rural services: an operational model for regional development planning
TRANSCRIPT

Applied Geography (1988), 8, 65-79
The spatial organization of rural services: an operational model for regional development planning
Jacob 0. Maos
Department of Geography, University of Haifa, Mt Carmel, Haifa 31999, Israel
and Israel Prion
Settlement Study Centre, PO Box 2355, Rehovot 76120, Israel
Abstract
Various difficulties arise when attempting to apply conventional spatial theories to rural development. The problem is compounded in the case of less developed and remote regions, characterized by poverty and lack of infrastructure. This article describes a model for the spatial organization of rural services elaborated in a series of development planning projects.
Since the planning of services is usually linked to a broader development plan, the future size and distribution of population can be simulated by using the prognosis of demographic growth and employment. The correlation of occupation among the three economic sectors and the ratio of total projected population to the planned economically active population is used to predict the size and distribu- tion of population in the planning region and to determine the need and location of new rural centres.
The application of the model is exemplified by a case study of rural development planning for the Calvo-Siles region in Bolivia.
Introduction
The importance of supporting services, including the physical and institutional infra- structure needed for production and marketing, as well as social and cultural amenities, has been repeatedly point out (Johnson, 1970; Amos 1977). It is well known that rural settlements-because of their dispersion and low densities- incur considerably higher service costs per capita than urban communities. At the same time, rural services are frequently of inferior quality, a problem compounded in depressed regions by poverty and lack of transportation facilities. In many develop- ment schemes involving a traditional farming people who are emerging from the stage of subsistence, accessibility, distance, and sparsity of population, stand out as the major constraints in the building of a services structure.
This article outlines a model for the spatial organization of services in rural areas which are in an incipient state of development. The model is intended as a framework for the planning of a services system and should be regarded as part of a compre- hensive approach in which several disciplines jointly provide the diverse inputs of the planning process (Chadwick 1971; Boguslawski 1979). Since the criteria are meant to achieve a maximum spread of benefits, the region’s existing population must be fully accounted for and involved in the scheme.
Various difficulties arise when attempting to apply conventional spatial theories to
0143-6228/88/010065-15 $03.00 0 1988 Butterworth & CO (Publishers) Ltd

66 The spatial organization of rural services
the task of planning a services system in rural areas with a traditional structure of settlements. The main reason is that most central places are the result of a series of events over time, quite similar to an evolutionary process (Plattner 1975; lMaos 1984). Developmental planning is invariably opposed to such an approach, since it attempts to avoid mistakes which may delay implementation. Another fundamental difference lies in the modern conception of regional development planning which calls not only for the furthering of a region’s economy, but also aims to achieve socio- economic progress of the region’s inhabitants. Hence, social services, particularly education and health, become both prerequisites and tools for development. They also become key services around which additional public facilities may develop.
It should be noted that the proposed model is applicable especially in the case of developing regions of the so-called ‘third world’, characterized by remoteness from urban centres, isolation and lack of communications. It does not apply to the periphery of major urban areas, where the development of services is influenced by the city’s dominant force. The model resembles the Christaller-type network of central places, in form if not in substance. It follows the familiar dendritic hierarchy of services, which can be described as a pyramid of superimposed tiers, with small villages or dispersed farmsteads at the base of the pyramid; above it a second tier of rural centres; above both, a third tier of sub-regional centres, and at the top, a regional centre (Fig. 1).
The conceptual and methodological framework of the proposed model is closely linked to the Integrated Rural Development approach of Rehovot (B’eitz 1979), while the operational basis is the ‘planning region’, discussed inter alia by Johnston and Rossiter (1981).
Villages and dispersed population (level a)
Figure 1. Dendritic structure of service centres and service levels in rural areas.

Jacob 0. Maos and Israel Prion 67
Methodology
Since the planning of services, in most instances, will be part of a regional develop- ment plan, the projected estimates of demographic growth and the prognosis of employment can be used to simulate the future distribution of population at the end of a given planning period (target year). In addition, the following factors will be considered when programming the contents and deployment of service points and facilities:
1. the proposed development of the agricultural sector, which determines size and location of farmsteads and villages, as well as future labour requirements;
2. the proposed siting of agro-industrial plants and other new industries, as indicated by available natural and human resources;
3. the location of existing urban and rural centres and other regional infrastructure.
Another important factor is the additional employment generated in the service sector as a result of the development in the primary and secondary sectors and in the tertiary sector itself.
The distribution of service centres will entail, in the first place, the ‘stocktaking’ of the region’s population at various hierarchical levels. This can be done by means of recent censuses, vital statistics, and other pertinent information. The levels thus covered include villages, hamlets, and dispersed farmsteads (level a); rural centres (level b); sub-regional centres (level c); and the regional centre (level d).
The next step is to divide the planning region into functional sub-regions, each containing adequately sized population groups (approximately 35 000 persons, or more, at base year) to enable effective operation of services of an order higher than those provided at the rural centres. The identification of such functional sub-regions is possible with the help of maps, surveys, and other data, taking into account administrative boundaries, geographical features; infrastructure, projected land uses, and ecological constraints. For practical reasons it may be necessary in some cases to combine a number of different jurisdictional areas for the purpose of forming such functional sub-regions.
The spatial organization based on the defined functional sub-regions will usually include the following steps:
1. adjusting the distribution of the population economically active in agriculture to the sectoral plans prepared for each sub-region;
2. adjusting the distribution of the population economically active in manufactur- ing, in accordance with the location of plants, to the sectoral plans for each sub- region;
3. accounting for expected migratory movements produced by the economic potential of the planning region, or occasioned by national plans for distribution of population, or other predicted migratory trends.
Once the existing population figures for each sub-region are known, they can be projected to the end of the planning period (or target year), according to given growth rates and the planned development of the three economic sectors, as outlined in the sectoral plans.
The current (base year) and projected (target year) distribution of population in the planning region can be listed according to levels and categories of centres and time steps, as demonstrated in Table 1. This table is useful as a balance sheet which should tally throughout the planning process.
The total population expected to be living in the planning region at any given point

and dispersed farms
b Rural centres
a Villages, hamlets, Base year P,, pu2. pL13. * ’ ’ PO” cp,
Target year P ori Por2. PO,, * . . pm cpo,
Base year pbl pb2. pb3. . * . Pbn cpb
Target year P bll Pbr2. Pb,3. * . . Pb,n cpb,
Number of existing and projected rural centres Base year 6, 4 b,, . . . 6, Cb Target year 4, b,,, b,,, . . . 4, W
C Sub-regional centres
d Regional centre
68 The spatial organization of rural services
Table 1. Distribution of population in planning region and number of rural centres (inset)
Population
Central Total in sub-region Sub-regions planning
Level Category Time steps (1) (2, 3, . . . n) region
R Planning region Base year P RI pR2. pR3. * ’ * PRn cpR
(comprising all Target year P RDI PRD2, pRD3, . * . PRDn EpRD
levels: a,b,c,d) (demographic growth)
Target year P Rrl PRr2, PRO, . . . PRm EpR~
(planned growth) Migratory balance XI L
(+I
x2, x3, . . . X”
Base year (Included Pc2, PC,, . . . Pen Target year in level d) Pcr2, Pcr3. . . . PC,,
Base year pd -
Target year Pdr -
CP, EP,,
pd
pd,
Sources: PR, P,, Pb, b, PC. Pd: censuses, vital statistics, surveys, etc.; P,, based on plans for agricultural sector
in time can be estimated by projecting the demographic growth rates and by adjusting the population figures to the region’s employment capacity, as indicated in the sectoral plans prepared for each of the three main economic sectors.
When CP, represents the region’s population figure at base year, and r the annual growth rate, the projected population figure, based on demographic growth only, can be calculated by means of the formula:
CP,, = (1 + r)‘. CP, (1)
The projected population figures for each sub-region (based on demographic growth only) can be calculated in a similar way.
In projecting the population figures for the entire planning region (levels a, b, c, and d) at target year, in accordance with the detailed sectoral plans, it should be borne in mind that the planned economic activities will generate additional employ- ment in services. Thus, the larger the portion that earns its living from the primary and secondary sectors, the more will be employed in services. In turn, any increase in the service sector will further result in a proportional addition of people employed in the same services (Weitz et al. 1980).

Jacob 0. Maos and Israel Prion 69
The augmented population figures, taking into account the additional employment in ancillary activities, can be calculated as follows:
cp
Rt fR
(2)
where EPR, = projected population in the entire planning region at target year A = projected number of persons employed in agriculture (primary sector)
M, = projected number of persons employed in manufacturing and mining (secondary sector)
S, =projected number of persons employed in services (tertiary sector) provided at the regional level, mainly in the region’s urban centre
k=ratio of the region’s total projected population to the planned eco- nomically active population
fR = multiplier representing the correlation of employment in ‘basic’ activities with employment in ‘dependent’ activities, in the region
The definition of the fR multiplier distinguishes between secondary sector activities which are not a function of population size (denoted M,), and activities of the same sector which are dependent on population (denoted Mz). Hence, MI refers only to mining and manufacturing, which are ‘basic’ activities, determined mainly by the availability of raw materials, skilled manpower, and markets, both within and outside the region. An increase or decrease in population will not directly affect employment in this category. I%&, on the other hand, refers to ‘dependent’ activities, such as construction, transportation, crafts and utilities, whose extent depends on the size of population served (e.g. housing, energy and water supply).
Likewise, S, refers to higher-level services which are not necessarily a function of population size. Services such as a specialized hospital will usually be found in the region’s main urban centre. On the other hand, S, covers all services contingent on population size, such as education, health, and commercial services. These facilities are usually located in the sub-regional or rural centres, as well as in the Regional Centre, which has a double function, serving also as service centre for the central sub- region in which it is located (see Table 1).
Consequently, the multiplier fR can be expressed as:
fR = I-(k!,+&)'k (3)
where i&=proportion of population engaged in ‘dependent’ activities of the secondary sector, including construction, transportation, crafts and utilities
S2 = proportion of population engaged in ‘dependent’ activities of the tertiary sector, including education, health and commercial services
k =ratio of the region’s total projected population to the planned eco- nomically active population
Note that the employment indices are derived from the directives of the macro- regional plan for the three main economic sectors. The ratio of k is assumed to be constant at all levels of the hierarchy, but can be specified as k,, k,, etc., and prorated, when significant differences among areas occur within a given planning region.
The differences in population figures between demographic and planned growth in any one of the sub-regions represent the migratory balance. These differences may be

70 The spatial organization of rural services
due to internal migration from one sub-region to another, or to out-migration from the region, namely:
PRDj-PRrj(j=l,. . . ,f?)
By the same token, a difference in the regional figures will indicate migration into, or out of the planning region:
Estimating the distribution of population in the planning region starts with level ‘a’ -the basis of the hierarchical pyramid-consisting of villages and dispersed farms or hamlets. The population at this level includes mostly families employed in agri- culture and some families engaged in services in the villages. These population figures need not necessarily coincide with the total population employed in the primary sector. The reason is that part of the farming population resides in towns and will therefore receive services directly from these towns. Hence, the projected population in villages, including the dispersed rural population CP,,, can be calculated as follows:
where A = total projected number of persons employed in agriculture A;= estimated number of persons employed in agriculture, but living in rural
towns or on their outskirts k =ratio of the region’s total projected population to the planned eco-
nomically-active population v:=ratio of people engaged in farming to the total economically active
population residing in villages, including the dispersed rural population
It should be reiterated that the conceptual framework of the proposed model anticipates optimal coverage of services for the entire rural population in the planning region. Such an approach, besides the methodological aspects involved, implies a radical shift in emphasis from the urban or semi-urban centre to the inter- village centre, or as denoted in this model, the ‘rural centre’. The function of the rural centre, corresponding to level ‘b’, is to serve the people residing in small rural towns and villages or in a dispersed settlement pattern.
The size of population or number of consumers served by any rural centre will depend on the ease of access and on feasible thresholds for services and goods, such as primary schools or rural clinics. Since walking distances of 4-5 km are quite common for underdeveloped or rural conditions, this parameter can be used for defining a hypothetical area occupied by villages or dispersed farms, measuring about 5000ha (50sqkm). After deducting non-arable lands, built-up surfaces, and land used for infrastructure, such an area will eventually hold around 500 to 600 families, including some 100 families engaged in services and non-farming activities. A population of this size is normally sufficient to support a range of services which can be efficiently provided by the rural centre. It is thus possible to give a reasonable estimate of the number of people served by rural centres in a given planning area.
In certain places some of these services may already be functioning in the existing villages. In other areas they may have to be built at proper locations during the specified implementation period. The total number of rural centres required for a given sub-region at target year (btj), including both the existing and additional rural

Jacob 0. Maos and Israel Prion 71
centres to be built until then, can be determined as follows:
6, =!$j=l,. . . ,n)
SJ
where Polj = rural population living in sub-region j at target year f Psi = average number of people served by one rural centre in sub-region j
Existing rural centres can be identified by means of cartographic data and surveys. Some of these centres may require upgrading according to the services programme outlined in the sectoral plans. New rural centres, where necessary, may be added in conformity with the spatial organization scheme. Some of this planning work may have to be done iteratively, taking into account functional ranges and thresholds for specific services, as well as existing infrastructure and physical features of the terrain.
The projected population engaged in services in the rural centres of any one sub- region can be estimated by using the corresponding multiplier, as explained below. This step is similar to the method for calculating the population in the whole planning region (equations 2 and 3), and accounts for the additional demand for services generated by the families employed in the same rural centres. Hence, the number of people expected to reside in all the rural centres (Pb) of a sub-region j at target year t will be:
Pblj = 29 fb
- P,,j(j=l,. . . ,a) (8)
where Palj = total projected population residing in villages or in a dispersed pattern in sub-region j
fb = multiplier representing the correlation of employment in ‘basic’ activities with employment in ‘dependent’ activities, at the rural centre level
The value of the multiplier at the rural centre level can be expressed as before:
fb = l-(Mb+&) ’ k (9)
where Mb = proportion of population employed in the secondary sector at the rural centre level
S, = proportion of population employed in public and personal services at the rural centre level
The proportions Mb and sb can be compiled from existing situations in the sub- regions or from other rural areas with comparable conditions.
The projected population in any given sub-region, PRlj$ but excepting the central sub-region containing the regional centre, can be estimated on the basis of data provided by the sectoral plans, considering in this case, as before, the additional population expected to find employment in ancillary services. Thus:
pRlj = fR
(10)
where ARj = projected number of persons employed in agriculture in sub-region j h’f,Rj = projected number of persons employed in secondary activities in sub-
region j, including manufacturing and mining, but excluding construc- tion, transportation, utilities, workshops, etc.

72 The spatial organization of rural services
P mR/ = increment of population in sub-region j, resulting from national or regional policies (e.g. population distribution, security, frontier zone settlement), or as a result of other predicted movements
k=ration of the region’s total projected population to the planned economically active population
fR= IIIUhipkr representing the correlation Of employment in ‘basic’ activities with employment in ‘dependent’ activities, in the region
The expression (ARj + MtRi) represents the population engaged in ‘basic’ activities, namely agriculture, manufacturing and mining, which may produce a further increase in population employed in services. Equation 10 differs from the estimate of population for the whole region (equation 2), in that it lacks the factor St, repre- senting the number of employees in regional services. On the other hand, equation 10 includes the factor PmRj, which accounts for eventual changes due to in- or out- migration, directed or spontaneous, from one sub-region to another.
Even in sub-regions where no increase in the ‘basic’ population is foreseen, the value of PmRj may be positive. It is understood, however, that any addition of population will require provision in the sectoral plans for a corresponding increase in employment.
Once the total projected population figures for any one sub-region have been established, it is possible to calculate the size of population expected to reside in the specific sub-regional centre of that sub-region:
pclj = pR!j - (PaI f cpbtj ) (j=l,. . . ,n) (11)
where Pc,j = projected population residing in sub-regional centrej PR,j = projected population (planned growth) in sub-region j P,~j = rural population expected to be living in sub-region j
cPb,j = projected population residing in all rural centres of sub-region j
Similarly, the projected population about to reside in the regional centre (Pdr), can be found by subtraction:
pdl = cpR, - c(p,, + Pbr + pa) (12)
where EPR, = projected population (planned growth) in the whole planning region CP,, = projected rural population in villages, hamlets and dispersed cP& = projected population in all rural centres CP,, = projected population in all sub-regional centres
The above completes the bulk of quantitative data required for the spatial organization of the services sector, covering particularly the size and distribution of the served population. This data must be reconciled with information provided by the plans for the two other economic sectors. The resulting figures can then be transferred to the hierarchical scheme (Fig. 2), thus summarizing the numerical distribution of the region’s population, as shown in Table 1.
The detailed planning of the diverse services, including the number of employees in each category, areas of construction, and related infrastructure, will be subject to existing standards and to constraints, such as feasible thresholds of demand, economies of scale, and to facilities that are already available in the region.
Final adaptation of the model to specific field conditions, including location, siting and layout, is part of the physical planning process and implementation (Economic and Social Commission 1979; Maos 1984).

Jacob 0. Maos and Israel Prion 73
Regional centre (level d)
1
f 1
Sub-regional centres (level c) 1 I I I 1 I I
Villages, hamlets, i, A A i A
l mmm.m l mmmm8 .*sm.* mm.*mm m*m.mm and dispersed m8mm.. l m88.. .msm.m . . . . . . l mmm.m
farms mm.... .mmm.. . . . ..m ..m**m l m.a.m
(level a)
cl Existing
r-i Planned L-f
Figure 2. Hierarchical scheme of rural services (for adaptation to specific planning region).
Case studies
The empirical application of the described model to real-world situations was illus- trated in a number of recent development planning projects. Thus, for example, in a project for the Zomba-~achinga region in Malawi (Pelley et af. 1983), the multiplying factor, as described above, was used for estimating the future economically active and total population in the planning area. Likewise, the spatial organization of service centres was based on several components of the model.
The use of the methodology, as outlined in this paper, is exemplified in another recent rural development project of a depressed region in Bolivia (Prion et al. 1984, 1985). The project’s main objectives were to elaborate an integrated plan designed to raise the relative standard of living of the region’s population and to stem rural out- migration, by reducing inequity between the diverse economic sectors, by creating new sources of employment, by diversifying employment, and by promoting invest- ment in the process of regional development.
The selected area, or ‘planning region’, comprised the provinces of Luis Calve and Hernando Siles, both in the Department of Chuquisaca, in Bolivia (Fig. 3), covering an area of 51524sq km. The province of Luis Calve occupies an area of 13 300sq km, bordering on the east with Paraguay, and contains an estimated population of 18950. The province of Hernando Siles covers an area of 5473 sq km, with 37280 inhabitants. The entire planning region thus makes up 36.4 per cent of the Depart- ment’s total territory.
The physiography of the region reveals two main ecological zones: the sub-Andean zone, and the Chaco zone, also known as the Chuquisaca section of the Great Bohvian Chaco.

74 The spatial organization of rural services
“a, SANTA CR1
I.-...._*
?
JZ
CHILE c. POTOSI j ,.r;y;
i,-d- AR&INA
‘?. l
\ 0 100 200 300 400 500
i I 1 km.
\
Figure 3. Location of the Department of Chuquisaca, Bolivia, and the Calvo-Siles planning region.
The human settlement in the Calvo-Siles region has adapted to the particular features of each ecological zone. In the sub-Andean zone several functional areas could be identified, based on factors such as accessibility, jurisdictional Iimits, communications, etc. {Fig. 4). The dominant factor is topography, especially the series of parallel mountain ridges and valleys running from north to south. These natural barriers clearly define four sub-regions (marked I, III, IV and V), each with a rural town functioning as sub-regional centre.
The more important urban centre and potential growth pole in the planning region is Monteagudo. Two ‘non-polarized’ sub-regions (A and B) are situated in more

Jacob 0. Maos and Israel Prion 75
,-._._ ! !
‘._.I i’ ! i 1
-I Subregion Limits
.-.- Department Limits
-- -- Province Limits
0 Regional Centre
. Sub-regional Centre
. Rural Centre
++--+ International Boundary
MUYUPAMPA
Figure 4. Delimitation of sub-regions and location of sub-regional centres in the Calvo-Siles region, Bolivia.
difficult terrain, with poor accessibility, sparsely settled, and without a central town or service centre. Sub-region II includes mainly the Chaco zone, with Machareti as its service centre. The existing settlements which are to be incorporated in the hier- archical scheme of service centres are enumerated in Table 2.
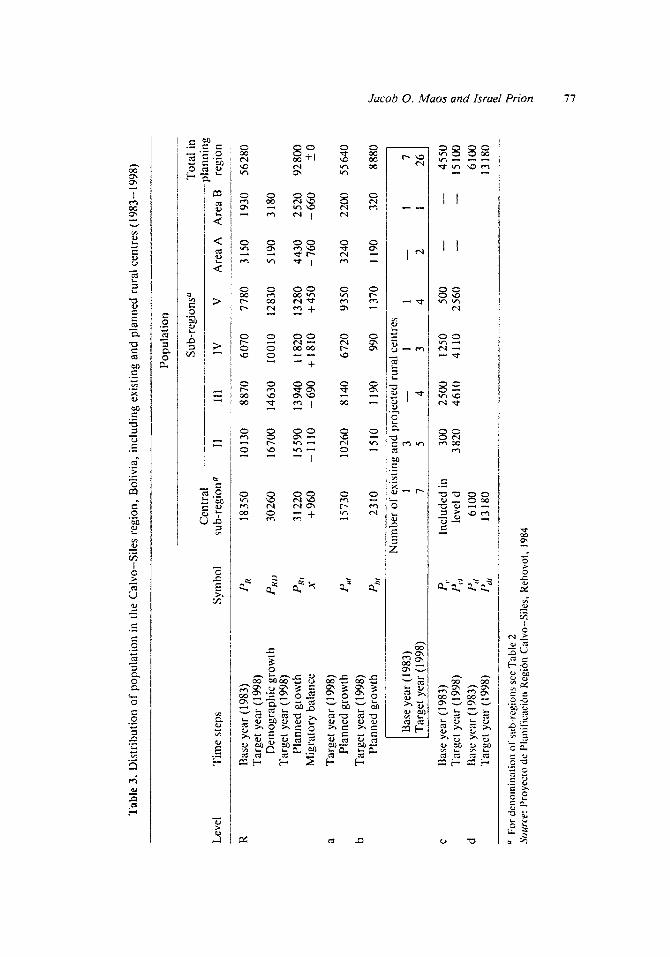
The projected population in each sub-regional centre and its rural periphery for the target year 1998 was calculated according to the methodology outlined above, taking into account the number of persons to be employed in the primary and secondary sectors, as well as the demographic growth and other increments produced by predicted trends and projects. Finally, the multiplying factor was applied in order to calculate the projected population in each sub-region, including the additional population employed in ancillary activities. The resulting distribution of population in the planning region was then summarized, as shown in Table 3. The information thus compiled is analogous to Table 1 described in the methodological section of this article.
The planning of public services, such as education and health, was based both on desirability and feasibility. In education, for example, the economic planners calculated the average operation cost of services for a typical rural family, starting with elementary school, intermediate level, up to secondary school and vocational

76 The spatial organization of rural services
Table 2. Spatial organization of the Calve-Siles region according to sub-regions (1983-1998). including existing settlements
Sub-region Political jurisdiction (canton)
Existing settlements Existing settlements planned to function as planned to function sub-regional centres as rural centres
I Pedernal Villa Monteagudo Pedernal Sauces Canduaa
II Machareti Villa Machareti Iguembe Huacaya Huacaya Carandayti Boycobo Nancorainza Iv0 Iguembe IV0 Carandayti Bororigua Santa Rosa Camatindi Tiguipa
III Ticucha ViiIa Muyupampa Sapirangui
IV Huacareta ViIIa Huacareta Nacamiri Nacamiri
V San Juan de Piray San Juan de Piray Animbo Area ‘A’ Fernandez Area ‘B’ Rosario del Ingre Rosario de1 ingre
g The amalgamation of both centres is suggested in order to form the sub-regional urban centre Source: Proyecto de Planificacik Regicin Calve-Siles, Rehovot, 1984
training. The national accounts were consulted to assess the government’s share in the expenditure for education and health (usually reflected as a percentage of the GNP). Since the serviced population would have to bear the remaining expense, comparable ‘consumption baskets’ taken from regions with similar income levels were checked, in order to ascertain the plan’s feasibility. Plans which turned out to be too ambitious were reconsidered and trimmed (e.g. by reducing the number of pupils in secondary and vocational schools). Feasibility studies for other public services were prepared in a similar manner.
The final step was to build the hierarchical scheme (Fig. 5), which is analogous to Fig. 2 described in the methodologicaf section above. It shows the existing and planned services at a11 Ievels, as we11 as the projected number of inhabitants expected to reside at each level and to be served by the corresponding service centres. The exact location of centres and the physical planning of infrastructure and other facilities was then performed with the help of aerial surveys and cartographic data, in conformity with the directives provided by the detailed deveiopment plans.
Conclusion
While conventional approaches to the planning of services look at the number of residents in existing urban settlements in order to determine the minimum thresholds
Tab
le
3. D
istr
ibut
ion
of p
opul
atio
n in
the
Cal
ve-S
iles
regi
on,
Bol
ivia
, in
clud
ing
exis
ting
and
plan
ned
rura
l ce
ntre
s (1
983-
1998
)
Popu
latio
n
Lev
el
Tim
e st
eps
Sym
bol
Cen
tral
su
b-re
gion
a 11
ill
Sub-
regi
ons0
T
otal
in
--
----
plan
ning
IV
V
A
rea
A
Are
a B
re
gion
Bas
e (1
983)
ye
ar
Tar
get
year
(19
98)
Dem
ogra
phic
gr
owth
T
arge
t ye
ar (
1998
) Pl
anne
d gr
owth
M
igra
tory
ba
lanc
e
Tar
get
year
(19
98)
Plan
ned
grow
th
Tar
get
year
(19
98)
Plan
ned
grow
th
Bas
e (1
983)
ye
ar
Tar
get
year
(19
98)
Bas
e ye
ar (
I 983
) T
arge
t ye
ar (
1998
) B
ase
year
(I 9
83)
Tar
get
year
(I 9
98)
PK
1835
0 10
130
8870
60
70
7780
31
50
1930
56
280
P R
I>
3026
0 16
700
1463
0 10
010
1283
0 51
90
3180
PI0
3122
0 15
590
1394
0 11
820
1328
0 44
30
2520
92
800
X
+ 96
0 -1
110
-690
+i
810
+ 45
0 -7
60
-660
+
0
P,l
1573
0 10
260
8140
67
20
9350
3
240
2200
55
640
pl,,
2310
15
10
1190
99
0 13
70
1190
32
0 88
80
Num
ber
of e
xist
ing
and
proj
ecte
d ru
ral
cent
rcs
1 3
- 1
I -
1 7
7 5
4 3
4 2
I 26
P,
Incl
uded
in
30
0 25
00
1250
SO
0 -
- 45
50
c,
leve
l d
3820
46
10
4110
25
60
- -
l5lO
O
E:,
6100
61
00
I ill
13
180
13
180
’ Fo
r den
omin
atio
n of
su
b-re
gion
s se
e T
able
2
Sort
rce:
P
roye
eto
de P
lani
l‘ica
cib~
~
Keg
ibn
Cal
ve-S
iles.
K
ehov
ot,
1984

78 The spatial organization of rural services
Sub-regional centres (level c)
Rural centres
cl 1
(level b)
Population in villages, .1
Regionai 1
I Machareti
&I Muyupampa Huacareta
San Juan Area ‘A’
I de Piray
hamlets, and ’ ’ ’ ’ ’ ’ ’ ’ ’ ’ ’ 2200 ’ dispersed
15 730 10260 8140 6720 9350 3240
farms (Iwe! at q Existing
f-l 1 1 Planned L_l
Figure 5. Hierarchical scheme of service centres adapted to the Calve-Siles region, Bolivia.
for various service functions, which eventually may, or may not, benefit the rural periphery (Rondinelli and Evans 1983), the described model is orientated toward the socioeconomic potential of the population residing both in urban and rural areas. The improvement of the service system is aimed primarily at the level of the rural centre, which is often the weakest link in the structure. A subsequent step is the strengthening of the sub-regional centres as well as the dominant regional centre. These are to provide higher-order services which usually entail larger numbers of consumers and higher thresholds of demand (Prion et al. 1982).
The model outlined here is to be understood as an integral component of a broader regional development plan. It obtains particularly in the case of less developed and remote rural areas, beyond the sphere of influence of major urban centres. The salient point is the provision of basic services and the building of a spatial system through which the benefits of development can spread out to the rural population.
The programming of services is not hypothetical, since it is linked to realistic sectoral development plans. Even though local conditions or prevalent circumstances may require specific adjustments, the model provides a practical framework for the spatiai organization of services at all levels.
The ultimate purpose of the model is to guide the structuring of services in a development area which is predominantly rural, and to ensure optimal coverage of services for the overall population in the planning region. A concomitant purpose is to facilitate the systematization of the planning process, with a view to enabling the rapid assimilation of data in preparation for the final stages of physical planning.
Acknowledgements
The authors are grateful for the comments of the anonymous referee on an earlier draft of this paper.

Jacob 0. Maos and Israel Prion 79
References
Boguslawsky, Michael von (compil.) (1979) Principles and limitations for integrated rural development: a workshop report. Giessen: Zentrum fur regionale Entwicklungsforschung der Justus-Liebig Universitat.
Chadwick, George (1971) A system view of planning: towards a theory of the urban and regional planning process. Oxford: Pergamon Press.
Economic and Social Commission for Asia and the Pacific (1979) Guidelinesfor rural centre planning. New York: United Nations.
Johnson, E. A. J. (1970) The organization of space in developing countries. Cambridge, Mass.: Harvard University Press.
Johnston, R. J. and Rossiter, D. J. (1981) An approach to the delineation of planning regions. Applied Geography 1, 55-69.
Maos, J. 0. (1977) The spatial organization of services in new land settlement: experiences and trends. GeoJournat I (4), 29-35.
Maos, J. 0. (1984) The physical planning component in integrated rural development. Third World Planning Review 6 (2), 157-170.
Plattner, Stuart (1975) Rural market networks. Scientific American 232 (May), 66-78. Pelley, D. et al. (1983) Planning project for the Zomba-Machinga Region, Malawi. Rehovot:
Settlement Study Centre. Priori, I. et al. (1982) Proyecto de planificacion Region Pacosan (Pacasmayo-Contumaza-
San Miguel) Perk Rehovot: Settlement Study Centre. Prion, I. et al. (1984) Proyecto de planificacidn de1 desarrollo rural integrado de la Region
Calvo-Siles, Bolivia. Rehovot: Settlement Study Centre. Prion, I. et al. (1985) Rural-urban dynamics in developing rural regions. In Proceedings of
the First SARSAISSC Seminar, 18-22 April 1984, Clark University/Institute for Development Anthropology, Cooperative Agreement on Human Settlements and Natural Resource Systems Analysis (USAID).
Rondinelli, D. A. and Evans, H. (1983) Integrated regional development planning: linking urban centres and rural areas in Bolivia. World Development I1 (l), 31-53.
Weitz, R. (1979) Integrated rural development: the Rehovot approach. Rehovot: Settlement Study Centre.
Weitz, R., Pelley, D. and Applebaum, L. (1980) A model for the planning of new settlement projects. World Development 8. 705-723.
(Revised manuscript received 27 March 1987)