the spacing index by mark brandon feezell
TRANSCRIPT

THE SPACING INDEX
by
MARK BRANDON FEEZELL
Bachelor of Music, 1997 Texas Christian University
Fort Worth, Texas
Submitted to the Faculty Graduate Division
College of Fine Arts and Communication Texas Christian University In partial fulfillment of the
Requirements for the degree of
MASTER OF MUSIC
May, 1999

ii
THE SPACING INDEX
Thesis approved:
Major Professor
Graduate Studies Representative
For the College of Fine Arts and Communication

Copyright © 1999 By Mark Brandon Feezell. All rights reserved.

iv
ACKNOWLEDGEMENTS
The author wishes to gratefully acknowledge the assistance and patient
supervision of Blaise Ferrandino and the contributions of the other committee members,
Judith Solomon and Gerald Gabel. Each of these three persons has had a significant part
in the author’s early development as a musician and scholar.

v
CONTENTS
Page ACKNOWLEDGEMENTS .......................................................................................... iv TABLE OF FIGURES .................................................................................................. vi Chapter I. THE SPACING INDEX......................................................................... 1 II. METHODS AND MATERIALS........................................................... 8 III. INITIAL APPLICATION.................................................................... 18 IV. TWO EXPANDED APPLICATIONS................................................. 27 V. CONCLUSIONS AND SUGGESTIONS
FOR FUTURE RESEARCH.................................................... 35
APPENDICES
A. HERTZ FREQUENCIES FOR EQUAL TEMPERAMENT............... 38
B. CLARIFICATION OF AMBIGUITIES IN SPACING ANALYSIS SUB-CHARTS .................................. 40 C. SPACING ANALYSES FOR THIRTY-EIGHT CHORALES OF J.S. BACH.................................................... 43
SELECTIVE, ANNOTATED BIBLIOGRAPHY OF RELEVANT LITERATURE . 83

vi
TABLE OF FIGURES
Figure Page 1. Calculation of Average Distance Between Adjacent Notes in the Sonority [C4, D4, G4]............................................ 3 2. Failure of Inner Voice Placement to Affect Average Distance Between Adjacent Notes ............................................................ 3 3. Affects of Parameters on Perceived Spacing of Sonorities.................... 5 4. The Geometric Mean.............................................................................. 5 5. The Spacing Index.................................................................................. 6 6. Simplification of the Spacing Index for Calculations Done by Hand.... 6 7. Sample Spacing Index Calculation for the Three-note Sonority F1 = 262, F2 = 330, F3 = 392 ..................... 6 8. Sample Analysis of a Phrase Exhibiting a Peak Shape.......................... 9 9. Typical Peak-shaped Phrase................................................................. 11 10. Spacing Analysis of Riemenschneider 110.......................................... 14 11. Three Types of Global Spacing Progression in Bach Chorales ........... 19 12. Spacing Analysis of Riemenschneider 1 .............................................. 21 13. Spacing Analysis of Riemenschneider 290.......................................... 23 14. Spacing Analysis of Riemenschneider 210.......................................... 25 15. Categorization of Thirty-eight Bach Chorales by Spacing Progression Type................................................... 26

vii
16. Spacing Analysis of Riemenschneider 300.......................................... 28 17. Spacing Analysis of J.S. Bach, The Well-tempered Clavier, Prelude One ................................ 32 18. Summary of Heinrich Schenker’s Graphical Analysis of Prelude One from Bach’s The Well-tempered Clavier........ 34 19. Formula for Hertz Frequencies of A’s ................................................. 38 20. General Formula for Hertz Calculations .............................................. 39 21. Table of Hertz Values .......................................................................... 39 22. Calculation of the Number of Voices for the Spacing Index Formula. 42 23. Summary of Characteristics for Thirty-eight Chorales of J.S. Bach.... 43 24. Spacing Progression Shapes for Thirty-eight Chorales of J.S. Bach ... 44 25. Effects of Changes in Various Parameters on Harrington's Density Systems and the Spacing Index.............. 85

1
Chapter I
THE SPACING INDEX
While theorists recognize variations based on chord spacing,1 they are ill-
equipped to discuss them precisely. The theorist might apply a general label, using terms
such as ‘closed position’ or ‘open position,’ but the limitations of these terms preclude
probing analysis of chord spacing as a progressive element. However, most composers
have been very conscious of chord spacing. During the late Baroque, composers became
increasingly interested in specifying precisely the octave(s) in which particular pitch
classes should sound. This interest eventually led to the abandonment of figured bass,
which provided only limited control of chord spacing.
Given the great care many composers have taken with this aspect of music, it is
reasonable to propose that vertical spacing functions progressively in some, if not most,
music of the past 250 years. Evaluating this hypothesis requires a method of
measurement whereby the spacing of chords can be compared with objectivity and
precision. The binary concept of designating a chord as either ‘open position’ or ‘closed
position’ must be replaced with a numeric index having a wide range of possible values.
1. Chord spacing here includes both the “position” of a sonority, i.e. open or closed
position, and the particular doublings of a sonority. It is directly related to how far apart the pitches of a sonority are from one another when plotted as frequencies.

2
Probably the most significant studies in this area2 are those by Wallace Berry3 and
Michael Harrington.4 Berry measured vertical density as the number of notes divided by
the span of the sonority in half-steps.5 His method is fairly easy to calculate, but it is
unaffected by the positioning of the inner voices. Harrington proposed three methods of
spacing analysis. In the first method, each lower frequency is divided by every higher
one in turn. These n ratios are then averaged and the reciprocal of the result is taken.
Since this analysis is based on ratios, chords with the same consecutive intervals will
register the same spacing in all octaves. The second method simply adds the number of
notes in the sonority to the result of the first method. The third method takes the log of
the sum of the frequencies and adds the number of notes. Although each of Harrington’s
three methods represents a step forward, none of them responds consistently to changes
in all relevant musical parameters.
The present thesis proposes a new measurement, the spacing index, which
indicates the relative vertical proximity of the notes of a sonority. In general, lower
spacing index measurements indicate sonorities whose notes are closer together, and
higher spacing index measurements indicate sonorities whose notes are farther apart. A
chord in ‘closed’ position will generally have a lower spacing index value than one in
2. An annotated bibliography of relevant literature occurs after Appendix C. 3. Wallace Berry, Structural Functions in Music (New York: Dover Publications, Inc.,
1987), 184-210. 4. E. Michael Harrington, “Density in Musical Context,” Indiana Theory Review III/2
(Winter 1980), 12-25. 5. In this paper, span refers to the distance from the lowest pitch to the highest pitch,
measured in either half-steps or hertz.

3
‘open’ position, but the spacing index also distinguishes gradations of spacing within
each of the two general categories.
To ensure objectivity and precision, the spacing index examines a sonority as a set
of frequencies. The simplest possible method for measuring sonority spacing is to
average the distances between adjacent frequencies in the sonority. Unfortunately, this
calculation fails to account for the placement of inner voices. For instance, the sonority
[C4, D4, G4]6 in hertz is [262, 294, 392].7 The average of the distances between adjacent
notes is shown in figure one.
Figure 1. Calculation of Average Distance Between
Adjacent Notes in the Sonority [C4, D4, G4].
652
9832
2
)294392()262294(G4] D4, [C4, DistanceAverage =+=−+−=
Moving the inner voice fails to affect the average distance measurement. The sonorities
[C4, E4, G4] and [C4, F4, G4] share the same average distance.
Figure 2. Failure of Inner Voice Placement to Affect
Average Distance Between Adjacent Notes.
652
6268
2
)330392()262330(G4] E4, [C4, DistanceAverage =+=−+−=
652
4387
2
)349392()262349(G4] F4, [C4, DistanceAverage =+=−+−=
6. The present thesis follows the convention of designating middle C as C4. Each C
begins a new octave, the octave below middle C being C3, and the octave above middle C being C5.
7. Equal temperament is assumed as a norm, although other tuning systems could be

4
In fact, it can be shown that changing the placement of middle voices fails to affect the
average distance for any sonority.8
The successful spacing index formula must account equally for the placement of
all voices. To reflect a realistic experience of music, it must take several other factors
into account as well. First, for two-frequency sonorities, it should increase as the hertz
difference between the two notes in the sonority increases. Second, it should increase as
the outer notes of any sonority move farther apart. Third, it should decrease as a sonority
gains inner voices. Fourth, it should increase when an interval is moved into a higher
range. A final, related condition is that the spacing index should increase when adjacent
intervals are reordered to place smaller intervals in higher positions. For instance, a
major chord is slightly less dense than the corresponding minor chord since the major
chord places the smaller interval (the minor third) on top. Figure three illustrates the five
behaviors.
substituted if desired. See also Appendix A.
8. For example, for any three voice sonority with frequencies F1, F2, and F3, where the frequencies are unique and listed in increasing order and x represents a “varying factor” for the inner voice,
2
)()(
2
))(())((Dist.Avg.
xxFFFFxFFFxF 23122312 −+−+−=+−+−+=
Since the formula includes, “+ x – x,” x fails to affect the average distance.

5
Figure 3. Affects of Parameters on Perceived Spacing of Sonorities.9
1. Increases with hertz difference:
& wwww
w
w
w
w
w
w
2. Increases as outer notes move apart:
&
wwww
wwww
w
ww
w
w
ww
w
w
ww
w
3. Decreases with the number of voices:
&
w
w
w
w
w
w
www
wwwwww
wwwwwwww
4. Increases with range:
?
ww
ww&
ww
ww
ww
5. Increases as small intervals move higher: &
w
w
w
w
ww
b w
w
w
ww
w
b w
w
ww
w
w
b
b
w
ww
w
w
w
b
b
b
ww
w
w
w
w
b
b
b
b
Mathematicians have a particular type of average, the geometric mean, which
proves useful for measurements of vertical sonority spacing. The geometric mean is
defined in figure four.
Figure 4. The Geometric Mean.
n
n21n21 XXXXXX *...**),...,(MeanGeometric =
The geometric mean is the nth root of the product of n numbers.10 The spacing index
presented in this paper is the geometric mean of the differences between adjacent
frequencies. Figure five states the spacing index using mathematic notation.
9. For similar charts in previous literature, see Harrington, op. cit., and Orlando
Legname, “Density Degree of Intervals and Chords,” Twentieth-Century Music IV/10 (October 1997), 8-14.
10. Two reminders from mathematics: A. In math, the ellipsis (…) signifies that the pattern continues until it reaches the
condition on the right of the ellipsis.

6
Figure 5. The Spacing Index. The sonority must be listed as
n distinct frequencies F1, F2, F3,…Fn in increasing order.
)1(12312 )(*...*)(*)(IndexSpacingThe −
−−−−= nnn FFFFFFS
Since zzz yxyx ** = , the (n-1)th root can be distributed to each term of the product,
easing calculations done by hand.
Figure 6. Simplification of the Spacing Index for Calculations Done by Hand.
)1(
1)1(
23)1(
12 )(*...*)(*)(IndexSpacingThe −−
−− −−−= nnn
nn FFFFFFS
Once again, the spacing index is the geometric mean of the differences between adjacent
frequencies.
Figure seven illustrates the calculations required to find the spacing index for the
sonority [C4, E4, G4], which consists of the frequencies [262, 330, 392].
Figure 7. Sample Spacing Index Calculation for the Three-note Sonority F1 = 262, F2 = 330, F3 = 392.
12.6562*68
)330392(*)262330(
)(*)()(*)(
)(*...*)(*)(IndexSpacingThe
22
)2()2(
)2(23
)2(12
)13(23
)13(12
)1(1
)1(23
)1(12
==
−−=
−−=−−=
−−−=−−
−−
−−
FFFFFFFF
FFFFFFS nnn
nn
Therefore, the spacing index for [C4, E4, G4] = 65.12.
B. The symbol usually means “square root” (that is, 2 ), but it can in fact be
any root. For instance, 3 = cube root. The relationship is as follows: if yxn = ,
xy n = . Hence 3814 = , since 813*3*3*334 == , and 2325 = , since
322*2*2*2*225 == .

7
If we apply the spacing index to two additional sonorities, [C4, D4, G4] and [C4, F4,
G4], we get values of approximately 56.13 and 61.2, respectively. Hence the spacing
index shows [C4, D4, G4] to be the least widely spaced (spacing index = 56.13), while
[C4, E4, G4] is the most widely spaced of the three sonorities (spacing index = 65.12).
Notice that the spacing index registered the sonority [C4, F4, G4] as being wider
spaced than [C4, D4, G4], a fulfillment of the requirement that the spacing measurement
should increase as smaller intervals (in this case, the whole step) are placed higher in a
given sonority. In fact, it can be shown that the spacing index proposed above fulfills all
the required behaviors listed in figure three and corresponds well to the counterpoint of
voices in actual music. Furthermore, the primary drawback of the formula, calculation
time, can be ameliorated greatly through the use of appropriately-designed computer
spreadsheets.

8
Chapter II
METHODS AND MATERIALS
For initial analyses using the spacing index, thirty-eight chorales by J.S. Bach
were selected from the Riemenschneider edition.11 To obtain an unbiased sample, every
tenth chorale throughout the collection was examined using a Microsoft® Excel 97©12
spreadsheet. The only exceptions were the first chorale and chorale 271, which was
selected over 270 because 270 includes a significant obbligato part atypical for the
chorales.
The Bach chorales provide an excellent laboratory for examining spacing
progression because the textural density remains fairly constant (generally four voices)
and the motions of the individual voices are tightly controlled. Even in cases where Bach
utilized a pre-existing chorale melody he consciously positioned the other three voices in
relation to the given soprano. In addition, the familiarity and relative simplicity of the
idiom permit focused discussions of spacing issues.
11. All chorale excerpts taken from Albert Riemenschneider, ed., 371 Harmonized
Chorales and 69 Chorale Melodies with Figured Bass by Johann Sebastian Bach (New York: G. Schirmer, Inc., 1941). For a useful table correlating Riemenschneider designations with other common listings (BWV, etc.), see Malcolm Boyd, Harmonizing ‘Bach’ Chorales (London: Barrie and Jenkins Ltd., 1977), 38-40.
12. Microsoft® is a registered trademark of Microsoft Corporation. Excel 97 copyright © 1985-97 by Microsoft Corporation.

9
Figure eight is a chart analysis of the fourth phrase of R1 (i.e., the first
Riemenschneider chorale) created using the author’s computer spreadsheet. The chart
analysis actually consists of three sub-charts. The top chart plots the spacing index as it
progresses from eighth note to eighth note throughout the phrase, along with a gray trend
Figure 8. Sample Analysis of a Phrase Exhibiting a Peak Shape.
Bach, Aus meines Herzens Grunde (R1), Fourth PhraseOverall Shape: Early peak (level) 33.3% into the piece.
The point of maximum distance from the overall shape line occurs 30.8% into the piece.
1. EP(L) ; IAC in C
0
50
100
150
200
1 3 5 7 9 11
Beat Number
Spac
ing
Inde
xQ
uart
ile
Aw
ay
0
200
400
600
800
1 3 5 7 9 11
Voi
ces
(Her
tz)
&
?
#
#
4
3
4
3
œœ
œ
œ
˙ œ
œ œœ œ
œœ
œ
œ œ œ
˙ œœ.œ
J
œ
˙ œ
.œ
J
œ œ
.˙˙ œn
.˙
œ œœœ
˙˙
U
˙
˙
u

10
line following the overall shape of the phrase. The center graph charts whether the
spacing index is in the first, second, third, or fourth quartile above or below the trend line.
The first quartile above is 0-24% of the maximum distance the spacing index moves
above the trend line for the current spacing chart, the second quartile is 25-49% of the
maximum distance from the trend line, the third quartile is 50-74%, and the fourth
quartile is 75-100%. Similarly, the first quartile below is 0-24% of the maximum
distance the spacing index moves below the trend line for the current spacing chart, and
so on. The bottom graph charts the highest, second highest, second lowest, and lowest
notes in the sonority as frequencies. Generally, these correspond to the four voices of the
chorale texture.
Notice that the spacing index graph exhibits a well-defined overall shape. The
spacing becomes progressively wider until beat five of the phrase, then gradually declines
to return to approximately the same level at which it began. At the top of the chart this
motion is classified via three characteristics: timing, overall change, and shape. In this
case, the timing is early, the overall change is level, and the shape is a peak.
The timing of the phrase describes how soon in the course of the phrase the
extreme point occurs. If the extreme point occurs in the first 40% of the phrase, it is
considered early. If it occurs between 41 and 59% of the way through the phrase, it is
symmetric. Finally, if the extreme point occurs in the last 40% of the phrase, it is
considered late. Timing is undefined for linear phrases since they contain no significant
interior extremes.

11
The overall change of the phrase is determined by examining the endpoints of the
spacing index graph. If the graph of the phrase ends significantly higher than it began, it
is increasing. If it ends significantly lower than it began, it is decreasing. If there is no
significant change, it is level. For purposes of this analysis, a change is considered
significant if it is more than 10% of the spacing index at the beginning of the phrase.
Since the present phrase increases by less than ten percent of the initial spacing index
value, it ends roughly the same as it began and is classified as level.
Spacing index progressions are classified into one of three possible shapes: peaks,
valleys, or lines. Figure nine labels significant aspects of a typical peak. Every peak
fulfills three conditions. First, the highest value minus the value of the greater endpoint
Figure 9. Typical Peak-shaped Phrase. The graph shows
spacing index values plotted against musical time.
Highest value minus
Greater endpoint
Highest Value
greater endpoint
minus lesser endpoint
Trend Line
Actual spacing index values
Lowest Value
Line connecting initial and final values
is greater than the positive difference between the endpoint values, ensuring that the
motion to the peak is more significant than the motion from the first value to the last
value. Second, the value of the greater endpoint is less than 90% of the highest value,

12
ensuring that the motion to the peak represents a significant departure from the ambient
spacing level of the endpoint closest to it. Third, the distance from the highest point to
the line connecting the initial and final values is greater than the distance from the lowest
point to the same line; if the low point is farther away than the high point, the shape is
probably a valley and not a peak. A valley fulfills the three conditions in reverse: 1) the
value of the lesser endpoint minus the lowest value is greater than the positive difference
between the endpoint values, 2) the value of the lesser endpoint is more than 110% of the
lowest value, and 3) the distance from the lowest point to the line connecting the initial
and final values is greater than the distance from the highest point to the same line. If the
phrase has no high or low point that fulfills the required conditions, it fits the general
shape of a line.
It is important to realize that the classifications above are intended only as
guideposts to spacing progression. The percentages listed above, for instance, represent
suggestions intended to encourage consistency. Furthermore, the present phrase was
chosen due to its simplicity and obvious shape. Many phrases correspond less closely to
the three basic shapes. However, classifying each phrase as one of the three basic shapes
highlights the underlying goal of the phrase’s spacing progression. Every phrase will
either move toward an extreme high or low point and return (similar to peaks and
valleys), or it will move from one spacing level to another without reaching a significant
interior extreme (similar to a line). Each phrase achieves its goals on its own terms, but
in a general sense only three types of spacing progression are possible.

13
The concepts of phrase classification serve as building blocks for larger analyses.
For example, figure ten is a chart analysis of Riemenschneider chorale number 110
(R110), “Vater unser im Himmelreich;” the music is provided beneath. The analysis is
similar in format to that of the single phrase cited above, except that the time scale has
been compressed horizontally to fit the entire chorale onto one page. Each lightly shaded
bar represents a fermata, the termination of a phrase. The dark bar in the center of the
chart indicates a phrase set,13 a grouping of phrases that work together musically. In the
Bach chorales these sets usually consist of either two or three phrases each. Musical
considerations determine the appropriate divisions. The present chorale divides into two
three-phrase groups based on the placement of the perfect authentic cadences in c minor,
the home key.14 The close relation of the melodic content in the last three phrases
reinforces this division.
The top of the uppermost sub-chart15 includes labels that identify the terminal
cadence and overall motion for each phrase. The motion of the phrase is given as a two
or three-letter code describing the timing, general shape, and overall change of the
phrase. The letter in parentheses is always the overall change: increasing (I), decreasing
(D), or level (L). The letter to the left of the parentheses indicates the general shape: line
(L), peak (P), or valley (V). If the phrase is classified as a line, only two letters are used.
13. A phrase set may or may not correspond with a phrase group, period, or compound
structure. 14. Of course, the final C major chord is a Picardy relation. 15. Appendix B clarifies several important ambiguities in the sub-charts.

14
Figure 10. Spacing Analysis of Riemenschneider 110.
Bach, Vater unser im Himmelreich (R110)Overall Shape: Symmetric peak (decreasing) 47.9% into the piece.
The point of maximum distance from the overall shape line occurs 28.6% into the piece.
1. L(D) ; PAC in c 2. L(I) ; HC in c 3. L(I) ; PAC in c 4. LV(D) ; PAC in G 5. L(D) ; PAC in Eb 6. L(D) ; PAC in C
0
50
100
150
200
1 3 5 7 9 11 13 15 17 19 21 23 25 27 29 31 33 35 37 39 41 43 45 47
Beat Number
Spac
ing
Inde
xQ
uart
ile A
way
fr
om S
hape
0
100
200
300
400
500
600
700
1 3 5 7 9 11 13 15 17 19 21 23 25 27 29 31 33 35 37 39 41 43 45 47
Voi
ces
Plo
tted
in H
ertz
&
?
b
b
b
b
4
4
4
4
œ
Beat:
œ
œ
œ
œœ œœ œ
2 4
œ œ œ œœ œ
œ œ
œ œœb
œn œ
œb
œ œ
œ œ œ
U
œ
6 8
œ œnœ
œ
œ œ œ œ
œ
œ
œ
œ
u
œ
œ œ
œœ œ
10 12
œ œ œœ œ œ
œ œ œ œœ œbœ
œ œ
œ œœ œ œn
14 16
œ œn œœœ
U
œ
œœb
œ
œœb
œb œ
u
œ
œ œœ œ œ
18 20
œ œœ œ œ
œ œb œ œnœn
œ œ œ œœ
œ œn œ œ
22 24
œ œœ œ
U
œ
œ œœ
œnœb œ
œ
u
œ
&
?
b
b
b
b
œ œ œ œ
26 28
œ œ# œ œ œ
œ œœ œ œ
œ œ œ
œ œ
œ œ œ
œ
30 32
œ œ#œ
U
œn
œ œ œ œn œ œ
œ œ
œ
u
œ œ
œ œ œ œb œ
34 36
œ œ œ œ œ
œ œ
œ œœ œ œ œ œ
œ œ œœ
38 40
œ œ œ
U
œ
œ
œ œb œ
œ
œb œ
œ
u
œn
œb œ œ œ œ
42 44
œ œ œ œ œ œ
œ œn œ œb œbœ œœb œ œ
œ œ œ
46 48
œn œ œ œœ
U
œ œ œ œnœ
œ
œ
u

15
If the phrase is classified as a peak or valley, the first letter denotes the timing as early
(E), symmetric (S), or late (L). The dotted lines indicate the shape of progressive motion
for the phrase.
Each of the first three phrases in chorale 110 has its own spacing progression
shape: decreasing line, increasing line, and increasing line, respectively. However, as a
set these three phrases form a symmetric increasing valley. Although this three-phrase
shape is not labeled on the chart, it is drawn in as the continuous dark line moving to a
low point on the upbeat of beat fourteen. The second set of phrases forms a decreasing
line, also marked as a continuous dark line on the chart. The piece as a whole is a
symmetric decreasing peak. This overall shape is labeled at the top of the chart analysis
and drawn as a continuous shaded line with a high point at beat twenty.
The goal of spacing progression shape classification is to capture the essence of
the spacing progression for the musical unit in question, which may or may not be
apparent from a casual examination of the spacing index values. A casual glance at
phrase two suggests the highest point, at beat twelve, as a significant goal of the phrase-
level spacing progression. A closer examination reveals that the great change from the
initial spacing at beat nine to the final spacing at beat sixteen dwarfs the difference
between the highest point and the highest endpoint (the cadence chord). Since the change
from start to finish is so great, the linear motion of the phrase toward a much wider
ambient spacing level proves to be the most significant phrase-level spacing progression.
The chorales often exhibit conflicts between the shape of a musical unit and the
shapes of its sub-units. These conflicts can serve a progressive function in the music, and

16
the present chorale is a perfect example. At the phrase set level, the first three phrases
move downward to the low point at beat fourteen and then move upward to the high point
at beat twenty-four. However, the downward motion of the first phrases is a localized
movement; the significant global motion is the progression from the initial spacing level
to that of beat twenty-four. Bach resolves this tension between local and global motions
in the second half of the piece where the shape of the phrase set and the shape of the
overall piece fall into a complimentary relationship. The quartile sub-chart is included in
the analysis to highlight these types of tensions: in the first half of the piece, the spacing
index values remain far below the trend line, while in the second half they move above
and then balance out evenly above and below the trend line.
A final, significant issue of the analysis approach relates to the significance of the
soprano line in relation to spacing progression. At first it might appear that the increasing
proximity of the voices as chorale 110 moves toward closure is exclusively the result of
the prominently descending soprano line. Although the descent in the soprano is indeed a
prominent contributor to the convergence of the four voices, the motions of the three
lower voices also affect the spacing progression. The upward motion of the bass during
the first half of the final phrase, for instance, adds to the effect of increasing vertical
density.
In fact, the motions of all the voices condition changes in spacing, so that
downward motion in the soprano may be accompanied by increasing or decreasing
overall vertical proximity. In the present chorale, for instance, the point of widest
spacing occurs not at the high soprano note of beat twenty but rather at the cadence of the

17
third phrase. The cadence is vertically less dense than beat twenty because at the cadence
the lower three voices are evenly spread, while at beat twenty the lower two voices sound
a relatively close interval, a major third, in a low range. As will be shown, Bach’s choice
of spacing at high points in the soprano line often proves to be significant for the spacing
progression of the entire chorale.

18
Chapter III
INITIAL APPLICATION
Of the thirty-eight chorales examined using the spreadsheet, six had linear shapes,
three were valleys, and twenty-nine were peaks, showing a significant tendency toward
peaks.16 It is likely that the tendency toward peaks is a result of a melodic structure
common to many of the chorales wherein the melody starts in a particular range, moves
to a high point, and then returns to the initial range. A practical and workable approach
to spacing in such instances is to begin with the voices relatively close together, spread
them apart using contrary motion until the soprano line reaches its high point, and then
move them back together again. The resulting spacing progression will form a peak
shape.
The chorales that manifest global17 spacing progressions are all peaks, and fall
into three categories. Figure eleven shows the generalized shape for each category and
lists examples from the chorales studied. Type one progressions move toward the peak
via a series of expansions and contractions. Each expansion moves to a spacing index
which is slightly higher than the previous pinnacle until the global peak is reached. A
corresponding series of decreasing peaks occasionally occurs in the last section of the
16. A table showing totals for various combinations of timing, shape, and overall change
is given in the introduction to Appendix C. 17. Global spacing progressions occur over the course of an entire piece. Local
progressions occur over the course of a single phrase or phrase set.

19
piece. Type two progressions, including R110 discussed in the previous chapter, may
begin with local and global spacing index shape lines increasing together, but soon the
local line will move downward. The local and global trend lines continue to move apart
until the local trend line reaches a low point. The local trend line then moves upward to
join the global trend line at the peak of the piece, and the piece closes with a general
descent in both local and global trend lines, sometimes with localized interruptions. Type
three progressions are distinguished by having two (or sometimes three) high points that
Figure 11. Three Types of Global Spacing Progression in Bach Chorales.
Type One: R1, R20, R70, R160, R230, R250, R280, R340, R370
Type Two: R110, R180, R190, R290, R310, R320
Type Three: R80, R140, R210, R300, R330, R360

20
are equal or extremely close to equal. These equal high points may coincide with a high
pitch which the soprano reaches several times during the piece. Between these points of
widest spacing the voices move closer to one another.
Of course, some of the chorales fit more closely into a particular progression type
than others, and some chorales lack a coherent global spacing progression altogether.
However, the correspondences between the chorales in each category are often difficult
to deny. The three categories are presented not as rigid paradigms but rather as
framework structures to highlight similarities and differences amongst spacing
progressions of various chorales.
Riemenschneider 1, “Aus meines Herzens Grunde,” exhibits a classic type one
spacing progression. Figure twelve presents the spacing analysis. From the initial
spacing the voices move apart to the spread sonority at beat fifteen, then move back
together again for the cadence at beat twenty-one. They then move apart again to create
progressively higher peaks in the spacing index, which occur on beats twenty-six18 and
thirty-five. Finally, at beat forty-five the voices achieve their widest spacing. A smaller
peak occurs at beat fifty-seven.
None of the peaks in R1 occur at cadence points. Cadence points, as moments of
relative repose, are often voiced to create spacing levels comparable with the initial
spacing of the piece. Hence globally progressive spacing motions generally occur in the
middle of phrases. Furthermore, the harmony at each peak is distant from the cadence
18. On a local level this phrase is a line, not a peak, because the positive difference
between the endpoint values is slightly greater than the difference between the values

21
Figure 12. Spacing Analysis of Riemenschneider 1.
Bach, Aus meines Herzens Grunde (R1)Overall Shape: Late peak (level) 69.0% into the piece.
The point of maximum distance from the overall shape line occurs 77.3% into the piece.
1. LP(L) ; HC in G 2. L(D) ; PAC in G 3. L(D) ; HC in G 4. EP(L) ; HC in G 5. EP(D) ; HC in G 6. EP(D) ; PAC in G
0
50
100
150
200
1 3 5 7 9 11 13 15 17 19 21 23 25 27 29 31 33 35 37 39 41 43 45 47 49 51 53 55 57 59 61 63
Beat Number
Spac
ing
Inde
xQ
uart
ile A
way
fr
om S
hape
0
100
200
300
400
500
600
700
1 3 5 7 9 11 13 15 17 19 21 23 25 27 29 31 33 35 37 39 41 43 45 47 49 51 53 55 57 59 61 63
Voi
ces
Plo
tted
in H
ertz
&
?
#
#
4
3
4
3
.
.
.
.
œ
Beat:
œ
G:
œ
œ
I
˙
œ
2
œ œ œ
œ œ œ œœœ œ
I IV6
V6
.œ
j
œ œ
5
˙œ
œ œ œœ
œ œ
I V vi
.œ
j
œ œ
8
œ œ œœ œ
œ œ œœ
œ œ œ œ
IV vii6˜
I
˙
U
œ
11
˙ œ
˙ œ
˙
u
œ
V I
˙ œ
14
œ œœ
œ œœ
œ œœ
V6vi
65 vii
6˜
œ ˙
17
˙ œ
œ œ œ œ
œ œœ
I6
ii65 V
7
˙
U
20
˙
˙
˙
u
I
œœ
œ
œ
I
œ œœ
23
œ œ œ œœ
vii6˜
œ œ œ œ
œ œœ
I ii I6
.œ
j
œ œ
26
œ œ œ œ œ
œ œœ œ
.œ
J
œ œ
I6
V43 I
&
?
#
#
˙
U
œ
29
˙ œ
˙œ
˙
u
œ
V vi
˙ œ
32
œ œœ œ
œœ
œ
œ œ œ
iii6
ii6
˙ œ
35
œ.œ
J
œ
˙ œ
.œ
J
œ œ
I6
V7
.˙
38
˙ œn
.˙
œ œœœ
I I6 V
7
IV
˙
U
œ
41
˙œ
˙ œ
˙
uœ
IV I
˙ œ
44
.œ
J
œ œ
œ œ œ œ
œ œœ
V65 I vii
6˜
˙ œ
47
˙ œ
˙ œ œ
œœ
œ
I6
I V7
.œ
j
œ œ
50
œœœœœ
œ œœ
œœœœ œœ
vi IV I
˙
U
œ
53
˙ œ
˙ œ
˙
u
œ
V I
˙ œ
56
˙ œ œ
˙ œ
œ œ œ
V6
IV6
œ ˙
59
˙ œ
˙ œ œ
œ œ œ œ
vi ii65 V
7
˙
U
62
˙
˙
˙
u
I
on beats fifteen and thirteen.

22
harmony for that phrase, and the widest spacing of all occurs on a first-inversion
dominant seventh chord near the beginning of the fifth phrase.
Spacing progression is vital to the coherence of this chorale due to the fact that
the melody lacks a clear high point. Instead, the soprano line returns six times to the
same high pitch, D5. The high points in spacing index values usually coincide with the
soprano’s high pitch, but the progression is carefully controlled through the placement of
the other three voices. Given that the melody only spans a fifth and reaches the same
high note six times, Bach’s careful control of spacing and the progression are truly
remarkable.
Riemenschneider 110, discussed in the previous chapter, is an example of a type
two spacing progression. Figure thirteen is a spacing analysis of R290, “Es ist das Heil
uns kommen her,” another type two spacing progression. The type two paradigm is very
obvious in both the top and bottom sub-charts. In the top sub-chart, the spacing index
values move toward a low point in beat eleven, contrary to the overall trend line. The
significant global high point occurs in beat eighteen, and the voices move progressively
closer together toward the end of the piece. In the bottom sub-chart it is easy to see the
voices move close together in beat eleven, spread apart for the wide point in beat
eighteen, and move progressively closer toward the end of the piece. Interestingly, the
soprano states its highest note a second time in beat twenty-six, but the close interval in
the lower voices makes the spacing index value fall in line with the overall decreasing
trend.

23
Figure 13. Spacing Analysis of Riemenschneider 290.
Bach, Es ist das Heil uns kommen her (R290)Overall Shape: Symmetric peak (decreasing) 43.8% into the piece.
The point of maximum distance from the overall shape line occurs 25.6% into the piece.
1. SP(D) ; IAC in D 2. EV(L) ; PAC in B 3. EP(I) ; PAC in B 4. SV(D) ; HC in f# 5. EP(I) ; PAC in E
0
50
100
150
200
1 3 5 7 9 11 13 15 17 19 21 23 25 27 29 31 33 35 37 39
Beat Number
Spac
ing
Inde
xQ
uart
ile A
way
fr
om S
hape
0
100
200
300
400
500
600
700
1 3 5 7 9 11 13 15 17 19 21 23 25 27 29 31 33 35 37 39
Voi
ces
Plo
tted
in H
ertz
&
?
#
#
#
#
#
#
#
#
4
4
4
4
.
.
.
.
œ
Beat:
œ
E:
œ
œ
I
œ œ œ œœn
2 4
œ œœ œ œœ
œ
œ œ œ
œ œ œ
œ
V65 I V
65
IV
œ œ œ
U
œ œ
6 8
œ œ
œn œœ œ
D:
œ œœn
œn
E:
œ
V
œ œœ œn
u
œ#
IV IV6vii
7˜I V
65
œ œ œ œœ œ#
10 12
œ
œ
œœ
œ œ œ
œ
œ
vi
.œ
B:
J
œ œ œœ œ
Iii
V42
œ œ œ
U
14 16
.œ
J
œ œ
œ
œ œ#œ
œœ
œ
œ
u
I6
I V7
I
œ
œ œ
œœ œ
IV
œ œ œ œ
18 20
œ œ#œ œ œ œ
vii6˜
œ œœ œ
œ
œ œ
œ œœnœ
ii I V V42
IV
&
?
#
#
#
#
#
#
#
#
œ œ œ œ
U
œ
22 24
œœ œ# œ œ
œn
œ
œ œ œ œ
œœ œ
œ
u
f#:
œ œ
IV6IV V
7I VII
œ
œ œ
œ œ
26 28
œ œ œ œ œ# œœ
œ
œ œœn œ œ#
œ# œ
œ œœ œ œ œ œ
III ii65ø
V42 vii
6˜i
œ œ œ
U
œ
30 32
œ
œ œ œ œ œ# œ
œ
œ œ œ œ
V42
œ# œ
œ
u
E:
œ œ
V65 i V
V42
ii
œ œœ œ œ
34 36
œ œn œ œ œ œœ
œ œ œ
œ
œ œ
i6
œ œ œ œœ œ
ii6
I6vii
65ø
I6
V7
œ œœ
U
38 40
œ
œ œ
œn œœn œ#
œ œ# œ
œ
u
vii7˜
V V7
I

24
The point of greatest harmonic tension, probably the first inversion dominant
seventh chord in beat thirty, which occurs in a region of f# minor, coincides with nothing
of global significance in the spacing index chart. Conversely, the peak of the spacing
index chart occurs on a supertonic chord in the key of the dominant, probably not the
most significant harmony of the piece. Instead, the spacing index peak occurs at the
point where the soprano reaches its highest note. The spacing progression in the present
chorale, then, appears to be a primarily linear phenomenon which may or may not
coincide with harmonic progression. It is conditioned by the shape of the soprano
melody, but refined and adjusted by careful placement of the remaining voices.
Type three progressions occur less often than the first two types. Figure fourteen
analyzes a perfect example, “Christe, du Beistand deiner Kreuzgemeine” (R210). An
initial spacing expansion leads to an early peak in beat ten, which is followed by a
contraction of spacing and a second expansion to the high point at beat thirty-nine. As is
often the case, the second high point is the result of an almost-literal repetition of the
earlier phrase. The form of the chorale could be described as a-b-c-a’-b-d-a’’; the two b
sections include the peaks in spacing index values.
In the chorales which do not follow one of the three standard paradigms, spacing
creates progression only on local levels. Some of these are peaks in which the approach
to or descent from the high value is only loosely controlled. The remaining nine chorales
consist of six lines and three valleys. The linear chorales fail to exhibit a general pattern
of spacing progression. In the case of the valleys, there were too few samples to

25
Figure 14. Spacing Analysis of Riemenschneider 210.
Bach, Christe, du Beistand deiner Kreuzgemeine (R210)Overall Shape: Early peak (level) 16.7% into the piece.
The point of maximum distance from the overall shape line occurs 38.5% into the piece.
1. L(I) ; HC in d 2. EP(L) ; PAC in a 3. L(D) ; PAC in F 4. SP(L) ; IAC in C 5. EP(I) ; PAC in a 6. L(I) ; PAC in g 7. L(D) ; PAC in D
0
50
100
150
200
1 3 5 7 9 11 13 15 17 19 21 23 25 27 29 31 33 35 37 39 41 43 45 47 49 51 53 55 57 59
Beat Number
Spac
ing
Inde
xQ
uart
ile A
way
fr
om S
hape
0
100
200
300
400
500
600
700
1 3 5 7 9 11 13 15 17 19 21 23 25 27 29 31 33 35 37 39 41 43 45 47 49 51 53 55 57 59
Voi
ces
Plo
tted
in H
ertz
&
?
4
4
4
4
œ
Beat:
œ
œ œ
d:
œ œ
i
œ œ˙
2 4
œ
œ œ œ
œ œ ˙œ œ œ œ# œ
œ œ œ
i6
V6
i
˙
U
œ œ
6 8
˙#œ œ
˙ œ
œ
˙
u
a:
œ œ œ œ#
V i6
V6
œ œ œ ˙
10 12
˙ œ œ#
œ œ œœ œ œ
œœ
œ œ œœ
œ
i iv6i64 ii
7øV
7
˙
U Œ
œ
14 16
˙Œ
œ
˙ Œœ
i
˙
u
Œ
C:
œ
i
vi
œ œ œ œ
18 20
œ œ œ œ œ
œ
œ œ œ œ œ œ
œ œœ œ œ
vii65ø
iii IV V42 I
6
œ œ œ œ
22 24
œ œ œ œ œ œ œ œ
œ œœ œ
ii
œ
œ
F:
œ
œ œb
IV I
vi
I6
&
?
˙ œ
U
œ
26 28
˙ œ œ# œ
œ œœb œ œ
˙
œ
u
œ
V7
I Vvi
œœ˙
30 32
œ œœ œ œ œ œ
œœ ˙
ii
œ#
C:
œ œn œ œ œ œ
V6
vi vi V
˙
U
œ œ
34 36
˙
œ œ
˙
œ œ
vi6
˙
u
a:
œ œ
I
i6
ii65ø
œ œ œ ˙
38 40
œ œ# œ œœ
œ œ œœ œ œ
œ œ œ œ œ
III6+iv
6i64 ii
65ø
V7
˙
UŒ
œ#
42 44
˙Œ œ
˙ Œœ
˙
u
Œ
g:
œ
i vii6˜
œ œ œ œ#
46 48
œ œ œb œ
.œ
j
œ œb
œb œœ
œb œn œœ
i6 V
65
iv iv7
V7
˙
UŒ
œ
50 52
˙ Œ œ#
˙b Œ œ
˙
u
Œ
d:
œ
i V
œ œ ˙
54 56
œ œ œ œ#
œ œœb œ
œ
œœ
œœ œbœ˙
i iv V7
.˙
U
58
.˙
.˙#
.˙
u
I
26
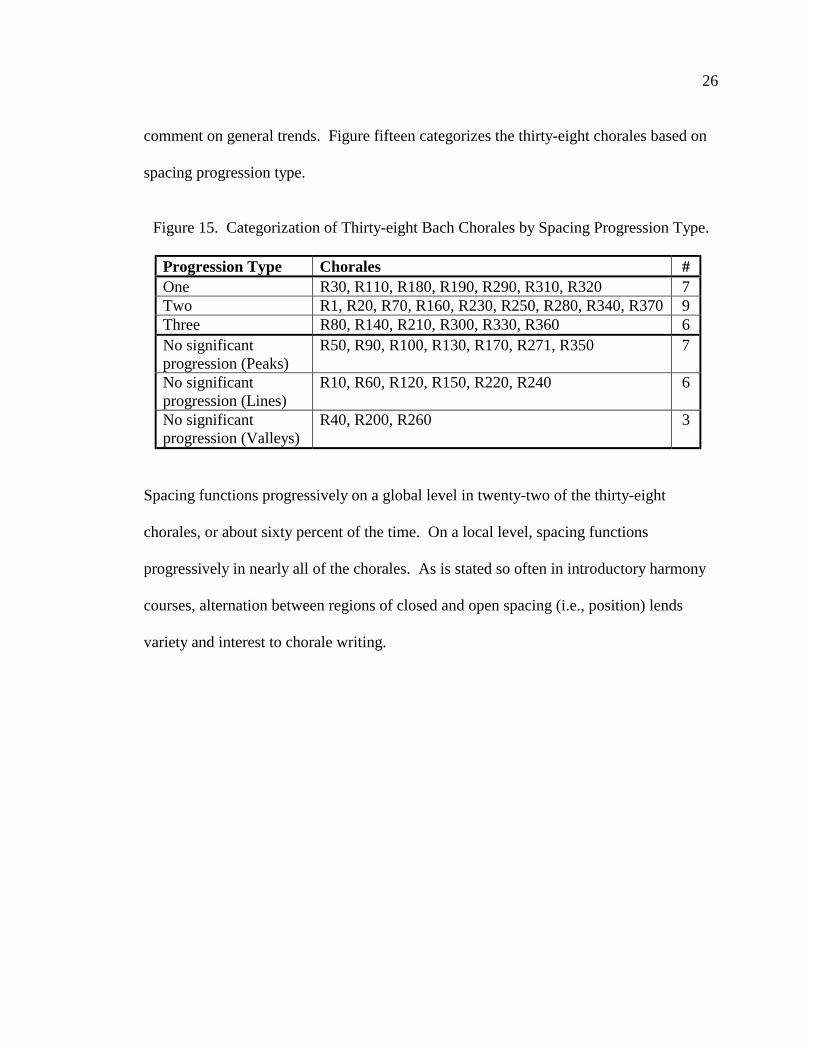
comment on general trends. Figure fifteen categorizes the thirty-eight chorales based on
spacing progression type.
Figure 15. Categorization of Thirty-eight Bach Chorales by Spacing Progression Type.
Progression Type Chorales # One R30, R110, R180, R190, R290, R310, R320 7 Two R1, R20, R70, R160, R230, R250, R280, R340, R370 9 Three R80, R140, R210, R300, R330, R360 6 No significant progression (Peaks)
R50, R90, R100, R130, R170, R271, R350 7
No significant progression (Lines)
R10, R60, R120, R150, R220, R240 6
No significant progression (Valleys)
R40, R200, R260 3
Spacing functions progressively on a global level in twenty-two of the thirty-eight
chorales, or about sixty percent of the time. On a local level, spacing functions
progressively in nearly all of the chorales. As is stated so often in introductory harmony
courses, alternation between regions of closed and open spacing (i.e., position) lends
variety and interest to chorale writing.

27
Chapter IV
TWO EXPANDED APPLICATIONS
By itself, textural analysis rarely yields a comprehensive picture of musical
progression. Progressions in other musical elements, such as harmony, line, and motivic
development, often accompany textural progressions. Therefore, spacing analyses offer
their most lucid insights only when considered alongside other analyses. The two
expanded applications in the present chapter place spacing in the larger context of other
musical parameters. The first application examines Riemenschneider 300, integrating a
spacing analysis with an analysis by Augusta Rubin. The second application combines
insights from Heinrich Schenker’s Five Graphic Music Analyses with a spacing analysis
of the first prelude from The Well-Tempered Clavier by J.S. Bach.
Figure sixteen is a spacing analysis of Riemenschneider 300, “Warum betr!bst du
dich, mein Herz.”19 R300 exhibits the typical type three chorale progression structure,
moving fairly rapidly to its high point (beat 10), only to return to the same level again
near the end of the chorale (beat 31). Harmonically, the chorale begins in a minor, but
moves through C major and d minor before arriving on a half cadence in a minor at the
end of the third phrase. Phrase four ends in F major, which returns via C major to a
minor, ending the piece with a Picardy third.
19. Augusta Rubin, J.S. Bach: The Modern Composer (Boston: Crescendo Publishing

28
Figure 16. Spacing Analysis of Riemenschneider 300.
Bach, Warum betrubst du dich, mein Herz (R300)Overall Shape: Early peak (increasing) 25.0% into the piece.
The point of maximum distance from the overall shape line occurs 59.8% into the piece.
1. SP(L) ; HC in a 2. LV(L) ; PAC in d 3. EP(I) ; HC in a 4. L(I) ; IAC in F 5. L(D) ; PAC in A
0
50
100
150
200
1 3 5 7 9 11 13 15 17 19 21 23 25 27 29 31 33 35 37 39
Beat Number
Spac
ing
Inde
xQ
uart
ile A
way
fr
om S
hape
0
100
200
300
400
500
600
700
1 3 5 7 9 11 13 15 17 19 21 23 25 27 29 31 33 35 37 39
Voi
ces
Plo
tted
in H
ertz
&
?
4
4
4
4
œ
Beat:
œ
œ œ
a:
œ œ
i
œ œœ œ
œ
2 4
.œ
J
œ œ œ# œn
œ
œ œ œbœœ
œœ#
i6
i V vii7˜
iv
œ œ œ œ œ
6 8
œ œ#
œ
U
œ
œ œ œ#
u
œ
œ œ# œ
œ
iv vii7˜
V V i
œ
œ œ œ
10 12
œ œ œ œ
œ
C:
œ œ œ œ œœ#
I V vii65ø
ii
œ œ
œœ
iv III VII
œ œœ# œ œn
14 16
œ œ œ
U
œ
œ
œ œ
u
œ
ii6
d:
œ œœ
œ
a:
œ
i6
V i i
œ
œ œ œ
18 20
œ œ œ#œ# œ
œ# œœ œœ
œœ œ œ
V i6
vii6˜
i
&
?
.˙ œ œ
22
.˙#
U
œ œ
.˙
u
œ œ
.˙
œ œ
V i6
vii6˜
œ œ œ œ
26 28
œ œ œn œ
œb
œœb œ
œ
iiiF:
œ œ œ
œb œ œ
i V7
IV IV ii
œ œœœ
30 32
œb œ œ œ
U
œ
V I
I
œ œ œ œ
u
œ
œ
(F-A PT's?)
( )
œ
œ
C:
œ
V7
I43 V
œ œ œ œ œ
34 36
œ œ œ œ# œ#œ
V7
i
œ œ œ œ œ œ
œ
a:
œ
œ œœ
vi ii6
V7
VI
œ œ œ
38 40
œ œ#œ
U
œ œ œ œ#
u
œ œœ
œ
i6
V7
I
Company, 1976), 344-345, provides a similar harmonic analysis.

29
Rubin cites several compositional devices which preserve motivic unity within
and among the phrases of the chorale.20 Rubin finds canonic procedures which sustain
intra-phrase unity in phrases three and four. In phrase three, the first four notes of the
tenor form a crab canon with the last four notes of the alto, reversing and inverting the
intervals. In phrase four, the alto notes A-G-F-Bb-Bb are answered at the seventh by the
bass notes Bb-A-G-C-C.
Rubin further cites three devices which play a prominent role in inter-phrase
unity. The first involves the opening five notes of the tenor line. These notes derive
from an inexact inversion of the first five notes of the soprano’s second phrase. The first
four of them recur in the bass at the close of phrases two and five, although the statement
in phrase two is transposed to d minor. The second device is the descending melodic
motive first stated in the last four notes of the soprano’s opening phrase. The soprano
restates this descent at the end of phrase three and the beginning of phrase five. The final
device unifying the chorale as a whole is the occurrence one time in each phrase of a
unison A between two of the voices. The unison A occurs on beats three (tenor and
bass), fifteen (tenor and bass), seventeen (tenor and bass), twenty-five (soprano and alto),
and thirty-seven (soprano and alto).
One of the motivic devices Rubin describes serves a significant structural
function: the recurring E-D-C-B descent in the soprano. Although R300 can be viewed
as either a three-line or five-line descent,21 the E-D-C-B descent does lead to the
20. Ibid. 21. The fifth scale degree never has the direct support of a root position tonic chord, but it

30
dominant chord the first two times it occurs, and begins the return to tonic in the final
phrase. Each of the two dominant chords has a B4 in the soprano and an E3 in the bass.
The placement of the inner voices is very different, however. In the first case, the
descent in beats five through eight returns the spacing of the voices to the level at which
the chorale began.22 In the second case, the descent in beats nineteen through twenty-
four ends at a spacing level similar to the end of the piece. Hence the chorale affects
closure through the synthesis of the tonality of the opening chords with the spacing of the
dominant chord in measure six. The placement of the inner voices at beats eight and
twenty-four is anything but arbitrary.
The occurrence of one unison A in each phrase, a second motivic device Rubin
describes, also relates to sonority spacing. The unison A’s contribute to relative low
points in the spacing index graph.23 In fact, the unison note marks the low point for four
of the five phrases. However, only the unison in the final phrase fails to conform to the
general trend of the surrounding spacing index values. As a rule, the unison A’s are
incorporated into the phrase-level progressions.
The sensibility of the second phrases’ abrupt spacing changes is perhaps not
obvious. One explanation is that the gradually decreasing line connecting beats eleven,
thirteen, and sixteen is periodically interrupted by abrupt returns to the chorale’s opening,
could be argued that the E5 of beat 19 is supported by the A3 two beats earlier. Such an analysis labels the first eighteen beats as an extended Anstieg.
22. Here the spacing analysis offers a plausible explanation for the alto’s unusual downward leap.
23. See appendix B for further discussion of this issue.

31
closer spacing levels at beats twelve, fourteen, and fifteen. Viewed in this manner, the
abrupt shifts in spacing make perfect sense as transitional gestures connecting the first
and third phrases. Notice that the line connecting beats eleven, thirteen, and sixteen leads
to approximately the spacing level of beats twenty-two through twenty-four.
The spacing index measurement is clearly relevant to the chorales of J.S. Bach.
Typical patterns of progression in the chorale harmonizations have been examined along
with appropriate examples. Obviously, however, there is a great deal of music that does
not conform to the temporal or textural constraints of Bach chorales. If the spacing index
is to be a truly viable means of analysis, it must be expanded to other musical forms.
Figure seventeen is a spacing analysis of the first prelude from The Well-
tempered Clavier by J.S. Bach, along with a whole-note rhythmic reduction. Unlike the
chorales, the texture of the first prelude is rhythmically activated by sixteenth notes. The
rhythmic reduction shown in figure seventeen shows the motion of the five constituent
voices as though they were stated simultaneously in chorale style.24 Such a reduction
seems necessary to discover how vertical spacing changes over the course of the piece.25
As he often did, Bach increased the number of voices near the end of the prelude.
The shape of the spacing progression overall is a symmetric valley with a low
point at measure sixteen. The first and last sonorities share very similar spacing values,
24. Remember that the bottom sub-chart shows only the outer four voices; the motion of
the inner voice is not charted. The spacing index calculation, however, always reflects all the voices. See Appendix B for further discussion.
25. Hermann Keller discusses the “hidden…five-voiced movement.” See The Well-tempered Clavier by Johann Sebastian Bach, trans. Leigh Gerdine (New York: W.W. Norton and Company, Inc., 1976), 47-49.

32
Figure 17. Spacing Analysis of J.S. Bach, The Well-tempered Clavier, Prelude One.
Bach, Well-tempered Clavier, Book 1, Prelude 1Overall Shape: Symmetric valley (level) 42.9% into the piece.
The point of maximum distance from the overall shape line occurs 13.5% into the piece.
1. L(L) ; IAC in C 2. L(D) ; IAC in G 3. EP(L) ; IAC in C 4. SP(I) ; IAC in C 5. L(I) ; PAC in C
0
50
100
150
200
1 2 3 4 5 6 7 8 9 10 11 12 13 14 15 16 17 18 19 20 21 22 23 24 25 26 27 28 29 30 31 32 33 34 35
Measure Number
Spac
ing
Inde
x
2
Qua
rtile
Aw
ay
from
Sha
pe
0
100
200
300
400
500
600
700
800
900
1000
1 5 9 13 17 21 25 29 33
Voi
ces
Plo
tted
in H
ertz
&
?
4
4
4
4
ww
w
IC:
ww
2ww
w
ii42
ww
ww
w
V65
ww
4ww
w
"
I
ww
w
w
w
vi6
G:
ww
ii6
6
w
ww#
V42
ww
w
w
w
I6
ww
8
w
ww
IV42
(2-3 sus.)
ww
w
ww
ii7
ww
10
w
ww#
V7
w
w
ww
w
"
I
ww
12
w
ww
#
vii43˜
iiC:
wwb
w
w
w
ii6
ww
14
w
ww
vii43˜
wwb
w
w
w
I6
ww
16
w
ww
IV42
(2-3 sus.)
ww
w
ww
ii7
ww
&
?
18
w
ww
V7
w
w
ww
w
"
I
ww
20
wwwb
V7
IV
w
w
www
IV7
w
w
22
www
b
vii7˜
V
w
w#
www
vii42˜
w
wb
24
www
V7
(Dominant pedal point)
w
w
ww
w
I64
w
w
26
w
w
w
V74
w
w
w
ww
V73
w
w
28
w
ww
#
vii7˜
w
w
b
w
w
w
I64
w
w
n
30
w
w
w
V74
w
w
w
ww
V73
w
w
32
w
wwb
V7
IV(Tonic pedal point)
w
w
w
w
IV64 ii
42
wwww
w
34wwwwwww
V7
w
w
w
ww
"
I
w
w

33
despite their differing tessituras. The phrases are less clearly demarcated than in the
chorales; each root-position tonic chord (one in the dominant key) has been taken as a
cadence point.
The prelude begins with a four-measure extension of the tonic chord, moves to a
region of dominant in measures six through eleven, returns to the tonic key in measures
twelve through twenty-three, and closes with dominant (24-31) and tonic (32-35) pedal
points. The lowest spacing index value occurs on the third-inversion subdominant
seventh chord in measure sixteen, a significant chord in that it initiates the last
progression to tonic before the dominant pedal point.
Heinrich Schenker analyzed the first prelude graphically. Figure eighteen
summarizes his interpretation of the highest and lowest significant lines.26 The upper line
begins on E5, which is coupled down an octave through a directed linear descent to the
E4 in measure nineteen. Meanwhile, the bass begins on C4 and is coupled down an
octave via a similar descent to the C3 of measure nineteen. In measures twenty-four
through thirty-one the top line unfolds the third D4-F4. The D4 is coupled to the D5 of
measure thirty-four, and the upper line approaches scale degree one from above through
the D5 and from below via the unfolding of the interval E4-C5, which follows from the
unfolding of measures twenty-four through thirty. Meanwhile, the bass moves through
subdominant to dominant and tonic pedal points. Notice that the top line is temporarily
covered in measures five, seven, twelve through fifteen, and thirty-four.
26. For Schenker’s complete analysis, see Five Graphic Music Analyses, ed. Felix Salzer
(New York: Dover Publications, 1969), 36-37.

34
Figure 18. Summary of Heinrich Schenker’s Graphical
Analysis of Prelude One from Bach’s The Well-tempered Clavier.
&
?
4
4
4
4
3
˙
^
˙
2
w
w
w
w
4
w
w
w( )j
œ
w
6
w
w
w( )j
œ
w
8
w
w
w
w
10
w
w
J
œ
w
ww
12
( œ#
wwb
)w
j
œ
w
14
(œ
wwb
)w
j
œn
w
16
w
w
w
w
18
w
w
J
œ
w
w
20
w
w
w
w
22
( )wb
( )w#
w
wb
24
˙
(Dominant pedal point)
˙
w
w
26
w
w
w
w
28
w#
w
w
w
30
wn
w
˙̇
w
32
˙
(Tonic pedal)
˙
w
w
34
2
w
^
˙
w
1
w
^
˙̇
w
At this point the relationships between the spacing progression and significant
linear motions become clear. The descent in the top line during the first fifteen measures
of the prelude corresponds with a gradual movement of the voices towards closer spacing
values. When an inner line temporarily covers the top line, as in measures five, seven,
and twelve through fourteen, the spacing value is markedly higher since the five voices
are spread farther apart at such points. Measure sixteen, the point of closest spacing,
corresponds with the resurgence of the top line as the uppermost voice. The process is
reversed in measure thirty-three, another low spacing value, when the upper line returns
to its obligatory register for the final descent. Measure twenty-three, yet another
significant low point, precedes the dominant harmony and controlling second scale
degree of measure twenty-four, which Schenker couples to the penultimate D5 in the
upper line. Throughout the prelude, significant linear motions correlate with extremes in
spacing index values. As in the chorales, Bach coordinates his spacing progressions with
linear and harmonic structures on a global scale.
35
Chapter V
CONCLUSIONS AND SUGGESTIONS FOR FURTHER RESEARCH
In conclusion, the spacing index offers a valid and valuable quantifiable
measurement of vertical spacing. Spacing index values, when plotted over time,
illuminate progressions that are sensed intuitively by musicians and listeners alike. Such
analyses should influence performance practice and might serve as starting points for new
methods of composition.
Heightened awareness of spacing as a progressive aspect of music can influence
its performance, increasing comprehension and enjoyment. Spacing analysis, when
corroborated by other analysis methods, illuminates important structural moments, such
as the uncovering of the top line in measure sixteen of the first prelude in The Well-
tempered Clavier. Knowledge of structural pillars, in turn, influences dynamics,
phrasing, and articulation, resulting in a more musical and convincing performance.
As a measurement of vertical spacing, the spacing index could be used for
composition as well as analysis. Even today, chorale textures influence a great deal of
music, and spacing analysis is relevant to such textures. The expansion of the analysis
method beyond the boundaries of chorale textures could lead to further explorations of
spacing-controlled composition methods, such as computer-assisted or computer-driven
36
composition. Perhaps intelligent control of spacing can improve the counterpoint of
computer-created ‘Bach’ chorales, with potential applications for theory pedagogy.
From a theoretical standpoint, spacing analysis justifies certain aspects of
counterpoint. First, in traditional counterpoint the bass is permitted to leap, while the
soprano is generally restricted to more conjunct motion. This rule relates to spacing
progressions in the following way: to match the hertz change of a stepwise motion in the
soprano tessitura, the bass must progress with a disjunct line. A second example is the
traditional emphasis on contrary motion. While contrary motion ensures linear
independence, it also encourages progression in spacing since the voices will be moving
farther apart or closer together.
Future application of the spacing index will succeed only if certain shortcomings
can be overcome. Foremost of all is the issue of segmentation. The present thesis
intentionally uses musical examples with straightforward segmentations, i.e. constant
rhythms and textures. Methods of segmentation for more complicated pieces must
account for rhythmic changes, perceived numbers of voices, and the question of timbre’s
relation to spacing and texture.
Testing of thresholds of detection for spacing changes would be relevant to
further studies. The speed and precision with which trained and untrained listeners
perceive spacing could be tested with appropriately designed experiments. The resulting
knowledge would be invaluable for deciding the relevance of particular calculated
spacing index values.

37
Another area of weakness lies in the analysis software. While the spreadsheet is
powerful and proved useful for the present analyses, it is fraught with limitations. It
offers only a limited description of shapes, and the entry of notes is tedious and prone to
error. Ideally, a program could be created which would read MIDI files and convert them
to spacing index data, freeing the analyst to examine trends in larger quantities of music.
Bach did not consciously calculate spacing changes, and he certainly didn’t
calculate spacing indices during the course of composing. However, he was doubtless
aware of spacing as a progressive element of the music. He could hear changes in the
relative vertical proximity of the voices, and he controlled their movements very
carefully. The spacing index offers consistency, precision, and objectivity in analysis.
Hopefully the present, preliminary study will serve as a foundation for further research in
vertical spacing and texture, important but ill-understood aspects of musical progression.

38
Appendix A
FREQUENCIES FOR EQUAL TEMPERAMENT
The spacing index formula demands that the notes of a sonority be converted to a
set of unique, increasing frequencies. Most musical performances of the twentieth-
century utilize equal temperament, a system in which the hertz27 values double with every
octave. Each octave is broken down into eleven incremental increases (half steps) which
equally divide the space between a note and the note an octave higher.
The most frequent standard in use today is based on the A above middle C being
set to 440 hertz. If we designate that A as A4, the frequency of the A in any octave can
be calculated using the formula in figure nineteen.
Figure 19. Formula for Hertz Frequencies of A’s.
The A is designated by an octave, where A4 is A above middle C.
)4(2*440)(Hertz −= OctaveOctave
When Octave = 4, Octave - 4 = 0, and since 20 = 1, the hertz value will be 440. If
Octave = 5, the hertz value will be 440 * 21 = 880, one octave higher than A4.
Unfortunately, equal temperament is based on A4 = 440, but the octave
designations change with each successive C. Therefore, to calculate the formula for any
27. One hertz equals one cycle, or vibration, per second. Two hundred hertz means that
the fundamental vibration of the sound source occurs two hundred times each second.

39
note, an adjustment factor x must be made. The final procedure is shown in figure
twenty.
Figure 20. General Formula for Hertz Calculations.
The input note is named with middle C as C4 and each C starting a new octave.
Note C C# D D# E F F# G G# A A# B
x -9 -8 -7 -6 -5 -4 -3 -2 -1 0 1 2
xOctaveOctavexValueHertz )2(*2*440),( 1214−=
Alternatively, common hertz values are listed in figure twenty-one.
Figure 21. Table of Hertz Values. Rounded to Nearest Hertz.
0 1 2 3 4 5 6 7 8 9
C 16 33 66 131 262 524 1048 2096 4192 8384 C# 17 35 69 139 277 554 1108 2216 4432 8864 D 18 37 73 147 293 586 1172 2344 4688 9376
D# 19 39 78 156 311 622 1244 2488 4976 9952 E 21 41 82 165 329 658 1316 2632 5264 10528 F 22 44 87 175 349 698 1396 2792 5584 11168
F# 23 46 93 185 370 740 1480 2960 5920 11840 G 25 49 98 196 392 784 1568 3136 6272 12544
G# 26 52 104 208 415 830 1660 3320 6640 13280 A 28 55 110 220 440 880 1760 3520 7040 14080
A# 29 58 117 233 466 932 1864 3728 7456 14912 B 31 62 124 247 494 988 1976 3952 7904 15808

40
Appendix B
CLARIFICATION OF AMBIGUITIES IN SPACING ANALYSIS SUB-CHARTS
In the top sub-chart of the spreadsheet analyses, the start of each phrase occurs on
the eighth note after the fermata of the previous phrase. As a result, each phrase seems to
begin with a jump. This jump is not part of the phrase progression but rather a result of
the motion from the chord of the previous fermata to the first chord of the phrase.
Occasionally this effect can skew the apparent shape of the phrase. For instance, one
might be tempted to label the fifth phrase of R110 as an early peak if it started at the
shaded fermata line, but starting one eighth note later, on beat thirty-three, reveals its true
nature is a descending line. Unfortunately, there is no easy way to disconnect the jumps
between phrases.
Also in the top sub-chart, when a phrase-level shape and a phrase-set shape
coincide, the phrase-level shape will be hidden by the phrase-set shape. Similarly, a
piece-level shape will hide smaller shapes when they coincide with it. Hence the shape
for the final phrase of R110 is hidden underneath the overall trend line.
The four lines in the bottom sub-chart do not always correspond to the four parts
in the chorale texture.28 The top line represents the highest note plotted in hertz and the
bottom line represents the lowest note plotted in hertz. However, the second highest line
28. This applies only to the bottom sub-chart. The spacing index includes every voice.

41
plots the second highest note, which may or may not be taken by the alto. Similarly, the
second lowest line plots the second lowest note, which may or may not be taken by the
tenor. As long as the four voices stay in their customary order the chart mirrors the music
fairly well. If two of the voices join, however, the joining of lines shown on the chart
may or may not mirror the joining of voices in the actual music. For instance, at beat
eleven of R110 the chart seems to show the alto and tenor joining together and moving in
parallel unisons. A glance at the music reveals that the alto actually joins with the
soprano, not the tenor, and that no parallel unisons are involved. The spreadsheet has no
way of knowing this, however, since in a three-note sonority the second highest and
second lowest notes are the same. Therefore, the two inner lines converge,
misrepresenting the actual motion of the voices. Anytime two voices converge or cross
the lowest sub-chart is prone to such misrepresentations. The benefit of this minor
ambiguity is a greatly simplified entry method, resulting in increased accuracy and a
larger set of chorale analyses.
When two voices join momentarily on a unison during the course of a four-part
chorale, they will maintain their independence if they leave the unison by contrary or
oblique motion. As a result, the perceived number of active voices at the moment of the
unison is probably more than three. To account for this, the number of voices used in the
spacing index calculation is actually a weighted average between the number of pitches
sounding and the number of active voices. (Usually an average of two numbers gives
them equal weight: (x + y)/2 = x/2 + y/2 = x * 0.5 + y * 0.5 = 50% of x + 50% of y. A
weighted average multiplies each of the two numbers by a different percentage. The two

42
percentages always add up to 100.) The number of pitches sounding is weighted 75%
and the number of active voices in the overall texture is weighted 25%. These
percentages have been found to give generally satisfactory results in the present study,
but it is possible that other weightings may be appropriate for different situations. The
calculation for a four-part chorale at the point where two voices temporarily meet on a
unison is shown in figure twenty-two.
Figure 22. Calculation of the Number of Voices for the Spacing Index Formula.
Number of Voices = Number of Pitches * 0.75 + Number of Active Parts * 0.25
= 3 * 0.75 + 4 * 0.25
= 3.25
The resulting number of voices is used as n in the spacing index formula given in figures
five and six. If the number of voices is not weighted in this manner, the resulting spacing
index value is misleadingly high when four voices temporarily become three sounding
pitches.

43
Appendix C
SPACING ANALYSES FOR THIRTY-EIGHT CHORALES OF J.S. BACH
To obtain an unbiased sample, every tenth chorale in Riemenschneider’s book
was examined using a Microsoft® Excel©29 spreadsheet. The only exceptions were the
first chorale and chorale 271, which was selected over 270 because 270 includes a
significant obbligato part atypical for the chorales. The spreadsheet is available by
contacting the author. Figure twenty-three summarizes the statistics for the thirty-eight
Figure 23. Summary of Characteristics for Thirty-eight Chorales of J.S. Bach.
Valley Line Peak
Early 1 10 Sym. 0 11 Late 2
8 Early Sym. Late TOTAL Decr. 0 2 12 4 5 3 14 Level 2 0 11 4 3 6 13 Incr. 1 4 6 3 3 1 11
TOTAL 3 6 29 11 11 10 chorales. To find out how many of the thirty-eight chorales were late valleys, for
instance, locate the intersection of the column for valleys and the row for late. In this
case, there were only two late valleys. Probably the most significant statistics on the
29. Microsoft® is a registered trademark of Microsoft Corporation. Excel 97 copyright
© 1985-97 by Microsoft Corporation.

44
chart are the totals for each of the three shapes: 3 valleys, 6 lines, and 29 peaks, showing
a tendency toward peak shapes.
Figure twenty-four classifies the chorales by trend attributes. Figure fifteen in
chapter three classifies the chorales by spacing index progression type.
Figure 24. Spacing Progression Shapes for Thirty-eight Chorales of J.S. Bach.
The chorales are listed by Riemenschneider number. Peaks: Early: Decreasing: R50, R180, R280, R330 Level: R80, R210, R230, R360 Increasing: R140, R300 Symmetric: Decreasing: R290, R110, R130, R320, R350 Level: R70, R160, R310 Increasing: R90, R170, R340 Late: Decreasing: R20, R250, R271 Level: R1, R100, R190, R370
Increasing: R30 Lines: Decreasing: R10, R240 Increasing: R60, R120, R150, R220 Valleys: Early, Increasing: R200 Late, Level: R40, R260

45

46

47

48

49

50

51

52

53

54

55

56

57

58

59

60

61

62

63

64

65

66

67

68

69

70

71

72

73

74

75

76

77

78

79

80

81

82

83
SELECTIVE, ANNOTATED BIBLIOGRAPHY OF RELEVANT LITERATURE
Berry, Wallace. Structural Functions in Music. New York: Dover Publications, Inc., 1987.
Berry’s book represents a landmark work in the analysis of progression in music.
Pages 5-6 contain a terse summary of Berry’s five classifications of formal process:
introduction, statement, restatement, transition and development, and cadence. On page 184
he defines density as “the quantitative aspect of texture – the number of concurrent events
(the thickness of the fabric) as well as the degree of ‘compression’ of events within a given
intervallic space.” Pages 184-209 treat density as a progressive element, albeit in a general
sense, and 209-210 contain noteworthy comments on the relation of perceived spacing and
dissonance as “a related, conditioning factor.” His consideration of intervallic density as the
ratio of number of notes to half-step span is one of the earliest attempts in the literature to
quantify the analysis of spacing progressions.
Boyd, Malcolm. Harmonizing ‘Bach’ Chorales. London: Barrie and Jenkins Ltd., 1977. Boyd’s table correlating the various catalogues for the chorales
(Riemenschneider, BWV, etc.) is particularly useful. The table occurs on pages 38-40.
Daley, Paul. An Investigation of Textural Activity and Its Hierarchical Structures in Selected Works by Krzysztof Penderecki. University of North Texas Master of Arts Thesis, May 1986. Daley evaluates several works of Penderecki in terms of their textural activity. His
study counts the number of discrete sound events which occur per unit time. The resulting

84
ratio becomes an index of textural activity as the piece progresses. His thesis is more
concerned with variations in the intensity of activity in the piece than with vertical spacing,
but the issues Daley raises bear relevance to segmentation issues encountered while using
the spacing index.
Gallaher, Christopher. Density in Twentieth Century Music. Indiana University Doctoral Dissertation. February 1975. Gallaher focuses on a four-fold concept of density: attack, dynamics, timbre, and
registration, or span measured in number of half steps. He concludes that the most
significant structural goal seems to occur at approximately 65-76% of the way into a
piece, and that span is the least important aspect of textural density.
Harrington, E. Michael. “Density in Musical Context,” Indiana Theory Review III/2 (Winter 1980), 12-25. Harrington’s article is an important step in the history of spacing progression
analysis. He ignores instrumentation, dynamics, and time. After a brief discussion of
Wallace Berry’s work in the field (cited above), Harrington proposes three new methods
of quantitative spacing analysis. In the first method, each lower frequency is divided by
every higher one in turn. These n ratios are then averaged and the reciprocal of the result
is taken. Since this analysis is based on ratios, sonorities with the same consecutive
intervals will register the same spacing in all octaves. The second method simply adds
the number of notes in the sonority to the result of the first method. The third method
takes the log of the sum of the frequencies and adds the number of notes. The behaviors
of each of Harrington’s three methods and the spacing index with respect to various
parameters is shown in figure twenty-five.

85
Figure 25. Effects of Changes in Various Parameters on
Harrington's Density Systems and the Spacing Index.
Method 1 Method 2 Method 3 Spacing Index
Interval Span Direct Direct Direct Direct
Register No affect No affect Direct Direct
Same span, change the number of notes
Inverse Direct Direct Direct
Consecutive intervals switched (e.g. major vs. minor)
No affect No affect Different value Different Value
Intervals completely rearranged
Different value
Different value
Different value Different value
Helmholtz, Hermann. On the Sensations of Tone as a Physiological Basis for the Theory of Music, trans. and ed. Alexander J. Ellis. New York: Dover Publications, Inc., 1954. The Helmholtz book was the premiere book on acoustics for the nineteenth
century. Helmholtz classifies dissonance based on the degree to which the overtones of
the two pitches involved interfere with each other. His interests lie in spectra and related
phenomena, not in vertical spacing as a progressive element.
Johnston, Ian. Measured Tones: The Interplay of Physics and Music. Philadelphia: Institute of Physics Publishing Ltd., 1993. Pages 76-80 contain an excellent discussion of the transition to equal
temperament as well as other tuning systems. The discussion of difference tones on page
102 is relevant to the spacing index, which uses the differences between consecutive

86
frequencies as a measure of distance. Pages 105-113 discusses Fourier analysis,
harmonic spectra and harmonic reinforcement patterns in chords. Johnston’s information
is relevant to discussions of the relationship between dissonance and perceived density,
an issue outside of the scope of the present thesis.
Keller, Hermann. The Well-tempered Clavier by Johann Sebastian Bach, Leigh Gerdine, trans. New York: W.W. Norton and Company, Inc., 1976. Keller writes his book for performers of Bach, offering analytic overviews,
vignettes, and performance suggestions for each prelude and fugue in The Well-tempered
Clavier. Of particular relevance to the present thesis is his discussion of the first prelude
on pages 47-49, in which he explains the origin of the [erroneous] extra measure
sometimes added to the prelude as well as the five-voice chorale texture hidden in the
keyboard figuration.
Koff, Charles. The Applied Musical Acoustics of Michael M. Fiveisky. Los Angeles: Koff Music Company, 1961. Koff, Charles. Harmony from the Science of Acoustics. Studio City, California: Koff Music Company, 1975. This is a reprint of edited selections from the above book. In these books, Charles Koff presents the theories of his teacher, Michael
Fiveisky. Fiveisky, a classmate of Serge Prokofiev, based his theories on the assumption
that major harmony is derived from the first 20 overtones and minor harmony is derived
from the first twenty undertones. He relates undertones to the concept of difference
tones, although he never explains this [obscure] relationship. Since the time of
Fiveisky’s writing in the early part of this century undertones have been proven not to
exist in physical acoustics.

87
Legname, Orlando. "Density Degree of Intervals and Chords." Twentieth-Century Music IV/10 (October 1997), 8-14. Legname uses Lissajous curves to visually analyze the density degree of various
intervals. Lissajous curves are waveforms that result from the superimposition of two
sine waves of distinct frequencies whose sound sources project their sounds
perpendicular to one another. He proposes that more complex graphs represent greater
density, and mentions that a mathematical procedure exists to permit comparison of the
curves. Unfortunately, Legname fails to describe the procedure he uses in his analysis,
making his results difficult to understand and his theories difficult to apply to other
musical examples. His ranking of intervals within an octave, from most dense to least
dense, is as follows: m2, M7, M2, m7, m6, TT, m3, M3, M6, P4, P5, Octave, and (he
omitted) unison.
Parncutt, Richard. Harmony: A Psychoacoustical Approach. New York: Springer- Verlag, 1989. Parncutt develops a perception-based theory of harmony which utilizes rigorous
scientific method to formulate a variety of useful statistical analyses such as pitch
commonality of simultaneities and the number of perceived voices for various sonorities
(which never goes much above 4, regardless of the number of voices). The work is
relevant primarily for the summary and rebuttal of previous physical theories of harmony
found on pages 7-11. It is based on the work of Ernst Terhardt of the Technical
University of Munich.
Persichetti, Vincent. Twentieth-Century Harmony. New York: W.W. Norton & Company, 1961.

88
This book takes an unusual approach to harmony in that Persichetti includes
occasional references to issues of spacing and density as they affect the consonance of
intervals and effectiveness of chords. However, these comments are quite general and
subjective. Particularly relevant comments occur on pages 17, 18, 22, and 23.
Rameau, Jean-Philippe. Treatise on Harmony. trans. Philip Gossett. New York: Dover Publications, Inc., 1971. Rameau’s Treatise on Harmony is the most significant book on acoustics written
in the eighteenth century. In it Rameau develops his theory of consonance and
dissonance based on the overtone series. His concept of spacing as a progressive element
is minimal, which is not surprising since composers were making the transition from
figured bass to more specific notation during his era.
Rubin, Augusta. J.S. Bach: The Modern Composer. Boston: Crescendo Publishing Company, 1976. Rubin’s book is a masterpiece of analysis, meticulously describing Bach’s
methodology in the chorales, with particular emphasis on motivic and canonic structures
as unifying elements. At the end of the book he offers seven exhaustive
motivic/harmonic analyses of complete chorales (Riemenschneider 224, R217, R168,
R149, R315, R300, and R138).
Riemenschneider, Albert, ed. 371 Harmonized Chorales and 69 Chorale Melodies with Figured Bass by Johann Sebastian Bach. New York: G. Schirmer, Inc., 1941. Riemenschneider’s book lacks extensive analyses of the chorales but is an
excellent source for authoritative editions of them.
Schenker, Heinrich. Five Graphic Music Analyses, ed. Felix Salzer. New York: Dover Publications, 1969), 36-37.
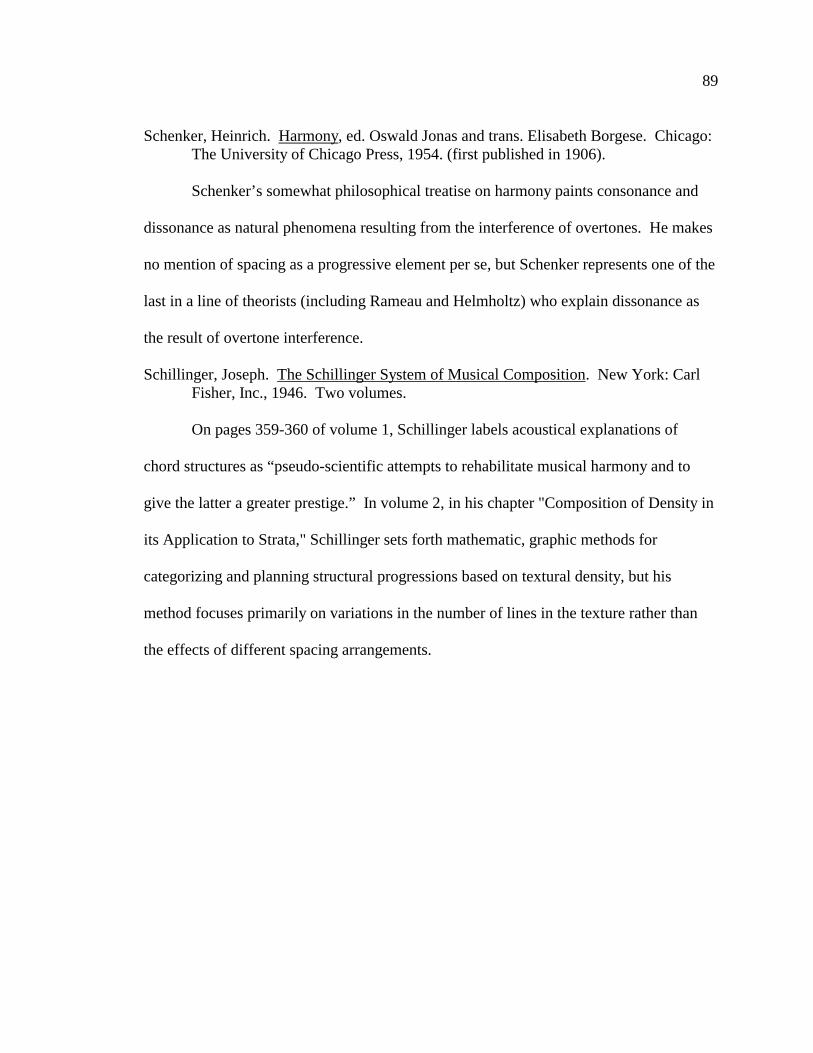
89
Schenker, Heinrich. Harmony, ed. Oswald Jonas and trans. Elisabeth Borgese. Chicago: The University of Chicago Press, 1954. (first published in 1906). Schenker’s somewhat philosophical treatise on harmony paints consonance and
dissonance as natural phenomena resulting from the interference of overtones. He makes
no mention of spacing as a progressive element per se, but Schenker represents one of the
last in a line of theorists (including Rameau and Helmholtz) who explain dissonance as
the result of overtone interference.
Schillinger, Joseph. The Schillinger System of Musical Composition. New York: Carl Fisher, Inc., 1946. Two volumes. On pages 359-360 of volume 1, Schillinger labels acoustical explanations of
chord structures as “pseudo-scientific attempts to rehabilitate musical harmony and to
give the latter a greater prestige.” In volume 2, in his chapter "Composition of Density in
its Application to Strata," Schillinger sets forth mathematic, graphic methods for
categorizing and planning structural progressions based on textural density, but his
method focuses primarily on variations in the number of lines in the texture rather than
the effects of different spacing arrangements.