the space of innovation - space syntax network 1st... · · 2012-01-25raises questions not only...
TRANSCRIPT

S P A C E S Y N T A X F I R S T I N T E R N A T I O N A L S P A C E S Y N T A X S Y M P O S I U M • L O N D O N � � � �
����
THE SPACE OF INNOVATION
Interaction and Communication in the Work Environment
Alan Penn, Jake Desyllas and Laura VaughanUniversity College London, London, England
0 AbstractAs the pace of organisational change accelerates and as new technologies demandmore rapid responses from organisations to changing conditions in their businessenvironment, buildings are being called on to play an active role in helping to gener-ate new organisational structures and in facilitating individual communication. Thisraises questions not only of the nature of organisational structure and of how com-munications technologies will affect that, but also of the possible mechanisms bywhich spatial structure can affect patterns of interaction in the work organisation.This paper reviews two recent research led design projects in which space syntaxtechniques have been used to help define the building brief for an organisation whichdepends for its market lead on its ability to innovate. Building on early research intothe design of research laboratories the present study found that patterns of space useand movement generated by spatial configuration have a direct impact on the fre-quency of contact between workers in office based organisations. The frequency ofcontact is shown in turn to have an impact on work related communications cited as‘useful’ by questionnaire. These patterns are found to be ‘system effects’ in that theycannot be attributed to an individual worker’s desk location, but appear to resultfrom the configuration of the whole system of spaces through which people move intheir daily work, and have detectable effects on the mean ‘usefulness’ to others of allworkers in a part of a building. The analysis suggests, however, that integration alonemay be insufficient to support flexible working, and that spatial differentiation isnecessary to provide the range of environments needed by different types of workactivity.
1 IntroductionWork organisations are undergoing a period very rapid evolution. Driven partly bychanges in technology, coupled to globalisation of markets and business processes,and partly by changing lifestyles and aspirations of the workforce, the modern workorganisation has begun to outstrip current theories of organisational structure letalone theories of the design of work environments. The pace is being set, in otherwords, through the practice of organisational evolution and restructuring, driven bythe constraints and opportunities of their changing business environment, ratherthan by organisation theory itself. The pace of change itself however, generates aneed for good predictive theory. If we are to restructure organisations to respond toan increasingly dynamic and uncertain future business environment how should itbe done? what kinds of spatial environment will best support them? what will be theimpact of the new technologies?
All of these questions demand a better theoretical understanding of the way thatorganisations function, and in particular of the way that they support innovation. It is
12P R O C E E D I N G S V O L U M E I • C O M P L E X B U I L D I N G S
K e y w o r d s : b u i l d i n g s ,
c o m m u n i c a t i o n , c o n f i g u r a t i o n ,
organisation,workplace.
Alan Penn
The Bartlett School of Graduate Studies
(Torrington Place Site)
University College London, Gower Street
London WC1E 6BT
England
tel: (44) (0) 171 380 7777 ext 5919
fax: (44) (0) 171 916 1887
email: [email protected]
www: http://doric.bart.ucl.ac.uk/web/
space syntax

S P A C E S Y N T A X F I R S T I N T E R N A T I O N A L S P A C E S Y N T A X S Y M P O S I U M • L O N D O N � � � �
����
possible to argue that at present management and design practice is ahead of theo-retical development in this debate. A wide range of novel organisational forms arebeing tried, along with an equally wide range of architectural and technological ap-proaches to the design of the work environment. In this paper we first review therecent history of approaches to innovation, including those that suggest the possiblerole spatial design might play in facilitating or inhibiting innovation. Next we reviewtwo recent research led projects in which detailed studies were carried out of officeenvironments. The first study of a recently privatised energy utility (Company X)was carried out both before and after the companies move to new premises in whichspatial analysis played a role in the design process. Some of the lessons learned dur-ing this process set the context for the second case study.
The second study is of an advertising company (Company Y) currently located in asingle office in Central London near the main media production area of Soho. Thisstudy was carried out as a part of the briefing process for series of major changes tothe agency’s way of working, and in particular the way that it ‘spatialises’ the workprocess. One aspect of these changes is a potential move to new premises, but thechanges that are currently in progress are much more thorough going than this, in-volving the whole allocation and use of the spatial and communications resources ofthe work environment to individual workers. We give a brief overview of the specificactivities of the agency and then describe the study that was carried out and a seriesof its main findings in some detail. Finally, we draw some of the main theoreticalfindings together in a discussion of the relationship between the work organisationconsidered as a resource available to facilitate individual creativity, and the workenvironment considered as a facility whose function is to bring the maximum lever-age to bear from the disposition of the organisation’s resources - both human andenvironmental.
This research has now begun to find a place in the practice of organisational changeby helping to develop spatial designs of the work environment to support innovation.However, we believe that its main contribution is theoretical in that findings aretabled, for the first time so far as we are aware, suggesting possible detailed mecha-nisms through which the spatial design of the work environment might be implicatedin ‘innovation’ per se.
2 The organisation of innovationA recognition of the importance of innovation developed during the immediate postwar period as economists tried to rationalise the massive growth of the German andJapanese economies, and the relative stagnation of other nations. The response inmanagement circles at the time mainly relied on the ‘peace dividend’ of operationalresearch to generate a rational means, in Michael Shanks’ words, for “reducing thechaos and complexity of business operations ... the ‘creative fog’ of management de-cision - to the simplicity of the laboratory or the control panel.” (Shanks,1967, p50).Innovation and the management of innovation were largely seen as goal orientedprocesses in which strategic management and planning should play a critical role.The task of management was essentially one of deciding on goals and then planningthe provision of resources - human, physical and informational - to reach those goals.In the 30 years that have elapsed since Beer’s publication of the main text in opera-
A l a n P e n n , J a k e D e s y l l a s a n d L a u r a Va u g h a n • T h e S p a c e o f I n n o v a t i o n

S P A C E S Y N T A X F I R S T I N T E R N A T I O N A L S P A C E S Y N T A X S Y M P O S I U M • L O N D O N � � � �
����
tional research (Beer, 1966), a whole range of ‘scientific’ management techniqueshave been tested and found wanting as ways of accelerating innovation. Whilst man-agement techniques, broadly based on operational research and logistics have hadnotable successes in increasing the efficiency of process based industries and in cer-tain aspects of project management, they have been found somewhat less successfulwhen it comes to innovation in R&D and the creative or knowledge based industries.In these industries somewhat ‘softer’ strategies began to be developed during thelate 1960’s and 1970’s involving ‘brainstorming’ and formal ‘networking’. However, aninvestigation by Tom Allen (Managing the flow of technology, 1977) of informationsources critical to the successful outcome of defence related engineering R&D projectsin the USA raised doubts as to their effectiveness. This research found that informa-tion and ideas critical to successful innovations seldom came either from brainstorm-ing or from larger scale networking. In the case of the former the brainstorminggroup was at best selected on the basis of a current view of the problem at hand andtended to encapsulate a particular viewpoint. In the case of networking, actual con-tact tended to be too infrequent to provide the critical information or stimulus at theprecise time when it was needed. This research did produce evidence, however, thatthe critical information leading to genuine innovations came from outside the imme-diate work group, but within the organisation. Allen surmised that “the inner teamcannot sustain itself without constantly importing new information from the outsideworld...such information is best obtained from colleagues within theorganisation.”(Allen, 1977, p123).
Hopes are now being placed in organisational structures or procedures such as ‘totalquality management’ and ‘reinvention’ to offer increased performance in these areasof work. So far as procedural devices are concerned, the predominant moves havebeen to minimise fixed reporting structures and to develop strategies to increaseindividual responsibility in their place. There is a growing perception that innova-tions tend to come from the grass roots. ‘Managers’ are being replaced by ‘facilitators’and staff are being trained in ‘self management’. The concentration is to develop a‘corporate culture’ conducive to the aims of an organisation, rather than to enforceorganisational aims through a management hierarchy and formal mechanisms.
In terms of organisational structures, the once fashionable matrix organisation hasalready given way to the project team, and the low hierarchy organisational form. Thefashion is currently turning to the network or ‘N-form’ organisation and ‘virtual com-panies’ as structures which make use of the new communications technologies toallow rapid response to a changing business environment. However, each of these isessentially an organisational form proposed in isolation from the particular nature ofan organisation’s work process, the effects of the spatial organisation of work and thedesign of its workplace. Still it seems, the realisation of new organisational forms, andin particular their spatial realisation, is being driven by practice rather than theory.
One of the reasons for this, we believe, is that with few exceptions there has beenlittle in the way of formal research into the effects of the design of the workplace onthe performance of creative or innovative organisations. Recently research using spacesyntax to investigate research laboratory work environments has found evidence thatthe pattern of space in building interiors affects patterns of ‘useful’ interactions be-
P R O C E E D I N G S V O L U M E I • C O M P L E X B U I L D I N G S

S P A C E S Y N T A X F I R S T I N T E R N A T I O N A L S P A C E S Y N T A X S Y M P O S I U M • L O N D O N � � � �
����
tween research groups (Hillier et al 1990; Hillier & Penn,1990; Penn & Hillier 1992).The main finding of this research was that the mean integration of an area of a build-ing, say a floor or a wing, was related to the mean degree to which staff located in thatarea were found ‘useful in their work’ by people from other research groups. Themore integrated the part of the building, the more useful people were found outsidetheir immediate group. This finding also held at the level of whole buildings andorganisations (Figure 1), and suggested that spatial layout could play a key role infacilitating - or inhibiting - the effective use of human resources in innovation basedorganisations.
The mechanism suggested by these findings was that spatial patterns affect patterns ofmovement, and that patterns of movement bring people past other people’s workstations.In the case of research laboratories this contention was supported by an analysis of therelationship between patterns of local movement within a research group area, globalmovement around the building as a whole and the location of interaction within thelaboratory. Local ‘within lab’ movement and local conversation groups were closelyrelated, but under different spatial configurations these focuses of interaction wereeither brought into proximity with, or were separated from, movement around the build-ing as a whole (Hillier & Penn, 1990; Penn & Hillier, 1992).
Research carried out by Hillier et al (Hillier & Grajewski, 1987; Grajewski, 1991)found occupation density and mean spatial integration to be the two main factorsdetermining observed levels of interaction in office environments. The same studyalso found that people in more segregated locations within the work environmentmove more than those in more integrated locations.
Related research using video to capture the precise way in which interactions arise inthe workplace [Backhouse & Drew, 1991] suggested that a mechanism of ‘recruit-ment’ of passers-by into conversation could account for the impact of global spatialstructure on interaction patterns. This research found that over 80% of observedwork related conversations took place in a manner that was unplanned. By observingthe microstructure of non-conversational behaviours the researchers found that thoseinvolved in concentrated work at the workstation were generally held to be ‘unavail-able’ for casual conversations. However, as soon as an individual got up from theirdesk to go somewhere else in the office they were considered to be ‘available’ forinteraction and would be ‘recruited’ into conversation by those that they passed.Since a person sitting at their workstation could never tell when a particular indi-vidual would walk past, the interaction was essentially unplannable. This mechanismcould be held to account for the differences in mean ‘usefulness’ at the level of wholepopulations in different building layouts through the effect of larger scale configura-tion and local visibility in bringing moving, and potentially ‘available’, people intothe field of view of those at the workstation.
These findings give rise to a simple theory of how building design might in principlebe held to relate to organisational function through the construction of the ‘local toglobal’ interface. In particular the pattern of useful work related interaction betweengroups, which Allen had found to be critical to innovation, appears to rely on thisinterface. Two more recent practical studies have shown that these findings also hold
A l a n P e n n , J a k e D e s y l l a s a n d L a u r a Va u g h a n • T h e S p a c e o f I n n o v a t i o n
Figure 1. The correlation of the mean
integration value for each whole build-
ing with the mean useful contact rates
for the seven original buildings in the
sample as reported in Penn & Hillier
1992, but including an eighth laboratory
studied more recently using the same
methodology r=.891, p<.001 .
-3.25
-3
-2.75
-2.5
-2.25
-2
-1.75
-1.5
-1.25
-1
-.75
.8 .85 .9 .95 1 1.05 1.1 1.15 1.2
mean global integration
log
use
ful o
ut o
f gro
up
y = 4.72x - 6.895, R-squared: .793

S P A C E S Y N T A X F I R S T I N T E R N A T I O N A L S P A C E S Y N T A X S Y M P O S I U M • L O N D O N � � � �
����
P R O C E E D I N G S V O L U M E I • C O M P L E X B U I L D I N G S
for more general office organisations. However, these studies and their associateddesign projects have also suggested that a simple maximisation of integration andvisibility may be inadequate to deal with the reality of organisational function in thework environment. We shall suggest that the pursuit of spatial integration to theexclusion of all else can lead to a ‘homogenisation’ of space, resulting in a lack ofgroup identity, or possibly resulting in behaviours, including spatial rearrangementsto the disbenefit of the local to global interface.
3 Company X and its two sitesCompany X is a national energy utility which has recently been privatised. As oneaspect of its strategy to create a new corporate culture the company decided to builda new operational headquarters to replace its existing premises. In order to advise onthe design of the new headquarters building a detailed study of the existing premiseswas carried out, and on the basis of this the early design strategy was modelled andadvice given on spatial strategies to help achieve the main aims of the new corpora-tion.
The existing headquarters building was composed of four building blocks linked intoa single complex by means of a corridor system and bridges at first floor level. Threeof the blocks were two storey linear or square blocks, but the fourth was a sevenstorey tower (Figure 2). The spatial structure of the building was highly segregatingat a global level, with individual business units generally occupying well defined floorsor parts of floors within single blocks. Business units were thus radically separatedfrom each other. Spatial analysis, observations of space use and a questionnaire sur-vey to determine patterns of interaction between business units were carried out.
In the questionnaire survey three staff members from each business unit were askedto report on the frequency with which they encountered staff from each of the otherbusiness units, and the frequency with which they passed through each of the otherbusiness unit work areas. These data were then analysed to assess the degree to whichthe spatial structure of the site could be held to have an effect, firstly on the way thatpeople moved around the buildings during their everyday work, and secondly whetherthere were any detectable effects on reported interaction and encounter betweenbusiness units. The main aim was to see whether staff located in spatially isolatedunits were cited as being less frequently encountered by those from other units, andwhether frequency of encounter could be forecasted from an analysis of the spatialpattern of the building design alone.
The results of the study were conclusive. When business units in which over 25% ofdesks were unoccupied were excluded, there was a significant positive correlationbetween spatial accessibility and the mean frequency with which encounter was citedby other business units (Figure 3). It was clear that encounter and interaction be-tween units was being affected by the spatial isolation inherent in the building lay-out. Although we were unable to bring direct evidence to show that this then had animpact on levels of interaction and innovation in the specific case of Company X,reference to the previous laboratory studies suggested that ‘useful’ work related in-teraction between members of different units was likely to be affected. This was feltto be critical to the success of a company that had moved from being a public sector
Figure 2. Schematic site plan for Com-
pany X original headquarters buildings,
comprising three low blocks and a tower
all linked at first floor level.

S P A C E S Y N T A X F I R S T I N T E R N A T I O N A L S P A C E S Y N T A X S Y M P O S I U M • L O N D O N � � � �
���
utility in a monopoly position to a competitive private sector corporation. It wouldbe critical to the success of the company that new market opportunities and innova-tions be developed and exploited, and that headquarters ‘overheads’ be reduced to aminimum. For both of these reasons high levels of interaction between business unitswere felt to be desirable.
On the basis of these findings we were then asked to analyse the proposed buildingdesign for the new headquarters building, and to suggest ways in which its layoutmight be modified to enhance interaction and communication between businessunits. The main effects of that advice on the design were to bring the main circula-tion routes directly adjacent to the street on either side of the building, and to equal-ise the size of the floor plate on either side and on each floor. It was possible to showthat these design changes would have a significant effect on the degree of spatialaccessibility of each area in the building, and could in principle eliminate isolated‘cold spots’.
Some 18 months after the building was occupied we then returned to carry out apost-occupancy evaluation. This repeated as nearly as possible the methodology usedin the previous site. Two clear differences emerge from the comparison of the twobuildings: the density of the organisation has increased significantly from 5.974 peo-ple per 100 square metres compared to 4.678 on the previous site, an increase inobserved density of nearly 28%. In particular the numbers of people observed to beseated as opposed to standing or moving has increased substantially from 69% of allthose observed to 80%, with levels of movement dropping substantially to just 5%from 11%. The numbers of people observed to be talking has remained almost pre-cisely the same at 36%.
However, according to the respondents to the questionnaire, the frequency with whichother departments in the organisation are visited has increased by 9% from 2.076 to2.267 on a 1 to 5 scale from never to daily. Meetings at the new building are muchmore ‘unplanned’ than in the previous building with 25% of meetings between busi-ness units reported as unplanned and only 11% reported as planned. Meetings alsotake place less at workstations in the new building (Own Desk meetings droppedfrom 38% of responses to 21%, Other Peoples Desk meetings from 50% to 34%).
Movement is lowest inside the workbays and higher on the corridors with peak levelson the bridges that link across the atrium to the stairs. This pattern is depicted graphi-cally in Figures 4 a, b and c which shows the routes taken by different kinds of tripusing movement trails. The highest level of movement is in the middle stairwell bridge(131 people per hour). This reflects the importance of the stairs in the global pat-tern of movement from floor to floor. Figure 4a shows global ‘through movement’predominantly on the corridors and bridges, 4b shows the trails of trips that eitherhad an origin or a destination within the observation area. These take routes linkingthe workbays to the main corridors. Figure 4c shows the trails for local ‘within area’trips. These are predominantly in the internal routes within departmental areas, andmost commonly the links that parallel corridors deeper within the bay.
Figure 3. The correlation between fre-
quency of encounter between business
units and the ratio of local to global in-
tegration for their area r=.898, p<.0001.
1.4
1.6
1.8
2
2.2
2.4
2.6
2.8
2 4 6 8 1 0 1 2 1 4 1 6LocalIntegMax/GlobalIntegMax
Ave
rg.F
requ
ency
/ e.
y = .068x + 1.464, R-squared: .806
A l a n P e n n , J a k e D e s y l l a s a n d L a u r a Va u g h a n • T h e S p a c e o f I n n o v a t i o n

S P A C E S Y N T A X F I R S T I N T E R N A T I O N A L S P A C E S Y N T A X S Y M P O S I U M • L O N D O N � � � �
����
fax
fax
fax
fax
fax
fax
fax
fax
fax
P R O C E E D I N G S V O L U M E I • C O M P L E X B U I L D I N G S
Figure 4.a.through movement;
Figure 4.b. movement to and from desk
locations within the observation area;
Figure 5. Company X static space use
and interaction.
.Inside the cellular formal meeting rooms there is interaction where all participantsare seated and a meeting is taking place. Some areas of the open plan also containmeeting tables with many seated people that exhibit similar patterns of use. In the
The main corridors have very little internal movement and carry predominantlythrough movement with a large proportion of to and from movement. This patternhas two important consequences. ‘Strangers’ who are just passing through do notenter the department spaces without a specific person to visit, and local workers donot tend to use the public corridors for a large proportion of internal journeys. Thusthere is a separation of localised movement from globalised movement. Where mix-ing does take place it is on the entry lines from the corridor to the work bays. How-ever, this separation is apparently not perceived as such by the building users. Themean frequency cited by questionnaire respondents for passing through other busi-ness units is 9% higher than in the previous premises. This may be on account of thehigh degree of visual openness in the floor layout, and the use of low screens andstorage units within work bays.
Figure 5 shows that interaction (circles around talking groups) can be seen to takeplace in a number of different kinds of location and can be divided into formal orplanned meetings and informal, unplanned interactions
Figure 4.c) local movement within the
observation area.
Figure 4. Company X patterns of movement.

S P A C E S Y N T A X F I R S T I N T E R N A T I O N A L S P A C E S Y N T A X S Y M P O S I U M • L O N D O N � � � �
���
A l a n P e n n , J a k e D e s y l l a s a n d L a u r a Va u g h a n • T h e S p a c e o f I n n o v a t i o n
open plan work areas single seated workers do not tend to be interacting with eachother, reflecting the fact that they are getting on with work. However there is interac-tion between seated and standing people, reflecting a visitor at a person’s desk ininteraction with them.
In the corridors there is quite a lot of interaction taking place between standingpeople and the seated people just inside the workbays. This is apparently unplannedinteraction between passing people and the most visible people seated near the cor-ridor. A further kind of interaction can be detected in the stairwell bridges betweenstanding people. Here both the participants are probably ‘movers’ and the interac-tion is taking place either whilst making drinks at the coffee area or passing on thestairs. The result of these patterns is that we can show statistically that the number oftalking people within a business unit’s area depends first and foremost on the densityof movement within the area (Table 1).
Table 1Talk against 3 x-variables r= .519, p=.0053
sit/area 1.076 .2882stand/area 1.066 .2926mov/ area 2.557 .0145
All this suggests that the new building is indeed far more ‘generative’ in the way thatit functions than the previous building. However the predominance of seated activityrelative to other activities is very marked at the new building as is the decrease inlevels of movement. We believe that this is a result of the great degree of opennessand accessibility almost everywhere in the building. It has been noted in the past thatpeople in more integrated parts of buildings move less than those in more segregatedareas. In this case the entire building is highly integrated and we believe that this hasled to a reduced perceived need to leave the workstation in order to gain the benefitof interaction.
There is, however, a potential problem which has emerged from the way that thebuilding was designed. During the final stages of design it was decided that spaceplanning should be carried out ‘in-house’ in direct consultation with the managers ofeach business unit. This has led to a wide variety of detailed local circulation con-figurations all using a single standard set of furnishings and fittings. The net result isthat although every work bay is visually very open, the configuration of movementspaces within the bays has developed the separation of through movement from in-ternal movement shown in the Figure 4 movement trails. There appears to be a natu-ral tendency, in the face of a high degree of global integration, for business unitmanagers to configure their space to allow for internal movement away from theglobal movement structure. We believe that this may be a response to a perceivedneed to create and reproduce the local group identity, which is threatened by thelarger scale structure of the both the building and the organisation.
4 Company Y and the K House premisesA second case study has allowed us to investigate these factors further. Company Y isa mutidisciplinary advertising and marketing agency. It singles itself out from its com-petition by offering a client ‘centred’ service. That is a service which is not deter-mined by the traditional structure of the advertising industry, but tailored to the
Table 1. Multiple regression of numbers
of observed talking people per business
unit with the metric density of different
types of activity.

S P A C E S Y N T A X F I R S T I N T E R N A T I O N A L S P A C E S Y N T A X S Y M P O S I U M • L O N D O N � � � �
����
particular needs of the client in question. The key features of their strategy lie inthinking innovatively to define a client’s needs and to involve the consumer as far aspossible in the campaign. In this sense Company Y marks itself out according to a‘process’ style rather than a ‘product’ style - the campaigns all look and feel different,but all innovate and use the potentials of the media to promote their client’s productsand services. In order to do this Company Y has organised its work around projects orcampaigns rather than according to professional disciplines and brings together anappropriate team of disciplines for a client’s specific needs. It calls this approach ‘3-dimensional marketing’.
Company Y is also distinctive in that it has explicitly developed ways of trying tomaximise innovation and the degree of random communication between staff onwhich it believes that the ‘3-d marketing’ concept depends. People are assigned desklocations more or less randomly. Neither departments representing the traditionaldisciplines in the profession, nor projects or campaigns are assigned specific spatialareas in the office. Both departments and projects come together in programmedmeetings, but the spatial location of individuals is used to randomise and bring peo-ple in contact with people working on other projects or from other disciplines. Theuse of space to randomise contacts is reinforced by a ‘six monthly move’ in whichmost people are ‘shuffled’ and move to new desk locations. This serves three mainpurposes: people sit next to new people and so develop different sets of contacts;nobody is assigned to a poor location for ever; and it helps to eliminate clutter. Thereare also other ‘shuffling mechanisms’ in operation such as a ban on internal telephonecalls and memoranda. If you want to speak you get up and move through the office.Conversations are face to face, and the walk takes you past other people and in-creases the chance of opportunistic meetings.
This concentration on maximising random interaction is to the best of our knowl-edge unique. Most other organisations either assign areas of their offices to discipli-nary groups or to project teams and use spatial correspondence to help reproducesome part of the organisational structure. The decision to spatialise neither is novel,and means that any reproduction of organisational structures must rely largely on‘transpatial’ means such as monthly group meetings. This clearly places an onus onthe generation of new organisational and social forms rather than their conservation,and makes any reproduction more explicit and so open to view and criticism.
Company Y has grown since it was first set up eight years ago. Initially it occupiedonly two thirds of the fifth floor of K House, then it took on the remaining third, andfinally it took on one third of the fourth floor. The fifth floor office area is relativelysimple in design conception, and makes an effective use of interior layout to over-come one of the main problems of the design of K House. K House is arranged as asquare footprint with central stairs and lifts, light well, toilets and escape stairs. Theremaining usable space makes a ‘horseshoe’ which is entered from the stairs and lifton one or other side. This building plan effectively separates the three sides of thehorseshoe from each other. The interior layout on the fifth floor makes use of acurving red wall to enclose a set of meeting rooms on the lightwell side of the corri-dor and at the same time to help eliminate the boundary between the three seg-ments of the horseshoe - as you move around the corridor you always have a red wall
P R O C E E D I N G S V O L U M E I • C O M P L E X B U I L D I N G S
S P A C E S Y N T A X F I R S T I N T E R N A T I O N A L S P A C E S Y N T A X S Y M P O S I U M • L O N D O N � � � �
�����
on your left, and, since the wall is curved, the view opens up ahead continuously,rather than as a series sudden transitions that would have resulted from straight wallsand corners. The effect is subtle and tends to unify or ‘straighten’ the corridor, atleast perceptually. It can be argued that in unifying the space of the fifth floor theeffect is also to lose a sense orientation and to homogenise space - all parts of thefifth floor tend to feel similar rather than offer a range of different environments.
The fourth floor feels quite different. First, it has nowhere near the same feeling ofactivity and liveliness as the fifth floor. The interior fitout has been designed withalmost precisely the opposite intentions to the fifth floor. Instead of homogenising andunifying space, the designers have sought to provide a range of different kinds of space,and to use the built fabric and decor to distinguish between them. A strong distinctionis made between circulation space and workstation areas which are divided from eachother by a galvanised metal screen wall. We understand that from its initial occupationit was clear that the fourth and fifth floor did not work well together.
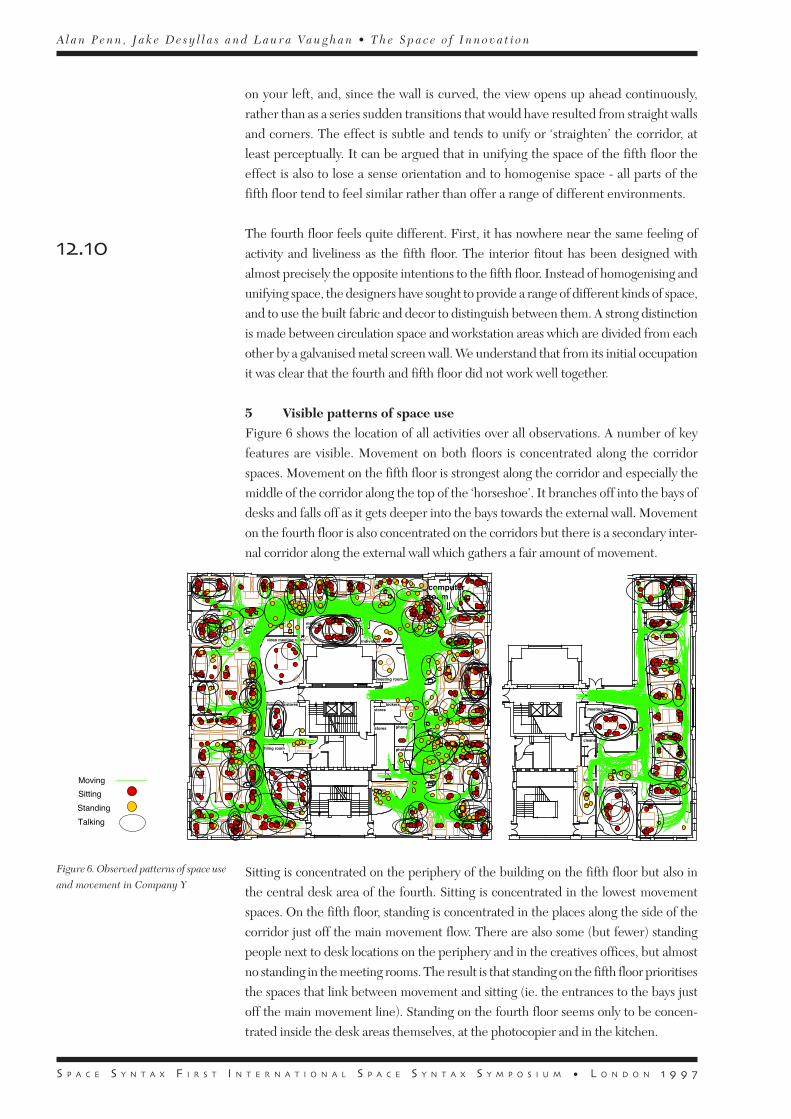
5 Visible patterns of space useFigure 6 shows the location of all activities over all observations. A number of keyfeatures are visible. Movement on both floors is concentrated along the corridorspaces. Movement on the fifth floor is strongest along the corridor and especially themiddle of the corridor along the top of the ‘horseshoe’. It branches off into the bays ofdesks and falls off as it gets deeper into the bays towards the external wall. Movementon the fourth floor is also concentrated on the corridors but there is a secondary inter-nal corridor along the external wall which gathers a fair amount of movement.
cleaner
meeting room
vmeeting room
kitchen
Entrance
V
photo copier
kitchen
stores
photocopy
lockersdesk
phone
stores
meeting room
individual work
meeting room
video meeting room
meeting/quiet room
stores
filing room
meeting room
Entrance
Reception
computerroom
V
V
V
V
photo copier
Figure 6. Observed patterns of space use
and movement in Company Y
walking
standing
sitting
talking
Moving
Sitting
Standing
Talking
A l a n P e n n , J a k e D e s y l l a s a n d L a u r a Va u g h a n • T h e S p a c e o f I n n o v a t i o n
Sitting is concentrated on the periphery of the building on the fifth floor but also inthe central desk area of the fourth. Sitting is concentrated in the lowest movementspaces. On the fifth floor, standing is concentrated in the places along the side of thecorridor just off the main movement flow. There are also some (but fewer) standingpeople next to desk locations on the periphery and in the creatives offices, but almostno standing in the meeting rooms. The result is that standing on the fifth floor prioritisesthe spaces that link between movement and sitting (ie. the entrances to the bays justoff the main movement line). Standing on the fourth floor seems only to be concen-trated inside the desk areas themselves, at the photocopier and in the kitchen.

S P A C E S Y N T A X F I R S T I N T E R N A T I O N A L S P A C E S Y N T A X S Y M P O S I U M • L O N D O N � � � �
�����
Talking in the building is divided between talking in meeting rooms (where every-body sits and the meeting is programmed) and talking that takes place where sittingand standing, or standing groups of people are in contact. This appears to be a morecasual and unplanned form of contact. On the fifth floor there is quite a lot of talkingbetween standing people themselves just off the main movement flows where theyare still close to the movement flow, but just out of the way to avoid being trampledon. Talking on the fourth floor is concentrated only in meeting rooms or cellularoffices and is very predominantly between seated people.
6 Activity ratiosThe ratio of standing people compared with seated people is of interest becausestanding people tend to be visiting other people (either in a planned visit to a seatedperson or an unplanned stop to chat with someone) whereas sitting people tend to beinhabiting a space. The ratio of standing to sitting can thus be seen as measure of theamount of visiting which is taking place in an area.
The ‘visiting’ ratio varies radically between the fifth floor and the fourth floors asshown in Table 2 which also gives the mean count per round for sitting and standingpeople on each floor.
P R O C E E D I N G S V O L U M E I • C O M P L E X B U I L D I N G S
This shows that there are almost double the number of sitting people to standingpeople on the fourth floor compared to the fifth. This difference is not really explica-ble in terms of the smaller size of the fourth floor since this should lead to a lowernumber of both types of activity and not necessarily a lower ratio. If we look at theratio of desk spaces available on each floor to observed sitting people per round(Table 3), we find even in terms of seated activity the fourth floor is less denselyoccupied than the fifth:
Table 2all stand all sitting ratio
stand/sit
5th floor 10.45 39.05 0.274th floor 1.50 10.15 0.15
Table 2. Visiting ratio
Table 3desks all sitting desks/sitter
5th floor 86 39.05 2.24th floor 26 10.15 2.6
Taken together with the ‘visiting’ ratio, this suggests that the occupants of the fourthfloor spend more of their time away from their desks than those on the fifth, and arevisited less. Although there is obviously a certain amount of visiting within a floor(for example where a person on the fourth is visiting another on the same floor), theoverall ratio is still dramatically different.
7 Spatial analysis of K HouseThe maps in Figure 7 are ‘all line’ axial maps. These represent all the possible longestlines of movement on each floor (each floor is considered separately here) consider-ing furniture as a barrier to movement. The grey scale of each line represents itsdegree of integration. The striking similarities of the maps in Figure 7 to the patternof movement observed in Figure 6 points to a fundamental relationship between the
Table 3. Available desks per seated per-
son per observation round.

S P A C E S Y N T A X F I R S T I N T E R N A T I O N A L S P A C E S Y N T A X S Y M P O S I U M • L O N D O N � � � �
�����
structure of space and movement. The number of lines along the corridor spaces ismuch greater than in dead ends (as in the movement map), and the most integratedarea of the axial map along the top of the horseshoe is also the area where the peak ofmovement occurs.
The effect is more systematic than this. A series of notional ‘gates’ on the fifth floorwere selected as measurement points at which to compare the total number of mov-ing people who passed and the number and degree of integration of axial lines in theall line model in Figure 7. As can be seen in the scattergram below (Figure 8), thereis a strong relationship between the movement observed on the fifth floor and themean integration value of the lines that cross that ‘gate’. However, there are someplaces in the axial map where the model shows strong integration but the movementfalls off, particularly at the end of corridors. This is demonstrated statistically in Fig-ure 8, which shows a clear split in the relationship of movement to the average inte-gration of passing lines.
- 2 5
0
2 5
5 0
7 5
100
125
150
175
200
225
3 3.5 4 4.5 5 5.5 6 6.5 7 7.5mean global int of passing lines
tota
l mov
emen
t thr
ough
gat
e
y = 59.634x - 213.372, R-squared: .919
Figure 7. Global integration in the all line
map for the two floors of Company Y.
The gate locations on the bottom leg of the scatter are those on the entrance to deadend spaces where integrated axial lines penetrate but movement falls off becausethere is nowhere else to go. By excluding these dead end gates a very clear relation-ship is produced (Figure 9). This is possibly a first demonstration of the ability of theall line map to account for differences in movement rates segment by segment alongthe length of an axial alignment. The correlation is also considerably stronger at r=.959than that found using the fewest line map (r=.72).
These findings point to a number of fundamental relationships. The structure ofspace has been shown to play an important role in structuring the pattern of move-ment. Axial lines are important in the structure of space because they link spacestogether linearly and in this sense an axial line represents a possible movement route.The way that these movement routes are used by people results in the middle of theline being more heavily used than the end because there are fewer possible routesthat take you through the ends.
Figure 9. Mean integration value of all
lines passing through a gate and move-
ment for the fifth floor, excluding gates
to dead end spaces, r=.959, p=.0001
Figure 8. Movement and mean integra-
tion value of lines, r=.502 p=.0001
- 2 5
0
2 5
5 0
7 5
100
125
150
175
200
225
3 3.5 4 4.5 5 5.5 6 6.5 7 7.5mean global int of passing lines
tota
l mov
emen
t thr
ough
gat
e
y = 28.096x - 98.324, R-squared: .252
A l a n P e n n , J a k e D e s y l l a s a n d L a u r a Va u g h a n • T h e S p a c e o f I n n o v a t i o n
S P A C E S Y N T A X F I R S T I N T E R N A T I O N A L S P A C E S Y N T A X S Y M P O S I U M • L O N D O N � � � �
�����
Another important factor in the spatial structure of the building is the relationship ofthe internal spaces to the entrance in terms of changes of direction, or steps of depthin the axial map.
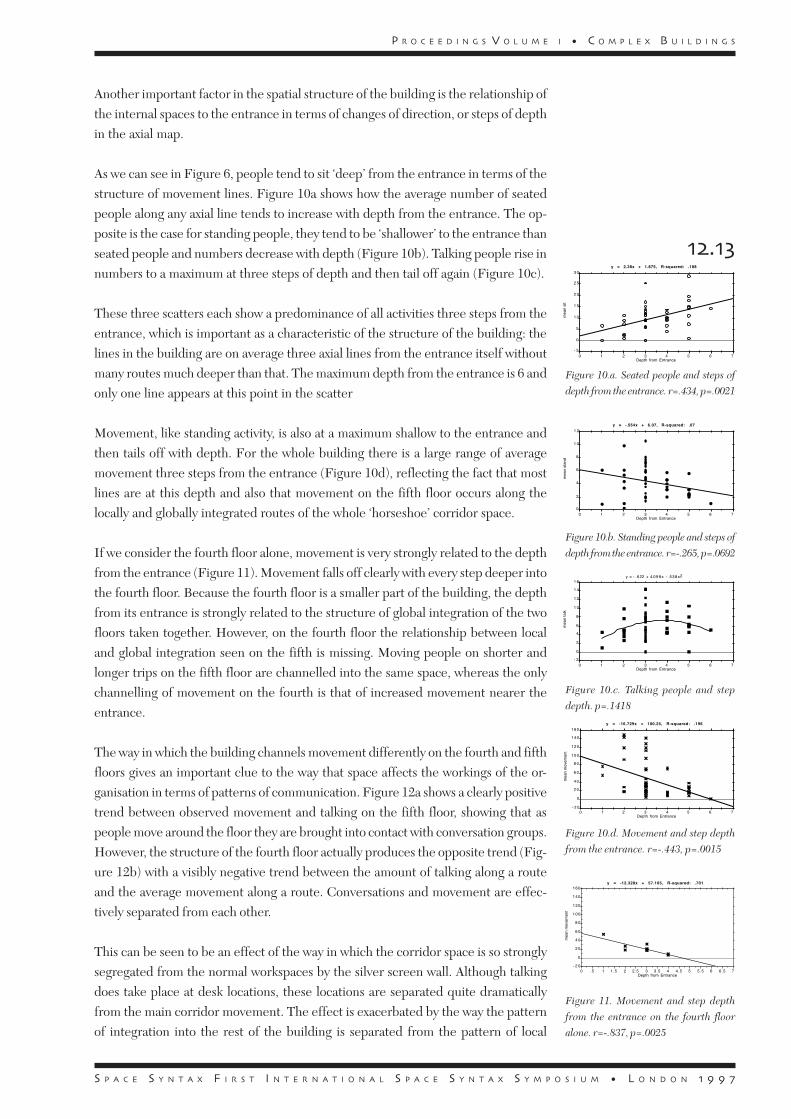
As we can see in Figure 6, people tend to sit ‘deep’ from the entrance in terms of thestructure of movement lines. Figure 10a shows how the average number of seatedpeople along any axial line tends to increase with depth from the entrance. The op-posite is the case for standing people, they tend to be ‘shallower’ to the entrance thanseated people and numbers decrease with depth (Figure 10b). Talking people rise innumbers to a maximum at three steps of depth and then tail off again (Figure 10c).
These three scatters each show a predominance of all activities three steps from theentrance, which is important as a characteristic of the structure of the building: thelines in the building are on average three axial lines from the entrance itself withoutmany routes much deeper than that. The maximum depth from the entrance is 6 andonly one line appears at this point in the scatter
Movement, like standing activity, is also at a maximum shallow to the entrance andthen tails off with depth. For the whole building there is a large range of averagemovement three steps from the entrance (Figure 10d), reflecting the fact that mostlines are at this depth and also that movement on the fifth floor occurs along thelocally and globally integrated routes of the whole ‘horseshoe’ corridor space.
If we consider the fourth floor alone, movement is very strongly related to the depthfrom the entrance (Figure 11). Movement falls off clearly with every step deeper intothe fourth floor. Because the fourth floor is a smaller part of the building, the depthfrom its entrance is strongly related to the structure of global integration of the twofloors taken together. However, on the fourth floor the relationship between localand global integration seen on the fifth is missing. Moving people on shorter andlonger trips on the fifth floor are channelled into the same space, whereas the onlychannelling of movement on the fourth is that of increased movement nearer theentrance.
The way in which the building channels movement differently on the fourth and fifthfloors gives an important clue to the way that space affects the workings of the or-ganisation in terms of patterns of communication. Figure 12a shows a clearly positivetrend between observed movement and talking on the fifth floor, showing that aspeople move around the floor they are brought into contact with conversation groups.However, the structure of the fourth floor actually produces the opposite trend (Fig-ure 12b) with a visibly negative trend between the amount of talking along a routeand the average movement along a route. Conversations and movement are effec-tively separated from each other.
This can be seen to be an effect of the way in which the corridor space is so stronglysegregated from the normal workspaces by the silver screen wall. Although talkingdoes take place at desk locations, these locations are separated quite dramaticallyfrom the main corridor movement. The effect is exacerbated by the way the patternof integration into the rest of the building is separated from the pattern of local
- 2 0
0
2 0
4 0
6 0
8 0
100
120
140
160
0 .5 1 1.5 2 2.5 3 3.5 4 4.5 5 5.5 6 6.5 7Depth from Entrance
mea
n m
ovem
ent
y = -12.328x + 57.105, R-squared: .701
- 2 0
0
2 0
4 0
6 0
8 0
100
120
140
160
0 1 2 3 4 5 6 7Depth from Entrance
mea
n m
ovem
ent
y = -16.729x + 100.25, R-squared: .196
- 2
0
2
4
6
8
1 0
1 2
1 4
1 6
0 1 2 3 4 5 6 7Depth from Entrance
mea
n ta
lk
y = - .622 + 4.098x - .538x2
0
2
4
6
8
1 0
1 2
0 1 2 3 4 5 6 7Depth from Entrance
mea
n st
and
y = -.554x + 6.07, R-squared: .07
Figure 11. Movement and step depth
from the entrance on the fourth floor
alone. r=-.837, p=.0025
Figure 10.d. Movement and step depth
from the entrance. r=-.443, p=.0015
Figure 10.c. Talking people and step
depth. p=.1418
Figure 10.b. Standing people and steps of
depth from the entrance. r=-.265, p=.0692
Figure 10.a. Seated people and steps of
depth from the entrance. r=.434, p=.0021
- 5
0
5
1 0
1 5
2 0
2 5
3 0
0 1 2 3 4 5 6 7Depth from Entrance
mea
n si
t
y = 2.38x + 1.875, R-squared: .188
P R O C E E D I N G S V O L U M E I • C O M P L E X B U I L D I N G S

S P A C E S Y N T A X F I R S T I N T E R N A T I O N A L S P A C E S Y N T A X S Y M P O S I U M • L O N D O N � � � �
�����
integration on the floor itself. This means that even local movement on the floor iseffectively removed from in to out movement with the result that the spatial mecha-nism for engineering random contact and exchange of information has been practi-cally eliminated.
Looked at in this way we can see movement as a resource which takes people pastothers’ desk locations. This works as a randomising or ‘shuffling’ mechanism so longas patterns of movement and desk locations are themselves shuffled, and so long asmovement is available to those seated at desks. As soon as one begins to spatiallydifferentiate a building layout two things follow. First, we may pull apart differentpatterns of movement, the in to out movement and the internal movement on thefourth floor for instance, and so affect the probabilities that different groups of staffwill meet. Second, we may create more and less desirable desk locations either giv-ing these out to staff according to status or according to the functional requirementsof their job (I’m a ‘creative’ so I need to think or be noisy or whatever). Each of thesetends to build in a more permanent structure that conserves a particular subdivision ofthe organisation by affecting the probabilities that different groups will see each other.
The first and most noticeable effect on the fourth floor is simply the removal of the‘generative’ interface. The longer term effect of this type of spatial differentiation couldbe the fossilisation of particular organisational structures, so inhibiting the ability ofthe organisation to evolve and respond to changing demands from its market.
8 Facilities and resourcesThe previous section has shown how it is possible to analyse the movement routes of thebuilding as axial lines and to show how activities are organised with respect to thesemovement routes. It suggested the pattern of movement itself is a key resource affordedby the building to a particular desk location. The next stage of the analysis is to move fromroutes to individual spaces and to consider the way that the building structures the avail-ability of other people engaged in different types of activity. To do this, the building wasdivided into more or less convex spaces defined by workstations and partitions.
Just as one movement route passes through a number of spaces, any convex spacemay have a greater or lesser number of available routes that get into it. The numberof other spaces that are linked directly to any space by axial lines will differ depend-ing on how strategic the available lines are. The accessibility (and thus strategic valuein the building as a whole) of a line can be measured by its integration. The sum ofintegration of all lines within a space is a very clear predictor (Figure 13a) of theamount of movement that is available to someone in that space (the number of mov-ing people that that person can see and move directly to). The relationship of avail-able sitting people to the accessibility of a location is also positive, but a much messierfit than that of all the available movement (Figure 13b). This is because seated peo-ple tend to be in the less integrated spaces at the periphery. Although the morestrategic lines will tend to link a space to more seated people, there are some strategiclines that do not have so many seated people along them and vice versa. Thus seatedpeople are not located as sensitively to accessibility as moving people and the seatinglocations vary more in the degree to which they are strategic. The total number ofstanding people available is more clearly linked to the accessibility of a location be-
- 2 0
0
2 0
4 0
6 0
8 0
100
120
140
160
- 1 0 - 5 0 5 1 0 1 5 2 0 2 5 3 0 3 5 4 0 4 5 5 0sum talk
mea
n m
ovem
ent
y = 1.623x + 7.236, R-squared: .21
Figure 12.a. Mean movement and talking
for the fifth floor alone. r=.458, p=.0038;
- 2 0
0
2 0
4 0
6 0
8 0
100
120
140
160
- 1 0 - 5 0 5 1 0 1 5 2 0 2 5 3 0 3 5 4 0 4 5 5 0sum talk
mea
n m
ovem
ent
y = -.944x + 33.632, R-squared: .374
Figure 12.b. Movement and talking on
the fourth floor alone. r=-.612, p=.0601
Figure 13.a. Sum of available movement
from a convex space and sum of global
integration of the lines that enter it.
r=.951, p=.0001
- 1 0 0
0
100
200
300
400
500
600
700
800
900
0 2 4 6 8 1 0 1 2 1 4 1 6 1 8sum line global int
all a
vaila
ble
mov
emen
t fro
m s
pace
y = 55.89x - 27.442, R-squared: .904
A l a n P e n n , J a k e D e s y l l a s a n d L a u r a Va u g h a n • T h e S p a c e o f I n n o v a t i o n

S P A C E S Y N T A X F I R S T I N T E R N A T I O N A L S P A C E S Y N T A X S Y M P O S I U M • L O N D O N � � � �
�����
cause standing people are more closely associated with movement than seated peo-ple (Figure 13c), since standing usually implies that a person has just moved or isabout to move. These results confirm what we have already noted on the observationmaps. That movement is shallow, sitting deep and standing somewhere in between.The number of talking people available to a space is also well predicted by the aver-age accessibility of its lines (Figure 13d).
The implication of these correlations is that a person’s location directly affects the possi-bility of contact with others. The more accessible spaces in the building have a greaternumber of people both visible and directly reachable. Figure 14 shows the powerfulcorrelation between all people available to a space and that space’s sum of line integra-tion values. This means that the spatial structure of the building can integrate or segre-gate people from other people, controlling their availability by spatial differentiation.
These effects might seem fairly simple, however they become more complex whendifferent categories of people have differential access to different parts of a building.The cellular offices allocated to the creatives are a case in point. The creatives havea relatively privileged position in the organisation as they can choose either to segre-gate themselves in their offices or to move through the more public areas and takeadvantage of the presence and availability of others to generate interaction.
The effect of the higher degree of variation in different sitting locations so far asavailability is concerned is shown through the relative dispersion of the scattergramin Figure 15a. In some spaces (those above the regression line) available people aremainly seated, in others the majority are not seated, and this varies quite radicallyfrom location to location. Other categories of activity such as movement (Figure 15b),static (Figure 15c) and talking people (Figure 15d) are all much less differentiated intheir locations so far as availability to others is concerned. The clearest relationship isbetween talking people available from a space and all people available from a space(Figure 15d). This shows first, that interaction arises out of presence of people, andsecond that interaction is only spatially differentiated according to the degree thatpresence or absence of people in general is spatially differentiated.
If people are to be considered as a resource and interaction as the way that thisresource is made use of, then the function of spatial differentiation appears to be tomodify or control the way that the resource is used. I this sense we might considerthe spatial differentiation of the work environment as consituting a ‘facility’ whichconserves and brings human resources to bear in the requisite mass to tackle thespecific tasks posed by the organisation. These tasks are undoubtedly ‘structured’: attimes one requires interaction, at others privacy; and often there are specific groupsof people that need to interact but without interruption from others. If this is thecase then one might expect activities within a space to be affacted by those ‘available’from that space is some more or less structured way, and so to be detectable.
9 Differentiation of space and activitiesThe number of people available - all those visible and directly reachable - from aspace can be compared to the activity that takes place within the space itself. Thiseffectively compares what is going on in a space with what is going on in and around
- 5 0
0
5 0
100
150
200
250
300
350
400
450
500
0 2 4 6 8 1 0 1 2 1 4 1 6 1 8sum line global int
all a
vaila
ble
peop
le
y = 34.004x - 1.924, R-squared: .912
Figure 14. All available people and sum
of line integration. r=.955, p=.0001
Figure 15.b. All available people and
available movement. r=.966, p=.0001
- 2 0
0
2 0
4 0
6 0
8 0
100
120
140
160
180
200
- 5 0 0 5 0 100 150 200 250 300 350 400 450 500all available people
rela
tive
all a
vaila
ble
mov
emen
t
y = .355x - 4.543, R-squared: .934
Figure 15.a. All available people and all
available seated people. r=.899, p=.0001
0
5 0
100
150
200
250
300
350
400
0 5 0 100 150 200 250 300 350 400 450 500all available people
all a
vaila
ble
sitti
ng fr
om s
pace
y = .668x + 37.295, R-squared: .808
Figure 13.d. Available talking and sum
of line integration. r=.929, p=.0001
- 5 0
0
5 0
100
150
200
250
300
0 2 4 6 8 1 0 1 2 1 4 1 6 1 8sum line global int
all a
vaila
ble
talk
ing
from
spa
ce
y = 21.584x + 4.174, R-squared: .863
- 5 0
0
5 0
100
150
200
250
300
0 2 4 6 8 1 0 1 2 1 4 1 6 1 8sum line global int
all a
vaila
ble
stan
ding
from
spa
ce
y = 18.059x - 6.631, R-squared: .928
Figure 13.c. Available standing and the
sum of line integration. r=.963, p=.0001
Figure 13.b. Available seated people and
sum of line integration. r=.811, p=.0001
- 5 0
0
5 0
100
150
200
250
300
350
400
0 2 4 6 8 1 0 1 2 1 4 1 6 1 8sum line global int
all a
vaila
ble
sitti
ng fr
om s
pace
y = 22.691x + 28.007, R-squared: .657
P R O C E E D I N G S V O L U M E I • C O M P L E X B U I L D I N G S

S P A C E S Y N T A X F I R S T I N T E R N A T I O N A L S P A C E S Y N T A X S Y M P O S I U M • L O N D O N � � � �
����
it. Figure 16 shows the relationship of all talking within a space compaxred to thetotal availability of people in and around it. The scattergram is clearly split into an L-shape. The split distinguishes two different types of space. In the upper limb of thescatter the number of talking people in a space rises with little increase in the numberof available people around it. In the lower limb the number of people available aroundthe space outstrips those talking within it by a large margin. This means that thereare some spaces where the only people available are those that are talking within thespace itself. These are the meeting rooms and cellular offices.
Obviously a meeting as a programmed event seeks to minimise disturbance by other‘available’ people. This can be seen in the scatter of the fifth floor with the meetingrooms and cellular offices removed (Figure 16b). Much of the upper limb of thescatter has gone. The scatter is still fairly dispersed with some spaces having rela-tively high numbers of talking people and less available people than one might ex-pect. These turn out to be parts of the general open plan area that, due to theirisolation, are behaving more or less like cellular spaces. This is particularly the casefor the two outliers circled on the scatter which are effectively walled in to becomequite distinct bays as the furniture and storage is beginning to restrict their availablelines of movement.
On the fourth floor the the general open plan spaces alone still exhibit the bifurcation.The majority of the unprogrammed spaces (circled on Figure 17) are behaving morelike meeting rooms or programmed spaces: the only talking available to them is withintheir own space. This is a direct effect of the silver screen wall and the narrowness ofboth the front and back corridor spaces. The effect is to more or less limit interactionto that between neighbouring desks or to planned meetings taking place at a desk.
10 Useful communicationsIn order to examine the network of contacts between people working at Company Y,a questionnaire was created and distributed among staff. The questionnaire methodprecisely mirrored previous surveys in scientific research laboratories, and this inprinciple allows a comparison of results between the two different organisation types.The questionnaire listed by name all staff in the company. Respondents were askedto tick a box on a one to five scale (daily to never) to indicate how frequently they saweach name, to indicate whether they found them useful in their work and whetherthey worked with them regularly. The latter question was asked in order to be able toseparate out citations of usefulness of people within an individual’s project team orworking group, and citations of usefulness by those who did not have a direct work-ing relationship with the person concerned.
An important finding of the survey is that how useful a person is on average to every-one who answered the questionnaire correlates with the average frequency with whichpeople say that they see that person (Figure 18a). This means that the usefulness ofa person is at least to a measurable extent derived from the frequency of contact withothers and not just from their own personal qualities, their status or their job. Thetrend is very powerful and significant even at the level of the whole staff list. Thedegree of dispersion of this scattergram is a product of the fact that people are usefulbecause of other things: their status, knowledge and skills are all clearly important.
- 1 0 0
0
100
200
300
400
500
600
- 5 0 0 5 0 100 150 200 250 300 350 400 450 500all available people
all a
vaila
ble
stat
ic fr
om s
pace
y = 1.228x + 20.883, R-squared: .951
Figure 15.c. All available people and
available static people. r=.975, p=.0001
Figure 17. Talking within and available
people, fourth floor open plan areas only.
r=.443, p=.1296
-5
0
5
10
15
20
25
30
-50 0 50 100 150 200 250 300 350 400 450 500all available people
all t
alki
ng w
ithin
con
vex
spac
e
y = -.073x + 4.722, R-squared: .196
Figure 16.b. Talking within a space and
all available people, fifth floor open plan
areas only. r=.313, p=.036
-5
0
5
10
15
20
25
30
-50 0 50 10 0 150 200 2 50 300 350 4 00 450 500all available people
all
talk
ing
wit
hin
co
nve
x s
pac
e
y = .0 1 6 x + 4 .0 2 6, R -squ ared : . 09 8
- 5
0
5
1 0
1 5
2 0
2 5
3 0
- 5 0 0 5 0 100 150 200 250 300 350 400 450 500all available people
all t
alki
ng w
ithin
con
vex
spac
e
y = .011x + 5.478, R-squared: .026
Figure 16.a. The relationship between
those talking within a space and those
available to that space by means of the
lines that enter it. r=.161, p=.147
- 5 0
0
5 0
100
150
200
250
300
- 5 0 0 5 0 100 150 200 250 300 350 400 450 500all available people
all a
vaila
ble
talk
ing
from
spa
ce
y = .645x + 4.543, R-squared: .979
Figure 15.d. All available people and
available talking. r=.989, p=.0001
A l a n P e n n , J a k e D e s y l l a s a n d L a u r a Va u g h a n • T h e S p a c e o f I n n o v a t i o n
S P A C E S Y N T A X F I R S T I N T E R N A T I O N A L S P A C E S Y N T A X S Y M P O S I U M • L O N D O N � � � �
�����
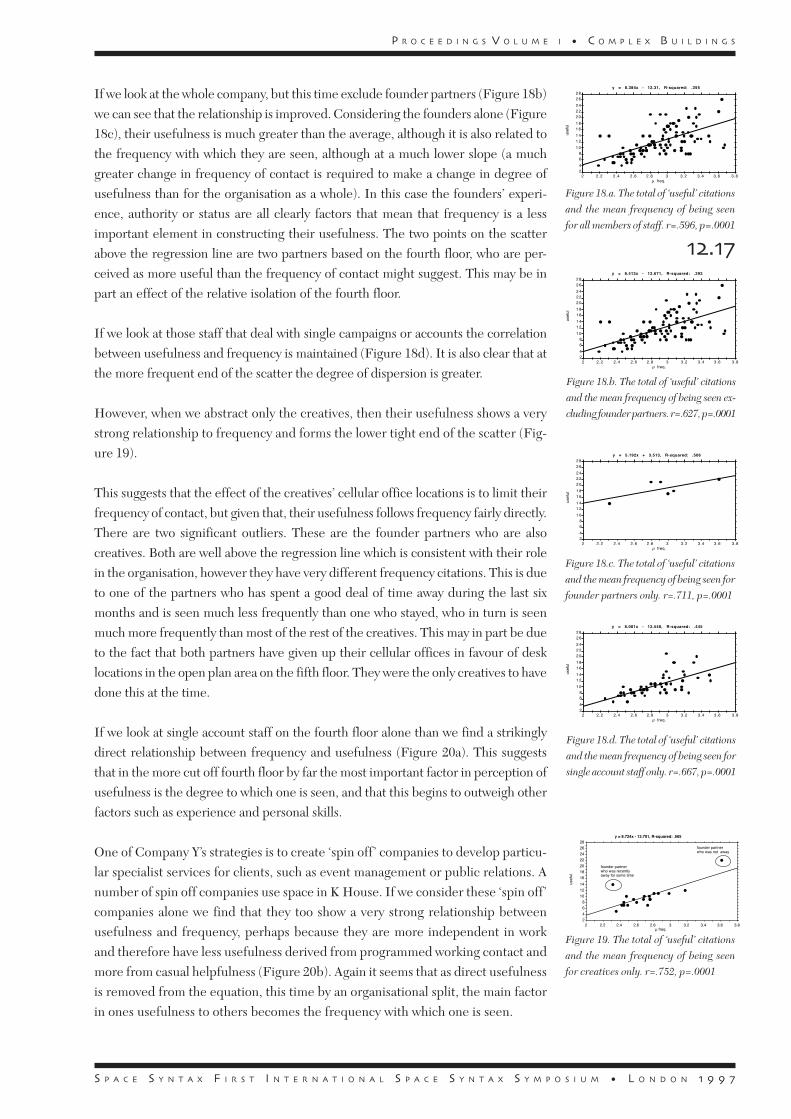
If we look at the whole company, but this time exclude founder partners (Figure 18b)we can see that the relationship is improved. Considering the founders alone (Figure18c), their usefulness is much greater than the average, although it is also related tothe frequency with which they are seen, although at a much lower slope (a muchgreater change in frequency of contact is required to make a change in degree ofusefulness than for the organisation as a whole). In this case the founders’ experi-ence, authority or status are all clearly factors that mean that frequency is a lessimportant element in constructing their usefulness. The two points on the scatterabove the regression line are two partners based on the fourth floor, who are per-ceived as more useful than the frequency of contact might suggest. This may be inpart an effect of the relative isolation of the fourth floor.
If we look at those staff that deal with single campaigns or accounts the correlationbetween usefulness and frequency is maintained (Figure 18d). It is also clear that atthe more frequent end of the scatter the degree of dispersion is greater.
However, when we abstract only the creatives, then their usefulness shows a verystrong relationship to frequency and forms the lower tight end of the scatter (Fig-ure 19).
This suggests that the effect of the creatives’ cellular office locations is to limit theirfrequency of contact, but given that, their usefulness follows frequency fairly directly.There are two significant outliers. These are the founder partners who are alsocreatives. Both are well above the regression line which is consistent with their rolein the organisation, however they have very different frequency citations. This is dueto one of the partners who has spent a good deal of time away during the last sixmonths and is seen much less frequently than one who stayed, who in turn is seenmuch more frequently than most of the rest of the creatives. This may in part be dueto the fact that both partners have given up their cellular offices in favour of desklocations in the open plan area on the fifth floor. They were the only creatives to havedone this at the time.
If we look at single account staff on the fourth floor alone than we find a strikinglydirect relationship between frequency and usefulness (Figure 20a). This suggeststhat in the more cut off fourth floor by far the most important factor in perception ofusefulness is the degree to which one is seen, and that this begins to outweigh otherfactors such as experience and personal skills.
One of Company Y’s strategies is to create ‘spin off’ companies to develop particu-lar specialist services for clients, such as event management or public relations. Anumber of spin off companies use space in K House. If we consider these ‘spin off’companies alone we find that they too show a very strong relationship betweenusefulness and frequency, perhaps because they are more independent in workand therefore have less usefulness derived from programmed working contact andmore from casual helpfulness (Figure 20b). Again it seems that as direct usefulnessis removed from the equation, this time by an organisational split, the main factorin ones usefulness to others becomes the frequency with which one is seen.
Figure 18.a. The total of ‘useful’ citations
and the mean frequency of being seen
for all members of staff. r=.596, p=.0001
24
68
1 0
1 21 4
1 61 8
2 02 22 4
2 62 8
2 2.2 2.4 2.6 2.8 3 3.2 3.4 3.6 3.8µ freq.
usef
ul
y = 8.384x - 12.31, R-squared: .355
Figure 19. The total of ‘useful’ citations
and the mean frequency of being seen
for creatives only. r=.752, p=.0001
2
4
6
8
10
12
14
16
18
20
22
24
26
28
2 2.2 2.4 2.6 2.8 3 3.2 3.4 3.6 3.8µ freq.
usef
ul
y = 8.724x - 13.701, R-squared: .565
founder partnerwho was recentlyaway for some time
founder partnerwho was not away
Figure 18.d. The total of ‘useful’ citations
and the mean frequency of being seen for
single account staff only. r=.667, p=.0001
24
68
1 0
1 21 4
1 61 8
2 02 22 4
2 62 8
2 2.2 2.4 2.6 2.8 3 3.2 3.4 3.6 3.8µ freq.
usef
ul
y = 8.081x - 12.548, R-squared: .445
24
68
1 0
1 21 4
1 61 8
2 02 22 4
2 62 8
2 2.2 2.4 2.6 2.8 3 3.2 3.4 3.6 3.8µ freq.
usef
ul
y = 5.192x + 3.513, R-squared: .506
Figure 18.c. The total of ‘useful’ citations
and the mean frequency of being seen for
founder partners only. r=.711, p=.0001
Figure 18.b. The total of ‘useful’ citations
and the mean frequency of being seen ex-
cluding founder partners. r=.627, p=.0001
24
68
1 0
1 21 4
1 61 8
2 02 22 4
2 62 8
2 2.2 2.4 2.6 2.8 3 3.2 3.4 3.6 3.8µ freq.
usef
ul
y = 8.413x - 12.671, R-squared: .393
P R O C E E D I N G S V O L U M E I • C O M P L E X B U I L D I N G S

S P A C E S Y N T A X F I R S T I N T E R N A T I O N A L S P A C E S Y N T A X S Y M P O S I U M • L O N D O N � � � �
����
One of the important kinds of contact between people in innovative organisations isthat between people who do not have programmatic reasons to work together. Theextent to which this kind of contact is taking place can be investigated by looking atthe extent to which people are found useful by others who do not work with themdirectly. This kind of contact is dependent on seeing people frequently becauseunprogrammed discussion can only take place if people have a chance to ‘bump intoeach other’ in the building. Figure 21 shows a positive correlation between the aver-age frequency with which someone is seen and their usefulness to those who do notwork with them.
It is obviously important to exclude those people with jobs that bring them intoprogrammed contact with the whole organisation (such as IT support).
The frequency with which a person is seen and their usefulness, especially to thosewho do not normally work with them, is more difficult to link precisely to their indi-vidual desk location. The problem is that although people have a desk location theyspend beween 50% and 70% of their time elsewhere. For this reason the location ofthe workstation does not necessarily provide a good description of the way the spa-tial pattern of the building makes a person available to others. Availability, and thefrequency of contact that seems logically to follow from this, depends on more sys-tematic properties of building pattern in that people are available as they move around,and this pattern of movement has been shown to depend on the pattern of axialintegration.
It is also possible that those in less strategic locations get up and move around toovercome their segregation, more than those whose location brings people and con-tact past them. This has been found in previous studies, and the figures for deskutilisation and visitation ratios (Tables 2 & 3) suggest that it is taking place here.
It is probably for these reasons that the relationship of usefulness for those who don’twork with someone is linked to the spatial structure of the building at the level ofzones and not desks. The four zones considered for this measure were the fourthfloor alone, the left hand side, the top and the right hand side of the horseshoe onthe fifth floor. From the scatter in Figure 22 we can see that the average usefulness ofsomeone to those who do not work with them is related to the average spatial integra-tion of the zone in which they are situated. The most integrated zone is the righthand side, the second is the top, the third is the left and the fourth floor the least.The higher the mean integration the more useful the people, except for the top twoareas where the top of the horseshoe actually outperforms the right hand side. Sincethere are only four points on the scatter, the trend is indicative though not statisti-cally significant.
11 The spatial culture of Company YThe observations of space use, movement and interaction suggest that Company Y ischaracterised by a series of robust patterns of behaviour. These are particularly clearon the fifth floor where the space layout of the office is well suited to the dominantpatterns of space use and behaviour. The main regularities are as follows: concen-trated individual activity - sitting, reading and writing or working at the computer -
Figure 21. The total of ‘useful’ citations
by those that do not work directly with a
person and the mean frequency of being
seen for all those who do not have ‘whole
organisation’ jobs. r=.630, p=.0001
2
4
6
8
1 0
1 2
1 4
1 6
2 2.2 2.4 2.6 2.8 3 3.2 3.4 3.6µ freq.
do n
ot w
ork
but u
sefu
l
y = 5.092x - 8.401, R-squared: .397
Figure 20.b. The total of ‘useful’ citations
and the mean frequency of being seen
for ‘spin-off’ staff only. r=.865, p=.0001
24
68
1 0
1 21 4
1 61 8
2 02 22 4
2 62 8
2 2.2 2.4 2.6 2.8 3 3.2 3.4 3.6 3.8µ freq.
usef
ul
y = 9.876x - 18.834, R-squared: .749
Figure 20.a. The total of ‘useful’ citations
and the mean frequency of being seen
for single account staff on the fourth
floor only. r=.877, p=.0001
24
68
1 0
1 21 4
1 61 8
2 02 22 4
2 62 8
2 2.2 2.4 2.6 2.8 3 3.2 3.4 3.6 3.8µ freq.
usef
ul
y = 11.24x - 20.671, R-squared: .77
A l a n P e n n , J a k e D e s y l l a s a n d L a u r a Va u g h a n • T h e S p a c e o f I n n o v a t i o n

S P A C E S Y N T A X F I R S T I N T E R N A T I O N A L S P A C E S Y N T A X S Y M P O S I U M • L O N D O N � � � �
�����
takes place for preference near the external wall. Movement is concentrated in thehorseshoe circulation space that follows the ‘curved wall’, and filters off from thereinto the depths of the work areas. Standing people are concentrated just off the mainlines of movement.
It seems that movement gives rise to standing static space use, but that for prefer-ence people don’t stand where they will get trampled under foot. Interaction - groupsof people in conversation - takes place in one of two characteristic forms, eitherthrough programmed meetings in meeting spaces or through more opportunisticmeetings within the open plan area or in creatives’ offices.
Spatial analysis of the plan of the layout and statistical analysis of the observationdata show that patterns of movement are produced by space patterns. Specifically,the degree to which a space is deep or shallow from all other spaces in the officedetermines the level of movement through that space. Shallower or more ‘integrated’spaces carry greater levels of movement than deeper ‘segregated’ spaces. There isalso a direct, though less powerful, effect of depth from the entrance on patterns ofmovement. As one moves away from the entrance, levels of movement fall off. On thefifth floor the entrance from the stairs arrives in the integrated corridor and so both in-to-out movement and movement around the floor tend to use space is a similar way.
The effect of spatial pattern in constructing predominant movement patterns, cou-pled to the location of workstations with respect to those movement spaces can beshown to result in a pattern of spatial location of interaction. This pattern is charac-terised by a split into two types of relationship between movement and talking. Inter-action either takes place in the presence of movement and to a degree related to theamount of movement, indicating that it results as a byproduct of movement, or ittakes place in the absence of movement. The former comprises the unprogrammedor opportunistic interaction within and just off the main circulation spaces. The lat-ter are the programmed meetings within cellular office and meeting rooms. Pro-grammed interaction eliminates random contacts, and within programmed meetingspaces one is only aware of the people one is meeting with.
So far as interaction is concerned, the open plan work areas vary in their behaviour.Workstation areas near the circulation core behave most opportunistically, and one isaware of a far greater number of people than those in your immediate space. Theworkstation bays near the external wall somewhat reduce your awareness of people.
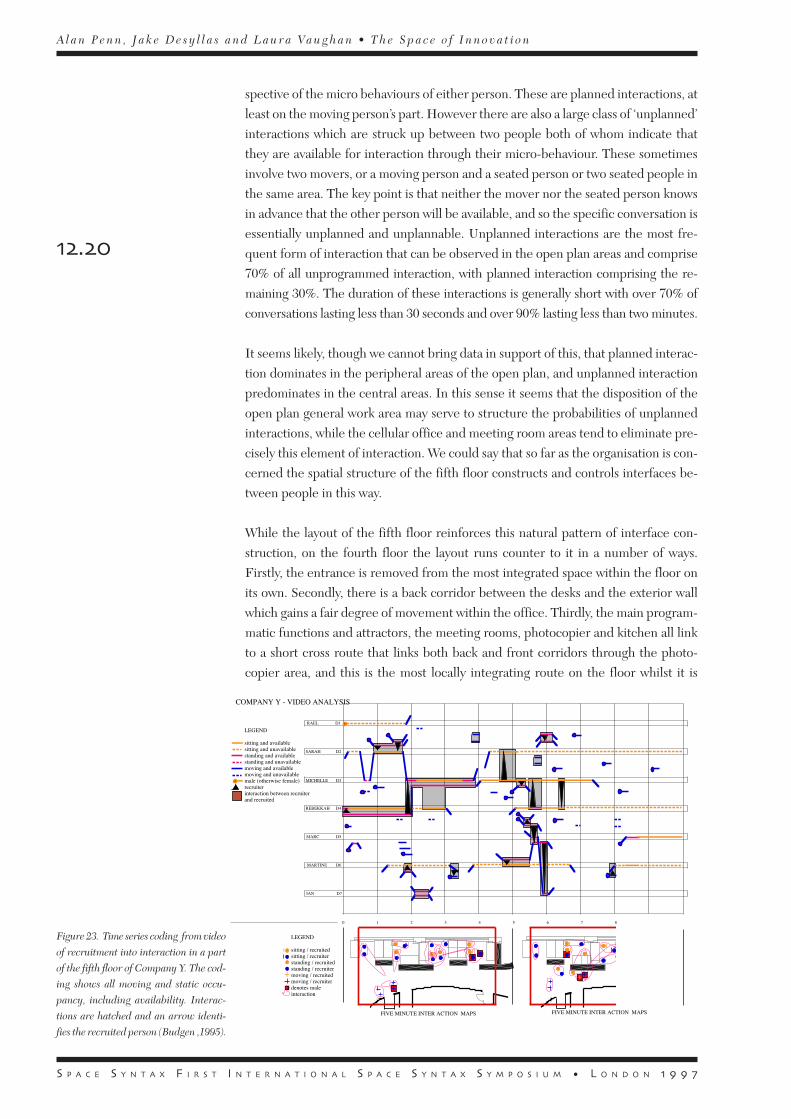
These differences seem to be bound into the way that people behave. Video analysiscarried out by Budgen (1995) shows that there is a consistent pattern of behavioursin these open plan areas (Figure 23). In general people who are moving behave inone of two ways. They either walk through ‘looking straight ahead’ indicating thatthey are not available or they turn to look at the general work areas as they passindicating availability for conversation. Similarly, those working at their desks either‘keep their heads down’ indicating that they do not want to be disturbed, or they lookup as people pass indicating availability. Two types of interaction follow from this.Where a seated person is the end destination for the moving person (ie. interactionwith that person was the reason for them moving) a conversation is initiated irre-
Figure 22. Mean usefulness of people in
the four zones of the building and the mean
integration of those zones. r=.928, p=.721
5.8
6
6.2
6.4
6.6
6.8
7
7.2
7.4
.5 .6 .7 .8 .9 1 1.1 1.2 1.3Integration
do n
ot w
ork
but u
sefu
l
y = 1.496x + 5.142, R-squared: .861
4th Floor
P R O C E E D I N G S V O L U M E I • C O M P L E X B U I L D I N G S
S P A C E S Y N T A X F I R S T I N T E R N A T I O N A L S P A C E S Y N T A X S Y M P O S I U M • L O N D O N � � � �
�����
spective of the micro behaviours of either person. These are planned interactions, atleast on the moving person’s part. However there are also a large class of ‘unplanned’interactions which are struck up between two people both of whom indicate thatthey are available for interaction through their micro-behaviour. These sometimesinvolve two movers, or a moving person and a seated person or two seated people inthe same area. The key point is that neither the mover nor the seated person knowsin advance that the other person will be available, and so the specific conversation isessentially unplanned and unplannable. Unplanned interactions are the most fre-quent form of interaction that can be observed in the open plan areas and comprise70% of all unprogrammed interaction, with planned interaction comprising the re-maining 30%. The duration of these interactions is generally short with over 70% ofconversations lasting less than 30 seconds and over 90% lasting less than two minutes.
It seems likely, though we cannot bring data in support of this, that planned interac-tion dominates in the peripheral areas of the open plan, and unplanned interactionpredominates in the central areas. In this sense it seems that the disposition of theopen plan general work area may serve to structure the probabilities of unplannedinteractions, while the cellular office and meeting room areas tend to eliminate pre-cisely this element of interaction. We could say that so far as the organisation is con-cerned the spatial structure of the fifth floor constructs and controls interfaces be-tween people in this way.
While the layout of the fifth floor reinforces this natural pattern of interface con-struction, on the fourth floor the layout runs counter to it in a number of ways.Firstly, the entrance is removed from the most integrated space within the floor onits own. Secondly, there is a back corridor between the desks and the exterior wallwhich gains a fair degree of movement within the office. Thirdly, the main program-matic functions and attractors, the meeting rooms, photocopier and kitchen all linkto a short cross route that links both back and front corridors through the photo-copier area, and this is the most locally integrating route on the floor whilst it is
Figure 23. Time series coding from video
of recruitment into interaction in a part
of the fifth floor of Company Y. The cod-
ing shows all moving and static occu-
pancy, including availability. Interac-
tions are hatched and an arrow identi-
fies the recruited person (Budgen ,1995).
D2
IAN
D4
RAEL
SARAH
MICHELLE
REBEKKAH
MARTINE
MARC
D1
D3
D5
D6
D7
0 1 2 3 4 5 6 7 8
COMPANY Y - VIDEO ANALYSIS
LEGEND
sitting and availablesitting and unavailablestanding and availablestanding and unavailablemoving and availablemoving and unavailablemale (otherwise female)recruiterinteraction between recruiterand recruited
LEGEND
sitting / recruitedsitting / recruiterstanding / recruitedstanding / recruitermoving / recruitedmoving / recruiterdenotes maleinteraction
FIVE MINUTE INTER ACTION MAPS FIVE MINUTE INTER ACTION MAPS
A l a n P e n n , J a k e D e s y l l a s a n d L a u r a Va u g h a n • T h e S p a c e o f I n n o v a t i o n

S P A C E S Y N T A X F I R S T I N T E R N A T I O N A L S P A C E S Y N T A X S Y M P O S I U M • L O N D O N � � � �
�����
removed from the entrance. Finally, the silver screen wall that separates the generalopen plan area from the front corridor places a barrier between open plan work andmost of the in to out movement on the floor, much of which uses the front corridor toget to meeting rooms or offices at either end of the floor.
The effect of these moves is striking. Whilst a relatively natural and unforced inter-face is built up on the fifth floor between movement, standing and seated interac-tion, and those coming in and out of the floor are brought directly into contact withit, on the fourth floor the interface is almost entirely eliminated. The higher levels ofmovement a space has, the lower the levels of interaction. Essentially, the fourthfloor breaks the relationship between passers-by and those sitting down so that op-portunistic interaction is strongly controlled. This makes the floor behave much more likea programmed meeting space in which only planned interaction is likely to take place.
The effect is symbolised - as well as partly constructed - through the use of the silverscreen wall to separate movement from general open plan work areas, in oppositionto its counterpart on the fifth floor - the red curved wall - which is used to separateprogrammed meeting spaces from the remainder.
Whilst these effects are clearly observable, and tell us a lot about the perceived dif-ferences between the two floors, it is not clear that interaction is necessarily impor-tant for people’s work. However, the findings of the communication questionnairesurvey suggested that space did play an important role since the more frequently aperson is seen, the more people find him/her useful in their work. This pattern holdsfor the organisation overall and repeats for all the different categories of people -creatives, founder partners, associated in house companies - but with varying de-grees of usefulness for a given frequency of being seen. For instance a foundingpartner is generally considered more useful for a given frequency of being seen thanother people, whilst ‘spin-off’ company personnel are considered slightly less useful.Certain key individuals with functions which support the whole organisation (IT andFinance for example) are found significantly more useful than their frequency ofbeing seen would suggest. For most staff on single accounts who do not have this‘whole organisation’ role or status the link between frequency and usefulness is di-rect and strong. Even when we exclude those who work directly with someone fromthe calculations we find that frequency of being seen is the key criterion affectingtheir ‘usefulness’.
The effects of the spatial layout of K House on the ‘usefulness’ of staff to each otheris best measured in terms of building segments. If we take the average level of use-fulness of people who work in each of the three legs of the fifth floor horseshoe andthe fourth floor, excluding those with ‘whole organisation’ functions, we find a directcorrelation between this and the mean degree of integration of the segment of thebuilding. This suggest that the effects of the relative segregation of the fourth floorare detectable at the level of the perceived ‘usefulness’ of its occupants.
How important this is to Company Y is open to question. When we look at the aver-age usefulness of all staff to those that do not work directly with them, and the meandegree of integration of the building as a whole, we find that Company Y performs
P R O C E E D I N G S V O L U M E I • C O M P L E X B U I L D I N G S
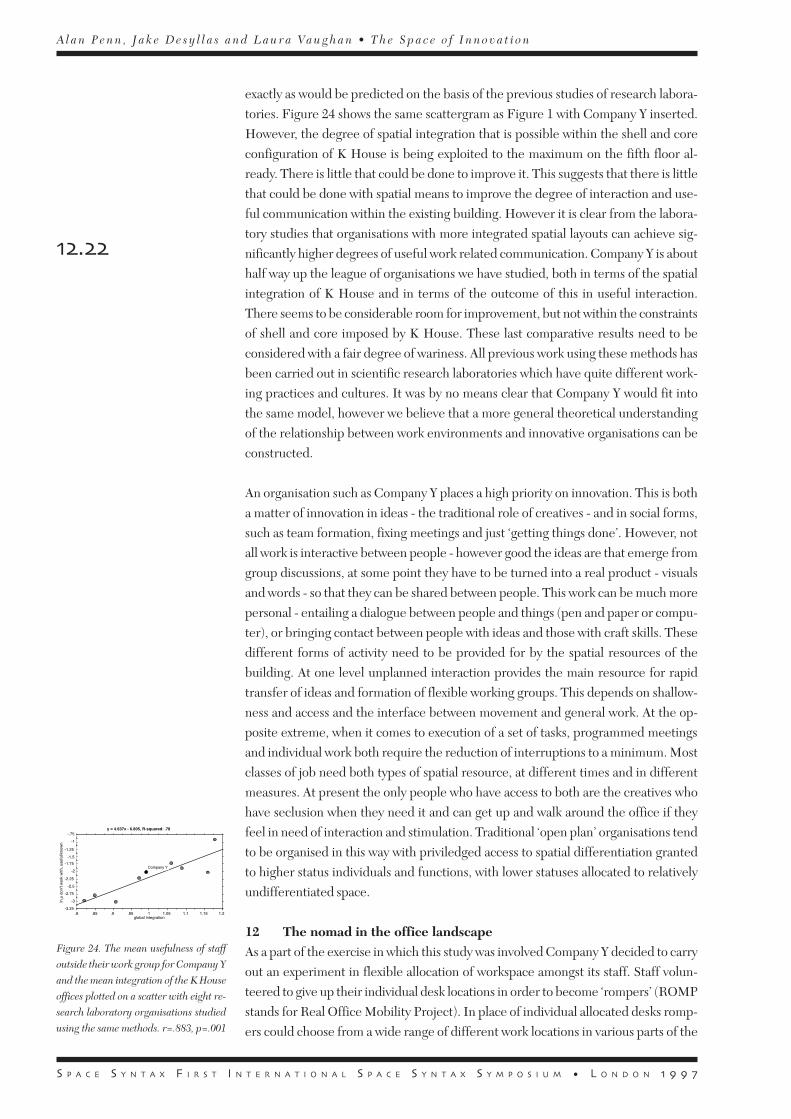
S P A C E S Y N T A X F I R S T I N T E R N A T I O N A L S P A C E S Y N T A X S Y M P O S I U M • L O N D O N � � � �
�����
exactly as would be predicted on the basis of the previous studies of research labora-tories. Figure 24 shows the same scattergram as Figure 1 with Company Y inserted.However, the degree of spatial integration that is possible within the shell and coreconfiguration of K House is being exploited to the maximum on the fifth floor al-ready. There is little that could be done to improve it. This suggests that there is littlethat could be done with spatial means to improve the degree of interaction and use-ful communication within the existing building. However it is clear from the labora-tory studies that organisations with more integrated spatial layouts can achieve sig-nificantly higher degrees of useful work related communication. Company Y is abouthalf way up the league of organisations we have studied, both in terms of the spatialintegration of K House and in terms of the outcome of this in useful interaction.There seems to be considerable room for improvement, but not within the constraintsof shell and core imposed by K House. These last comparative results need to beconsidered with a fair degree of wariness. All previous work using these methods hasbeen carried out in scientific research laboratories which have quite different work-ing practices and cultures. It was by no means clear that Company Y would fit intothe same model, however we believe that a more general theoretical understandingof the relationship between work environments and innovative organisations can beconstructed.
An organisation such as Company Y places a high priority on innovation. This is botha matter of innovation in ideas - the traditional role of creatives - and in social forms,such as team formation, fixing meetings and just ‘getting things done’. However, notall work is interactive between people - however good the ideas are that emerge fromgroup discussions, at some point they have to be turned into a real product - visualsand words - so that they can be shared between people. This work can be much morepersonal - entailing a dialogue between people and things (pen and paper or compu-ter), or bringing contact between people with ideas and those with craft skills. Thesedifferent forms of activity need to be provided for by the spatial resources of thebuilding. At one level unplanned interaction provides the main resource for rapidtransfer of ideas and formation of flexible working groups. This depends on shallow-ness and access and the interface between movement and general work. At the op-posite extreme, when it comes to execution of a set of tasks, programmed meetingsand individual work both require the reduction of interruptions to a minimum. Mostclasses of job need both types of spatial resource, at different times and in differentmeasures. At present the only people who have access to both are the creatives whohave seclusion when they need it and can get up and walk around the office if theyfeel in need of interaction and stimulation. Traditional ‘open plan’ organisations tendto be organised in this way with priviledged access to spatial differentiation grantedto higher status individuals and functions, with lower statuses allocated to relativelyundifferentiated space.
12 The nomad in the office landscapeAs a part of the exercise in which this study was involved Company Y decided to carryout an experiment in flexible allocation of workspace amongst its staff. Staff volun-teered to give up their individual desk locations in order to become ‘rompers’ (ROMPstands for Real Office Mobility Project). In place of individual allocated desks romp-ers could choose from a wide range of different work locations in various parts of the
-3.25
-3
-2.75
-2.5
-2.25
-2
-1.75
-1.5
-1.25
-1
-.75
.8 .85 .9 .95 1 1.05 1.1 1.15 1.2global integration
ln µ
don
't w
ork
with
, use
ful/k
now
n
y = 4.637x - 6.805, R-squared: .78
Company Y
Figure 24. The mean usefulness of staff
outside their work group for Company Y
and the mean integration of the K House
offices plotted on a scatter with eight re-
search laboratory organisations studied
using the same methods. r=.883, p=.001
A l a n P e n n , J a k e D e s y l l a s a n d L a u r a Va u g h a n • T h e S p a c e o f I n n o v a t i o n

S P A C E S Y N T A X F I R S T I N T E R N A T I O N A L S P A C E S Y N T A X S Y M P O S I U M • L O N D O N � � � �
�����
building, offering different degrees of isolation or integration and different types ofenvironment - light, dark, quiet, noisy, large and small. The effect of the rompingchanges was to greatly increase the spatial differentiation of the general work areas inthe plan, providing several much more segregated areas on both the fifth and fourthfloor, but allowing equal access to all these spaces to all Rompers. The rompingexercise hes yet to be fully evaluated, however early responses from the staff involvedare very positive.
An important question that arises from this experiment is whether it is possible tocouple a higher degree of spatial differentiation in the open plan general work areas- providing for privacy and community - with the removal of individual rights to desklocations, in such a way as to give everyone privacy when their job dictates and theoption to move to more public space when that seems desirable. The concern is thatthe result of spatial differentiation will be to fossilise particular structures as theseemerge in the organisation, through a process in which those who have the mostpower (either through status or need) secure privileged access to space. It may bethat the six monthly move strategy is only possible in general office areas where thereis relatively little spatial differentiation between different desk locations. If therewere a greater degree of differentiation in these spaces then it is possible that morefixed statuses might emerge to argue for privileged rights to space. This is effectivelythe current situation for creatives.
There seem to be two possibilities. If differentiation is invested in group spaces towhich all have equal access - the cafe or library for instance - then it is possible thatfossilisation of individual roles or statuses would not take place. We might think ofdifferentiation at this level as global differentiation. The question that follows iswhether local differentiation within a group work space - say an open plan officearea - can work, or whether it would lead to fossilisation. There seem to be certainpreconditions. If ‘hot desks’ are proposed for everyone then the rules on clearingdesks each evening would need to be very strong, as would strategies for storing‘things’, if individuals are not to gain rights over space. Similarly, it would seem nec-essary not only to provide for the spatial and environmental needs of different tasksand activities, but also to provide for their different temporal needs. Some activitieslast a minute, others an hour others a day or a week or a month. It is likely that somedegree of redundancy would be needed in provision of different classes of space sothat different time scales of use could also be accommodated. Again, strict enforce-ment of timekeeping would be necessary if ‘squatting’ is to be avoided.
However, the real implications of this type of strategy are more thoroughgoing. Ef-fectively, the removal of rights of individuals to space makes everyone a visitor to thebuilding, much as students are in a campus, or pedestrians are in the city. In thissituation it is possible for ‘hidden’ power structures to emerge (the bully in the schoolplayground is one example) that can be far more conservative in their effects thanthe more explicit power structures embodied in organisationally sanctioned statuses.If these power structures are to be avoided then mechanisms will need to be devel-oped to control their emergence. It seems likely that an apparent ‘freeing up’ ofaccess to spatial differentiation for all categories of staff will entail a reciprocal ‘tight-ening up’ of codes of behaviour and especially those governing space use. As the
P R O C E E D I N G S V O L U M E I • C O M P L E X B U I L D I N G S

S P A C E S Y N T A X F I R S T I N T E R N A T I O N A L S P A C E S Y N T A X S Y M P O S I U M • L O N D O N � � � �
�����
utilisation of space becomes temporary and the office society becomes effectively‘nomadic’, rule systems surrounding space use and cultural devices to allow indi-viduals and groups to maintain their identity are both likely to become more elabo-rate. Whilst in Company X we saw the effects of spatial integration and visual open-ness manifest themselves in a degree of reinforcement of the group identity throughmanipulaion of the spatial layout, it remains to be seen what form the elabrated rulessystems will take in Company Y.
ReferencesAllen T., Managing the flow of technology, MIT Press, 1977;Shanks, M., (1967) The Innovators: the economics of technology, Penguin Books, Harmondsworth, UK,1967;Beer, S., (1966) Decision and control, Wiley, 1966;Hillier, B., O’Sullivan, P., Penn, A., Kolokotroni, M., Rasmussen, M ., Xu, J ., and Young, A. (1990) The
design of research laboratories report to the Steering Committee of the Laboratories Invesitgation Unit of
the DES,Unit for Architectural Studies, UCL, London 1990;Hillier B & Penn A, (1991), Visible colleges: structure and randomness in the place of discovery, Science
in Context, 4,1(1991) pp23-49;Penn, A. & Hillier B., (1992) The social potential of buildings: space and the innovative milieu in scientific
research laboratories, Proceedings of the Corporate Space and Architecture Conference, Paris, 1992;Backhouse, A. & Drew, P. (1992) The design implications of social interaction in a workplace settingEnvironment and Planning B: Planning and Design, 19: 573-584, Pion, London, 1992;Hillier, B. & Grajewski, T. (1987) The Application of Space Syntax to Work environments inside buildings:
Final Report ,Unit for Architectural Studies, UCL, London, 1987;Grajewski, T. (1992) Interaction in the work environment, PhD Thesis, University of London, 1992;Budgen, A., (1995) Breaking Boundaries: the sole of space in process and product innovation, MSc The-sis, The Bartlett, UCL, London.
A l a n P e n n , J a k e D e s y l l a s a n d L a u r a Va u g h a n • T h e S p a c e o f I n n o v a t i o n