the sourcebook for political communication research ... · indirect effects in political...
TRANSCRIPT
23Mediation and the Estimation of
Indirect Effects in PoliticalCommunication Research
Andrew F. HayesSchool of CommunicationThe Ohio State University
Kristopher J. PreacherDepartment of Psychology
University of Kansas
Teresa A. MyersSchool of CommunicationThe Ohio State University
Much research in the communication and political science fields—political communicationresearch being no exception—seeks to establish the extent to which certain communication-relatedvariables (e.g., exposure to political debates, the tone of news coverage about politicians, or thediversity in opinions of those with whom one talks about politics) have effects on various politicaloutcomes (e.g., evaluation of candidates running for office, political cynicism, or participation inthe political process). To be sure, studies to establish or refute the existence of effects are important.But studies, and the investigators who conduct them, are usually much more impressive and helpfulin advancing our understanding when they go further by establishing not only whether or not aneffect exists or how large that effect is, but also why that effect exists. What is the process at workthat produces an association between political discussion and participation, or between exposureto political debates and political cynicism, or between the tone of news coverage and evaluation ofcandidates running for public office? For example, is it that frequent political talk exposes one tomore diverse viewpoints, which in turn makes one feel confused or less confident in one’s beliefs,which in turn translates into a reduced likelihood of converting those beliefs into political action?Or might frequent talk increase one’s sense that one can make a difference in the outcomes of thepolitical process, spawning greater participation in that process?
434
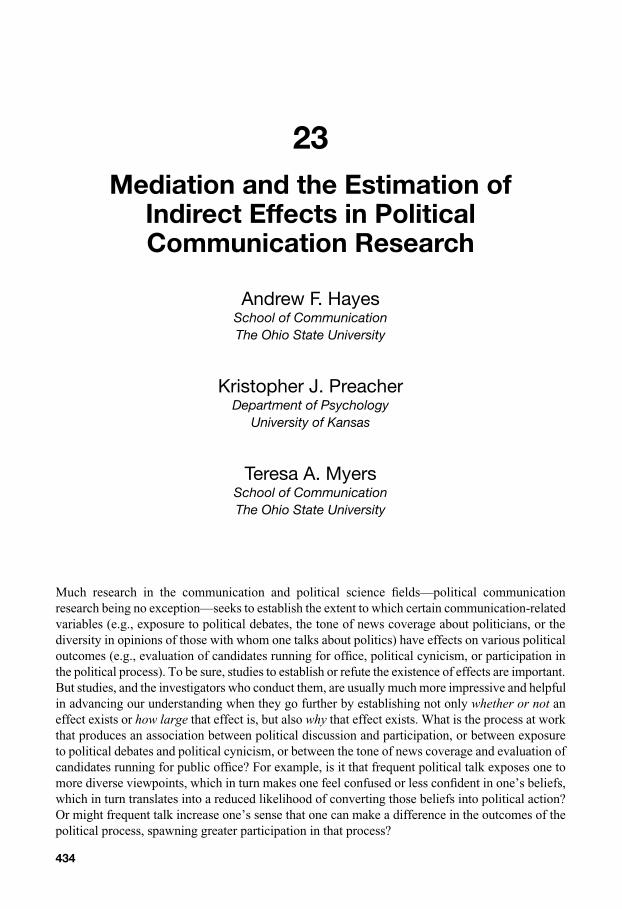
Questions about mechanisms or process invoke the concept of mediation, the topic of thischapter. We say that the effect of some independent variable X on outcome variable Y is mediatedby M if M is causally situated between X and Y such that changes in X cause changes in M, whichin turn cause changes in Y. The most basic mediation model one can test takes the form in Figure23.1 panel A. In this model, X’s effect on Y occurs both directly (the link directly from X to Y) aswell as indirectly, through X’s effect on mediator variable M, which then affects Y. Of course,other more complicated mediation models are possible and no doubt are at work in politicalcommunication processes. Figure 23.1 Panel B, for instance, depicts a model in which X’s effectis transmitted indirectly through multiple mediators. An extension of this model allows themediators to affect each other, as in Figure 23.1 Panel C. Many such models can be constructedby linking variables in a sequence of causal associations together.
Quantifying and testing indirect effects is the focus of this chapter. After first brieflyreviewing some recent examples of published research in political communication focused ontesting questions about mediation, we describe how indirect effects are typically quantified andhow inferences about their magnitudes are made. Although there are many methods that can beused to estimate the paths in these models, we focus on the use of ordinary least squares (OLS)regression and structural equation modeling (SEM), as these are the methods most likely to befamiliar to the reader. Similarly, there are many methods that have been discussed in the literaturefor making statistical inferences about indirect effects, but we focus largely on those few that areimplemented in existing computing packages, so as to reduce the computational burden on thoseinterested in applying the material described in this chapter in their own research.
Throughout this chapter, we will use the terms “mediation” and “indirect effect” loosely andsomewhat interchangeably, although there is some debate in the literature over whether or not it islegitimate to do so (Mathieu & Taylor, 2006). Implied in the definition of mediation provided aboveis that X and Y are associated. That is, an effect that doesn’t exist (what we will call the “total effect”below) can’t be said to be mediated. For this reason, it is not uncommon for investigators to ignore
MEDIATION AND THE ESTIMATION OF INDIRECT EFFECTS 435
435
X
M
Y
A
M1
X
M2
C
M1
M4
M2
M3
X Y
B
Y
FIGURE 23.1 A few examples of mediation models.
the possibility of an indirect effect of X on Y through one or more intervening variables in theabsence of an association between X and Y. This is a practice we do not endorse, for it is possiblefor X to indirectly affect Y in the absence of compelling evidence of an association between X andY, especially in models that involve more than one intervening variable. Regardless, there is generalagreement among experts in this area that a nonzero indirect effect in the direction consistent withthe proposed mediation process is a necessary condition for a claim of mediation. For this reason,understanding how to quantify and test indirect effects is important for researchers interested intesting mediation hypotheses. Mathieu and Taylor (2006, pp. 1037–1039) dwell at some length onthe distinction between an indirect effect and mediation, and their discussion is worth reading.
Before beginning, we want to emphasize that questions about mediation and indirect effectsare ultimately questions about causality, and in the absence of a research design that affords acausal conclusion, confidence in one’s causal inferences must necessarily be tempered. Ideally,the proposed causal agent (labeled X in Figure 23.1) is experimentally manipulated or, if not, canat least be known to be causally prior to its presumed effect (on M and Y). In many studies in thepublished literature that include tests of mediation, including the examples in this chapter, thecorrect temporal sequencing of cause and effect cannot be established except through theoreticalor logical argument. Although it is true that there is no substitute for a good theory, causal theoriescannot be definitively supported empirically unless the conditions of causality have beenestablished by good research design. The methods we describe in this chapter are based onmathematical operations involving indices of association. But as there are many explanations forassociation between variables in a mediation model (such as spuriousness; cf. MacKinnon, Krull,and Lockwood, 2000), in the absence of design that allows for confident cause–effect inference,the methods described here can be used to assess only whether the evidence is consistent with amediation process. This should come as no surprise and is no different from any statistical method,as inferences are products of the mind more than products of math. Use your analysis to informyour thinking rather than as a substitute for thinking. A good overview of the criteria for estab-lishing causality and the sticky philosophical debates to which the concept of “cause” give risecan be found in Davis (1985) or Holland (1986).
MEDIATION IN RECENT POLITICAL COMMUNICATION RESEARCH
Political communication scholars have devoted considerable empirical attention to understandinghow mass and interpersonal communication exert their effects on various political outcomes.Keum and colleagues (2004), for instance, explored how the use of news (televised and print) andexposure to various forms of televised entertainment (dramas, sitcoms, and talk shows) are linkedto civic participation, such as volunteering and participating in community meetings. They testeda model in which the use of news and entertainment television affects participation through theirinfluence on concerns and behavior pertaining to achieving social status and environmentaldegradation. They found that both news and entertainment media have both direct and indirecteffects on participation, with increased exposure actually prompting both social status-orientedconsumerism and concerns about the environment, which in turn both prompt greaterparticipation. Relatedly, Holbert (2005a) examined the effects of television news viewing onattitudes about government spending on social programs, testing the hypothesis that the use oftelevised news exerts its influence on such attitudes by changing perceptions of the role ofgovernment in society. Indeed it does, although the strength of this effect differs as a function ofparty identification. According to Holbrook and Hill (2005), exposure to certain kinds of televisionshows can affect evaluations of political leaders by changing the salience or chronic accessibility
436 HAYES, PREACHER, AND MYERS
436
of social issues pertaining to the themes portrayed in those shows. Using experimental and cross-sectional survey data, they find that exposure to crime dramas makes crime a more salient problemfacing the nation, which in turn influences how the president is evaluated. In the realm ofinterpersonal communication, Eveland (2004) examines the mechanisms through which politicaldiscussion can increase political knowledge. His results support a mediated relationship in whichinterpersonal discussion about politics increases political knowledge through the cognitiveelaboration of political information such discussion produces, which in turn facilitates greaterknowledge acquisition.
These studies show that communication’s effects on political outcomes (such as knowledgeand attitudes) frequently are mediated. But communication-related variables have also beenconceptualized and empirically studied as mediators of the effects of other variables. For example,Gidengil and Everitt (2003) show that the effect of the sex of a political leader on the public’sevaluations of the leader occurs in part through the tone of the news coverage about politicians.Specifically, they found that journalists more frequently use negative or aggressive verbs in theircoverage of female compared to male politicians, and this tonal difference contributes todifferences in individuals’ evaluations of those politicians, with females being perceived morenegatively as a result of these differences in tone of coverage. Holbert, Shah, and Kwak (2003)report that exposure to three types of prime-time television programming (traditional dramas,progressive dramas, and situational comedies) mediates the effects of demographic variables onopinions about women’s rights issues. That is, some of the differences in opinions that we seebetween people who differ in education, age, or sex is attributable to differences in their selectionof entertainment television, which tends to portray women in certain ways. Other examples ofcommunication as mediator include Pinkleton and Austin’s (2001) study of political disaffectionand Eveland’s (2001) cognitive mediation model of learning from the news.
Although there are many studies in the field of political communication which place com-munication squarely in the role of independent or mediating variable, relatively few studies focuson communication as the ultimate outcome of interest. One notable exception is Sellers andSchaffner’s (2007) analysis of media coverage of the U.S. Senate. They found that the way politi-cians structured events (such as press conferences) impacted the interest journalists found in theevent, which then influenced the amount of coverage the event received. Therefore, news coverageof a U.S. senator was influenced by the extent to which a senator could structure an event thatcaptured the attention and interest of journalists. Another example is Stroud’s (2007) study of thedeterminants of political discussion. She found that an individual’s attitude toward President G. W.Bush predicted whether or not they viewed the film Fahrenheit 9/11 (communication as mediator),which in turn purportedly affected frequency of political discussion (communication as outcome).
Stroud’s Fahrenheit 9/11 study is an example of one in which communication variables playmultiple roles, as both mediator (i.e., selective exposure to certain media content) and outcome(frequency of political talk). So, too, is Eveland’s (2001) cognitive mediation model of learning,frequently applied to political contexts, in which motivations to use certain forms of news media(an independent variable) affect attention to news (a mediator), which in turn affects how much one learns. We would also expect there to be a feedback loop or “cycle,” whereby communi-cation (e.g., exposure to campaign advertisements) has certain effects on noncommunicationvariables (e.g., political cynicism) which, in turn, affect communication-related variables (e.g.,interest in campaign news and selective avoidance of political advertisements). Alternatively, acommunication-related outcome could function as a mediator of a communication outcome tofollow, as in Holbert’s (2005b) intermedia mediation model of political engagement and learning.Although such cyclical processes no doubt are at work in the world (cf. Slater, 2007), the extraempirical demands they require result in relatively few such studies in the literature. Regardless,
MEDIATION AND THE ESTIMATION OF INDIRECT EFFECTS 437
437
as the above discussion makes clear, the study of mediation, mechanism, and process in one formor another is alive and well in the field of political communication.
PARSING THE TOTAL EFFECT INTO DIRECT AND INDIRECT COMPONENTS
One of the fundamental rules of path analysis is that a variable’s effect, such as the effect of X onY, can be mathematically partitioned into various components by tracing the paths between thetwo variables in a path diagram (as in Figure 23.1). In this section we will focus on thosecomponents of a path diagram directly pertinent to mediation analysis—the total effect of X on Y,the indirect effect(s) of X on Y through one or more mediators, and the direct effect of X on Y. Wewill illustrate the computation of these effects using data provided to us by William Eveland froman investigation of the cognitive mediation model of learning from the news (Eveland, 2001). Thismodel proposes that people learn more through the media when they are motivated to attend toand deeply process the information in a way that facilitates learning. The data we use are from asample of residents of Madison, Wisconsin, and nearby communities in 1985. Responses tovarious questions were aggregated to form indices quantifying the constructs central to thecognitive mediation model: surveillance gratifications (motivation to acquire information fromthe media about politics), attention to news (the extent to which respondents are exposed to and,when so exposed, focus their attention on news about national government and politics),elaborative processing (the extent to which respondents report thinking about things they’ve heardabout in the news), and knowledge of recent events in politics and national and internationalaffairs. For details on measurement, see Eveland (2001).
Simple Mediation Model
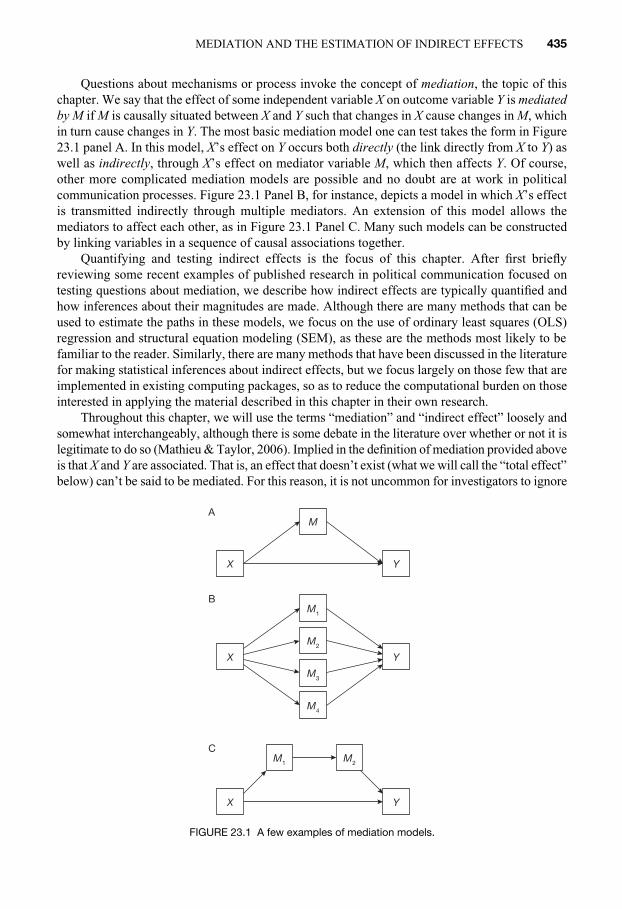
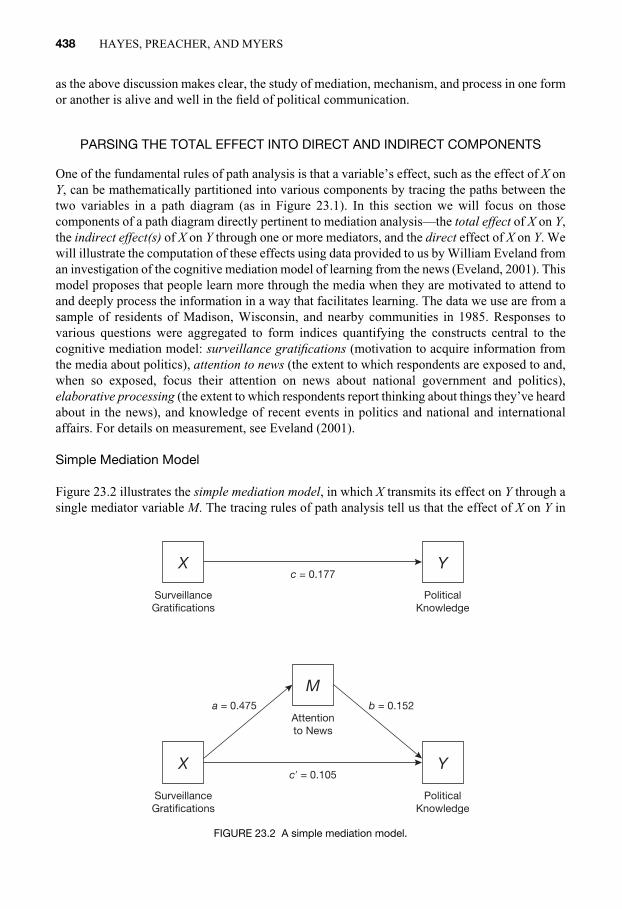
Figure 23.2 illustrates the simple mediation model, in which X transmits its effect on Y through asingle mediator variable M. The tracing rules of path analysis tell us that the effect of X on Y in
438 HAYES, PREACHER, AND MYERS
438
X
M
Y
X Y
SurveillanceGratifications
Attentionto News
c′ = 0.105
b = 0.152a = 0.475
c = 0.177
PoliticalKnowledge
SurveillanceGratifications
PoliticalKnowledge
FIGURE 23.2 A simple mediation model.
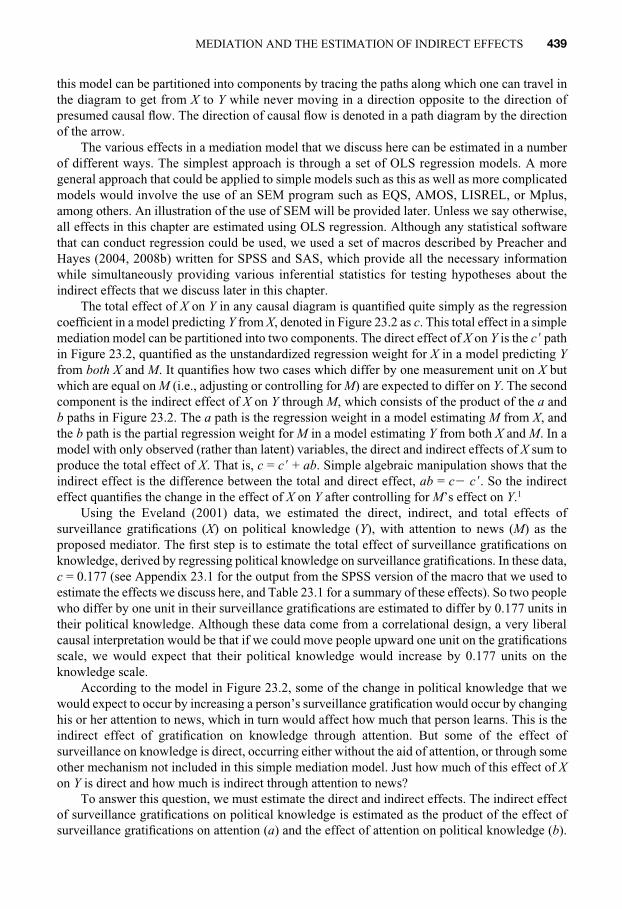
this model can be partitioned into components by tracing the paths along which one can travel inthe diagram to get from X to Y while never moving in a direction opposite to the direction ofpresumed causal flow. The direction of causal flow is denoted in a path diagram by the directionof the arrow.
The various effects in a mediation model that we discuss here can be estimated in a numberof different ways. The simplest approach is through a set of OLS regression models. A moregeneral approach that could be applied to simple models such as this as well as more complicatedmodels would involve the use of an SEM program such as EQS, AMOS, LISREL, or Mplus,among others. An illustration of the use of SEM will be provided later. Unless we say otherwise,all effects in this chapter are estimated using OLS regression. Although any statistical softwarethat can conduct regression could be used, we used a set of macros described by Preacher andHayes (2004, 2008b) written for SPSS and SAS, which provide all the necessary informationwhile simultaneously providing various inferential statistics for testing hypotheses about theindirect effects that we discuss later in this chapter.
The total effect of X on Y in any causal diagram is quantified quite simply as the regressioncoefficient in a model predicting Y from X, denoted in Figure 23.2 as c. This total effect in a simplemediation model can be partitioned into two components. The direct effect of X on Y is the c ′ pathin Figure 23.2, quantified as the unstandardized regression weight for X in a model predicting Yfrom both X and M. It quantifies how two cases which differ by one measurement unit on X butwhich are equal on M (i.e., adjusting or controlling for M) are expected to differ on Y. The secondcomponent is the indirect effect of X on Y through M, which consists of the product of the a andb paths in Figure 23.2. The a path is the regression weight in a model estimating M from X, andthe b path is the partial regression weight for M in a model estimating Y from both X and M. In amodel with only observed (rather than latent) variables, the direct and indirect effects of X sum toproduce the total effect of X. That is, c = c ′ + ab. Simple algebraic manipulation shows that theindirect effect is the difference between the total and direct effect, ab = c2 c ′. So the indirecteffect quantifies the change in the effect of X on Y after controlling for M’s effect on Y.1
Using the Eveland (2001) data, we estimated the direct, indirect, and total effects ofsurveillance gratifications (X) on political knowledge (Y), with attention to news (M) as theproposed mediator. The first step is to estimate the total effect of surveillance gratifications onknowledge, derived by regressing political knowledge on surveillance gratifications. In these data,c = 0.177 (see Appendix 23.1 for the output from the SPSS version of the macro that we used toestimate the effects we discuss here, and Table 23.1 for a summary of these effects). So two peoplewho differ by one unit in their surveillance gratifications are estimated to differ by 0.177 units intheir political knowledge. Although these data come from a correlational design, a very liberalcausal interpretation would be that if we could move people upward one unit on the gratificationsscale, we would expect that their political knowledge would increase by 0.177 units on theknowledge scale.
According to the model in Figure 23.2, some of the change in political knowledge that wewould expect to occur by increasing a person’s surveillance gratification would occur by changinghis or her attention to news, which in turn would affect how much that person learns. This is theindirect effect of gratification on knowledge through attention. But some of the effect ofsurveillance on knowledge is direct, occurring either without the aid of attention, or through someother mechanism not included in this simple mediation model. Just how much of this effect of Xon Y is direct and how much is indirect through attention to news?
To answer this question, we must estimate the direct and indirect effects. The indirect effectof surveillance gratifications on political knowledge is estimated as the product of the effect ofsurveillance gratifications on attention (a) and the effect of attention on political knowledge (b).
MEDIATION AND THE ESTIMATION OF INDIRECT EFFECTS 439
439

440
TA
BL
E23
.1P
ath
Coe
ffici
ents
and
Indi
rect
Eff
ects
for
Thr
eeM
edia
tion
Mod
els
(Sta
ndar
dE
rror
sin
Par
enth
eses
)
Pat
hC
oeffi
cien
tsIn
dire
ctE
ffec
ts
toK
now
lege
(K)
toA
tten
tion
(A)
toE
labo
rati
on(E
)E
stim
ate
Sobe
lZSy
mm
etri
c95
%C
IB
oots
trap
95%
CI†
Mod
el1
(Fig
ure
23.2
)fr
omS
urve
illa
nce
(S)
.105
(.03
5).4
75(.
058)
from
Att
enti
on(A
).1
52(.
027)
S→
A→
K.0
72(.
016)
4.65
1.0
42,.
103
.042
,.10
7†
Mod
el2
(Fig
ure
23.3
)fr
omS
urve
illa
nce
(S)
.086
(.03
4).4
75(.
058)
.280
(.05
7)fr
omA
tten
tion
(A)
.126
(.02
7)fr
omE
labo
rati
on(E
).1
08(.
027)
Tot
al.0
90(.
017)
5.31
1.0
57,.
123
.062
,.12
9S
peci
fic:
S→A
→K
.060
(.01
5)4.
064
.031
,.08
9.0
33,.
094
Spe
cifi
c:S
→E
→K
.030
(.01
0)3.
080
.010
,.05
0.0
13,.
056
Mod
el3
(Fig
ure
23.4
)fr
omS
urve
illa
nce
.087
(.03
4).4
75(.
058)
.167
(.05
9)fr
omA
tten
tion
.126
(.02
7).2
38(.
046)
from
Ela
bora
tion
.108
(.02
7)T
otal
.090
(.01
7)5.
318
.057
,.12
3.0
58,.
127
Spe
cifi
c:S→
A→
K.0
60(.
015)
4.06
9.0
31,.
089
.030
,.09
6S
peci
fic:
S→
E→
K.0
18(.
008)
2.29
0.0
02,.
034
.005
,.03
9S
peci
fic:
S→
A→
E→
K.0
12(.
004)
2.94
2.0
04,.
020
.005
,.02
4
Tot
alE
ffec
t=0.
177
(0.0
33)
†P
erce
ntil
eC
Isfo
rM
odel
1(f
rom
Pre
ache
r&
Hay
es,2
004)
and
BC
CIs
for
mod
els
2(f
rom
Pre
ache
r&
Hay
es,2
008b
)an
d3
(Mpl
us)
The former is the regression weight estimating attention from just surveillance gratifications. Here, a = 0.475. The latter is the regression weight for attention in a model estimating politicalknowledge from both attention and surveillance gratifications. In these data, b = 0.152. Whenmultiplied together, the indirect effect of surveillance gratifications on knowledge throughattention is ab = (0.475)(0.152) = 0.072. The direct effect of surveillance gratifications comes outof the same model used to derive b, as it is the regression coefficient for surveillance gratificationscontrolling for attention to news. We found that c′ = 0.105. Notice that, as promised, the totaleffect equals the sum of the direct and indirect effects: 0.177 = 0.105 + 0.072.
Combining all this information, we can say that of the 0.177 unit difference in knowledgeattributable to a unit difference in surveillance gratifications (the total effect), 0.072 of it is theresult of the effect of gratification on attention, which in turn influences knowledge. The remaining0.105 is direct, spurious, or attributable to other indirect effects not explicitly modeled.
An interesting question is how much of a variable’s effect is due to a mediation process andhow much of it is due to some other process. There is no universally agreed-upon approach toanswering this question. One approach is to calculate the ratio of the indirect effect to the totaleffect, i.e., ab/c. In this example, this quantity is 0.072/0.177 = 0.407. This proportion of totaleffect that is mediated measure can be interpreted to mean that 40.7% of the total effect ofsurveillance gratifications on political knowledge is due to its indirect effect through attention tonews. An alternative proposal is to calculate the ratio of the indirect effect to the direct effect, i.e.,ab/c ′. Here, this ratio is 0.072/0.105 = 0.686, meaning that the indirect effect through attention isabout 68.6% of the size of the direct effect. Although these ratios make sense, they can beproblematic in some situations. The proportion of total effect that is a mediated measure is notconstrained to lie between 0 and 1 because, paradoxical as it may seem, it actually is possible forthe indirect effect to be larger than the total effect or for the indirect effect and direct effect to havedifferent signs, producing a negative proportion. The ratio of the indirect to direct effect also canbe negative, or may involve division by 0 or by a very small number, which in turn producesimpossible or ambiguous estimates. See Preacher and Hayes (2008a) and Hayes (2009) for adiscussion of effect size measures for mediation effects.
Single-Step Multiple Mediator Model
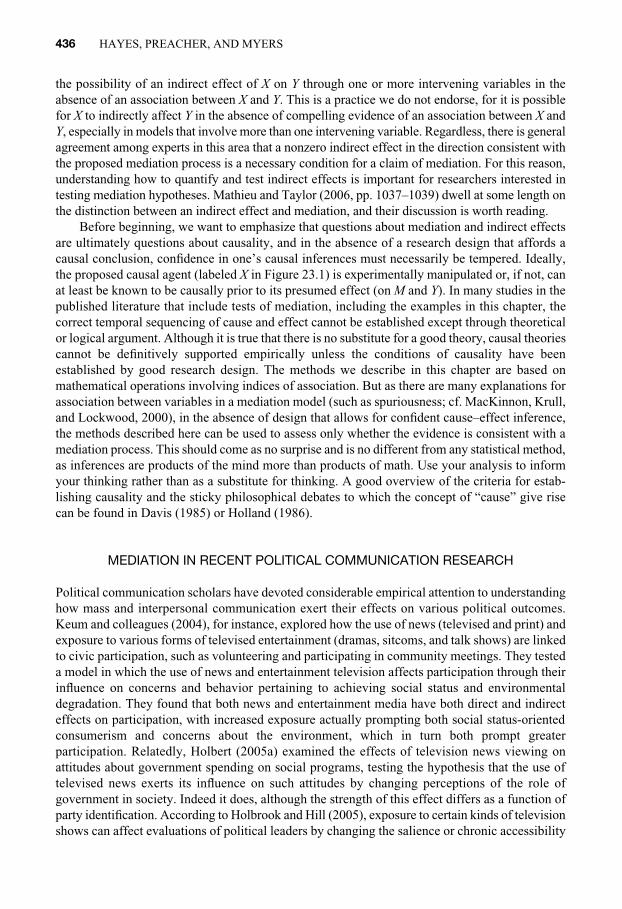
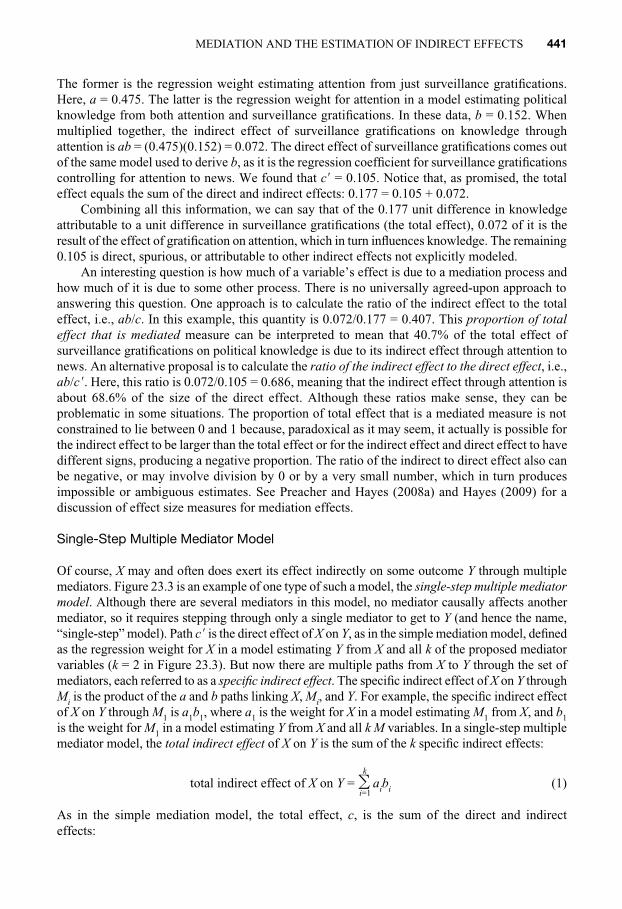
Of course, X may and often does exert its effect indirectly on some outcome Y through multiplemediators. Figure 23.3 is an example of one type of such a model, the single-step multiple mediatormodel. Although there are several mediators in this model, no mediator causally affects anothermediator, so it requires stepping through only a single mediator to get to Y (and hence the name,“single-step” model). Path c ′ is the direct effect of X on Y, as in the simple mediation model, definedas the regression weight for X in a model estimating Y from X and all k of the proposed mediatorvariables (k = 2 in Figure 23.3). But now there are multiple paths from X to Y through the set ofmediators, each referred to as a specific indirect effect. The specific indirect effect of X on Y throughMi is the product of the a and b paths linking X, Mi, and Y. For example, the specific indirect effectof X on Y through M1 is a1b1, where a1 is the weight for X in a model estimating M1 from X, and b1is the weight for M1 in a model estimating Y from X and all k M variables. In a single-step multiplemediator model, the total indirect effect of X on Y is the sum of the k specific indirect effects:
total indirect effect of X on Y = Ok
i=1aibi (1)
As in the simple mediation model, the total effect, c, is the sum of the direct and indirect effects:
MEDIATION AND THE ESTIMATION OF INDIRECT EFFECTS 441
441
c = c ′ + Ok
i=1aibi (2)
Simple algebra shows that the difference between the total and direct effect of X on Y, c2 c ′, isequal to the total indirect effect.
To illustrate, we extend the earlier example examining the direct and indirect effects ofsurveillance gratifications on political knowledge by adding an additional proposed mediator fromthe cognitive mediation model—elaboration—while retaining attention to news as a mediatorvariable. Here we use an SPSS macro described by Preacher and Hayes (2008b) to estimate theeffects (see Appendix 23.2 for the output), although a series of OLS regressions could beconducted using any statistical program capable of doing regression, as could an SEM programsuch as Mplus, AMOS, EQS, or LISREL. But not all programs will produce the inferential testswe prefer, described in the next section.
The total effect is unchanged by the inclusion of additional mediators in the model. It remainsc = 0.177. But now there are two indirect effects through which surveillance gratifications isproposed to exert its effect on political knowledge—the specific indirect effect through attention,and the specific indirect effect through elaboration. Arbitrarily labeling attention to news M1 andelaboration M2, to estimate these specific indirect effects we estimate a1 and a2, the paths fromsurveillance gratifications to attention and elaboration, respectively. The first path, a1, is the sameas the estimate from the simple mediation model, as this is still derived from a regression ofattention on surveillance gratifications: a1 = 0.475. The path from surveillance to elaboration isestimated by regressing elaboration on only surveillance gratifications: a2 = 0.280. The b1 and b2paths are derived from a model simultaneously predicting political knowledge from attention,
442 HAYES, PREACHER, AND MYERS
442
X
M1
M2
Y
X Y
SurveillanceGratifications
Attentionto News
c′ = 0.087
a2 = 0.280
a1 = 0.475
b2 = 0.108
b1 = 0.126
c = 0.177
PoliticalKnowledge
SurveillanceGratifications
PoliticalKnowledge
FIGURE 23.3 A single-step multiple mediator model with two proposed mediators. Not pictured is thecovariance between the mediator residuals, rending this a saturated model.
elaboration, and surveillance gratifications. In these data, b1 = 0.126 and b2 = 0.108. Multiplyingthe corresponding a and b paths together yields the specific indirect effects of interest. Forattention, a1b1 = (0.475)(0.126) = 0.060, and for elaboration, a2b2 = (0.280)(0.108) = 0.030.Summing the specific indirect effects yields the total indirect effect: 0.060 + 0.030 = 0.090.Finally, the direct effect of elaboration comes from the same model used to estimate b1 and b2. Itis the regression weight for surveillance gratifications in the model of knowledge, controlling forattention and elaboration: c ′ = 0.087. From equation (2), observe that the total effect is indeedequal to the sum of the direct effect and the two specific indirect effects (or, equivalently, the directeffect plus the total indirect effect): 0.177 = 0.087 + 0.060 + 0.030.
In many instances, the single-step multiple mediator model is a much more realistic modelof a process than is the simple mediation model, as effects often function through multiplemediators. When this is so and the investigator fails to include all the mediators that might be atwork producing an effect, the simple mediation model can produce estimates of indirect effectsthat are statistically biased, in the same way that leaving an important variable out of a regressionmodel related to one or more of the predictors and the outcome can bias the regression coefficientfor those predictors. Indeed, it could be argued that direct effects in principle don’t exist—thatany direct effect that exists in a simple mediator model probably is itself mediated in some way,and the inclusion of another mediator in the model would likely shrink that direct effect towardzero. Thus, investigators should be open to investigating simultaneous indirect effects throughmultiple mediators. Furthermore, by doing so, it is possible to test for differences in the size ofindirect effects through different mediators, as we discuss later.
Multiple-Step Multiple Mediator Model
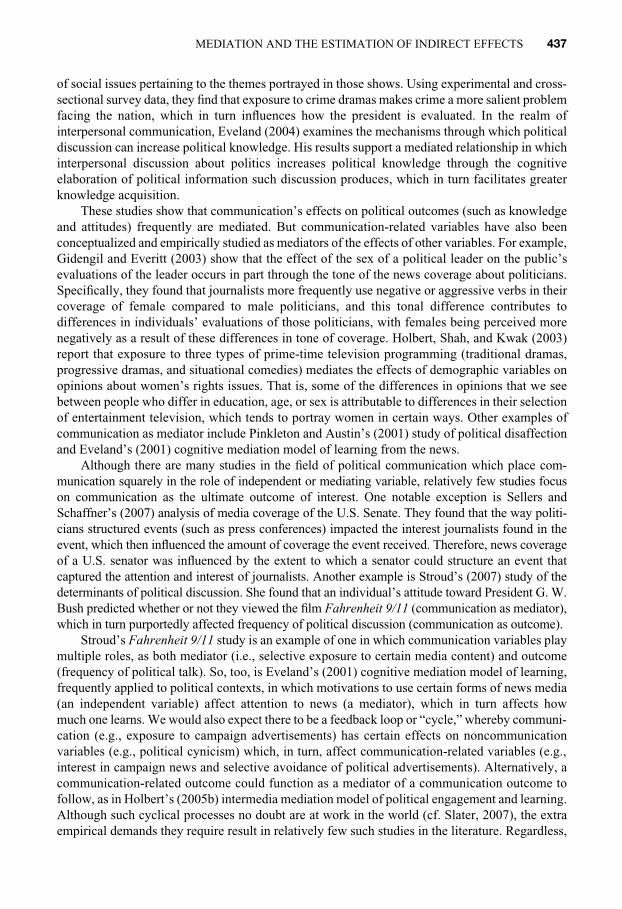
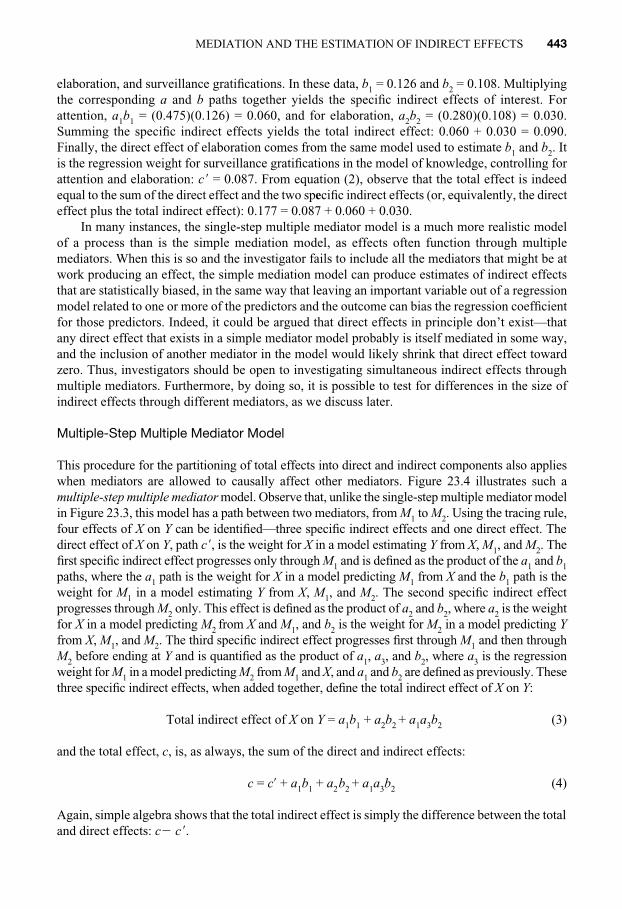
This procedure for the partitioning of total effects into direct and indirect components also applieswhen mediators are allowed to causally affect other mediators. Figure 23.4 illustrates such amultiple-step multiple mediator model. Observe that, unlike the single-step multiple mediator modelin Figure 23.3, this model has a path between two mediators, from M1 to M2. Using the tracing rule,four effects of X on Y can be identified—three specific indirect effects and one direct effect. Thedirect effect of X on Y, path c ′, is the weight for X in a model estimating Y from X, M1, and M2. Thefirst specific indirect effect progresses only through M1 and is defined as the product of the a1 and b1paths, where the a1 path is the weight for X in a model predicting M1 from X and the b1 path is theweight for M1 in a model estimating Y from X, M1, and M2. The second specific indirect effectprogresses through M2 only. This effect is defined as the product of a2 and b2, where a2 is the weightfor X in a model predicting M2 from X and M1, and b2 is the weight for M2 in a model predicting Yfrom X, M1, and M2. The third specific indirect effect progresses first through M1 and then throughM2 before ending at Y and is quantified as the product of a1, a3, and b2, where a3 is the regressionweight for M1 in a model predicting M2 from M1 and X, and a1 and b2 are defined as previously. Thesethree specific indirect effects, when added together, define the total indirect effect of X on Y:
Total indirect effect of X on Y = a1b1 + a2b2 + a1a3b2 (3)
and the total effect, c, is, as always, the sum of the direct and indirect effects:
c = c′ + a1b1 + a2b2 + a1a3b2 (4)
Again, simple algebra shows that the total indirect effect is simply the difference between the totaland direct effects: c2 c ′.
MEDIATION AND THE ESTIMATION OF INDIRECT EFFECTS 443
443
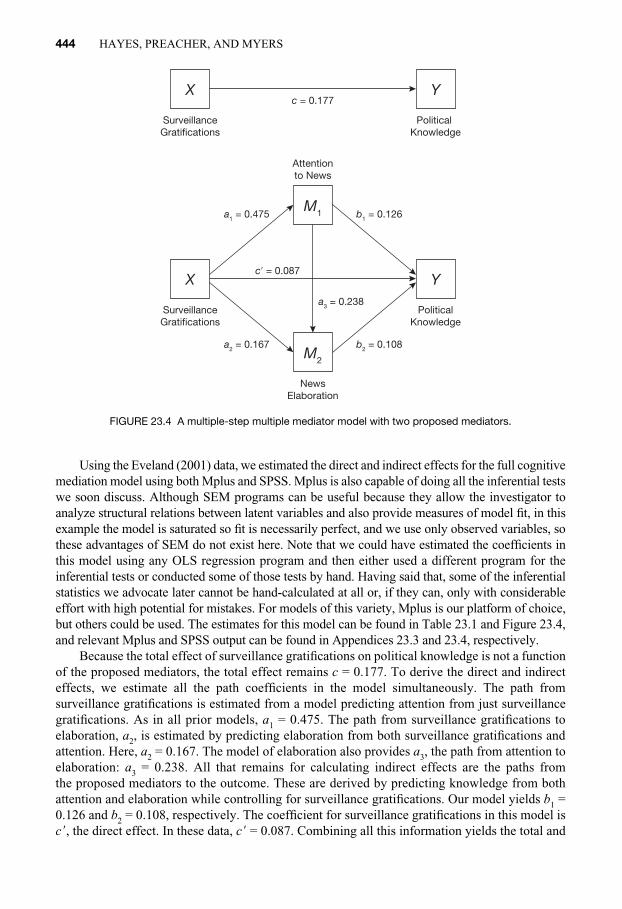
Using the Eveland (2001) data, we estimated the direct and indirect effects for the full cognitivemediation model using both Mplus and SPSS. Mplus is also capable of doing all the inferential testswe soon discuss. Although SEM programs can be useful because they allow the investigator toanalyze structural relations between latent variables and also provide measures of model fit, in thisexample the model is saturated so fit is necessarily perfect, and we use only observed variables, sothese advantages of SEM do not exist here. Note that we could have estimated the coefficients inthis model using any OLS regression program and then either used a different program for theinferential tests or conducted some of those tests by hand. Having said that, some of the inferentialstatistics we advocate later cannot be hand-calculated at all or, if they can, only with considerableeffort with high potential for mistakes. For models of this variety, Mplus is our platform of choice,but others could be used. The estimates for this model can be found in Table 23.1 and Figure 23.4,and relevant Mplus and SPSS output can be found in Appendices 23.3 and 23.4, respectively.
Because the total effect of surveillance gratifications on political knowledge is not a functionof the proposed mediators, the total effect remains c = 0.177. To derive the direct and indirecteffects, we estimate all the path coefficients in the model simultaneously. The path fromsurveillance gratifications is estimated from a model predicting attention from just surveillancegratifications. As in all prior models, a1 = 0.475. The path from surveillance gratifications toelaboration, a2, is estimated by predicting elaboration from both surveillance gratifications andattention. Here, a2 = 0.167. The model of elaboration also provides a3, the path from attention toelaboration: a3 = 0.238. All that remains for calculating indirect effects are the paths from the proposed mediators to the outcome. These are derived by predicting knowledge from bothattention and elaboration while controlling for surveillance gratifications. Our model yields b1 =0.126 and b2 = 0.108, respectively. The coefficient for surveillance gratifications in this model isc ′, the direct effect. In these data, c ′ = 0.087. Combining all this information yields the total and
444 HAYES, PREACHER, AND MYERS
444
X
M1
M2
Y
X Y
SurveillanceGratifications
Attentionto News
NewsElaboration
c′ = 0.087
a2 = 0.167
a1 = 0.475
a3 = 0.238
b2 = 0.108
b1 = 0.126
c = 0.177
PoliticalKnowledge
SurveillanceGratifications
PoliticalKnowledge
FIGURE 23.4 A multiple-step multiple mediator model with two proposed mediators.
specific indirect effects of surveillance gratifications. The specific indirect effect through attentiononly is a1b1 = (0.475)(0.126) = 0.060. The specific indirect effect through elaboration only is a2b2= (0.167)(0.108) = 0.018. The specific indirect effect through both attention and elaboration isa1a3b2 = (0.475)(0.238)(0.108) = 0.012. Adding up the specific indirect effects yields the totalindirect effect of surveillance gratifications on political knowledge: 0.060 + 0.018 + 0.012 = 0.090.Notice that as discussed earlier, the total effect is equal to the sum of the direct effect plus all theindirect effects: 0.177 = 0.087 + 0.060 + 0.018 + 0.012.
STATISTICAL INFERENCE ABOUT MEDIATION AND INDIRECT EFFECTS
In the prior section we explained the parsing of a total effect into direct and indirect components.To this point, our discussion of these effects has been a purely descriptive one—quantifying howchanges in X are related to changes in Y directly and indirectly through one or more mediators. Ofcourse, these estimates are subject to sampling error, given that the participants who participatedin the study were a random sample from the community in which data collection occurred. Ofinterest is whether the effects observed give us reason to believe that they represent a property ofthe population sampled rather than merely the vagaries of sampling error, i.e., “chance.” That is,is there evidence in the analysis that some kind of mediation process is at work in the population?We now shift to an inferential focus by discussing three popular ways of making inferences aboutmediation and indirect effects. These are by no means the only methods that are available, but wefocus on these three because they are fairly easy to conduct and are implemented in severalcomputing packages. For discussions of available inferential methods, see MacKinnon (2008) andPreacher and Hayes (2008a).
Causal Steps Approach
The causal steps procedure is the most widely implemented procedure for testing a mediationhypothesis (Baron & Kenny, 1986; Hyman, 1955). The popularity of this approach is no doubtdue in part to how easy it is to understand and implement. In essence, the causal steps procedurerequires the investigator to conduct a set of hypothesis tests for each link in a path diagram. Afailure to reject one or more of the null hypotheses leads one to claim an absence of evidence ofmediation.
Applied to a simple mediation model as in Figure 23.2, the causal steps approach first askswhether there is evidence of an effect to be mediated. That is, is the total effect of X on Y (i.e.,path c in Figure 23.2) statistically significant? If not, the investigator cannot claim mediation, asan effect that does not exist cannot be mediated, and further testing stops. Presuming that there isevidence of a relationship between X and Y, the investigator then tests for evidence that X is relatedto M (path a in Figure 23.2). Again, in the absence of a statistically significant relationship in amodel predicting M from X, testing for mediation stops and the investigator claims no mediationeffect. However, if this condition is met, the investigator then asks whether M is significantlyrelated to Y after controlling for X (path b in Figure 23.2). If not, the investigator claims nomediation. If b is significant, then the investigator examines the relative size of c and the partialeffect of X on Y controlling for M (path c ′ in Figure 23.2). If all effects are in the directionconsistent with the proposed mediation process, c ′ will typically be closer to zero than c is. If c ′is not statistically significant, the investigator claims that M completely mediates the effect of Xon Y. But if c ′ remains significant but closer to zero than c, then this supports a claim of partialmediation—that some but not all of the effect of X on Y is carried through M.
MEDIATION AND THE ESTIMATION OF INDIRECT EFFECTS 445
445
The causal steps procedure can, in principle, be applied to more complicated mediationmodels involving multiple mediators. The investigator can test each specific effect in a pathdiagram with multiple mediators by conducting a hypothesis test for each step in the path. If alllinks are significant and the pattern of the total and direct effects of X on Y is consistent with areduction in the effect of X after accounting for the proposed mediator or mediators, this suggestsmediation is at work through that mediator or mediators. However, problems arise when indirecteffects work in opposite directions. In such a situation, c (the total effect of X on Y) may not evenbe statistically significant. For this reason, we do not believe that a significant total effect shouldbe a prerequisite to testing for indirect effects using any of the methods we discuss in this chapter.This is an important point worth stressing again. Investigators should not condition the hunt forindirect effects on a significant total effect, for it is possible for an indirect effect to exist in theabsence of compelling evidence of a total effect (see Hayes, 2009, for a more detailed discussionand a concrete example).
In spite of its popularity—one might say even dominance in the research literature—wecannot advocate the routine use of the causal steps approach. There are two primary reasons forour position on this. First, the causal steps approach does not rely on an estimate of the indirecteffect, which is ultimately what carries information about X’s effect on Y through one or moreintervening variables. Thus, this method encourages researchers to not think about effect size, andit does not allow for the construction of a confidence interval for the indirect effect to acknowledgethe uncertainty in the estimation process. Second, it relies on a series of hypothesis tests whichrequires the investigator to think in categorical terms about each step of the model. Either an effectexists or not, and if any of the criteria are not met, the investigator is left with nothing. There wouldbe nothing inherently wrong with this if the causal steps procedure led the investigator to thecorrect conclusion given the data available. But, unfortunately, the causal steps procedure isamong the lowest in power among tests of the effect of intervening variables in causal models(MacKinnon, Lockwood, Hoffman, West, & Sheets, 2002; MacKinnon, Lockwood, & Williams,2004).
Product of Coefficients Approach
Unlike the causal steps approach, the product of coefficients approach acknowledges that theinvestigator has an estimate of an indirect effect—the product of estimates of the paths linking Xto Y through a specific mediator variable M—and inferences about the indirect effects andmediation are based on that estimate. Like any statistic, the product of these regression coefficients(ab) has a sampling distribution. And, like any sampling distribution, the sampling distribution ofab has a standard deviation. The standard deviation of the sampling distribution of ab—alsoknown as the standard error of ab—can be estimated and used for hypothesis testing and theconstruction of confidence intervals for the indirect effect. Typically, the investigator would beinterested in testing the null hypothesis that the population indirect effect is equal to zero.Rejection of the null hypothesis implies that there is an indirect effect of X on Y through a givenmediator M. This procedure is popularly known as the Sobel test (after Sobel, 1982). Alternatively,the investigator could construct a confidence interval for the population value of ab and makeinferences about its size (including whether zero is a plausible value for the indirect effect).
There are numerous formulae circulating for how to estimate the standard error of ab thatapplies to single-step simple and multiple mediator models. The formula implemented in thePreacher and Hayes (2004) macro used in the simple mediation model above is
sab = Χb2s2a§+ a2§s2
b §+ s2a§s2
b (5)
446 HAYES, PREACHER, AND MYERS
446
where a2 and b2 are the squares of the estimates for the paths from X to M and M to Y, respectively,and s2
a and s2b are the squared standard errors of those path coefficients. An alternative formula
subtracts s2as
2b under the radical in (5) rather than adding it, and another omits the s2
as2b term
altogether (see, e.g., Goodman, 1960). In practice, the difference between these approaches issmall and it usually matters little which formula is used. How to best estimate the standard erroris a moot question when using bootstrapping, the approach we ultimately favor and discuss later.
Once the standard error is estimated, the ratio of the indirect effect to its standard error(typically denoted as Z) is used as a test statistic for testing the null hypothesis that the populationindirect effect is zero. The p-value for this ratio is derived in reference to the standard normaldistribution, as this approach assumes that the sampling distribution of ab is normal. Alternatively,a 95% confidence interval (CI) for the indirect effect can be derived in the usual way, as
95% CI = ab ± 1.96sab (6)
If 0 is not in the confidence interval, one can claim that there is evidence of an indirect effectlinking X and Y through that mediator with 95% confidence. Confidence intervals for differentlevels of confidence can be used by substituting the appropriate critical value in equation (6) forthe desired confidence (e.g., 2.57 for 99% confidence).
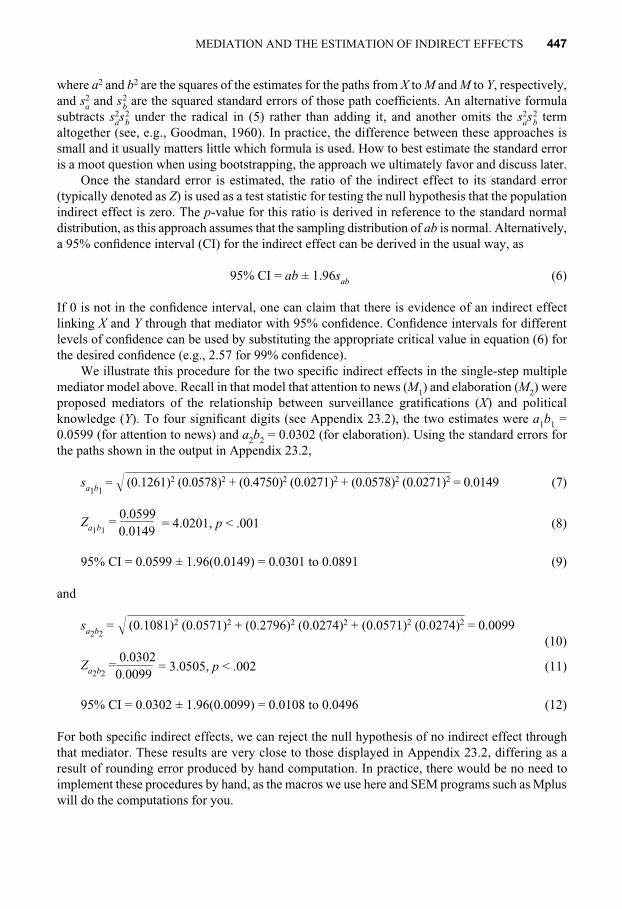
We illustrate this procedure for the two specific indirect effects in the single-step multiplemediator model above. Recall in that model that attention to news (M1) and elaboration (M2) wereproposed mediators of the relationship between surveillance gratifications (X) and politicalknowledge (Y). To four significant digits (see Appendix 23.2), the two estimates were a1b1 =0.0599 (for attention to news) and a2b2 = 0.0302 (for elaboration). Using the standard errors forthe paths shown in the output in Appendix 23.2,
sa1b1= Î (0.1261)2 (0.0578)2 + (0.4750)2 (0.0271)2 + (0.0578)2 (0.0271)2 = 0.0149 (7)
Za1b1=
0.0599 0.0149
= 4.0201, p < .001 (8)
95% CI = 0.0599 ± 1.96(0.0149) = 0.0301 to 0.0891 (9)
and
sa2b2= Î (0.1081)2 (0.0571)2 + (0.2796)2 (0.0274)2 + (0.0571)2 (0.0274)2 = 0.0099
(10)
Za2b2=
0.0302 0.0099
= 3.0505, p < .002 (11)
95% CI = 0.0302 ± 1.96(0.0099) = 0.0108 to 0.0496 (12)
For both specific indirect effects, we can reject the null hypothesis of no indirect effect throughthat mediator. These results are very close to those displayed in Appendix 23.2, differing as aresult of rounding error produced by hand computation. In practice, there would be no need toimplement these procedures by hand, as the macros we use here and SEM programs such as Mpluswill do the computations for you.
MEDIATION AND THE ESTIMATION OF INDIRECT EFFECTS 447
447
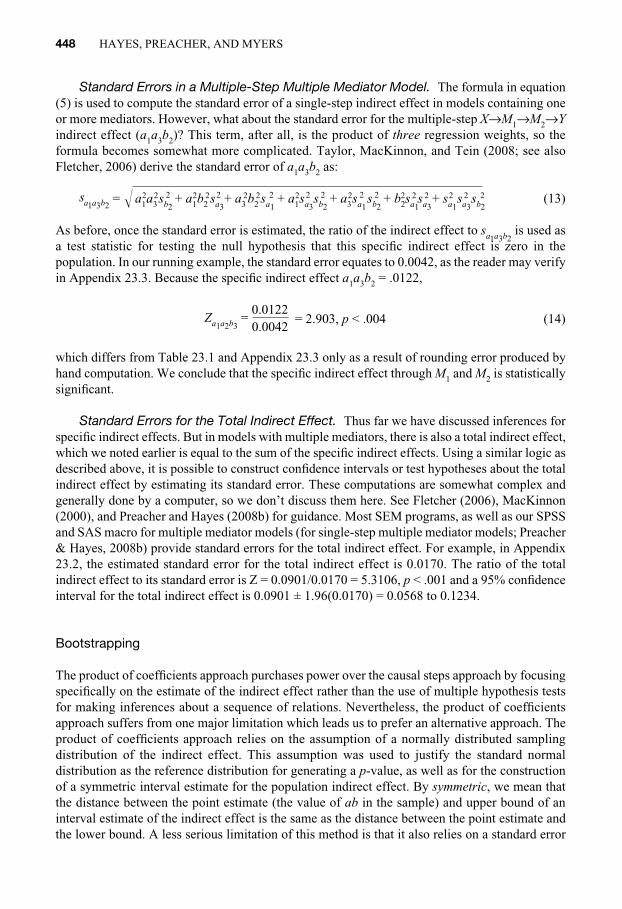
Standard Errors in a Multiple-Step Multiple Mediator Model. The formula in equation(5) is used to compute the standard error of a single-step indirect effect in models containing oneor more mediators. However, what about the standard error for the multiple-step X→M1→M2→Yindirect effect (a1a3b2)? This term, after all, is the product of three regression weights, so theformula becomes somewhat more complicated. Taylor, MacKinnon, and Tein (2008; see alsoFletcher, 2006) derive the standard error of a1a3b2 as:
sa1a3b2= Î a1
2a32sb2
2 + a12b2
2sa3
2 + a32b2
2sa1
2 + a12sa3
2 sb2
2 + a32sa1
2 sb2
2 + b22sa1
2sa32 + sa1
2 sa32 sb2
2 (13)
As before, once the standard error is estimated, the ratio of the indirect effect to sa1a3b2is used as
a test statistic for testing the null hypothesis that this specific indirect effect is zero in thepopulation. In our running example, the standard error equates to 0.0042, as the reader may verifyin Appendix 23.3. Because the specific indirect effect a1a3b2 = .0122,
Za1a2b3=
0.0122 0.0042
= 2.903, p < .004 (14)
which differs from Table 23.1 and Appendix 23.3 only as a result of rounding error produced byhand computation. We conclude that the specific indirect effect through M1 and M2 is statisticallysignificant.
Standard Errors for the Total Indirect Effect. Thus far we have discussed inferences forspecific indirect effects. But in models with multiple mediators, there is also a total indirect effect,which we noted earlier is equal to the sum of the specific indirect effects. Using a similar logic asdescribed above, it is possible to construct confidence intervals or test hypotheses about the totalindirect effect by estimating its standard error. These computations are somewhat complex andgenerally done by a computer, so we don’t discuss them here. See Fletcher (2006), MacKinnon(2000), and Preacher and Hayes (2008b) for guidance. Most SEM programs, as well as our SPSSand SAS macro for multiple mediator models (for single-step multiple mediator models; Preacher& Hayes, 2008b) provide standard errors for the total indirect effect. For example, in Appendix23.2, the estimated standard error for the total indirect effect is 0.0170. The ratio of the totalindirect effect to its standard error is Z = 0.0901/0.0170 = 5.3106, p < .001 and a 95% confidenceinterval for the total indirect effect is 0.0901 ± 1.96(0.0170) = 0.0568 to 0.1234.
Bootstrapping
The product of coefficients approach purchases power over the causal steps approach by focusingspecifically on the estimate of the indirect effect rather than the use of multiple hypothesis testsfor making inferences about a sequence of relations. Nevertheless, the product of coefficientsapproach suffers from one major limitation which leads us to prefer an alternative approach. Theproduct of coefficients approach relies on the assumption of a normally distributed samplingdistribution of the indirect effect. This assumption was used to justify the standard normaldistribution as the reference distribution for generating a p-value, as well as for the constructionof a symmetric interval estimate for the population indirect effect. By symmetric, we mean thatthe distance between the point estimate (the value of ab in the sample) and upper bound of aninterval estimate of the indirect effect is the same as the distance between the point estimate andthe lower bound. A less serious limitation of this method is that it also relies on a standard error
448 HAYES, PREACHER, AND MYERS
448
formula based on mathematical theory that is itself based on certain assumptions. Furthermore,there are several standard error formulas for the indirect effect, and it is not clear whether one orthe other is best in a given situation.
The problem with assumptions is that they are not always justified or met, and in this case,we know that the assumption of a normally distributed sampling distribution for the indirect effectsimply is not justified, at least not in small samples (Bollen & Stine, 1990). Instead, it is skewedand kurtotic. Although this distribution approaches normality with increasingly larger samples, itis difficult to know in a particular application whether this assumption is reasonable, making ithard to justify the use of the normal distribution as the reference distribution for generating a p-value for the Sobel test. Furthermore, it means that a confidence interval, if it accurately reflectedthe asymmetric of the sampling distribution of the indirect effect, would not and should not besymmetric. That is, the distances between the upper and lower bounds of a confidence intervaland the point estimate should differ.
Although researchers have been satisfied to rely on assumptions about the shape of distri-butions throughout the history of statistics and its application to real data problems, in moderntimes it is not necessary to rely on obsolete assumptions known to be incorrect. An alternativemethod for making inferences about indirect effects exists that does not rely on the normalityassumption: bootstrapping. Bootstrapping is a member of the category of statistical methodssometimes called resampling methods, in that it relies on the repeated sampling of the data set toempirically estimate properties of the sampling distribution of a statistic. The resampling of thedata set allows the investigator to relax many of the assumptions that ordinary inferential statisticsrequire. A few decades ago, bootstrapping was nice in theory but somewhat difficult to implementin practice because of the computing power it requires. But desktop computing power hasincreased substantially since the invention of bootstrapping and, as a result, this approach tostatistical inference has gained in popularity. New applications of the method are appearing in theempirical journals regularly. There are numerous books and journal articles that describe boot-strapping (e.g., Boos, 2003; Efron & Tibshirani, 1993; Stine, 1989), and we encourage the readerto explore this fascinating method in greater detail. In the interest of space, here we focus on theapplication of bootstrapping to the problem at hand—making inferences about the size of indirecteffects in the kinds of mediation models discussed in this chapter.
As with all statistical methods, bootstrapping starts with a sample of size n from somepopulation of interest. With bootstrapping, this sample is treated as a pseudopopulation thatrepresents the population from which the sample was derived. More specifically, bootstrappingassumes that the data set with n cases that the investigator has available represents, in a sense, thepopulation in miniature—that the distributions of the variables measured (i.e., the relativefrequency of various observed measurements) are fairly similar to the distributions that wouldhave been observed had the entire population been available for measurement. With this construalof the sample as a pseudopopulation, bootstrapping requires that the investigator take a simplerandom sample of size n from the original sample with replacement, meaning that when a case israndomly drawn to be included in the new sample, that case is put back to potentially be redrawnin that same sample. In this “resample” of size n from the original sample (which, remember, isalso of size n) the coefficients of the model are estimated and recorded. So, for instance, for asimple mediation model, the investigator estimates the a and b paths in this resample of theoriginal sample. This process is then repeated by taking a new resample of size n, again from theoriginal sample, and a and b are estimated again. Of course, the two values of a in these tworesamples will differ from each other, as will the two values of b, just as a and b would differ fromsample to sample when sampling from the full population. This process is repeated a total of ktimes, with k at least 1,000, although the larger the k the better. After k resamples, k estimates of
MEDIATION AND THE ESTIMATION OF INDIRECT EFFECTS 449
449
a and b and, therefore, the product of a and b are available. This distribution of k values of ab,each estimated in a resample of size n from the original sample, represents an empiricalapproximation of the sampling distribution of the indirect effect of X on Y through M when takinga sample of size n from the full population. It is this empirically derived representation of thesampling distribution that is used for making inferences about the indirect effect.
Observe that this method can be used to make inferences about all of the effects in a mediationmodel—direct, specific indirect, total indirect. Furthermore, it can be used for mediation modelsof any complexity. For instance, in a single-step multiple mediation model, one can simul-taneously generate a bootstrap approximation of the sampling distribution for each of the specificindirect effects by calculating (for a two-mediator model) a1b1 and a2b2 in each of the k resamples.Or in a multiple-step multiple mediator model as in Figure 23.4, the sampling distribution of theindirect effect of X on Y through M1 and M2 can be estimated k times by estimating a1a3b2 (alongwith a1b1 and a2b2) in each resample. Indeed, bootstrapping can be used to estimate the samplingdistribution of nearly any statistic one might want to compute.
Before describing how these k estimates of an indirect effect can be used to our advantage,let us pause and contemplate the elegance of this method. Traditionally, statistical methods relyon various statistical theories about the behavior of a statistic, such as the Central Limit Theorem,when sampling from a population. By relying on theory, all that is needed is a single sample inorder to make inferences about the population from which the sample was derived. Butapplications that rely on statistical theories often make assumptions, such as assumptions aboutthe shape of the sampling distribution of the statistic. Bootstrapping eliminates the need for suchassumptions about the shape of the sampling distribution because it relies on an empirical approxi-mation of the sampling distribution by mimicking the sampling process. When bootstrapping,each case in the original sample is construed as an exemplar or representative of all units in thepopulation like it. This is why any case that is resampled is put back into the pool to be potentiallyredrawn when building each resample. In other words, if “John” happened to be included in theoriginal sample, John is used to represent all the other people just like John in the population whocould have been included in the sample but happened not to be. Thus, John could show up severaltimes (or never) in a single resample, just like many people just like John could have ended up inthe original sample but perhaps were not. By mimicking the sampling process in this way,bootstrapping empirically approximates the sampling distribution of the indirect effect whentaking a random sample of size n from a larger population.
So what do we do with these k estimates of an indirect effect once they are calculated? Thereare many applications. For example, one could calculate the standard deviation of the k estimatesand use this as the standard error in the Sobel test rather than the standard error based on atheoretical formula (of which there are several, as described above). This would yield a “bootstrapSobel test” of sorts. Indeed, the SPSS outputs in Appendices 23.1 and 23.2 provide the standarddeviation of the bootstrap sampling distribution of the indirect effect (under “S.E.” in the“Bootstrap Results” section), as do some SEM programs that bootstrap. But if the p-value isgenerated using the standard normal distribution, this does not eliminate the very problem thatleads us to prefer bootstrapping in the first place, in that it still relies on the assumption of anormally distributed sampling distribution of the indirect effect. So we do not recommend abootstrap-based Sobel test.
Instead, we recommend the use of bootstrap confidence intervals for making inferences aboutindirect effects. A bootstrap confidence interval for the indirect effect is constructed by sortingthe distribution of k indirect effect estimates from low to high and then finding the estimates inthis sorted distribution that define the LL = (k / 100)(50–δ / 2)th and UL = [(k / 100) (δ / 2) + 1]thposition in this list, where δ is the desired confidence level for the interval. The estimate in the
450 HAYES, PREACHER, AND MYERS
450
LLth position is the lower limit of the confidence interval, and the estimate in the ULth positionis the upper limit. For instance, for a δ = 95% confidence interval based on 5000 bootstrapsamples, LL = (5000 / 100)(50–95/2) = 125 and UL = (5000 / 100)(50 + 95/2) + 1 = 4876. So thelower and upper limits of the confidence interval are the 125th and 4876th estimates in the list,respectively. Although this sounds obtuse when described formally, this procedure does nothingother than delineate the inner δ% of the sampling distribution of the indirect effect. In other words,the indirect effect estimate in the LLth and ULth positions cut off the lower and upper0.5(100–δ)% of the sampling distribution from the rest of the distribution. Typically, the lowerand upper limits of the confidence interval will not be equidistant from the point estimate of theindirect obtained in the original sample because the empirical approximation of the samplingdistribution of the indirect effect will usually be skewed. As a result, a bootstrap confidenceinterval is sometimes called an asymmetric interval estimate.
The approach we just described is known as the percentile bootstrap, and it is the methodimplemented in our SPSS and SAS macros for simple mediation models (Preacher & Hayes,2004) and SPSS for multiple-step multiple mediator models of the form in Figure 23.4 (seeAppendix 23.4). As can be seen in Appendix 23.1, based on 5000 bootstrap samples, the 95%confidence interval for the indirect effect of surveillance gratifications on knowledge throughattention to news is 0.0422 to 0.1072 (note that a 99% CI is also provided in the output). As zerois not in this interval, we can say with 95% confidence that the “true” indirect effect is positive.Technically, we cannot say that we are rejecting the null hypothesis that the indirect effect is zeroat a 0.05 level of significance because this is not really a null hypothesis test as a hypothesis testis formally defined. Nevertheless, our substantive conclusion is that the indirect effect is probablynot zero. It is likely to be somewhere between about 0.042 and 0.107, with the obtained indirecteffect of 0.072 being a sensible point estimate. Notice that, as promised, the confidence intervalis asymmetric; the upper and lower bounds of the confidence interval are not the same distancefrom the point estimate of 0.072, reflecting the skew in the sampling distribution of the indirecteffect.
Bootstrap confidence intervals can be made more accurate through the use of bias correctionor through bias correction and acceleration, yielding a bias corrected (BC) or bias corrected andaccelerated (BCa) confidence interval. These adjustments defy nonmathematical explanation, sowe refer the reader elsewhere for the details (Efron, 1987; Efron & Tibshirani, 1993). Suffice itto say that they adjust the upper and lower limits of the interval estimate so as to produce intervalsthat are more likely to contain the true indirect effect without changing the level of confidence.Neither adjustment is clearly superior to the other, and in practice it makes little differencewhether BC or BCa limits are used, although one or the other is generally preferred to percentilebootstrap intervals. Mplus has implemented both percentile and BC bootstrap confidence intervalsbut prints only 95% and 99% intervals. In Appendix 23.3, BC confidence intervals are printed forall three indirect effects and the total effect in the multiple-step multiple mediator model corres-ponding to the cognitive mediation model. As can be seen, for all these indirect effects, the 95%BC confidence intervals do not contain zero, suggesting evidence for a positive indirect effect foreach and every indirect path from surveillance gratifications to political knowledge. Our SPSSand SAS macros for single-step multiple mediator models allow the user to specify which amongall three methods to calculate, including all three at once if desired, and the user can specify anylevel of desired confidence. In Appendix 23.2, bias corrected and accelerated confidence intervalsare displayed for the two specific indirect effects in that model as well as the total indirect effect.Again, all are positive.
We believe bootstrapping is the most sensible approach to assessing the size of indirecteffects. It makes no assumptions about the shape of the sampling distribution. It does not require
MEDIATION AND THE ESTIMATION OF INDIRECT EFFECTS 451
451
the investigator to think about each step in a causal sequence in dichotomous terms (i.e., signi-ficant or not). And given that it does not rely on the computation of a standard error, it is immuneto problems that can arise when the assumptions associated with the use of a standard error arenot met. When combined, these properties of bootstrapping are no doubt what accounts for the findings from various simulations that bootstrapping has greater statistical power than theproduct of coefficients strategy for detecting indirect effects when they are present (Briggs, 2006;MacKinnon et al., 2002, 2004; Williams & MacKinnon, 2008).
Having said this, at the same time we do not want to overstate our case. In many instances,the choice of which method to use will matter little in terms of substantive findings, as was thecase in the analyses presented above. This would tend to be true in large samples or when effectsare large enough to be detected with power near 1. But researchers often do not have the luxuryof large samples or the kinds of sample sizes that make inferential tests a mere formality. In thosesituations, the choice of method can make a difference. When given the choice, bootstrapping isour preferred method.
Comparing Specific Indirect Effects
An indirect effect is free of the scale of measurement of the mediator or mediators in the model.That is, the indirect effect quantifies how much Y is expected to change on the Y measurementscale through M as X changes by one unit on the X measurement scale, irrespective of the scaleof the mediator or mediators that the causal influence passes through (see Preacher & Hayes,2008b, for an informal proof of this point). Therefore, it is possible to make meaningful com-parisons, both descriptive and inferential, between the sizes of indirect effects in models with morethan one mediator. For example, in the single-step multiple mediator model described earlier, isthe indirect effect of surveillance gratifications on political knowledge larger through attention tonews or elaboration of news content?
To answer such a question, all that is necessary is a quantification of the difference betweenspecific indirect effects and either an estimate of the standard error of the sampling distributionof the difference or, alternatively, the ability to bootstrap that sampling distribution. Mplus,LISREL, and our SPSS and SAS macros for multiple mediator models provide standard errors forpairwise comparisons between specific indirect effects as well as the ability to bootstrap thesampling distribution of the difference. Notice in Appendix 23.2, for example, the lines of theoutput that read “C1.” These lines provide the difference between the specific indirect effect ofsurveillance on knowledge through attention and through elaboration (i.e., a1b12a2b2), includingthe standard error for this difference as well as a Z and p-value for testing the null hypothesis ofno difference. A bootstrap 95% CI is also provided in the bootstrap section of the output. Both ofthese approaches point to the same conclusion—that there is no evidence that these specificindirect effects differ from each other in size. Preacher and Hayes (2008b) provide Mplus andLISREL code for conducting comparisons between indirect effects in those SEM programs, andMacKinnon (2000) describes simple and complex contrasts between specific indirect effects.
MEDIATION IN MORE COMPLEX MODELS
The mediation models we have described to this point all have been variations on the same theme.Simply put, there is an effect of X on Y that needs explaining, and the models we have describedrepresent different hypotheses about the means by which X exerts its influence on Y. Theresearcher may posit one mediator to explain the effect, or even two or more mediators acting in
452 HAYES, PREACHER, AND MYERS
452
tandem in a variety of ways (see Figures 23.1, 23.3, and 23.4 for simple examples). As causalmodels go, these are relatively simple ones. But such simple causal models are rarely sufficientto describe and explain the complexity of social phenomena and causal processes that are the focusof much communication research.
The basic mediation model may be (and has been) extended in a number of ways. We havealready described a few alternative methods of testing mediation hypotheses; there are many morethat we did not discuss, and these issues are currently being debated, studied, and resolved in anextensive methodological literature (see, e.g., MacKinnon, 2008; MacKinnon et al., 2002, 2004).Mediation modeling has also been extended to accommodate nonnormal data (Finch, West, &MacKinnon, 1997), binary data (Huang, Sivaganesan, Succop, & Goodman, 2004; Li, Schneider,& Bennett, 2007; MacKinnon, Lockwood, Brown, Wang, & Hoffman, 2007), multilevel orhierarchical data (Bauer, Preacher, & Gil, 2006; Kenny, Korchmaros, & Bolger, 2003), andsurvival data (Tein & MacKinnon, 2003). New models and ways of thinking about mediation havebeen proposed (Cole & Maxwell, 2003; Collins, Graham, & Flaherty, 1998). The variety andcomplexity of models that may be proposed is enormous. We have scarcely scraped the surface,and much is yet to be discovered.
In the sections that follow, we describe extensions of the basic mediation model that may beof particular interest to political communication scientists. Specifically, we address the interfaceand combination of mediation and moderation effects, and mediation models for longitudinal data.Finally, we emphasize the value of including covariates and (whenever possible) using latentvariable models to provide unbiased effects.
Moderated Mediation and Mediated Moderation
Moderation (or interaction) effects are common in political communication research. Moderationoccurs when the effect of X on Y depends on a moderator variable W. For example, Scheufele(2002) hypothesized (and found) that the impact of people’s exposure to hard news content (X)on political participation (Y) would be moderated by interpersonal discussion about politics (W).Moderation hypotheses like this are usually tested by including the product term XW (along withconditional terms X and W) as a predictor of Y in a regression or SEM context. If the coefficientfor XW is statistically significant, then W is said to moderate the effect of X on Y, and furtherplotting and exploration are often warranted (Aiken & West, 1991; Bauer & Curran, 2005; Hayes& Matthes, 2009).
It is not difficult to imagine scenarios in which a moderation effect is itself hypothesized tobe mediated by some intervening variable M. Likewise, it is simple to imagine scenarios in whicha mediation effect is thought to be moderated by some variable W. Such effects are called,respectively, mediated moderation and moderated mediation, and statistical methods exist toassess these processes.
Mediated moderation hypotheses are becoming increasingly common in political communi-cation research. For example, Scheufele (2002) hypothesized that the interactive effect of hardnews exposure and political discussion on political participation would be mediated by politicalknowledge (M). Mediated moderation is particularly easy to assess. Say we have demonstrated aninteraction effect of X and W predicting Y. That is, the effect of X may be of a different magnitude,or even a different sign, for different values of W. This effect must somehow find its way to Y,and it is not unreasonable to suppose that it does so via a mediator M. The researcher wouldspecify a model in which X and W interact in predicting M, which in turn may predict Y. If theinteraction slope of XW on Y is denoted a3, and the effect of M on Y (controlling for X, W, andXW) is denoted b, then the mediated moderation effect is simply a3b. The significance of this effect
MEDIATION AND THE ESTIMATION OF INDIRECT EFFECTS 453
453
may be determined by any of the methods we described earlier, although we particularly recom-mend using bootstrap confidence intervals. The SPSS and SAS macros provided for multiplemediator models (Preacher & Hayes, 2008b) can be used to assess such effects. Only one mediatoris involved, but the macros permit the inclusion of X and W as covariates, with XW serving as theprimary predictor.
Mediation processes may also be moderated. For example, Holbert (2005b) tests a moderatedmediation hypothesis showing that the indirect path from TV news viewing to attitudes aboutgovernment involvement in social issues via perceptions of the government’s role is different forDemocrats, Republicans, and Independents. This analysis was accomplished using multiple-groupSEM, but the moderator variable (political affiliation in this example) may be continuous orcategorical. Moderated mediation is somewhat more difficult to assess than mediated moderation,but methods exist (Edwards & Lambert, 2007; Preacher, Rucker, & Hayes, 2007). The basic ideais to specify one’s model as a path model and consider which path or paths are expected, on thebasis of theory, to be moderated by one or more potential moderator variables. Product terms arethen entered into the model in the appropriate places, which will differ from situation to situation.Once the model is estimated, the researcher can plot, and explore the significance of, conditionalindirect effects—that is, indirect effects at specific values of the moderator(s) that are of keytheoretical interest. Preacher et al. (2007) provide an SPSS macro that considerably eases theburden on researchers.
Mediation in Longitudinal Studies
Mediation models are causal models. One implication of a simple mediation model is that if casei’s X value were changed in some fashion, then case i’s M value would change as a result, and thischange in M would in turn cause case i’s Y value to change. In the examples used throughout thischapter, such a strong causal interpretation is hard to justify in spite of the statistical evidencebecause there has been no measurement of change and no manipulation of one or more of theproposed causal agents. Instead, claims of mediation in the examples described thus far have beenbased on a cross-sectional or between-persons argument—that people who differ in X also differon M as a result of those differences in X, which in turn produce differences between those peoplein Y. Longitudinal designs, where X, M, and Y are measured repeatedly at set intervals, allow forthe actual assessment of change over time, and this can give the researcher much greaterconfidence in a mediation claim when it can be substantiated that difference is actually related tothe specified variables.
There is a growing literature on the testing of mediation when the variables in the proposedcausal system are measured over time. One approach is the use of the standard cross-lagged paneldesign. For example, to examine the indirect effect of negative political advertisements (X) onpolitical participation (Y) through its effects on political cynicism (M), an investigator couldmeasure these three variables at three or more times during an election season, preferably withroughly equally spaced intervals that are appropriately timed given the causal process beingstudied. With such a design, indirect effects can be calculated as the product of the effect of adexposure at time 1 on political cynicism at time 2 and the effect of political cynicism at time 2 onpolitical participation at time 3 all while controlling for temporal stability in the variables overtime as well as direct effects between ad exposure and participation that reach across time. In sucha design, change is operationalized somewhat loosely as being either higher or lower on theoutcome variable than would be expected given the prior measurement on that variable and othervariables in the model. There are many assumptions that one must make when using such anapproach to the analysis of mediation, and there are still alternative explanations that can account
454 HAYES, PREACHER, AND MYERS
454
for indirect effects in such models. Careful thought must go into the planning of a longitudinaldesign such as this. For guidance, we recommend Cole and Maxwell (2003), Little, Preacher,Selig, and Card (2007), and Maxwell and Cole (2007).
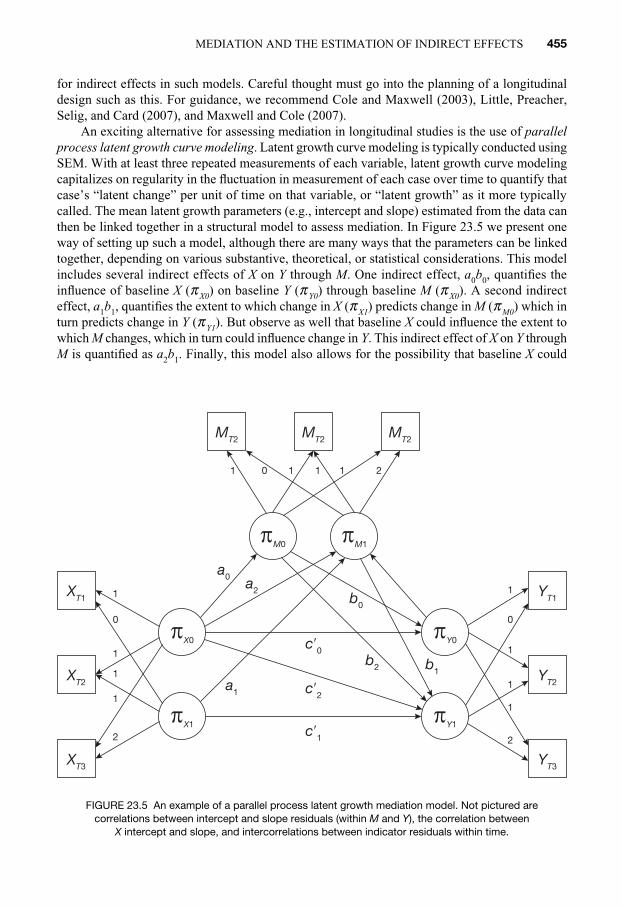
An exciting alternative for assessing mediation in longitudinal studies is the use of parallelprocess latent growth curve modeling. Latent growth curve modeling is typically conducted usingSEM. With at least three repeated measurements of each variable, latent growth curve modelingcapitalizes on regularity in the fluctuation in measurement of each case over time to quantify thatcase’s “latent change” per unit of time on that variable, or “latent growth” as it more typicallycalled. The mean latent growth parameters (e.g., intercept and slope) estimated from the data canthen be linked together in a structural model to assess mediation. In Figure 23.5 we present oneway of setting up such a model, although there are many ways that the parameters can be linkedtogether, depending on various substantive, theoretical, or statistical considerations. This modelincludes several indirect effects of X on Y through M. One indirect effect, a0b0, quantifies theinfluence of baseline X (π X0) on baseline Y (π Y0) through baseline M (π X0). A second indirecteffect, a1b1, quantifies the extent to which change in X (π X1) predicts change in M (π M0) which inturn predicts change in Y (π Y1). But observe as well that baseline X could influence the extent towhich M changes, which in turn could influence change in Y. This indirect effect of X on Y throughM is quantified as a2b1. Finally, this model also allows for the possibility that baseline X could
MEDIATION AND THE ESTIMATION OF INDIRECT EFFECTS 455
455
XT3
XT2
a0a2
a1
b0
b2
c′0
c′2
c′1
b1
XT1
YT3
YT2
YT1
MT2 MT2MT2
101
1
0
1
1
1
2
1
0
1
1
1
2
1 1 2
¹X0
¹M0 ¹M1
¹X1
¹Y0
¹Y1
FIGURE 23.5 An example of a parallel process latent growth mediation model. Not pictured are correlations between intercept and slope residuals (within M and Y), the correlation between
X intercept and slope, and intercorrelations between indicator residuals within time.
influence baseline M, which in turn influences change in Y, quantified as a0b2. The parallel processmodel for assessing mediation shows great promise when experimental manipulation of X is notpossible, but measurement over time is. Simons-Morton, Chen, Abroms, and Haynie (2004)present an application in a health communication context, but to our knowledge, this method hasnever been used in a political communication study. Cheong, MacKinnon, and Khoo (2003)discuss a form of the parallel process growth curve model where X is experimentally manipulatedat time 1 whereas M and Y are measured longitudinally over three occasions. In such a design, itis possible to assess whether the experimental manipulation changes the latent change trajectoryfor the proposed mediator and whether that change in turn is related to latent change in theoutcome.
Models with Covariates or Latent Variables
Thus far we have neglected to acknowledge that many models that political communicationresearchers would be interested in testing would include numerous statistical controls. For instance,it is common to estimate the paths in a mediation model after first partialing out demographicvariables such as sex, education, income, age, and so forth. The basic logic of the methods describedhere do not need modification to handle covariates. One version of our SPSS and SAS macros(Preacher & Hayes, 2008b) for multiple mediators, as well as the one for moderated mediation(Preacher et al., 2007) allows for the inclusion of covariates under the assumption that all covariatesare partialed out of all mediators and the outcome. When an SEM program such as Mplus is used,the inclusion of covariates is accomplished quite simply by including directional paths from thecovariates to whatever variable in the model the investigator desires, and all direct and indirect effectestimates, standard errors, and confidence intervals (bootstrapped or otherwise) will be correctlycalculated after statistical adjustment for the control variables.
In all examples we have presented in this chapter, the variables linked in causal sequence ineach model were treated as observed variables. Doing so greatly simplifies our discussion and alsoallows the use of the various macros we have produced for popular platforms such as SPSS andSAS. Of course, with few exceptions, it is usually not so much the observed measurements wecare about, but rather the latent variables that give rise to the observed measurements. Fortunately,all the methods we have discussed can be used to test mediation hypotheses involving latentvariables, although doing so requires the use of structural equation modeling rather than any ofthe macros we have described. An advantage of going latent is that it typically reduces one sourceof bias in the estimation of indirect effects that we have not acknowledged—measurement error.Mplus provides all the features the user will need to implement these methods, includingbootstrapping of structural paths and estimation of indirect effects.
RECOMMENDING FURTHER READING
In this chapter we have discussed the application of basic principles in the estimation of mediationand indirect effects to political communication research. Out of necessity, we have glossed overmany interesting controversies as well as important extensions. It is our hope that the discussionabove has stimulated readers to further explore the vast literature on this topic and to try some ofthe methods we describe here and others that can be found elsewhere. For a good starting place,we recommend MacKinnon (2008), which promises to be the seminal treatment of the analysis ofmediation. In it you will find examples of mediation analyses in many different fields, as well asvaluable guidance on how to conduct mediation analyses using data from numerous research
456 HAYES, PREACHER, AND MYERS
456
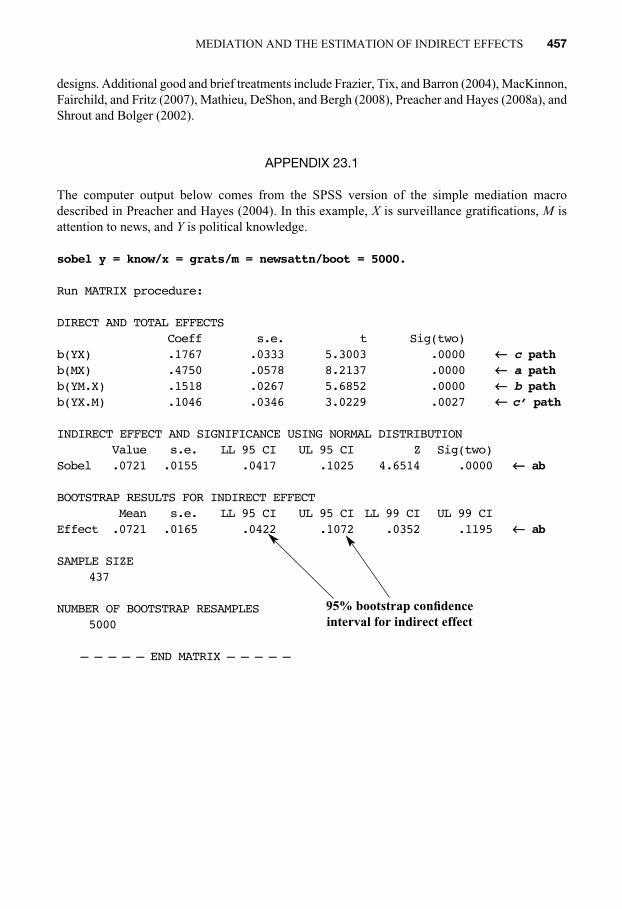
designs. Additional good and brief treatments include Frazier, Tix, and Barron (2004), MacKinnon,Fairchild, and Fritz (2007), Mathieu, DeShon, and Bergh (2008), Preacher and Hayes (2008a), andShrout and Bolger (2002).
APPENDIX 23.1
The computer output below comes from the SPSS version of the simple mediation macrodescribed in Preacher and Hayes (2004). In this example, X is surveillance gratifications, M isattention to news, and Y is political knowledge.
sobel y = know/x = grats/m = newsattn/boot = 5000.
Run MATRIX procedure:
DIRECT AND TOTAL EFFECTSCoeff s.e. t Sig(two)
b(YX) .1767 .0333 5.3003 .0000 ←← c pathb(MX) .4750 .0578 8.2137 .0000 ←← a pathb(YM.X) .1518 .0267 5.6852 .0000 ←← b pathb(YX.M) .1046 .0346 3.0229 .0027 ←← c’ path
INDIRECT EFFECT AND SIGNIFICANCE USING NORMAL DISTRIBUTIONValue s.e. LL 95 CI UL 95 CI Z Sig(two)
Sobel .0721 .0155 .0417 .1025 4.6514 .0000 ←← ab
BOOTSTRAP RESULTS FOR INDIRECT EFFECTMean s.e. LL 95 CI UL 95 CI LL 99 CI UL 99 CI
Effect .0721 .0165 .0422 .1072 .0352 .1195 ←← ab
SAMPLE SIZE437
NUMBER OF BOOTSTRAP RESAMPLES5000
– – – – – END MATRIX – – – – –
MEDIATION AND THE ESTIMATION OF INDIRECT EFFECTS 457
457
95% bootstrap confidenceinterval for indirect effect
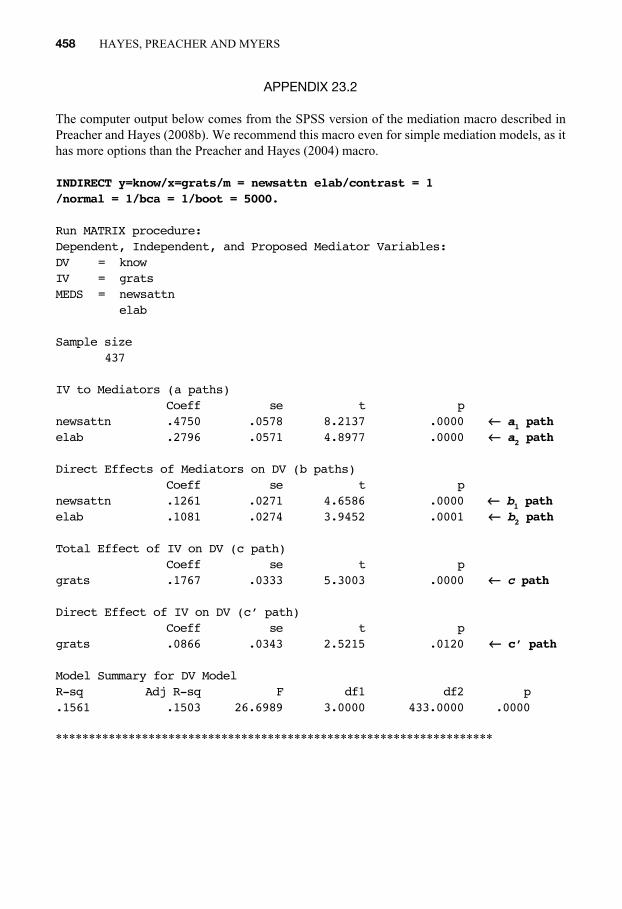
APPENDIX 23.2
The computer output below comes from the SPSS version of the mediation macro described inPreacher and Hayes (2008b). We recommend this macro even for simple mediation models, as ithas more options than the Preacher and Hayes (2004) macro.
INDIRECT y=know/x=grats/m = newsattn elab/contrast = 1/normal = 1/bca = 1/boot = 5000.
Run MATRIX procedure:Dependent, Independent, and Proposed Mediator Variables:DV = knowIV = gratsMEDS = newsattn
elab
Sample size437
IV to Mediators (a paths)Coeff se t p
newsattn .4750 .0578 8.2137 .0000 ←← a1 pathelab .2796 .0571 4.8977 .0000 ←← a2 path
Direct Effects of Mediators on DV (b paths)Coeff se t p
newsattn .1261 .0271 4.6586 .0000 ←← b1 pathelab .1081 .0274 3.9452 .0001 ←← b2 path
Total Effect of IV on DV (c path)Coeff se t p
grats .1767 .0333 5.3003 .0000 ←← c path
Direct Effect of IV on DV (c’ path)Coeff se t p
grats .0866 .0343 2.5215 .0120 ←← c’ path
Model Summary for DV ModelR-sq Adj R-sq F df1 df2 p.1561 .1503 26.6989 3.0000 433.0000 .0000
******************************************************************
458 HAYES, PREACHER AND MYERS
458
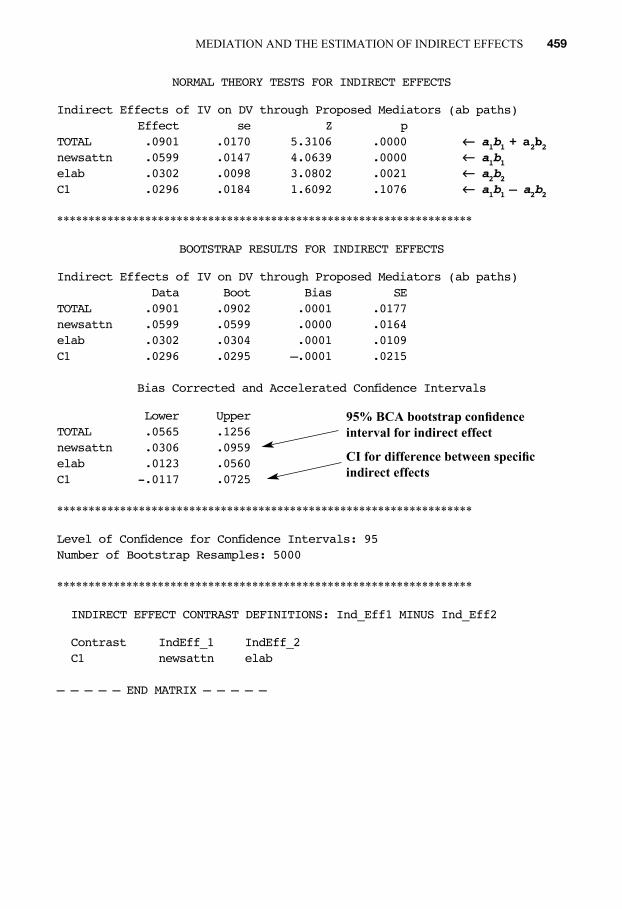
NORMAL THEORY TESTS FOR INDIRECT EFFECTS
Indirect Effects of IV on DV through Proposed Mediators (ab paths)Effect se Z p
TOTAL .0901 .0170 5.3106 .0000 ←← a1b1 + a2b2newsattn .0599 .0147 4.0639 .0000 ←← a1b1elab .0302 .0098 3.0802 .0021 ←← a2b2C1 .0296 .0184 1.6092 .1076 ←← a1b1 – a2b2
******************************************************************
BOOTSTRAP RESULTS FOR INDIRECT EFFECTS
Indirect Effects of IV on DV through Proposed Mediators (ab paths)Data Boot Bias SE
TOTAL .0901 .0902 .0001 .0177newsattn .0599 .0599 .0000 .0164elab .0302 .0304 .0001 .0109C1 .0296 .0295 –.0001 .0215
Bias Corrected and Accelerated Confidence Intervals
Lower UpperTOTAL .0565 .1256newsattn .0306 .0959elab .0123 .0560C1 -.0117 .0725
******************************************************************
Level of Confidence for Confidence Intervals: 95Number of Bootstrap Resamples: 5000
******************************************************************
INDIRECT EFFECT CONTRAST DEFINITIONS: Ind_Eff1 MINUS Ind_Eff2
Contrast IndEff_1 IndEff_2C1 newsattn elab
– – – – – END MATRIX – – – – –
MEDIATION AND THE ESTIMATION OF INDIRECT EFFECTS 459
459
95% BCA bootstrap confidenceinterval for indirect effect
CI for difference between specificindirect effects

APPENDIX 23.3
Mplus code and output for the multiple-step multiple mediator model discussed in the text. Theexclamation points in the code denote comments and should be removed to implement boot-strapping and to obtain bias-corrected confidence intervals for the indirect effects.
TITLE: Multiple Step Multiple Mediator ModelDATA:
FILE IS C:\CMM1985.dat;FORMAT IS free;
VARIABLE:NAMES ARE elab grats newsattn know;USEVARIABLES elab grats newsattn know;
ANALYSIS:! BOOTSTRAP = 5000;MODEL:
newsattn ON grats;elab on grats newsattn;know ON newsattn elab grats;
MODEL INDIRECT:know IND newsattn grats;know IND elab grats;know IND elab newsattn grats;
OUTPUT:! CINTERVAL(BCBOOTSTRAP);
– – – – – – – – – – – – – – – – – –
MODEL RESULTS
Two-TailedEstimate S.E. Est./S.E. P-Value
NEWSATTN ONGRATS 0.475 0.058 8.236 0.000 ←← a1 path
ELAB ONGRATS 0.167 0.059 2.805 0.005 ←← a2 pathNEWSATTN 0.238 0.046 5.190 0.000 ←← a3 path
KNOW ONNEWSATTN 0.126 0.027 4.680 0.000 ←← b1 pathELAB 0.108 0.027 3.963 0.000 ←← b2 pathGRATS 0.087 0.034 2.529 0.011 ←← c’ path
InterceptsKNOW -0.398 0.121 –3.291 0.001NEWSATTN 0.892 0.170 5.237 0.000ELAB 2.691 0.168 15.991 0.000
460 HAYES, PREACHER, AND MYERS
460
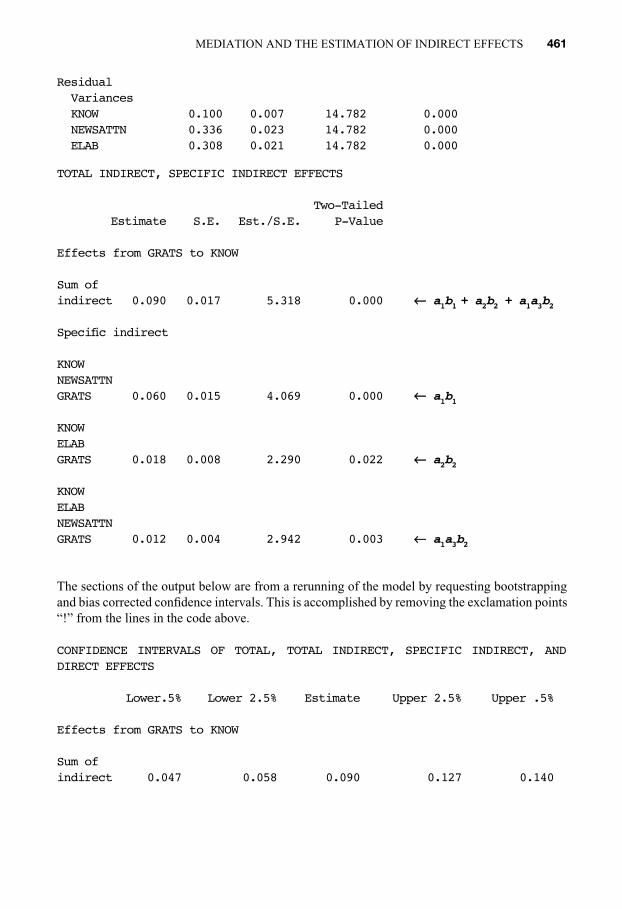
ResidualVariancesKNOW 0.100 0.007 14.782 0.000NEWSATTN 0.336 0.023 14.782 0.000ELAB 0.308 0.021 14.782 0.000
TOTAL INDIRECT, SPECIFIC INDIRECT EFFECTS
Two-TailedEstimate S.E. Est./S.E. P-Value
Effects from GRATS to KNOW
Sum of indirect 0.090 0.017 5.318 0.000 ←← a1b1 + a2b2 + a1a3b2
Specific indirect
KNOWNEWSATTNGRATS 0.060 0.015 4.069 0.000 ←← a1b1
KNOWELABGRATS 0.018 0.008 2.290 0.022 ←← a2b2
KNOWELABNEWSATTNGRATS 0.012 0.004 2.942 0.003 ←← a1a3b2
The sections of the output below are from a rerunning of the model by requesting bootstrappingand bias corrected confidence intervals. This is accomplished by removing the exclamation points“!” from the lines in the code above.
CONFIDENCE INTERVALS OF TOTAL, TOTAL INDIRECT, SPECIFIC INDIRECT, ANDDIRECT EFFECTS
Lower.5% Lower 2.5% Estimate Upper 2.5% Upper .5%
Effects from GRATS to KNOW
Sum of indirect 0.047 0.058 0.090 0.127 0.140
MEDIATION AND THE ESTIMATION OF INDIRECT EFFECTS 461
461
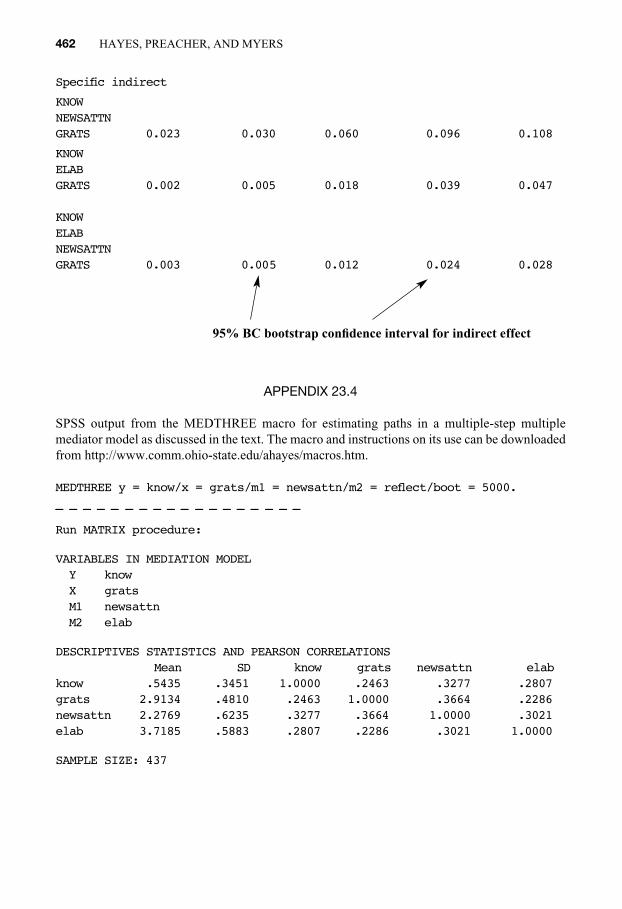
Specific indirect
KNOWNEWSATTNGRATS 0.023 0.030 0.060 0.096 0.108
KNOWELABGRATS 0.002 0.005 0.018 0.039 0.047
KNOWELABNEWSATTNGRATS 0.003 0.005 0.012 0.024 0.028
APPENDIX 23.4
SPSS output from the MEDTHREE macro for estimating paths in a multiple-step multiplemediator model as discussed in the text. The macro and instructions on its use can be downloadedfrom http://www.comm.ohio-state.edu/ahayes/macros.htm.
MEDTHREE y = know/x = grats/m1 = newsattn/m2 = reflect/boot = 5000.
– – – – – – – – – – – – – – – – – –
Run MATRIX procedure:
VARIABLES IN MEDIATION MODELY knowX gratsM1 newsattnM2 elab
DESCRIPTIVES STATISTICS AND PEARSON CORRELATIONSMean SD know grats newsattn elab
know .5435 .3451 1.0000 .2463 .3277 .2807grats 2.9134 .4810 .2463 1.0000 .3664 .2286newsattn 2.2769 .6235 .3277 .3664 1.0000 .3021elab 3.7185 .5883 .2807 .2286 .3021 1.0000
SAMPLE SIZE: 437
462 HAYES, PREACHER, AND MYERS
462
95% BC bootstrap confidence interval for indirect effect
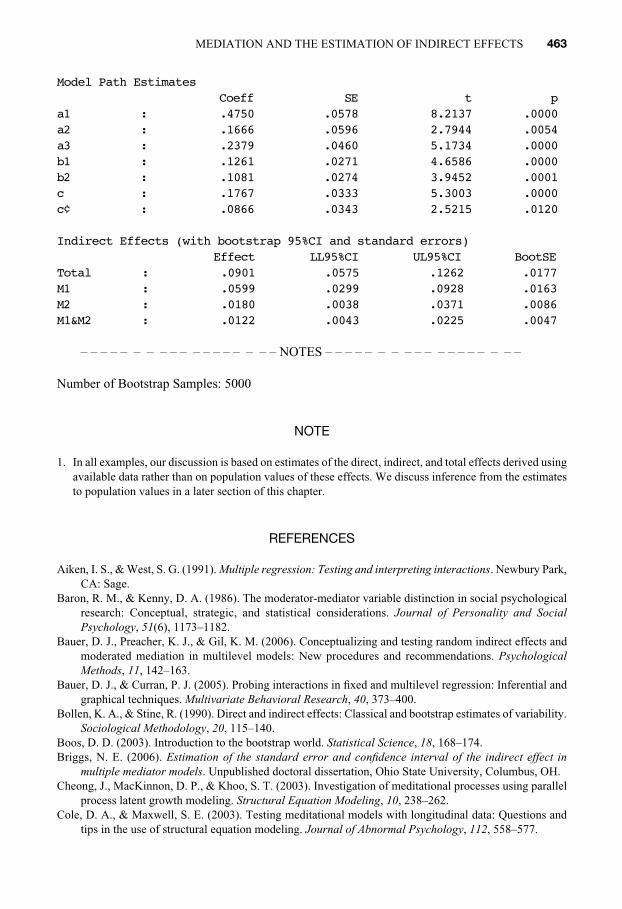
Model Path EstimatesCoeff SE t p
a1 : .4750 .0578 8.2137 .0000a2 : .1666 .0596 2.7944 .0054a3 : .2379 .0460 5.1734 .0000b1 : .1261 .0271 4.6586 .0000b2 : .1081 .0274 3.9452 .0001c : .1767 .0333 5.3003 .0000c¢ : .0866 .0343 2.5215 .0120
Indirect Effects (with bootstrap 95%CI and standard errors)Effect LL95%CI UL95%CI BootSE
Total : .0901 .0575 .1262 .0177M1 : .0599 .0299 .0928 .0163M2 : .0180 .0038 .0371 .0086M1&M2 : .0122 .0043 .0225 .0047
– – – – – – – – – – – – – – – – – – NOTES – – – – – – – – – – – – – – – – – –
Number of Bootstrap Samples: 5000
NOTE
1. In all examples, our discussion is based on estimates of the direct, indirect, and total effects derived usingavailable data rather than on population values of these effects. We discuss inference from the estimatesto population values in a later section of this chapter.
REFERENCES
Aiken, I. S., & West, S. G. (1991). Multiple regression: Testing and interpreting interactions. Newbury Park,CA: Sage.
Baron, R. M., & Kenny, D. A. (1986). The moderator-mediator variable distinction in social psychologicalresearch: Conceptual, strategic, and statistical considerations. Journal of Personality and SocialPsychology, 51(6), 1173–1182.
Bauer, D. J., Preacher, K. J., & Gil, K. M. (2006). Conceptualizing and testing random indirect effects andmoderated mediation in multilevel models: New procedures and recommendations. PsychologicalMethods, 11, 142–163.
Bauer, D. J., & Curran, P. J. (2005). Probing interactions in fixed and multilevel regression: Inferential andgraphical techniques. Multivariate Behavioral Research, 40, 373–400.
Bollen, K. A., & Stine, R. (1990). Direct and indirect effects: Classical and bootstrap estimates of variability.Sociological Methodology, 20, 115–140.
Boos, D. D. (2003). Introduction to the bootstrap world. Statistical Science, 18, 168–174.Briggs, N. E. (2006). Estimation of the standard error and confidence interval of the indirect effect in
multiple mediator models. Unpublished doctoral dissertation, Ohio State University, Columbus, OH.Cheong, J., MacKinnon, D. P., & Khoo, S. T. (2003). Investigation of meditational processes using parallel
process latent growth modeling. Structural Equation Modeling, 10, 238–262.Cole, D. A., & Maxwell, S. E. (2003). Testing meditational models with longitudinal data: Questions and
tips in the use of structural equation modeling. Journal of Abnormal Psychology, 112, 558–577.
MEDIATION AND THE ESTIMATION OF INDIRECT EFFECTS 463
463
Collins, L. M., Graham, J. W., & Flaherty, B. P. (1998). An alternative framework for defining mediation.Multivariate Behavioral Research, 33, 295–312.
Davis, J. A. (1985). The logic of causal order. Newbury Park, CA: Sage.Edwards, J. R., & Lambert, L. S. (2007). Methods for integrating moderation and mediation: A general path
analytical framework using moderated path analysis. Psychological Methods, 12, 1–22.Efron, B. (1987). Better bootstrap confidence intervals. Journal of the American Statistical Association, 82,
171–185.Efron, B., & Tibshirani, R. (1993). An introduction to the bootstrap. New York: Chapman & Hall.Eveland, W. P., Jr. (2001). The cognitive mediation model of learning from the news: Evidence from
nonelection, off-year election, and presidential election contexts. Communication Research, 28,571–601.
Eveland, W. P., Jr. (2004). The effect of political discussion in producing informed citizens: The roles ofinformation, motivation, and elaboration. Political Communication, 21, 177–193.
Finch, J., West, S. G., & MacKinnon, D. P. (1997) Effects on non-normality on mediated effect estimates.Structural Equation Modeling, 4, 87–107.
Fletcher, T. D. (2006, August). Methods and approaches to assessing distal mediation. Paper presented atthe 66th annual meeting of the Academy of Management, Atlanta, GA.
Frazier, P. A., Tix, A. P., & Barron, K. E. (2004). Testing moderator and mediator effects in counselingpsychology research. Journal of Counseling Psychology, 51, 115–134.
Gidengil, E., & Everitt, J. (2003). Talking tough: Gender and reported speech in campaign news coverage.Political Communication, 20, 209–233.
Goodman, L. A. (1960). On the exact variance of products. Journal of the American Statistical Association,55, 708–713.
Hayes, A. F. (2009). Beyond Baron and Kenny: Statistical mediation analysis in the new millennium.Communication Monographs, 76, 408–420.
Hayes, A. F., & Matthes, J. (2009). Computational procedures for probing interactions in OLS and logisticregression: SPSS and SAS implementations. Behavior Research Methods, 41, 924–936.
Holbert, R. L. (2005a). Television news viewing, governmental scope, and postmaterialist spending:Assessing mediation by partisanship. Journal of Broadcasting and Electronic Media, 49, 416–434.
Holbert, R. L. (2005b). Intramedia mediation: The cumulative and complementary effects of news mediause. Political Communication, 22, 447–462.
Holbert, R. L., Shah, D. V., Kwak, N. (2003). Political implications of primetime drama and sitcom use:Genres of representation and opinions concerning women’s rights. Journal of Communication, 53,45–60.
Holbrook, R. A., & Hill, T. G. (2005). Agenda-setting and priming in primetime television: Crime dramasas political cues. Political Communication, 22, 277–295.
Holland, P. W. (1986). Statistics and causal inference. Journal of the American Statistical Association, 81,945–960.
Huang, B., Sivaganesan, S., Succop, P., & Goodman, E. (2004). Statistical assessment of mediational effectsfor logistic mediational models. Statistics in Medicine, 23, 2713–2728.
Hyman, H. H. (1955). Survey design and analysis. New York: The Free PressKenny, D. A., Korchmaros, J. D., & Bolger, N. (2003). Lower level mediation in multilevel models.
Psychological Methods, 8, 115–128.Keum, H., Devanathan, N., Deshpand, S., Nelson, M. R., & Shah, D. V. (2004). The citizen-consumer:
Media effects at the intersection of consumer and civic culture. Political Communication, 21(3),369–391.
Li, Y., Schneider, J. A., & Bennett, D. A. (2007). Estimation of the mediation effect with a binary mediator.Statistics in Medicine, 26, 3398–3414.
Little, T. D., Preacher, K. J., Selig, J. P., & Card, N. A. (2007). New developments in latent variable panelanalyses of longitudinal data. International Journal of Behavioral Development, 31, 357–365.
MacKinnon, D. P. (2000). Contrasts in multiple mediator models. In J. S. Rose, L. Chassin, C. C. Presson,& S. S. Sherman (Eds.), Multivariate applications in substance use research (pp. 141–160). Mahwah,NJ: Lawrence Erlbaum.
464 HAYES, PREACHER, AND MYERS
464
MacKinnon, D. P. (2008). Introduction to statistical mediation analysis. New York: Lawrence Erlbaum.MacKinnon, D. P., Fairchild, A. J., & Fritz, M. S. (2007). Mediation analysis. Annual Review of Psychology,
58, 593–614.MacKinnon, D. P., Krull, J. L., & Lockwood, C. (2000). Equivalence of the mediation, confounding, and
suppression effect. Prevention Science, 1, 173–181.MacKinnon, D. P., Lockwood, C. M., Brown, C. H., Wang, W., & Hoffman, J. M. (2007). The intermediate
endpoint effect in logistic and probit regression. Clinical Trials, 4, 499–513.MacKinnon, D. P., Lockwood, C. M., Hoffman, J. M., West, S. G., & Sheets, V. (2002). A comparison of
methods to test mediation and other intervening variable effects. Psychological Methods, 7, 83–104.MacKinnon, D. P., Lockwood, C. M., & Williams, J. (2004). Confidence limits for the indirect effect:
Distribution of the product and resampling methods. Multivariate Behavioral Research, 39, 99–128.Mathieu, J. E., DeShon, R. P., & Bergh, D. D. (2008). Mediation inferences in organizational research: Then,
now, and beyond. Organizational Research Methods, 11, 202–223.Mathieu, J. E., & Taylor, S. R. (2006). Clarifying conditions and decision points for mediational type
inferences in organizational behavior. Journal of Organizational Behavior, 27, 1031–1056.Maxwell, D. E., & Cole, D. A. (2007). Bias in cross-sectional analyses of longitudinal mediation.
Psychological Methods, 12, 23–44.Pinkleton, B. E., & Austin, E. W. (2001). Individual motivations, perceived media importance, and political
disaffection. Political Communication, 18, 321–334.Preacher, K. J., & Hayes, A. F. (2004). SPSS and SAS procedures for estimating indirect effects in simple
mediation models. Behavior Research Methods, Instruments, and Computers, 36, 717–731.Preacher, K. J., & Hayes, A. F. (2008a). Contemporary approaches to assessing mediation in communication
research. In A. F. Hayes, M. D. Slater, & L. B. Snyder (Eds.), The SAGE sourcebook of advanced dataanalysis methods for communication research (pp. 13–54). Thousand Oaks, CA: Sage.
Preacher, K. J., & Hayes, A. F. (2008b). Asymptotic and resampling strategies for assessing and comparingindirect effects in multiple mediator models. Behavior Research Methods, 40, 879–891.
Preacher, K. J., Rucker, D. D., & Hayes, A. F. (2007). Assessing moderated mediation hypotheses: Theory,methods, and prescriptions. Multivariate Behavioral Research, 42, 185–227.
Scheufele, D. A. (2002). Examining differential gains from mass media and their implications forparticipatory behavior. Communication Research, 29, 46–65.
Sellers, P. J., & Schaffner, B. F. (2007). Winning coverage in the U.S. Senate. Political Communication, 24,377–391.
Shrout, P. E. & Bolger, N. (2002). Mediation in experimental and nonexperimental studies: New proceduresand recommendations. Psychological Methods, 7(4), 422–445.
Simons-Morton, B., Chen, R., Abroms, L., & Haynie, D. L. (2004). Latent growth curve analyses of peerand parent influences on smoking progression among early adolescents. Health Psychology, 23,612–621.
Slater, M. D. (2007). Reinforcing spirals: The mutual influence of media selectivity and media effects andtheir impact on individual behavior and social identity. Communication Theory, 17, 281–303.
Sobel, M. E. (1982). Asymptotic confidence intervals for indirect effects in structural equation models.Sociological Methodology, 13, 290–312.
Stine, R. (1989). An introduction to bootstrap methods. Sociological Methods and Research, 18, 243–291.Stroud, N. J. (2007). Media effects, selective exposure, and Fahrenheit 9/11. Political Communication, 24,
415–432.Taylor, A. B., MacKinnon, D. P., & Tein, J.-Y. (2008). Tests of the three-path mediated effect.
Organizational Research Methods, 11, 241–269.Tein, J.-Y., & MacKinnon, D. P. (2003). Estimating mediated effects with survival data. In H. Yanai, A. O.
Rikkyo, K. Shigemasu, Y. Kano, & J. J. Meulman (Eds.), New developments on psychometrics(pp. 405–412). Tokyo, Japan: Springer-Verlag Tokyo Inc.
Williams, J., & MacKinnon, D. P. (2008). Resampling and distribution of the product methods for testingindirect effects in complex models. Structural Equation Modeling, 15, 23–51.
MEDIATION AND THE ESTIMATION OF INDIRECT EFFECTS 465
465