the solubility of methane, carbon dioxide, and hydrogen sulfide in
TRANSCRIPT

THE RICE INSTITUTE
The Solubility of Methane., Carbon Dioxide^
and Hydrogen Sulfide in Oxygenated Compounds
at Elevated Pressures
by
Phillip David Mantor
A THESIS
SUBMITTED TO THE FACULTY
IN PARTIAL FULFILLMENT OF THE
REQUIREMENTS FOR THE DEGREE OF
Master of Science
in
Chemical Engineering
Houston, Texas
March 1960
I 3 1272 00126 5923

Acknowledgment
I would like to acknowledge those who aided in the
completion of this investigation, and especially:
Professor Riki Kobayashi for his guidance and aid in
the experimental work.
Tennessee Gas Transmission Company for the methane
used in the research.
Jefferson Chemical Company for the Propylene Carbonate
used and for the analysis by which the gas phase was studied.
Ruska Instrument Company for the high pressure
cell.
Shell Development Company for the constant temperature
bath used in the determinations.
Brown & Root, Inc. for their financial support during
1959.
Sam Pollard for his aid in the design and construction
of the equipment.
My family, for their encouragement and financial aid
during these many years.
ii

Table of Contents
Page No.
I. Objectives of the Investigation 1
II. Summary of Work 2
III. Previous Work 4
IV. Experimental Determination 5
A. Apparatus 5
B. Materials 6
C. Experimental Procedure 7
V. Experimental Results 10
VI. Treatment of Data 14
VII. Data 18
VIII. Figures
IX. Literature Cited
X. Appendix A
XI. Appendix B
iii

List of Tables
I. Experimental liquid phase solubilities and compositions
as a function of pressure at various temperatures
II. Liquid phase graphically smoothed compositions and
thermodynamically calculated compositions as
functions of pressure at various temperatures
III. Activity coefficients for Hydrogen Sulfide in
Ethylene Glycol liquid
IV. Constants for the equation of Krischevsky
iv
List of Figures
I* Schematic Equipment Diagram
II. Propylene Carbonate-Methane System: Solubility versus
Pressure
III. Propylene Carbonate-Carbon Dioxide System:Solubility
versus Pressure
IV. Ethylene Glycol-Carbon Dioxide System:Solubility
versus Pressure
V. Ethylene Glycol-Hydrogen Sulfide System; Solubility
versus Pressure
VI. Pressure versus Mole Fraction Methane in Liquid
Propylene Carbonate
VII. Pressure versus Mole Fraction Carbon Dioxide in
Liquid Propylene Carbonate
VIII. Pressure versus Mole Fraction Carbon Dioxide in
Liquid Ethylene Glycol
IX. Pressure versus Mole Fraction Hydrogen Sulfide in *
Liquid Ethylene Glycol
X. Schematic Pressure-Composition Diagram
XI. Pressure-Temperature.Prpjection for Ethylene Glycol-
Hydrogen Sulfide System
XII. Krischevsky Relationship for Propylene Carbonate-Methane
XIII. Krischevsky Relationship for Propylene Carbonate-Carbon
Dioxide
v

List of Figures (Cont'd.)
XIV. Krischevsky Relationship for Ethylene Glycol-Carbon
Dioxide System
XV. Krischevsky Relationship for Propylene Carbonate-
Hydrogen Sulfide System
XVI. Activity Coefficients for Hydrogen Sulfide in Liquid
Ethylene Glycol
vi

OBJECTIVES OF THE INVESTIGATION
The objectives of the investigation were:
(1) to obtain experimental liquid compositions for the systems methane
propylene carbonate, carbon dioxide-propylene carbonate, carbon dioxide
ethylene glycol, and hydrogen sulfide-ethylene glycol over a range of
temperatures and pressures,
(2) to verify that the partial pressure of the respective solvents in
the equilibrium gas phase would be of the order of magnitude of the
pure solvent vapor pressures,
(3) to apply the Phase Rule to the experimental observations and to
obtain a general understanding of the phase behavior of the systems,
and
(4) to correlate the experimental data by the use of pure component
thermodynamic data.
1

SUMMARY OF WORK
This study Considered vapor-liquid equilibrium compositions in
four binary systems. Equilibrium liquid phase compositions in the system
methane-propylene carbonate were obtained at 80, 100, 160, and 220°F at
pressures up to 2000 psia. Since the methane was far above its critical
state, there was no three-phase region-under these conditions.
Experimental data for the system carbon dioxide-propylene car¬
bonate were determined at 80, 100, 160 and 220°F. The pressure was a
maximum for 160°F at 1000 psia. No three-phase region in this system
at 80°F to a pressure of 805 psia was evident and at the higher temp¬
eratures the carbon dioxide was super-critical.
The system carbon dioxide-ethylene glycol was studied at 78,
100, 160, and 220°F at pressures up to 1050 psia. The three-phase
condition existed for the lowest temperature at a pressure of 899 psia.
The system was examined for a three-phase region at 90°F and 1100 psia
but none was found. The composition of the gas phase of this system
was experimentally determined to check the assumption that the solvent
concentration in the gas phase could be neglected in the theoretical
treatment. The checks were made at 220°F, 100 psia; 220°F, 1000 psia;
and 80°F, 800 psia. The ethylene glycol concentration was less than
0.001 mole fraction in all cases.
The system hydrogen sulfide-ethylene glycol was studied at
84, 100, and 160°F. Pressures ranged up to 780 psia at 160°F. The
three-phase region at 84°F was at 340 psia and at 100°F it existed at
405 psia. These points were both slightly above the vapor-liquid con¬
ditions for the pure hydrogen sulfide. No composition data was taken
in the two liquid phase region.
2 -
Using the method of Krischevsky (10) the experimental data were
used to determine equations for finding the equilibrium compositions of
the liquid phase in each system as a function of properties of the pure
solute. Data calculated by this method gave close agreement with graphi¬
cally smoothed data in all the systems except hydrogen sulfide-ethylene
glycol at higher pressures.
Deviation from ideal solution behavior for the hydrogen sul¬
fide-ethylene glycol system was obtained by calculation of activity
coefficients which ranged from a lower value of 1.8 at 160°F and 780
psia to a value of .4.6 at 50 psia and 84°F.
- 3 -

PREVIOUS WORK
The binary systems treated in this work had never before been
experimentally studied. Lecat (11), (12), (13) studied azeotropes in
the systems containing ethylene glycol and paraffinic, napthenic and
aromatic hydrocarbons. The ternary system diethylene glycol-benzene-
water was studied (6) between 25 and 175°C at one atmosphere pressure.
The effect of water on benzene solubility is the main consideration of
the work. Diethylene glycol-natural gas (19) was studied up to 2000
psia at 100°F. The diethylene glycol used contained 5 weight per cent
water. The variation of the gas solubility with pressure was reported.
Triethylene glycol-water-natural gas system (16) was studied for pres¬
sures up to 2000 psia and 60-100°F. to give the solubility of a natural
gas in triethylene, glycol as a function of pressure.
No data on the solubility of gases in propylene carbonate
have been reported.
Solubility data in systems of nitrogen in water (10) at
high pressures is correlated by means of pure component thermodynamic
properties. The same method of correlating solubility is also des¬
cribed for systems of hydrocarbons and water (9) (14) at pressures
up to 10,000 psia, and in systems of hydrogen and hydrocarbons for
pressures of 8000 psia and temperatures as low as -300°F (23).
- 4 -
EXPERIMENTAL DETERMINATION
Apparatus: The apparatus used in this work was basically similar to
that described by Kobayashi (9) (20). The equipment may be broken
into three main segments; (1) equilibrium apparatus, (2) pressure
maintenance apparatus and (3) analytical apparatus (Figure 1).
The equilibrium apparatus consisted of a high pressure cell
and a constant temperature air bath. The windowed cell was designed
to hold pressures of 10,000 psia. It was mounted on bearings near
its center of gravity and was rocked in order to hasten the approach
to equilibrium of its contents. The charging line for gas was
fastened to the top of the cell through a valve to the gas phase.
The liquid phase sample was transmitted from the bottom of the cell
through capillary tubing to a needle valve and then to the analytical
train. The air bath was designed to circulate heated air in a closed
circuit around the cell. The air temperature was maintained by means
of electrical heating coils installed in the air stream. The tempera¬
ture of the cell contents was measured by means of a thermocouple
placed in the side of the cell. The EMF of the thermocouple was
measured by a Leeds and Northrup Precision Portable Potentiometer.
Cell pressure was measured on a calibrated 2000 psi Heise gauge
with 2 psi subdivisions. This gauge was used for all the systems
except hydrogen sulfide-ethylene glycol. For the latter system
a calibrated Bourdon Test Gauge was used which registered 2000 psi
with 5 psi subdivisions.
5

The pressure maintenance system was composed of the gas cylinder,
the gas reservoir, and a mercury displacement pump. With this equipment
the cell was charged with gas at pressures greater than that in the gas
cylinder. This equipment was also used to maintain constant cell pres¬
sure while sampling.
The analytical apparatus consisted of four pieces. The first
was the burette used as a flash chamber for the liquid phase. The
second was an empty drying tube through which the flash gas passed and
which was used as a trap for any foreign matter. The third part was
the manometer used to measure the system pressure. The fourth part
was a flask of known volume into which the flash gas expanded. There
was a three-way stopcock at the top of this flask through which the
system was evacuated. The tubing connections were all made with india
rubber tubing which had been impregnated with paraffin (9). Since the
connections between the burette and the rest of the system were broken
and remade after each run, the purpose of the trap was to catch pieces
of paraffin which got into the tubing.
Materials: The materials used in the experiments had the following
properties:
(1) Methane: Tennessee Gas Transmission Company; line gas
from North Louise Field with ethane and water
as impurities: 99.7 mole %
(2) Carbon Dioxide: Spencer Chemicals Company; cylinder
gas; nitrogen as impurity: 99.6 mole %
(3) Hydrogen Sulfide: Mathieson Company, Inc.; purified
grade compressed gas 99.5 mole %
6

(4) Propylene Carbonate: Jefferson Chemical Company 99 wt. % min.
(5) Ethylene Glycol: J. T. Baker Chemical Co., "Baker
Analyzed" Reagent Grade, boiling range 198.8-
199.8°C; water 0.04 wt. %
The structural formula of propylene-carbonate is given below.
H ? H\ I H-C-C-CK H7 1 /C*0 M H ~ C — O'
l H
Before use all the gases were passed through steel tubes con¬
taining Drierite in order to remove the water present. The methane was
passed through an additional tube filled with Ascarite to remove the
carbon dioxide present.
Experimenta1 Procedure: To charge the system the cell was evacuated
and the vacuum was used to draw in the liquid solvent. The gas was
passed from the cylinder into the reservoir and the cell. If pres¬
sures higher than cylinder pressure were desired, the cylinder was
shut off from the system and the mercury pump was used to displace
gas from the reservoir into the cell. Better results were achieved
in displacing the reservoir gas if, instead of using the mercury
pump, the reservoir was heated.
The system was charged initially to the highest pressure
at which the liquid composition was determined. The liquid was
agitated during the initial gas charging period. By periodically
closing the cylinder valve during this time it could be determined
when the liquid was nearly saturated with gas. After a period there
was only a slight pressure drop with time when the cylinder valve
was closed. At this point the cylinder valve was closed and the
system was allowed to come to its final equilibrium pressure with
7

agitation. The temperature of the cell was measured by the potentio¬
meter and the variation in temperature was controlled by a variable
heater set in the air bath. When the cell came to constant tempera¬
ture and pressure the system was at equilibrium. Agitation was
stopped and the system was allowed to sit for fifteen minutes.
Before a sample of the liquid phase was taken the sample
tubing was flushed by passing about 5 cc. of liquid into a beaker.
Then the sample tubing was attached to the analytical train. The
analytical system was evacuated and allowed to sit for five minutes
to check for leaks. Then the valve on the sample tubing was opened
and the liquid phase was passed into the burette. During this sampling
period the cell pressure was maintained at a constant value by occas¬
ionally cracking the valve to the gas source. After about 10 cc. of
flash liquid was collected the sample valve was closed. The analy¬
tical system pressure was allowed to come to a constant value and
recorded. The volume of liquid was recorded. The analytical system
was then cleaned of liquid and made ready for another analysis. The
valve to the reservoir was closed and the gas phase was vented to some
lower pressure. The temperature was held constant and more data were
taken at decreasing values of pressure. Four of these isotherms were
obtained for each binary system.
The composition of the gas phase was found at three points in
the carbon dioxide-ethylene glycol system. The sample tubing was at¬
tached to the top of the cell and the mercury pump was attached
directly to the bottom. The cell was filled with liquid and gas as
before and brought to equilibrium. During the sampling period the
cell pressure was maintained by injecting mercuty into the bottom of
the cell and the sample line was heated to prevent liquid drop out.
8

The gas sample was passed from the top of the cell into a series of two
absorption chambers. These were filled with distilled water to absorb
the ethylene glycol present. The gas from the second chamber went to a
wet test meter. The amount of gas .sampled was recorded. The amount of
ethylene glycol in the gas was determined by analysis for glycol of the
liquid in the two absorbers. This analysis, was done by a titrimetric
method developed by Jefferson Chemical Company (Appendix X).
Each determination took approximately forty five minutes. The
analysis showed the amount of ethylene glycol in the gas phase was below
0.001 mole fraction.
9

EXPERIMENTAL RESULTS
The Phase Rule as expressed by Gibbs (1) was very helpful in
describing the condition of equilibrium for this experiment. When ap¬
plied to a two component, two phase mixture the Phase Rule states that
two intensive variables must be set for equilibrium. In this work the
intensive variables chosen were temperature and pressure; that is,
when the temperature and pressure of the system were set, the composi¬
tions of the co-existing phases were invariant. If three phases appeared
in a binary system there was only one variable which had to be fixed.
This meant that for a binary, three-phase region, setting any one vari¬
able set all the other variables, i.e., choosing the pressure deter¬
mined the co-existing phase compositions and the temperature.
In this work the equilibrium compositions of a liquid phase
in co-existence with a vapor phase were determined at various pressures
along an isotherm. This procedure was repeated for several isotherms
to completely define the two phase region over a range of experimental
conditions.
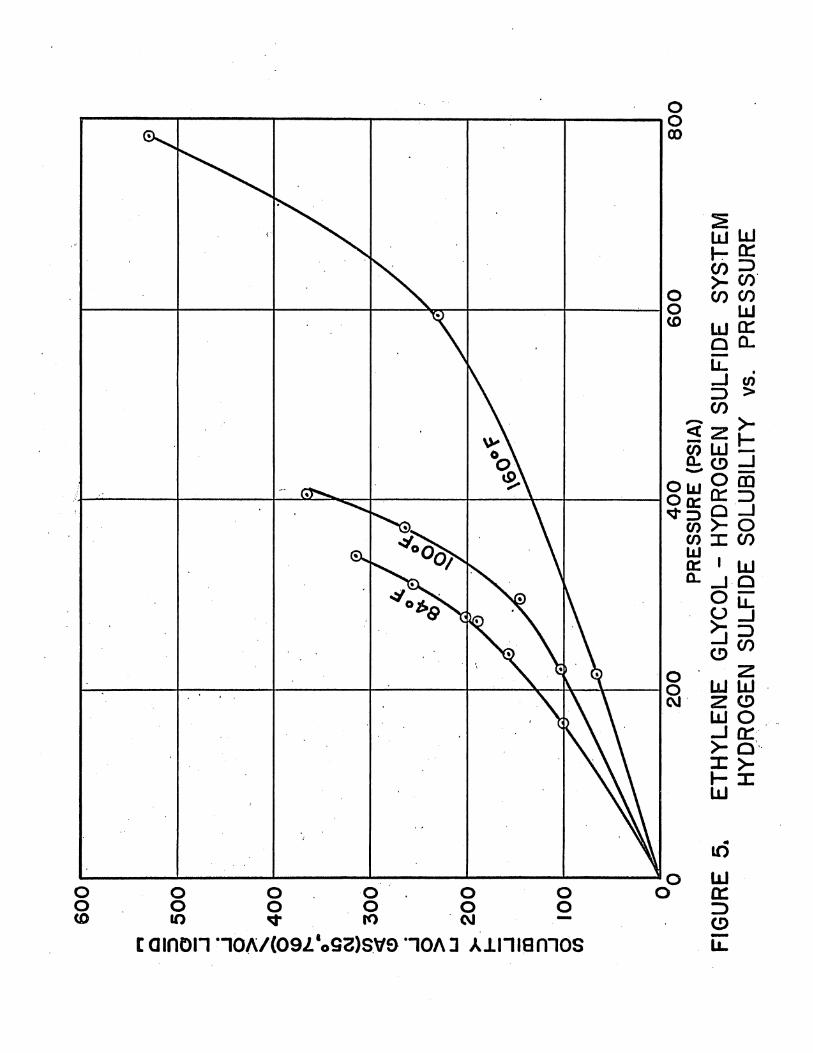
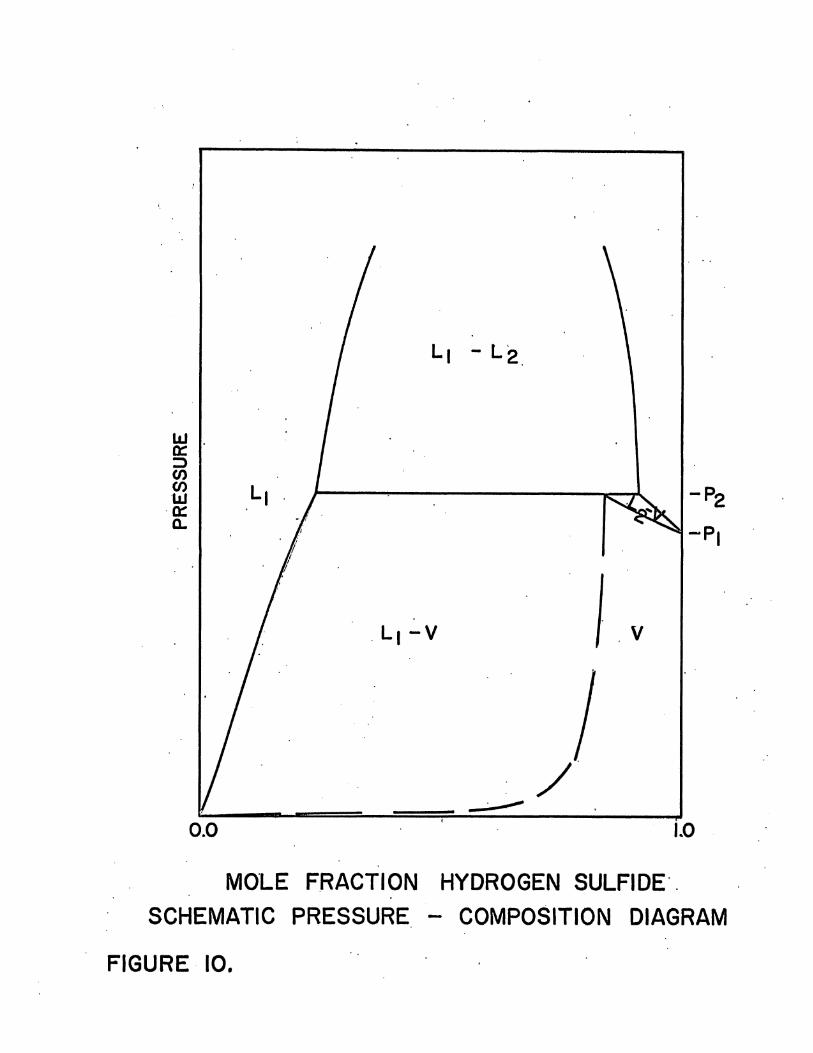
The system hydrogen sulfide-ethylene glycol is described first.
Figure 10 shows a schematic diagram of the behavior of this system at
some constant temperature. In this experiment the vapor region (V) is
pure hydrogen sulfide so the dashed line lies on the 1.0 mole fraction
hydrogen sulfide* axis. The saturated liquid boundary between the L^ and
Lj^-V regions is defined by the experimental liquid phase compositions.
The experimental data originally taken is shown as solubility of hydro¬
gen sulfide in the liquid phase as a function of pressure (Figure 5).
This is replotted with pressure as a function of composition to correspond
- 10
to Figure 10. The experimental data are listed in Table 1. These com¬
positions are shown in Figure 9. The hydrogen sulfide is seen to be very
soluble in the ethylene glycol. At 160°F the hydrogen sulfide concen¬
tration is 0.55 mole fraction at 780 psia. The L2“V region was not
determined in this experiment. The point is the vapor pressure of the
pure hydrogen sulfide at the temperature of the experiment. P£ is the
three-phase pressure. Note that the three-phase compositions and P2 are
unique for this temperature. The L1-L2 region would be defined by
measuring compositions of the coexisting liquid phases at increasing
pressures.
As the system temperature is increased above the critical
temperature of hydrogen sulfide,the L2“V region would pull away from
the 1.0 mole fraction axis until it had completely disappeared. At
this point the system is a two-phase mixture of ethylene glycol in
equilibrium with hydrogen sulfide fluid at all pressures.
Figure 11 is a pressure-temperature diagram for the hydrogen
sulfide-ethylene glycol system. The lines LJ.-V and L2~V are the vapor
pressure curves for pure ethylene glycol and hydrogen sulfide. The
L]_-L2“V or three-phase locus is drawn and the three-phase critical is
shown near the pure hydrogen sulfide critical. Lines of constant
liquid composition are drawn to show the experimental results. The
ethylene glycol critical is not shown since it falls at a much higher
temperature. The loop describing the locus of binary criticals would
rise to extreme pressures because of the large difference in the pure
component critical temperatures.
Within the experimental limits, the phase behavior of the system
propylene carbonate-methane is much simpler. The methane solubility is
11

shown in Figure 2 and the pressure composition curves are in Figure 6.
The experimental data are reported in Table (1). It is seen that the
methane composition is fairly low, being only 4.4 mol % at 220+F and
1900 psia. The system shows one behavior not seen in the other three
binaries: The solubility of methane increases with increasing tempera¬
ture. The system is always above the methane critical, hence there is no
three-phase region or I*2~V envelope within the experimental limits. The
schematic representation of pressure versus composition would be a closed
loop starting at the ethylene glycol vapor pressure and 0% methane and
going to some higher pressure where the binary critical exists.
The liquid phase compositions of the carbon dioxide-propylene
carbonate system are shown in Figures 3 and 7. The experimental data
are listed in Table (1). The carbon dioxide is seen to be much more
soluble in propylene carbonate than is methane. At 80°F and 800 psia
the carbon dioxide composition of the liquid is 42.5 mol %. The carbon
dioxide is super-critical at all experimental temperatures studied ex¬
cept 80°F. The schematic representation of the pressure-composition
diagram would be expected to resemble Figure 10 at 80°F. At the
higher temperatures it would resemble the behavior described for
methane-propylene carbonate.
The system carbon dioxide-ethylene glycol has phase behavior
identical to the carbon dioxide-propylene carbonate system. The solu¬
bility and composition versus pressure are shown in Figures 4 and 8.
The experimental data are given in Table (1). Carbon dioxide is seen
t6 be less soluble and the maximum experimental concentration was the
three-phase point at 78°F and 900 psia of 17 mole % carbon dioxide.
For the 78°F isotherm the phase behavior will resemble Figure 10. At
12 -

higher temperatures the simpler phase behavior described for methane-
propylene carbonate should obtain. The three-phase critical is reached
when the pure carbon dioxide critical is reached. This was found by
raising the binary temperature to 90°F and pressurizing the system.
The system remained two-phase up to 1100 psia.
The composition of the gas phase was measured and found to
contain less than 0.001 mole fraction ethylene glycol at higher pres¬
sures. At the lower pressures the solutions follow Henry's Law and the
gas should approximate ideal gas behavior. Using these two rules the
equilibrium compositions of the two phases could be found along the
lower part of the saturated vapor curve.
- 13 -

TREATMENT OF DATA
The experimental data of this work were used to derive con¬
stants for equations which correlated the equilibrium compositions of
the liquid phase with thermodynamic data of the pure solute.
The fugacity of the solute was assumed to follow the equation:
f L " x pOO
(1)
Equation (1) was integrated at constant temperature to give:
log (f$ / x> R log K; + v (p - pk) / 2.303 RT (2)
where: £.9 is the fugacity of the pure component in the vapor
x is the mole fraction in the liquid K is the Henry's Law constant v is the partial molal volume in the liquid P is the system pressure Pk is the pure solvent vapor pressure R is the gas constant T is the absolute temperature of the system fT is the fugacity of the solute in the liquid f^° is the fugacity of the solute at infinite dilution
The above equations were used to refer only to the solute so no sub¬
scripts were given. It was assumed in integrating equation (1) that
the liquid phase follows Henry's Law at low pressures and that v was con¬
stant over the range of integration. It is seen that a plot of log (f°/x)
versus (P-Pk) / 2.302RT should be linear. The slope is v and the intercept
at P=Pk is K. Since Pk in the system studied was so low compared to
/ P, Pk was eliminated.
^ The fugacities for hydrogen sulfide were obtained from the
thermodynamic data of Sage (Appendix B). The carbon dioxide data came
from the literature (2) as did the methane data (21).
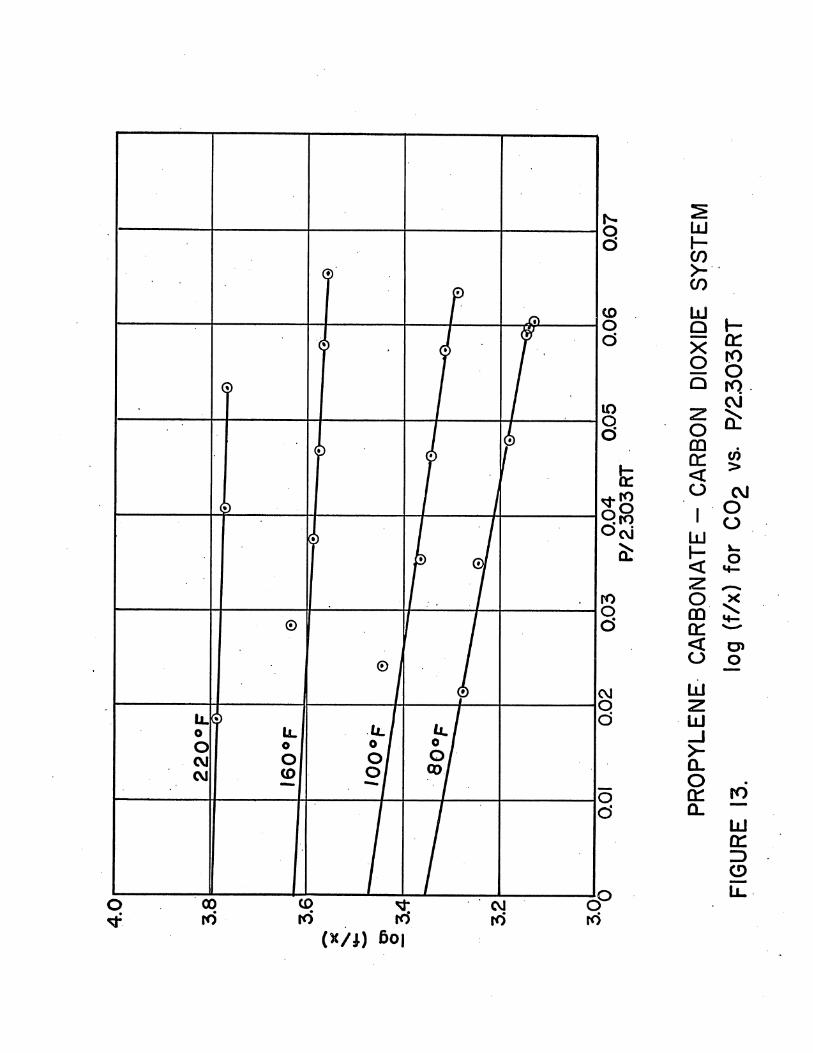
Experimental data were used to calculate log (f°/x). These
values were plotted versus P/2.303RT at constant temperature for the
- 14 -

four syst as; Figures 12, 13, 14, 15. The best straight lines were
drawn through the experimental points and 'log K and ^ were obtained
(Table 4). Using values of log K and v in equation (2), values for
x were calculated. These values were compared with graphically
smoothed data in Table (2).
The system Inethane-propylene carbonate is well represented by
one straight line at all temperatures. This indicates v is nearly in¬
dependent of temperature, pressure, and composition. Log K is indepen¬
dent of temperature.
The experimental log (f°/x) for the systems carbon dioxide-
propylene carbonate and carbon dioxide-ethylene glycol were plotted.
The slope of the log (f°/x) plots were all negative.
The hydrogen sulfide system showed strong deviation from the
straight line plot. Straight lines could be drawn which represented
the data at low concentrations but at the higher limits this failed.
This effect is discussed by Leland (14) and happens near phase
changes. In this case the hydrogen sulfide concentration became
quite large (50%) and this would mean the system was leaving the
dilute region for which the original equation was derived.
The hydrogen sulfide-ethylene glycol system data were also
studied to determine deviation from ideal solution behavior. For an
ideal solution the fugacity may be written for one component:
fL = fv = 'V
x (3)
where 1 and v refer to vapor and liquid and is the activity co¬
efficient.
Using the pure component properties of hydrogen sulfide and
graphically smoothed experimental data, the values of '"Y were calculated.
- 15

The results are listed in Table (3) and plotted versus pressure in
Figure^ 16. , ■
The .is highest for low temperatures and varies considerably
in the 84°F isotherm. As the temperature increases the curves flatten
and the 160°F isotherm is nearly constant until it approaches a phase
change above 700 psia.
Ewell (4) described a method for predicting qualitative devi¬
ation from ideal solution behavior. The method described takes into
account the ability of the components to form or break hydrogen bonds.
The hydrogen sulfide and ethylene glycol system was studied using the , • ■ i
classification Ewell proposed. The predicted deviations were positive,
(^f}1.0) and were seen to agree with the values calculated for the sys¬
tem. Ewell also predicts that this type of system might have only
limited miscibility in the liquid phase and this condition-is found to
obtain in the experimental region.
The partial molal volume (v) is defined as y =
where: V is the system volume
ni is the moles of component one.
Another definition of v is:
▼ s v° + RT(3 I n^C?P)T (17)(18) where v° is the molal
volume of the pure component. From this equation it is seen that v
can be negative only when ( 3lnj^dlP)>ji is negative-. For the system
hydrogen sulfide-ethylene glycol Oln^$P)T shows this negative be¬
havior. The behavior of v in the systems carbon dioxide-ethylene * V
glycol and carbon dioxide-propylene carbonate is negative also, and
al$ so it would be expected that they also have ( ‘£yp)«j which is nega¬
tive.
av 8n l7n2,T,P
16 -

Hydrogen bonding would seem to give a physical explanation
of the negative v. For the case of hydrogen sulfide-ethylene glycol
the cause may be that the hydrogen sulfide and ethylene glycol con¬
tain donor atoms (S,0) and active hydrogens. These molecules evi¬
dently attract each other and produce bonding between a donor of
one compound and an active hydrogen of the other compound.
The system carbon dioxide-ethylene glycol is also composed of
a compound containing donor atoms (0) and the glycol. Again the bond¬
ing would be between the oxygen donors of carbon dioxide and the active
hydrogens on the glycol.
The case of propylene carbonate-carbon dioxide is different
in character. The active hydrogens necessary for bonding must exist
on the carbon atoms of the propylene carbonate. While the carbon
atom is not classed as a donor, the presence of the carbonate group
may cause the hydrogens on carbons adjacent to the carbonate group to
— 0\ become active. In this case the Q/^~ 0 acts as a carbonate
radical attached to an organic compound.
17 -

DATA
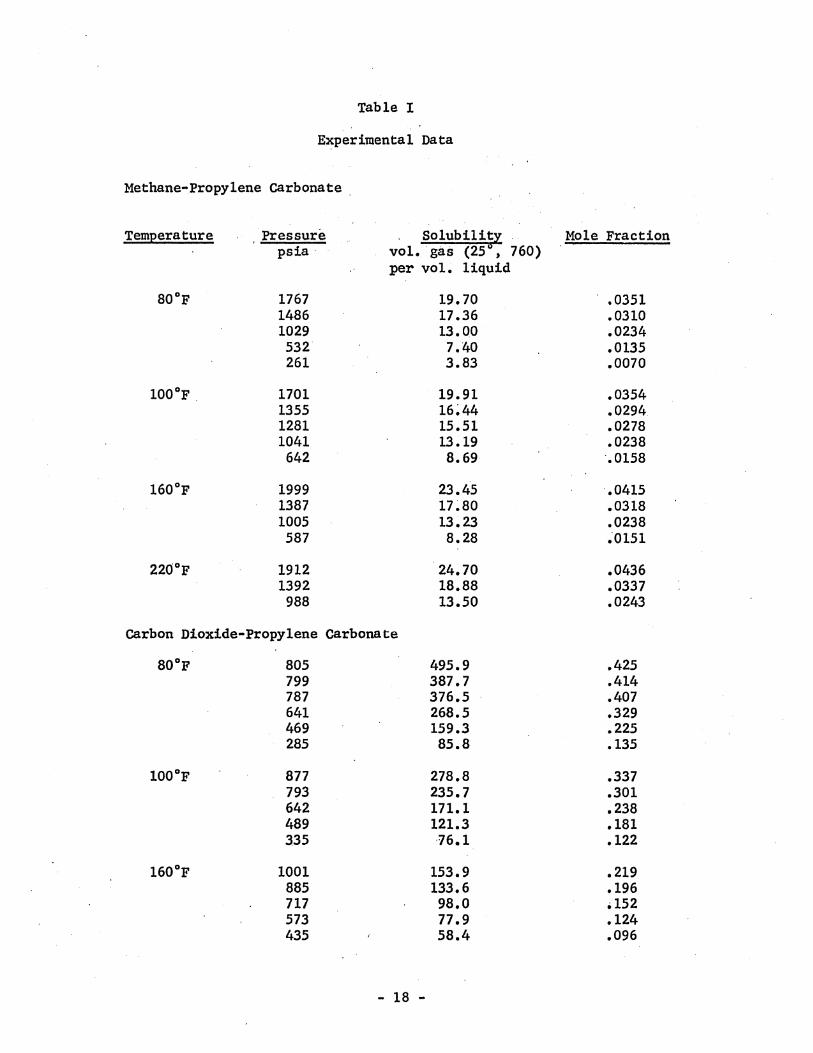
Table I
Experimental Data
Methane-Propylene Carbonate
Temperature Pressure Solubility Mole Fraction psia vol. gas (25 , 760)
per vol. liquid
80°F 1767 19.70 .0351 1486 17.36 .0310 1029 13.00 .0234 532 7.40 .0135 261 3.83 .0070
100°F 1701 19.91 .0354 1355 16.44 .0294 1281 15.51 .0278 1041 13.19 .0238 642 8.69 .0158
160°F 1999 23.45 .0415 1387 17.80 .0318 1005 13.23 .0238 587 8.28 .0151
220°F 1912 24.70 .0436 1392 18.88 .0337 988 13.50 .0243
Carbon Dioxide-Propylene Carbonate
80°F 805 495.9 .425 799 387.7 .414 787 376.5 .407 641 268.5 .329 469 159.3 .225 285 85.8 .135
100 °F 877 278.8 .337 793 235.7 .301 642 171.1 .238 489 121.3 .181 335 76.1 .122
160 °F 1001 153.9 .219 885 133.6 .196 717 98.0 il52 573 77.9 .124 435 58.4 .096
18

Table X (cont.)
220°F 895 82.93 .131 685 63.15 .103 311 28.06 .049
Carbon Dioxide-Ethy1ene Glycol
78°F 899 56.99 .113 700 45.80 .093 509 33:04 .069 219 14.84 .032
100°F 895 44:29 .091 635 33.00 .068 356 18.60 .040
160°F 1009 32.09 .067 641 20.38 .043
220°F . 1057 26.39 .055 605 15.15 .033 271 6.73 .015
hydrogen Sulfide-Ethylene Glycol
84°F 340 314.9 .419 310 255.9 .370 270 188.6 .302 275 200.6 >315 235 155.5 .263 165 99.0 .186
100°F 405 365.9 .456 370 263.7 .377 295 145.9 .251 220 104.4 .193
160°F 780 528.2 .548 595 229.1 .344 215 63.6 .127
19 -

Table II
Experimental Data (graphically smooth)
Temperature Pressure - Mole Fraction psia Graphic Thermodynamic
Methane-Propylene Carbonate
80°F 1767 .0351 .0357 1600 .0329 .0332 1200 ,0264 .0269 800 .0190 .0194 400 .0102 .0105
100°F 1700 .0354 .0358 1600 .0338 .0343 1200 .0268 .0275 800 .0190 . .0197 400 .0102 .0106
160°F 2000 .0415 .0437 1600 .0358 .0367 1200 .0280 .0284
800 .0195 .0203 400 .0104 .0107
220°F 1800 .0417 .0423 1600 .0379 .0385 1200 .0292 .0300 800 .0199 .0208 400 .0105 .0108
Carbon Dioxide-Propylene Carbonate
80°F 800 .415 .412 600 .300 .307 400 .194 .199 200 .095 .093
100°F 850 .325 .325 800 .303 .301 600 .222 .224 400 ■ .141 .145 200 .073 .069
160°F 1000 .219 .220 800 .173 .179 600 .130 .138 400 .088 .092 200 .046 .045
220°F 895 .132 .130 800 .119 .117 600 .093 .090 400 .065 .061 200 .033 .031
20

Table IX (cont'd.)
Carbon Dioxide-Ethylene Glycol
78°F 900 .1125 m m
800 .1033 .101 600 .0812 .081 400 .0560 .057 200 .0290 .029
100°F 895 .091 .091 800 ;083 .082 600 .065 .065 400 .044 .045 200 .023 .023
160°F 1000 .0665 .0663 800 .0535 .0529 600 .0405 .0405 400 .0272 .0262 200 .0140 .0134
220°F 1000 .0532 .0525 800 .0426 .0420 600 .0320 .0324 400 .0215 .0219 200 .0110 .0111
Hydrogen Sulfide-Ethylene Glycol
84°F 340 .340 .419 310 .324 .370 270 .292 .302 275 .298 .315 235 .256 .263 165 .187 .186
100°F 405 .309 .456 370 .296 .377 295 .250 .251 220 .190 .193
160°F 780 .426 .548 595 .346 .344 215 .128 .127
21

Table III
Activity Coefficients for Hydrogen Sulfide in Ethylene Glycol
Temperature Pressure Activity Coefficient
84°F 340 2.40 300 2.72 250 3.82 200 4.01 150 4.29 100 4.41 50 4.63
100°F 404 2.18 350 2.61 300 2.88 200 3.26 100 3.51
160°F 780 1.84 700 2.16 600 2.35 500 2.45 400 2.53 300 2.62 200 2.71 100 2.79
22

Table IV
Constants for use in the equation of Krischevsky:
Temperature
(7) Log (K)
Methane-Propylene Carbonate
80, 100, 160, 220°F 4.548
v
(ft3/lb. mole)
.479
Carbon Dioxide-Propylene Carbonate
80) 100 160 220
3.351 3.471 3.626 3.799
-3.50 -2.80 -1.05 -0.483
Carbon Dioxide-Ethylene Glycol
78 100 .160 220
3.820 -1.21 3.928 -0.97 4.175 -1.50 4.251 -0.720
Hydrogen.Sulfide-Ethylene Glycol
84 100 160
2.954 3.042 3.217
-3.04 -1.67 -1.70
23 -

FIGURES

FIG
UR
E I. S
CH
EM
AT
IC
EQ
UIP
ME
NT
DIA
GR
AM

$?LJ >- nr CO 3
IJJCO 2 < X h- 1x1
IxJ cc CL
</> >
• ^
<cn 23 O_J CQO cc CO < OLU
CD LL

500
o
toinbn i0A/(09z‘o53)sv9 noA3 Axrnsmos
PR
OP
YL
EN
E
CA
RB
ON
AT
E - C
AR
BO
N
DIO
XID
E
SY
ST
EM
C
AR
BO
N
DIO
XID
E
SO
LU
BIL
ITY v
s.
PR
ES
SU
RE
F
IGU
RE 3
.

o o o o o o cainon "IOA/(Q9/*.9Z5SV9 IOA'D Ainiamos
O 200 400 600 800 1000 1200
P
RE
SS
UR
E (
PS
IA)
FIG
UR
E 4.
ET
HY
LE
NE
GL
YC
OL -
CA
RB
ON
DIO
XID
E
SY
ST
EM
C
AR
BO
N
DIO
XID
E
SO
LU
BIL
ITY
vs.
PR
ES
SU
RE
600
o oo
c amon HOA/(09Z'O92)SVS> IOAn Ainigmos
0 200 400 600
P
RE
SS
UR
E (
PS
IA)
FIG
UR
E
5.
ET
HY
LE
NE
GLY
CO
L -
HY
DR
OG
EN S
UL
FID
E
SY
ST
EM
H
YD
RO
GE
N
SU
LF
IDE
SO
LU
BIL
ITY
vs.
PR
ES
SU
RE

PR
ES
SU
RE (
PS
IA)
PROPYLENE CARBONATE - METHANE SYSTEM PRESSURE vs. MOLE FRACTION METHANE IN LIQUID
FIGURE 6.

1000
MOLE FRACTION C02
FIGURE 7. PROPYLENE CARBONATE - CARBON DIOXIDE SYSTEM
PRESSURE vs. MOLE FRACTION C02 IN LIQUID

MOO
1000
900
800
700
600
500
400
300
200
100
0
El F
GURE
0 ■ /
N o/
CKj
cv/ ! / V / O/ / -5?/
AT o/
V 7
CO
(♦) 0
0
y j
/ / (5
) v ♦
0.02 0.04 0.06 0.08 0. 0 0. 2 0. MOLE FRACTION C02
8.
GLYCOL- CARBON DIOXIDE SYSTEM
: vs. MOLE FRACTION C02 JN LIQUID

MOLE FRACTION H2S
ETHYLENE GLYCOL - HYDROGEN SULFIDE SYSTEM
PRESSURE vs. MOLE FRACTION HgS IN LIQUID
FIGURE 9,
PR
ES
SU
RE
MOLE FRACTION HYDROGEN SULFIDE
SCHEMATIC PRESSURE - COMPOSITION DIAGRAM
FIGURE 10.

000
000
500
200
100
50
20
10
5
2
1.0
0.5
0.2
RESSURE - TEMPERATURE PROJECTION FOR ETHYLENE
GLYCOL - HYDROGEN SULFIDE SYSTEM rIGURE 11.

(X/J) 6o)
FIG
UR
E 1
2.
PR
OP
YL
EN
E
CA
RB
ON
AT
E -
ME
TH
AN
E
SY
ST
EM
!
‘
log
(f/x
) fo
r C
H4 .
VS
. P
/2.3
03R
T
(x/i) 6o|
PR
OP
YL
EN
E
CA
RB
ON
AT
E -
CA
RB
ON
DIO
XID
E
SY
ST
EM
FIG
UR
E 13.
log
(f/x
) fo
r C
Og
vs.
P/2
303R
T

(X/J) 6o|
ET
HY
LE
NE
GL
YC
OL -
CA
RB
ON
DIO
XID
E
SY
ST
EM
FIG
UR
E 1
4.
log (
f/x
) fo
r C
Og
vs.
P/2
.30
3R
T

(X/J) 6o|
0 0
.0
1 0
.0
2 0
.0
3 0
.0
4 0
.0
5
P/2
.303R
T
ET
HY
LE
NE
GLY
CO
L - H
YD
RO
GE
N
SU
LF
IDE
SY
ST
EM
FIG
UR
E 15.
log
(f/x
) fo
r H
gS
vs,
P/2
.30
3R
T

0
100
200
300
400
500
600
700
800
900
P
RE
SS
UR
E (
PS
IA)
FIG
UR
E 16.
AC
TIV
ITY
CO
EF
FIC
IEN
T
FOR
H2
S
IN
TH
E
SY
ST
EM
ET
HY
LE
NE
GL
YC
OL -
HY
DR
OG
EN
SU
LF
IDE

LITERATURE CITED
1. Case: Elements of the Phase Rule, the Edward's Book Shop, Ann Arbor,, Michigan, (1939).
2. Deming; Phys. Rev., 56, 108-12, (1939).
3. Dodge; Chemical Engineering Thermodynamics; McGraw Hill Book Co., Inc., New York, (1944).
4. Ewell, Harrison, and Berg; Ind. Eng. Chem., 36, 871, (1944).
5. Hala, Pick, Fried, Vilih;. Vapor Liquid Equilibrium; Pergamon Press, New York, (1958).
6. Johnson and Francis; Ind. Eng. Chem., 46, 8, 1662, (1954).
7. Katz and Donnelly; Ind. Eng. Chem., 46, 511-17 (1954).
8. Katz and Rzasa; Bibliography for Physical Behavior of Hydro¬ carbons Under Pressure and Related Phenomena; T. W. Edwards, Inc., Ann Arbor, Michigan, (1946),
9. Kobayashi; Ph. D. Thesis, University of Michigan, (1951).
10. Krischevsky and Kasarnovasky; J. Am. Chem. Soc.-, 57, 2168, (1935).
11. Lecat; Amn. Soc. Sci. Bruxelles, 48; B, I, 13 (1928).
12. Lecat; Rec. Trav. Chim., 46, 240 (1926).
13. Lecat; Tables Azeotro'piques, Brussels, l'Auteur, July (1949).
14. Leland, McKetta, and Kobe; Ind. Eng. Chem., 1265, 47, 6 (1955)
15. Perry, Chemical Engineers Handbook; Third Edition, Mc(Jraw Hill Book Co., Inc., New York, (1950).
16. Porter and Reid; A. I. M. E. Trans. 189, 235, (1950).
17. J. S. Rowlinson; Liquids and Liquid Mixtures; Academic Press, Inc., New York, N. Y., (1959).
18. Rowlinson, J. s.; Quart. Revs.; 8/ 168-41, (1954).
19. Russeil, Reid, and Huntington; A.I.Ch.E. Trans., 41, 313-325, June (1945).

20. Sage and Lacey; Apparatus for Study of P-V-T Relations of Liquids and Gases; Trans. A.I.M.E. 136, 136, (1940).
21. Sage and Lacey; Some Properties of Hydrocarbons; American Petroleum Institute, New York, (1955).
22. Sage and Lacey; Thermodynamic Properties of Hydrocarbons; American Petroleum Institute, New York, (1950).
23. Williams, Ph. D. Thesis, University of Michigan, (1954).
APPENDIX A
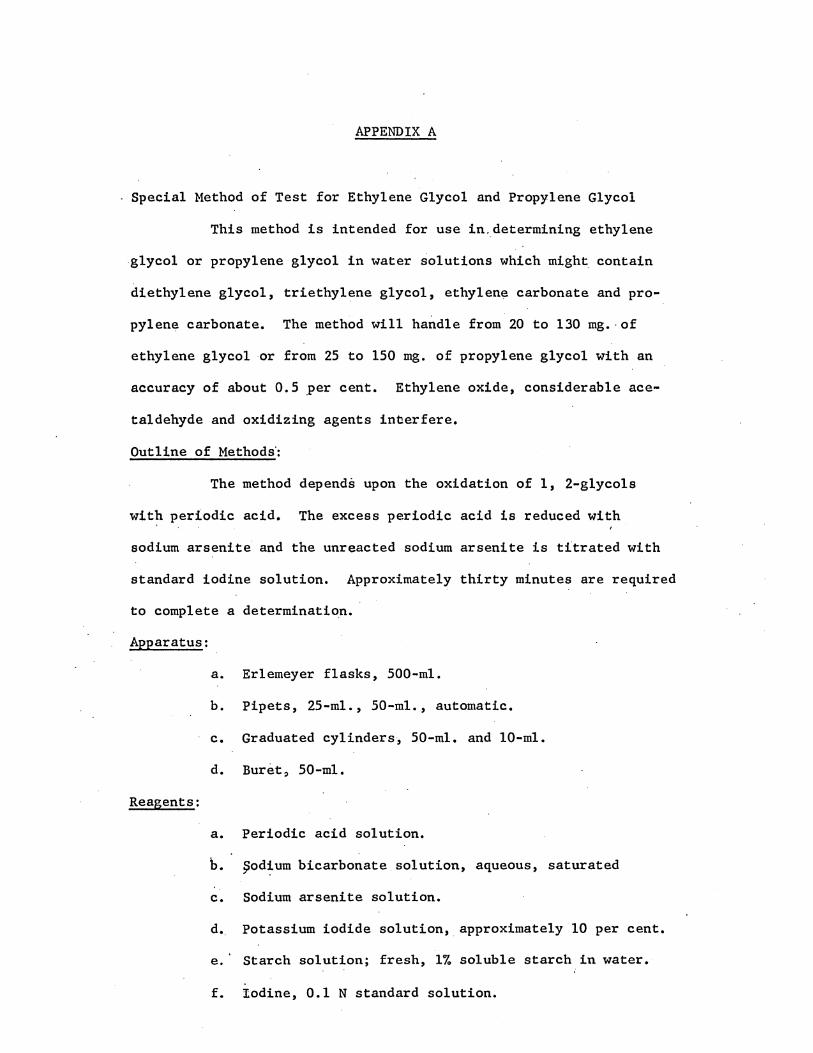
Special Method of Test for Ethylene Glycol and Propylene Glycol
This method is intended for use in,determining ethylene
glycol or propylene glycol in water solutions which might contain
diethylene glycol, triethylene glycol, ethylene carbonate and pro¬
pylene carbonate. The method will handle from 20 to 130 mg. of
ethylene glycol or from 25 to 150 mg. of propylene glycol with an
accuracy of about 0.5 per cent. Ethylene oxide, considerable ace¬
taldehyde and oxidizing agents interfere.
Outline of Methods:
The method depends upon the oxidation of 1, 2-glycols
with periodic acid. The excess periodic acid is reduced with
sodium arsenite and the unreacted sodium arsenite is titrated with
standard iodine solution. Approximately thirty minutes are required
to complete a determination.
Apparatus:
a. Erlemeyer flasks, 500-ml.
b. Pipets, 25-ml., 50-ml., automatic.
c. Graduated cylinders, 50-ml. and 10-ml.
d. Buret, 50-ml.
Reagents:
a. Periodic acid solution.
b. podium bicarbonate solution, aqueous, saturated
c. Sodium arsenite solution.
d. Potassium iodide solution, approximately 10 per cent.
e. Starch solution; fresh, 1% soluble starch in water.
f. Iodine, 0.1 N standard solution.
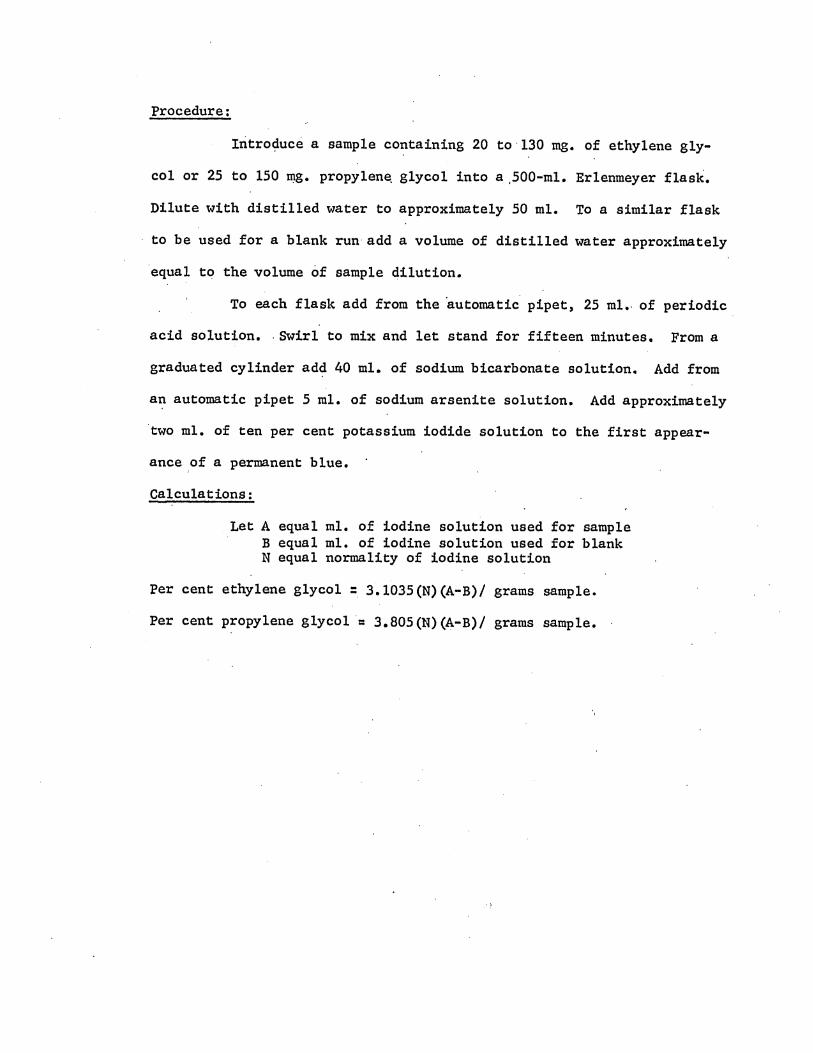
Procedure:
Introduce a sample containing 20 to 130 mg. of ethylene gly¬
col or 25 to 150 mg. propylene glycol into a ,500-ml. Erlenmeyer flask.
Dilute with distilled water to approximately 50 ml. To a similar flask
to be used for a blank run add a volume of distilled water approximately
equal to the volume of sample dilution.
To each flask add from the automatic pipet, 25 ml. of periodic
acid solution. Swirl to mix and let stand for fifteen minutes. From a
graduated cylinder add 40 ml. of sodium bicarbonate solution. Add from
an automatic pipet 5 ml. of sodium arsenite solution. Add approximately
two ml. of ten per cent potassium iodide solution to the first appear¬
ance of a permanent blue.
Calculations:
Let A equal ml. of iodine solution used for sample
B equal ml. of iodine solution used for blank N equal normality of iodine solution
Per cent ethylene glycol = 3.1035(N)(A-B)/ grams sample.
Per cent propylene glycol a 3.805(N)(A-B)/ grams sample.
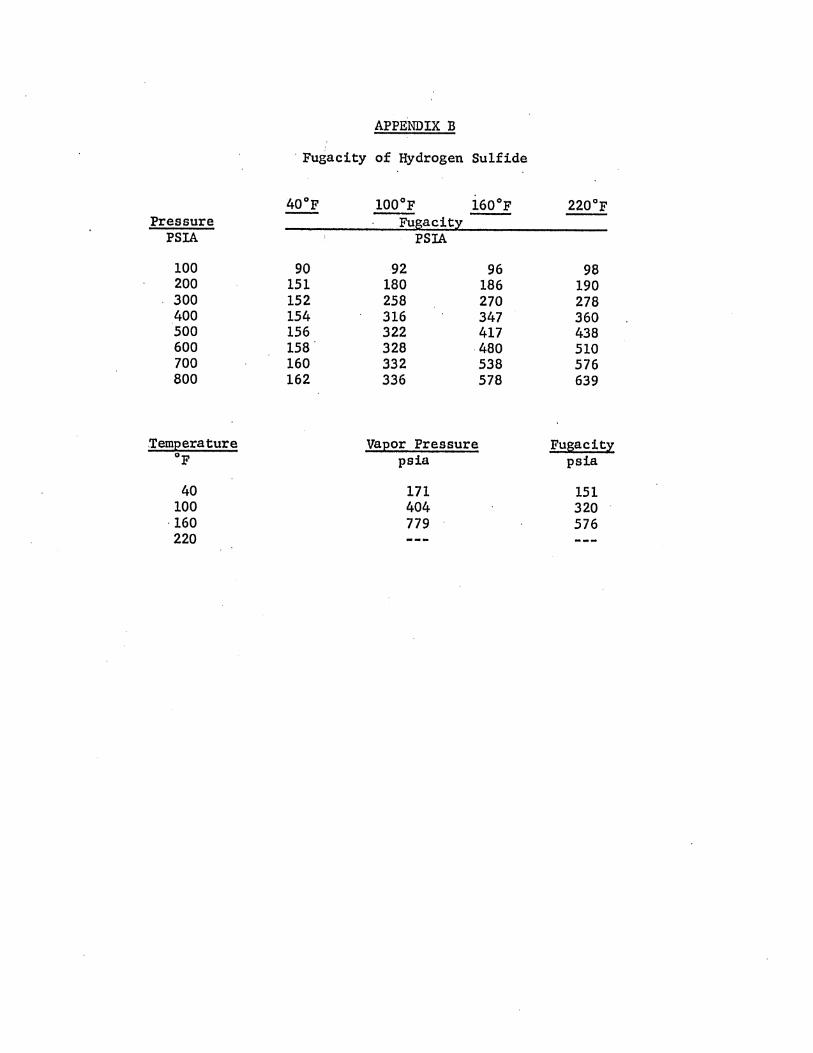
APPENDIX B
Fugacity of Hydrogen Sulfide
Pressure 40°F 100°F
Fugacity 160°F 220°F
PSIA PSIA
100 90 92 96 98 200 151 180 186 190 300 152 258 270 278 400 154 316 347 360 500 156 322 417 438 600 158 328 480 510 700 160 332 538 576 800 162 336 578 639
Temperature Vapor Pressure Fugacity °F psia psia
40 171 151 100 404 320 160 779 576 220 ---