the solid–liquid interfacial energy for solid zn solution at the eutectic zn–sn–mg ternary...
TRANSCRIPT

Accepted Manuscript
Title: The solid-liquid interfacial energy for solid Zn solutionat the eutectic Zn-Sn-Mg ternary alloy
Author: Canan Alper Billur Buket Saatci
PII: S0040-6031(14)00215-9DOI: http://dx.doi.org/doi:10.1016/j.tca.2014.05.010Reference: TCA 76877
To appear in: Thermochimica Acta
Received date: 17-3-2014Revised date: 1-5-2014Accepted date: 6-5-2014
Please cite this article as: C.A. Billur, B. Saatci, The solid-liquid interfacial energy forsolid Zn solution at the eutectic Zn-Sn-Mg ternary alloy, Thermochimica Acta (2014),http://dx.doi.org/10.1016/j.tca.2014.05.010
This is a PDF file of an unedited manuscript that has been accepted for publication.As a service to our customers we are providing this early version of the manuscript.The manuscript will undergo copyediting, typesetting, and review of the resulting proofbefore it is published in its final form. Please note that during the production processerrors may be discovered which could affect the content, and all legal disclaimers thatapply to the journal pertain.

Page 1 of 20
Accep
ted
Man
uscr
ipt
Graphical Abstract (for review)

Page 2 of 20
Accep
ted
Man
uscr
ipt
The solid-liquid interfacial energy for solid Zn solution at the eutectic Zn-Sn-Mg ternary
alloy
Canan Alper Billur a,*
, Buket Saatçi
aDepartment of Physics, Erciyes University, 38039 Kayseri, Turkey
Abstract
The Gibbs–Thomson coefficient, , the effective entropy change, fS , the solid–
liquid interfacial energy, SL , and the grain boundary energy, GB , for solid Zn solution at
the eutectic Zn-Sn-Mg ternary alloy have been calculated by using the grain boundary groove
method with Bridgman-type directional solidification apparatus.
Keywords: Zn-Sn-Mg ternary alloy, Gibbs–Thomson coefficient, interfacial energy.
∗Corresponding author: Phone: +90 352 207 66 66 /33129; Fax: +90 352 433 4933.
E-mail address:[email protected] (Canan A. Billur)
*Manuscript

Page 3 of 20
Accep
ted
Man
uscr
ipt
1
1. Introduction
The Pb-Sn alloys are used widely as a soldering material. It has low melting temperature,
good electrical, strength properties and wettability. Due to Pb element in the alloy is toxic to
environmental and human safety, the lead free solders are prompted to be soldering material
[1]. Recently new solder research is being done and many lead free solder alloys are obtained
having different melting temperatures [2-9]. Among the more important of high temperature
lead free solders are Zn-Sn, Au-Sn, Bi- based alloys. These alloys are used in the aerospace
and automotive industries [10]. Each has advantages as well as some disadvantages. Bi-based
alloys are very brittle with Bi, Au-Sn alloy is expensive. Zn-based alloys have good
mechanical, electrical and thermal conductivity properties and Zn-Sn alloy is cheaper [11].
The melting temperature of the Zn-Sn alloy was increased by addition of Mg. At the same
time selecting the eutectic composition of Zn-Sn-Mg alloy provides sudden solidification at a
single temperature.
The purpose of this study is to determine , fS , SL , and GB from the observed grain
boundary groove shapes for solid Zn in Zn-Sn-Mg ternary alloy. Because there is not enough
research on the entropy, fS , the Gibbs-Thomson coefficient, , the solid-liquid interfacial
energy, SL and the grain boundary energy, GB , of Zn-Sn-Mg ternary alloys.
σSL is a significant physical parameter in phase transformations and solidification. Thus,
the numerical information of σSL values is required. For all that, the determine of σSL is very
difficult for alloy systems and it is determined from the thermodynamic description of ,
which is defined as
f
SLr
SrT
. (1)
Where fS is the effective entropy of melting per unit volume, ∆Tr is the curvature under-
cooling, r is the radius of curvature [12].
In the recent years, it has been extensively studied to determine the Gibbs-Thomson
coefficient, and the solid-liquid interfacial energy, SL in the alloy systems. Jácome et al.
used numerical methods based on Butler’s formulation to calculate the Gibbs-Thomson
coefficient, and the solid-liquid interfacial energy, SL in aluminium alloys [12, 13].

Page 4 of 20
Accep
ted
Man
uscr
ipt
2
2. Experimental Procedure
2.1. Bridgman type directional solidification apparatus (BTDSA)
Firstly, Gündüz and Hunt were designed to calculate values with a radial heat flow
apparatus (RHFA) in opaque alloys systems [14]. They developed a numerical method to
obtain values by using equation (1). Then, this method was modified by Necmettin et al.
[15] for peritectic systems. To calculate with the numerical method, it is necessary to find
the ratio of thermal conductivity of the equilibrated phases )/( ) ( SLiquidEutecticL KKR , and to
calculate the temperature gradient in the solid, GS, and then to obtain the grain boundary
groove shape. So far, these numerical methods have been implemented by many people [14-
26].
The measurement of σSL is very difficult with RHFA. Because, the annealing time to
obtain the equilibrated grain boundary groove shape takes a long time and needs more
materials [14-26].
In the RHFA method, a sensitive temperature controller is required for the sample to
remain in equilibrium during experimental procedure. Otherwise, the sample is affected by
external conditions. Therefore, BTDSA was developed for both shortening the annealing time
of the sample and ensuring of stable temperature control. Recently, various binary alloy
systems were studied by using the BTDSA methods [27-30]. A block diagram of BTDSA and
the details are shown in Fig. 1.
2.2. Sample Preparation
The composition of ternary alloys was selected to be Zn-8.5 at. % Sn-3.5 at. % Mg to
obtain the solid Zn solution from the phase diagram.
Otani observed the Zn-Sn-Mg phase diagram using the microscopic method and thermal
analysis over the whole concentration range [31]. However, the Mg2Sn–MgZn2–Sn–Zn region
and binary systems of the Zn-Sn-Mg have been studied in detailed by Gödecke and Sommer
[32]. In the present study, the phase diagram which has been used was first studied by
Sommer and Gödecke [32].
The sample was melted in a vacuum melting furnace by using 4 N Zn, Sn and Mg, then
the alloy was poured into a graphite crucible held in a hot casting furnace which was set
above the eutectic melting point of the alloy, TE, (628 K). The alloy was directionally
solidified from bottom to top (150 mm in length and 10 mm diameter) and placed in a

Page 5 of 20
Accep
ted
Man
uscr
ipt
3
BTDSA as given in fig. 1. It was heated up to about 628 K and, then left to reach thermal
equilibrium for about 1 h. After thermal equilibrium of the sample was provided, it was taken
to the cold region by the synchronous motor and the temperature of the specimen was also
controlled with a Eurotherm 9706 type controller to an accuracy of ± 0.01 K during the
experimental study. In these measurements, the growth rate was 41.03x10⁻⁴
cm/s. When the
solid–liquid interface was between the 2 and 3 thermocouples, the motor was stopped and it
was again left to reach thermal equilibrium for at least 3 h. Finally, it was quickly quenched
by turning off the input power.
2.3. Measurement of Geometrical Correction for the Groove Coordinates
After the experimental procedure was completed, firstly, the specimen was removed from
the BTDSA and secondly, it was ground and polished by using routine metallographic
polishing techniques. Afterwards, the equilibrated grain boundary groove shapes and
micrometer (0.0001x100=0.01 mm) which was used in this study for the accurate
measurements of the groove coordinate points on the groove shapes were photographed with
a CCD digital camera. This camera has rectangular pixels, and it was placed on the top of an
Olympus BH2 light optical microscope using a 50-times objective. In the present study, the
Adobe Photoshop CS2 software version was used to take the photographs of the equilibrated
grain boundary shapes and the micrometer in the x and y directions. The groove coordinates
on the grain boundary grooves was measured as shown in Ref [15].
2.4. Measurement of Temperature Gradient in the Solid Phase
In order to calculate σSL by using the BTDSA, the values of R and GS was determined
from the temperature gradient measurements on the solid and liquid phases at the same time.
The heat flow away from the interface through the solid phase must balance that of the
heat flow through the liquid phase plus the latent heat generated at the interface and the
steady-state condition, i.e. [33]
VL = KSGS - KLGL (2)
Where V is the growth rate, L is the latent heat, GS and GL are the temperature gradients in the
solid and liquid phases, respectively and KS and KL are the thermal conductivities of the solid

Page 6 of 20
Accep
ted
Man
uscr
ipt
4
and liquid phases, respectively. For very low growth rate is 41.03 10-4
cm/sn VL«KSGS, so that
the conductivity ratio, R, is given by
LLSS GKGK , L
S
S
L
G
G
K
KR (3)
The values of R and GS for the same solid phases obtained in this study are given in fig. 2 and
table 1, respectively.
3. Results and Discussion
3.1. The Gibbs-Thomson Coefficient,
The values of were also determined by using Gündüz and Hunt’s method [14]. The
calculations were performed by using eight equilibrated grain boundary groove shapes and the
obtained shapes are shown in fig. 3. The average value of from table 2 is (10.98 ± 0.88) x
10-8
Km for the solid Zn in the Zn-Sn-Mg ternary alloy. So, the total error in the determination
of is about 8% [28].
3.2. The Effective Entropy Change, fS
To calculate SL , it is also necessary to know fS . fS for alloy systems is given by [14]
LLSL
LSEf
CCVm
CCRTS
)1(
)(
(4a)
)(CfVm
RTS
SL
Ef (4b)
Where R is the gas constant, TE the eutectic point (628 K), and CL and CS are the composition
of the equilibrated liquid and solid phases in at. %, respectively, mL is the liquidus slope, VS
is molar volume of the solid [14]. The other required parameters can be obtained from the Zn-
Sn-Mg phase diagram, which was studied by Sommer and Gödecke [32]. The obtained
fS value is (1.20 ± 0.06 x106) x 10
6 J/Km
3 for the present study (Table 3). The estimated
error in fS was estimated to be about 5 % [35].
A

Page 7 of 20
Accep
ted
Man
uscr
ipt
5
3.3. The Solid-Liquid Surface Energy, SL
If , fS are correctly measured or known, SL can be calculated by using equation (1)
for opaque alloy systems.
In the present study, SL for the Zn solid solution in equilibrium with the Zn-Sn-Mg
liquid solution was found to be (131.82± 17.14) mJ/m2
and the experimental error is about 13
%. The values of and SL with standard deviations are given in table 1. The other
experimentally determined values of SL were compared with the previous study in table 4.
3.4. The Grain Boundary Energy, GB
The interfacial energy of the solid Zn in equilibrium with the eutectic Zn-Sn-Mg liquid
was considered to be isotropic in this study. When SL is isotropic, it is equal to the surface
tension [36]. By using the balance of forces at the grain boundary groove, this is possible to
determine SL and GB . When SL is not anisotropic, the force balance can be given as
B
B
SLA
A
SLSS cos cos (5)
Where A and B are the angles that the solid-liquid interfaces make with the y-axis. If the
grains on either side of the grain boundary are the same, GB can be given as
cosθσ2σ SLGB (6)
Where 2
BA is the angle that the solid-liquid interfaces make with the y axis [6]. By
using Taylor expansion for parts at the base of the groove, the A and B angles in the cusp
were obtained from the cusp coordinates [15].
GB was calculated from the equation (6) using the related SL and for the groove
shapes in Figure 3. The average grain boundary value for the eight grain boundary groove
shapes was found to be GB = 242.58 ± 33.96 mJ/m2. A comparison of our results with the

Page 8 of 20
Accep
ted
Man
uscr
ipt
6
previous study is also provided in table 4. The obtained results are in good agreement with the
result in the literature [20, 25, 28, 29, 37-41]. Therefore, the total experimental error in the
resulting grain boundary energy is about 14 % obtained together with a determined 1 % error
of θ.
4. Conclusions
The equilibrated grain boundary groove shapes were obtained for the solid Zn solution in
equilibrium with the Zn-Sn-Mg eutectic liquid with a BTDSA, and Γ was calculated by using
eight of the groove shapes as Γ= (10.98 ± 0.88) x 10-8
Km. fS was determined to be (1.20 ±
0.06 x106) x 10
6 J/Km
3 by using the phase diagrams [32] and related parameters. SL was
calculated to be SL = (131.82± 17.14) mJ/m2 by using Γ and fS . GB was determined to be
GB =(242.58 ± 33.96) mJ/m2
by using the equilibrated shapes and the related SL . The total
experimental error in the resulting grain boundary energy is about 14 %. This experimental
error is obtained by the sum of the Gibbs-Thomson Coefficient, , the Effective Entropy
Change, fS , the angle θ, 8 % , 5 % , 1 % respectively.
Acknowledgement
The results of this paper are in the frame of project FBD-10-3263 financed by the Erciyes
University Research Fund.
References
[1] N. Ogawa, T. Miki, T. Nagasaka and M. Hino, Activity measurement of the constituents
in molten Sn-Mg-Zn ternary lead free solder alloys by mass spectrometry, Mat. Trans. 43 12
(2002) 3227-3233.
[2] W. R. Osório, L.C. Peixoto, L.R. Garcia, N. M. Noël, A. Garcia, Microstructure and
mechanical properties of Sn–Bi, Sn–Ag and Sn–Zn lead-free solder alloys, J. Alloys Compd.
572 (2013) 97-106.

Page 9 of 20
Accep
ted
Man
uscr
ipt
7
[3] J. Chen, J. Shen, D. Min, C. Peng, Influence of minor Bi additions on the interfacial
morphology between Sn-Zn-xBi solders and a Cu layer, J. Mater. Sci.: Mater. Electron. 20
(2009)1112–1117.
[4] Y. Li, K.S. Moon, C.P. Wong, Electronics Without Lead, Mat. Sci.308 5727 (2005) 1419–
1420.
[5] E. Çadırlı, U. Böyük, S. Engin, H. Kaya, N. Maraslı, A. Ülgen, Experimental investigation
of the effect of solidification processing parameters on the rod spacing in the Sn-1.2 wt. % Cu
alloys, J. Alloys Compd. 486(2009) 199–206.
[6] L.R. Garcia, W.R. Osório, L.C. Peixoto, A. Garcia, Wetting behavior and mechanical
properties of Sn-Zn and Sn-Pb solder alloys, J. Electron. Mater. 38 (2009) 2405–2414.
[7] A. Ahmido, A. Sabbar, H. Zouihri, K. Dakhsi, F. Guedira, M. Serghini-Idrissi, S. El
Hajjaji, Effect of bismuth and silver on the corrosion behavior of Sn–9Zn alloy in NaCl 3
wt.% solution, Mat. Sci. Eng. B 176 (2011) 1032–1036.
[8] I. T. Wang, J.G. Duh, C. Y. Cheng, J. Wang, Interfacial reaction and elemental
redistribution in Sn3.0Ag0.5Cu–xPd/immersion Au/electroless Ni solder joints after aging,
Mat. Sci. Eng. B 177 (2012) 278–282.
[9] A. Sharif, Y.C. Chan, M.N. Islam, M.J. Rizvi, Dissolution of electroless Ni metallization
by lead-free solder alloys, Mat. Sci. Eng. B 106 (2004) 126–131.
[10] Washington L.R Santos, C. Brito, José M.V. Quaresma, José E. Spinelli, A. Plate-like
cell growth during directional solidification of a Zn–20wt%Sn high-temperature lead-free
solder alloy, Mat. Sci. Eng. B 182 (2014) 29-36.
[11] J.E. Lee, K.S. Kim, K. Suganuma, M. Inoue and G. Izuta, Thermal properties and phase
stability of Zn-Sn and Zn-In alloys as high temperature lead-free solder, Mat. Trans. 48 3
(2007) 584 – 593.
[12] Paulo A.D. Jácome, Mariana C. Landim, Amauri Garcia, Alexandre F. Furtado, Ivaldo L.
Ferreira, The application of computational thermodynamics and a numerical model for the
determination of surface tension and Gibbs–Thomson coefficient of aluminum based alloys,
Thermochimica Acta 523 (2011) 142-149.
[13] Paulo André Dias Jácome, Natalie Von Paraski, Alexandre Furtado Ferreira, Amauri
Garcia, Ivaldo Leao. Ferreira, Evolution of surface tension and Gibbs-Thomson coefficient
during aluminium alloys solidification, 7th
Brazilian Congress on Manufacturing Engineering,
May 20th
to 24th
, 2013-Penedo, Itatiaia-RJ-Brazil.
[14] M. Gündüz, J.D. Hunt, The measurement of solid-liquid surface energies in the Al-Cu,
Al-Si and Pb-Sn systems, Acta Mater, 33 9 (1985) 1651-1672.

Page 10 of 20
Accep
ted
Man
uscr
ipt
8
[15] N. Maraşlı, (1994) The measurement of solid-liquid surface energy. Ph.D.Thesis,
University of Oxford.
[16] B. Saatçi (2000) The measurement of solid-liquid surface energy of binary alloys, Ph.D.
Thesis, Erciyes University.
[17] K. Keşlioğlu (2002) The measurement of solid-liquid surface energy, Ph.D. Thesis,
Erciyes University.
[18] M. Erol, N. Maraşlı, K. Keşlioğlu, M. Gündüz, Solid-liquid interfacial energy of bismuth
in the Bi-Cd eutectic System , Scr. Mat. 51 (2004) 131-136.
[19] B. Saatçi, H. Pamuk, Experimental determination of solid liquid surface energy for Cd
solid solution in Cd Zn liquid solutions, J. Phys:Condens. Matter. 18 45 (2006) 10143-10155.
[20] F. Meydaneri, B. Saatçi, M. Gündüz, M. Özdemir, Measurement of solid–liquid
interfacial energy for solid Zn in the Zn–Cd eutectic system, Surf. Sci.601 (2007) 2171-2177.
[21] N. Maraşlı S. Akbulut, Y. Ocak, K. Keşlioğu, U. Böyük, H. Kaya, E. Çadırlı,
Measurement of solid-liquid interfacial energy in the In-Bi eutectic alloy at low melting
temparature, J. Phys.Condens. Matter 19 (2007) 1-16.
[22] B. Saatçi, S.Çimen, H. Pamuk, M. Gündüz, The interfacial free energy of the solid Sn on
the boundary interface with liquid Cd-Sn eutectic solution, J. Phys. Condens. Matter 19,
326219, (2007) 1-11.
[23] F. Meydaneri, B. Saatçi, M. Özdemir, Experimental determination of solid–liquid
interfacial energy for solid Sn in the Sn–Mg system, App. Sur. Sci. 257 15 (2011) 6518-6526.
[24] B. Saatçi, F. Meydaneri, M. Özdemir, E. Yılmaz, A. Ülgen, Experimental determination
of interfacial energy for solid Sn in the Sn-Ag alloy by using radial heat flow type
solidification apparatus, Sur. Sci. 605 (2011) 623-631.
[25] F. Meydaneri, M. Payveren, B. Saatçi, M. Özdemir, N. Maraşlı, Experimental
Determination Of Interfacial Energy For Solid Zn In Sn-Zn Eutectic System Met. Mater. Int.
18, 1 (2012) 95-104.
[26] F. Meydaneri, B. Saatçi, A. Ülgen, Interface energy of solid cadmium (Cd) phase in the
Cd-Pb (Cadmium-lead) binary alloy, Int. J. Phys. Sci. 8 (6) (2013) 231-243.
[27] A. Bulla, C. Carreno-Bodensıek, B. Pustal, R. Berger, A. Buhrıg-Polaczek, A.Ludwıg,
Determination of the solid-liquid interface energy in the Al-Cu-Ag system, Metall. Mater.
Trans. A 38 (2007) 1956-1964.
[28] U. Böyük, S. Engin, N. Maraşlı, Novel experimental technique to observe equilibrated
grain boundary groove shapes in opaque alloys, J. Alloy. Compd. 476 (2009) 213-219.

Page 11 of 20
Accep
ted
Man
uscr
ipt
9
[29] S. Engin, U. Böyük, N. Maraşlı, Determination of interfacial energies in the Al–Ag and
Sn–Ag alloys by using Bridgman type solidification apparatus J. Alloy. Compd. 488 (2009)
138-143.
[30] D.G. McCartney, (1981)Studies on Cellular and Dendritic Solidification, D. Phil.Thesis,
University of Oxford UK, pp.85.
[31] B. Otani, Constitution of the phase equilibrium diagram of the magnesium–zinc–tin
system. Tetsu to Hagane 1993, 19, pp. 566–574 Experimental, Equi. Diagram, vol. 6 (in
Japanese).
[32] T. Gödecke, F. Sommer, Zeitschrift fur Metallkunde 85 (1994). 683–691. Experimental,
Equi. Diagram, vol. 9 (in German).
[33] D. A. Porter, Easterling KE. Phase transformations in metals and alloys. UK: Van
Nostrand Reinhold Co. Ltd; 1991. pp. 204.
[34] J.W. Christian, The Theory of Transformation in Metals and Alloys, Part I, 2nd edition,
Pergamon, Oxford, 1975.
[35] M. Tassa, J.D. Hunt, The measurement of Al-Cu dendrite tip and eutectic interface
temperatures and their use for predicting the extent of the eutectic range, J. Cryst. Growth 34
(1976) 38-48.
[36] D. P. Woodruff, The Solid–Liquid Interface vol 36 (Cambridge: Cambridge University
Press), 1973, pp 1–2.
[37] Y. Kaygısız, S. Akbulut, Y. Ocak, K. Keşlioğlu, N. Maraşlı, E. Çadırlı, H. Kaya,
Experimental determination of solid–solid and solid–liquid interfacial energies of solid ɛ
(CuZn5) in the Zn–Cu alloy, Alloy. Compd. 487 (2009) 103-108.
[38] M. Erol, K. Keşlioğlu, and N. Maraşlı, Measurement of solid-liquid interfacial energy
for solid Zn in equilibrium with the ZnMg eutectic liquid, Metall. Mat. Trans. A 38A (2007)
1539-1545.
[39] K. Keşlioğlu, N. Maraşlı, Solid–liquid interfacial energy of the eutectoid β phase in the
Al–Zn eutectic system, Mat. Sci. Eng. A369 (2004) 294-301.
[40] K. Keşlioğlu, N. Maraşlı, Experimental determination of solid-liquid interfacial energy
for Zn solid solution in equilibrium with the Zn-Al eutectic liquid, Metal. Mat. Trans. A 35 12
(2004) 3665-3672.
[41] S. Aksöz, Y. Ocak, N. Maraşlı, K. Keşlioğlu, Determination of thermal conductivity and
interfacial energy of solid Zn solution in the Zn-Al-Bi eutectic system, Experimental Thermal
and Fluid Science. 35 (2011) 395-404.

Page 12 of 20
Accep
ted
Man
uscr
ipt
Table 3.
System Zn-Sn-Mg
Composition of solid Phases, CS Solid Zn
Compositions of Quenched Liquid Phase, CL Eutectic Liquid (Zn-8.5 at. % Sn-3.5 at. % Mg)
The value of f (c) for solid Zn 1.14
Melting Temperature, TM(K) 628
Liquidus slope of solid Zn, mL(K/at.fr) 521
Crystal Structure Hexagonal A3
Lattice parameters )(0
A a=2.664, c=4.945
n 6
Molar Volume of Solid Zn, VSx10-6
(m3) 9.16
M(g) 65.37
d(g/cm3) 7.13
Entropy Change of fusion for solid Zn, *S (J/Km3) 1.2 ± 0.06 x10
6
Table(s)

Page 13 of 20
Accep
ted
Man
uscr
ipt
Table Captions
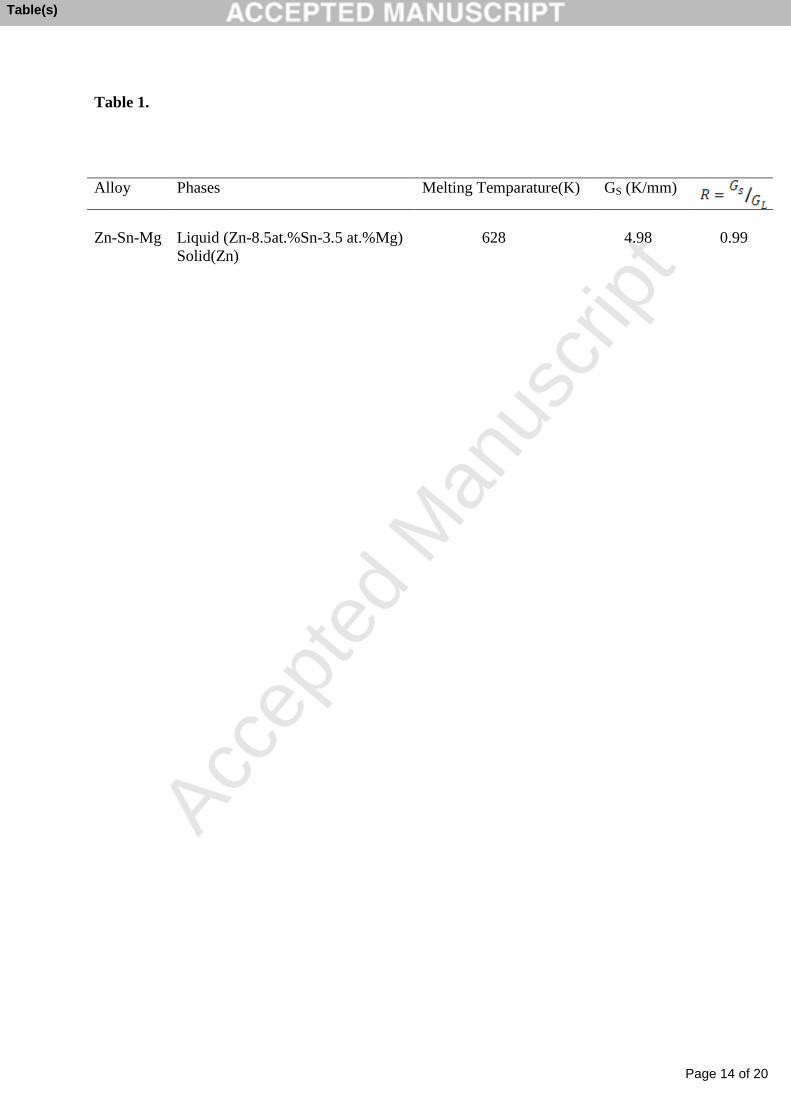
Table 1. The values of R and GS for the same solid phases obtained in this study
Table 2. Gibbs-Thomson coefficients for the solid Zn phase in equilibrium with the eutectic
Zn-8.5 at. % Sn-3.5 at. % Mg liquid.
Table 3. Some physical properties of solid Zn phase in the Zn-Sn-Mg ternary system
Table 4. A comparison of the temperature, , SL , GB values for solid Zn phase obtained in
the present work with the values of the temperature, , SL , GB obtained in previous works
Table(s)
Page 14 of 20
Accep
ted
Man
uscr
ipt
Table 1.
Alloy Phases Melting Temparature(K) GS (K/mm)
Zn-Sn-Mg
Liquid (Zn-8.5at.%Sn-3.5 at.%Mg)
Solid(Zn)
628
4.98
0.99
Table(s)

Page 15 of 20
Accep
ted
Man
uscr
ipt
Table 2.
(10.98 ±0.88)× Km
Groove no
GS (K/mm)
Gibbs-Thomson coefficient
1 4.4 4.2
4.98
11.30 11.21
2 1.1 0.3 11.15 11.15
3 1.4 4.0 9.82 9.80
4 4.4 9.9 10.70 10.64
5 22.0 9.0 11.94 11.86
6 29.6 19.6 10.56 10.69
7 5.0 0.8 10.90 11.41
8 45.5 20.7 11.31 11.31
Table(s)

Page 16 of 20
Accep
ted
Man
uscr
ipt
Table 4. A comparison of the temperature, , SL , GB values for solid Zn phase obtained in the present work with the values of the
temperature, , SL , GB obtained in previous works
System
Solid phase Liquid phase x10-8
(Km) σSLx10-3
(Jm-2
) σGBx10-3
(Jm-2
)
Zn-Cu ɛ(CuZn5) (Zn-12 at % Cu)[37] Zn-1.75 at % Cu[30] 4.9±0.3[30] 76.0±9.1[30] 150.3±19.5[30]
Zn-Cd Zn (Zn-0.76 at % Cd)[20] Zn-26.9 at % Cd[20] 2.5±0.1[20] 165.5±19.0[20] 317.8±39.9[20]
Sn-99.9wt%Zn[25] Sn-9wt%Zn[25] 2.32±0.13[25] 120.87±13.29[25] 194.76±23.37[25]
Mg-Zn Zn-0.4 at % Mg[38] Zn-7.8 at % Mg[38] 10.64±0.43[38] 89.16±8.02[38] 172.97±20.76[38]
Zn-Al Znβ(Al-66.5 at % Zn)[39] Al-88.7 at % Zn[39] 3.41±0.14[39] 106.94±9.62[39] 204.72±22.52[39]
Zn(Zn-2.4 at % Al)[28] Zn-11.3 at % Al[28] 6.41±0.51[28] 103.33±13.4[28] 204.11±30.62[28]
Zn(Zn-2.4 at % Al)[40] Zn-11.3 at % Al[40] 5.80±0.18[40] 93.49±8.41[40] 182.30±18.23[40]
Zn-Al-Bi Zn(Zn- 3 at % Al -0.3 at % Bi)[41] Zn-12.7 at % Al-1.6 at % Bi[41] 5.1±0.4[41] 80.1±9.6[41] 158.6±20.6[41]
Zn-Sn-Mg Zn[PW] Zn-8.5 at % Sn-3.5 at % Mg[PW] 10.98±0.88[PW] 131.82±17.14[PW] 242.58±33.96[PW]
Table(s)

Page 17 of 20
Accep
ted
Man
uscr
ipt
Fig. 1.
TC-08 Data Logger
Bri
dg
ma
n t
yp
e
soli
dif
ica
tio
n
furn
ace
Variac
Eurotherm 9706
type controller.
Synchronous
motors
Hea
tin
g /
Ref
rigera
tin
g
Cir
cula
tor
Directional
control unit
Power
outlet
Computer
wate
r co
oli
ng
Circulator input
wate
r co
oli
ng o
utl
et
wate
r co
oli
ng i
np
ut
Circulator outlet
Figure(s)

Page 18 of 20
Accep
ted
Man
uscr
ipt
Fig. 3
50 µm
50
µm
50
µm
50
µm
50
µm
50 µm
50 µm
50 µm
Solid Zn solution Solid Zn solution
Solid Zn solution Solid Zn solution
Eutectic Zn-Sn-Mg liquid Eutectic Zn-Sn-Mg liquid
Eutectic Zn-Sn-Mg liquid Eutectic Zn-Sn-Mg liquid
Figure(s)
Page 19 of 20
Accep
ted
Man
uscr
ipt
Figure Captions
Fig.1 The block diagram of the experimental system.
Fig. 2 The value of R is obtained in this study.
Fig. 3 Typical grain boundary groove shapes for the solid Zn phase in equilibrium with the
eutectic Zn-8.5 at. % Sn-3.5 at. % Mg liquid.
Figure(s)

Page 20 of 20
Accep
ted
Man
uscr
ipt
Distance (cm)
6,5 7,0 7,5 8,0 8,5 9,0 9,5 10,0 10,5
Tem
pera
ture
(o K
)
540
560
580
600
620
640
660
680
700
720
740
760
Liquid Phase
Solid Phase
GS=4.982 K/mm
GL=6.210 K/mm
TM=628 0K
R=Gk/Gs=0.986
Fig. 2
Figure(s)