the social layer of stampers ladder: a systematic approach
TRANSCRIPT

HAL Id: hal-01920719https://hal.inria.fr/hal-01920719
Submitted on 13 Nov 2018
HAL is a multi-disciplinary open accessarchive for the deposit and dissemination of sci-entific research documents, whether they are pub-lished or not. The documents may come fromteaching and research institutions in France orabroad, or from public or private research centers.
L’archive ouverte pluridisciplinaire HAL, estdestinée au dépôt et à la diffusion de documentsscientifiques de niveau recherche, publiés ou non,émanant des établissements d’enseignement et derecherche français ou étrangers, des laboratoirespublics ou privés.
Distributed under a Creative Commons Attribution| 4.0 International License
The Social Layer of Stampers Ladder: A SystematicApproach to the Soft Edge of Organizational
TransformationsAuke Breemen, Ralf Nieuwenhuijsen
To cite this version:Auke Breemen, Ralf Nieuwenhuijsen. The Social Layer of Stampers Ladder: A Systematic Approachto the Soft Edge of Organizational Transformations. 18th International Conference on Informatics andSemiotics in Organisations (ICISO), Jul 2018, Reading, United Kingdom. pp.94-104, �10.1007/978-3-319-94541-5_10�. �hal-01920719�

The Social Layer of Stampers Ladder: A Systematic
Approach to the Soft Edge of Organizational
Transformations
Auke J.J. van Breemen1[0000-1111-2222-3333] and Ralf Nieuwenhuijsen2[1111-2222-3333-4444]
1 KiF-advies, Oude Graafseweg 52, 6543PS Nijmegen, The Netherlands
[email protected] 2 Bibo Trainingen, Van Oldenbarneveltstr. 47, 6512 AT, Nijmegen
Abstract. The social layer of Stampers ladder addresses the problem of respon-
sible agents interacting with each other. It is the layer at which in organizations
decisions are made and transformations negotiated. The method we present sup-
ports this human interplay. It combines principles of actualism, ontology charts,
the knowledge in Formation process model and the Cynefin framework to gather
and combine quantitative data with qualitative data, expressing attitudes and per-
ceptions in meaningful diagrammatic representations of business processes. The
analytic tool Sensemaker can be used to support decision making.
Keywords: Actualism, Ontology Chart, Cynefin, Knowledge in Formation
(KiF), Stakeholder Focused Modelling, Process, Qualitative and Quantitative
Data, Peircean Semiotics.
1 Introduction
If we, the developers, want to provide actionable insight into the human interplay
among sign-based world and digital technologies as part of processes of organizational
transformation, it is essential that they, the users, get insight in what is needed to realize
the transformations and can share their experiences with their co-workers. This insight
requires that each of the actors is afforded to have an idea of the situation (s)he is acting
in and that those ideas are shared where needed. Here we face two alignment issues at
once.
The first may be termed vertical alignment. Hoppenbrouwers directs the attention to
the human side of information systems building with the distinction between business
stakeholders and IT stakeholders. The former being primarily occupied with running
the business, the latter with designing, building and maintaining information systems
with the risk of misunderstanding and bad performance due to differing goals and con-
ceptual habits in the design stage [1]. Stamper looks at it from a systems side when he
proposes his semiotic ladder to distinguish the different levels that must be considered
when designing an information system [2].

The second may be termed horizontal alignment. Its concern is interoperability
across (departments of) organizations. Liu, Li and Liu following Stampers semiotic
framework state that we have semiotic interoperability if signs among systems are suc-
cessfully communicated in all the six levels Stamper distinguishes. Thus, every sign
aspect is covered [3], [4]. Their interest concentrates on five of the six levels: physical
world, empirics and syntactics, taken together under the label ‘technical’, semantic and
pragmatic interoperability. This grouping relates their work to the Shannon Weaver
distinction in three levels [5] of which the Stamper framework is a refinement from a
semiotic perspective. The technical level being formally covered by Shannon’s mathe-
matical theory of communication. From there their research climbs the ladder layer by
layer, leaving the social layer for the moment unexploited.
Goldkuhl and Ǻgerfalk remark that it is difficult to distinguish between the prag-
matic and social levels on the semiotic ladder because in both signs are produced and
such actions are in most cases social actions [6]. It appears that they forget that all levels
of the ladder contribute in social actions. Stampers ladder levels are objectifications of
sign aspects involved in signs: a word has its qualities (physical), its form and existence
(empirics), its combinatory properties (syntactics), its meaning (semantics), its usability
(pragmatics) and its habitat (social world). So, all levels of the ladder are involved in
the social world, just as Shannon’s theory on the technical level is involved in the mean-
ing and effectiveness level. The crux being that it is possible to pay attention to the
technical level without taking care of the other levels, but it is not possible, when de-
signing information systems, to pay due attention to the social level without taking ac-
count of the involved levels, as the information revolution makes clear.
This leaves us with the question what, if any, the distinguishing characteristics are
of the social level of Stampers ladder. Oppl and Hoppenbrouwers provide a good van-
tage point for an answer with their plea for stakeholder-centric modelling. In [7] they
assert that involving business stakeholders in enterprise modelling also helps them to
articulate and align their views on their organization. This requires, so they state, that
stakeholders must be able to understand and perform conceptual modelling for repre-
senting their views on enterprise structure and behavior. I regard this to be part of the
vertical view on alignment due to its reliance on the semantical layer and its modelling
techniques. At least partly the business stakeholders are drawn into the IT stakeholder’s
role and must go from their more familiar, informal way of looking at their working
situation to a less familiar and more formal approach.
Below we suggest a method that professes to model the social layer. It rests on the
assumption that sign processing actors (or stakeholders) are unquestionably to be clas-
sified as Information Systems, while IS’s are information systems from some perspec-
tives, but also can be viewed as affordances for actors, that are acting in and between
organizations, that also can be looked at as actors, for which IS’s are affordances.
Since the goal is actionable insight for business stakeholders, we keep our exposition
of the method short. In section two we present what we, the developers, could com-
municate with the (business) project leader who is supposed to be familiar with ontol-
ogy charts. In section three we describe the KiF-diagram we use with the help of the
Cynefin and Sensemaker approach of Snowden. In section four we describe an experi-
mental case study.

2 Actualism, Ontology Charts and Interpretation Processes
Our general model of the social layer for a company starts with the two assumptions of
Stampers actualism:
1. No reality without a knowing agent
2. No knowledge of the world without action
From this we construct the interpretation process [agent or state (a), action or effect (b)
>- knowledge or response (c)]. The symbol >- is shorthand for the interpretation process
that runs from the event of an effect (b) on an agent in a certain state (a) to its resulting
conclusion or response (c). The agent can be relatively simple like a tire responding
with a flat when undergoing the effect of a nail, leaving room for a causal explanation.
But it can also be complex like a whole company responding to market changes with a
reorganization plan. The action likewise can be simple like a nail or itself a manifesta-
tion of an agent and complex like another business in B to B transactions. The goal can
be concrete like a flat tire, or abstract like business objectives. Abstract goals have their
reality in that they tend to co-determine the agent’s response on an action in instances
of interpretation processes. Abstract goals turn a mechanical process of cause and effect
into a triadic relation in which actor, action and goal are the corner stones of a complex
process.
Fig. 1. Ontology chart of project management, cited from Liu 2000, p. 79
For three reasons we will hook our diagrammatic representation of company processes,
see below, on the ontology charts of the Semantic Analysis Method (SAM), see fig. 1:
1. Its definition of an agent as a special kind of affordance, that can be defined as some-
thing that performs responsible behavior and can be as diverse as an individual, a
(part of) organization, a language group, […].
2. The dependency relation that is assumed and expressed by taking society as the root
node of which all other agents are ontological depended specifications. Both points
paraphrased from [8].

3. The correspondence between these notions in our respective approaches enables the
connection of the ontology charts of the semantical level with our diagrams on the
social level. This suggests the possibility to connect our proposed technical solution
with an existing information system.
In the ontology chart of figure 1 the ontological dependencies are pictured for person,
employed by an organization for a department and assigned to a project. In the seman-
tic layer we want to picture the relations between concepts. In the social layer our in-
terest goes to the interactions between the different responsible agents in the execution
of their duties. The process definition points the way for a first crude approximation.
Let’s say, also as a first introduction of our experimental case below, organization
is a company that produces complex tools, materials needed in the operation of the tools
and some accessories used in the branch they are in. The department in focus is the
sales department populated with sales representatives, each working a rayon. The pro-
ject aims at improving the sales. To that end we want insight in the training needs of
the sales representatives or in terms of the ontology chart the person/department com-
bination. To that end we define the process: Sales Representative (state), Customer (ef-
fect) >- Sales (result).
By tracing back to the root node, we find Organization/Company as the node on
which the sales department ontologically depends. If we take the Management Team as
the responsible agents for this node we get the process: MT, business processes >- Per-
formance. Since the goals of the Sales Department are subservient to the overall busi-
ness goals, the Sales process is an embedded process. Before we show how this can be
captured in a meaningful diagram a few words on the node person and the reason why
it appears on the same level as organization.
Suppose that instead of a chart for project management, we want to make an ontol-
ogy chart for the different organizations a given person contributes to. Besides com-
pany, family is an obvious candidate, but also sportive, religious and political organi-
zations are candidates. Each organization has goals the person tries to contribute to in
one way or another. And, let’s not forget the persons self-interest as a goal pursued.
Relevant conflicts of interest may result, and responsibility of agents becomes a subject.
3 The Cynefin Framework, KiF-diagrams and Sensemaker
The Cynefin Framework, see fig. 2 left, originates with Kurz and Snowden. The frame-
work offers five contexts in which persons that must make decisions can find them-
selves to be. It is used primarily “[…] to consider the dynamics of situations, decisions,
perspectives, conflicts, and changes in order to come to a consensus for decision-mak-
ing under uncertainty.” It does not aim to categorize a situation but assists in making
sense by sharing perceptions [9].
The main division is between ordered (right) and unordered (left) domains. Each
domain is characterized according to the cause – effect relationships as they appear to
the actors.

Fig. 2. Left the Cynefin framework with the fifth domain disorder in the center. Next to it the
KiF-diagram with the Peircean semiotic terms for the sign aspects on the nodes of the dependency
structure that analytically describes the moments each realized interpretation process must pass.
Right the four stages in that process. The four square Cynefin domains correspond to the four
nodes on the corners: Chaotic – qualisign, Simple – legisign or type, Complex – Rheme or term,
Complicated – argument. Disorder corresponds to the index position, for KiF the locus of sub-
processes needed to reach a given conclusion. KiF describes interpretation processes, Cynefin
indicates the domains in which they may fail and facilitates with the help of Sensemaker the
search for solutions.
Simple or obvious: In this domain the relation between cause and effect is known.
The cause we sense is familiar.1 We can categorize the cause and respond according
to the habit or well-structured set of habits it activates.
Complicated: In the complicated domain the relation between cause and effect may
not be fully known or known only by a small group of people. We must analyze the
cause we sense in order to be able to arrange a set of habits for a suitable response.
Complex: In this domain there are cause-effect relations, but we have insufficient
actionable insight in their relationships. The contingencies of history and unintended
consequences of previous actions place us in this domain. We must probe the cause
from the different perspectives of the involved stake holders and eventually readjust
our habits or device new ones for our responses. Safe to fail strategies are advisable.
Chaotic: Disaster happens. The best course of action is to start acting in order to
stabilize the situation, sense the consequences and decide further along the way.
Disorder: This is the domain of conflict between the different stakeholders about
what domain we are in with a given cause. Organizational transformations may suf-
fer from neglect for the deep roots of this domain, it is the locus of cognitive disso-
nance and a source for conflict about the strategy to follow.2
The Cynefin framework facilitates and stimulates dynamical interpretations. A (part of
an) organization firmly located in the Simple domain, for instance, may slide into Cha-
otic if a novelty is recognized not at all, to late or met with a strategy pertaining to a
wrong domain. But it does not have a well-defined notion of interpretation processes.
The isomorphic KiF-model, first introduced by Farkas and Sarbo [10], contributes one.
1 It is a legisign, alternatively called type or famisign, in Peirce’s semiotic terminology. 2 Paraphrased from [9]

In fig. 2 the KiF-processing scheme is represented with the Peircean semiotic terms that
indicate the factors involved in reaching a conclusion (goal) on a sign (effect) that offers
itself for interpretation to an interpreting system (state). For details the reader is referred
to [11] here we only mention some points relevant for our experimental case.
First, it is important to remark that the KiF-diagram gives an analytical reconstruc-
tion of interpretation processes in a dependency structure, it indicates what is involved
and does not provide a mechanical bottom up procedure: we suppose the input – output
relation to be on a line orthogonal to the index position. Next, we explicate the state
and effect below the qualisign position and the goal of the process above the argument
position, finally we start to fill in the diagram like a sudoku, see fig. 3 right for an
example of the first approximation.
Explications of Cynefin as a rule start in media res with the domain obvious or what
is first for us in the order of knowledge. KiF in contradistinction starts with the first in
the order of nature from a cosmic, evolutionary perspective, i.e. the primordial soup
(Chaos in Cynefin). 3 Semiotically the primordial soup is the confluence of all qualities
regarded as aspects of signs present to the mind for a process of interpretation that ends
with a response. In actual practice habits take a shortcut to a response, the semiotic
analysis explicates what we assume to be involved in those habits of interpretation.
Applying the semiotic notions to Cynefin we get a reconstruction of interpretation
processes in the most general terms. At the event of an interaction, the state of the agent
and the effect are sorted out of the primordial soup. If both fail to be abstracted we are
in a chaotic state in which the only course for action is to act, sense and respond without
any guarantee. If only the state succeeds we are in a complex situation since there is no
best practice (legisign, type) that fits the token (sinsign) we are confronted with. We
must probe and sense to familiarize with the effect before an adequate response is pos-
sible. If the effect can be abstracted into a type, but the novelty does not fit in with the
state (Rheme, also term), the state fails in the complementation state and a suitable
response is not found. Again, we find ourselves in the complex domain, with the risk
of sliding into chaos. Getting an expert might prove this to be a complicated case, ena-
bling: sense, analyze and respond.
If both succeed and can be complemented, without the emergence of disorder (in-
dex), and an adequate response results, we have a best practice and reside in the domain
simple. If both can be abstracted but disorder prevents an adequate response we are in
the complicated domain. We must sense and analyze before we respond. This is where
Sensemaker fits in.
Quantitative data are excellent means to generalize and categorize, but weak in find-
ing the dynamics in individual cases. Qualitative data, like narratives and suggestions,
derived from stakeholders are good probes of individual cases. SenseMaker combines
quantitative with qualitative data for analytical purposes. Since the reader will be fa-
miliar with quantitative data, we concentrate on Sensemakers dealing with narratives.
A typical question for Sensemaker is to pose a subject, ask people to tell their story and
have them signify the stories with the help of Triads, see for an example fig. 4. the left
3 Cf Aristotle, Analytica Posteriora, 72a. This is what makes Cynefin far superior to the semi-
otic KiF-framework in explanations for a wider audience of what we do.

Triad. A Triad is a triangular shape with at each corner a term. The trick is to find three
terms that are related and allow for graduation, as in our example. The question posed
was: what are your training needs? The score indicates in what amount product
knowledge, sales skills and market knowledge are whished for in a training. Of course,
in itself the scores on Triads can mean almost anything. But, since the scores are con-
nected to the narratives in the database, by making selections on the scores, the accom-
panying narratives are retrieved providing the experiences behind the scores, if whished
together with gathered qualitative data. Thus, offering handles for interpretation of the
scores on the Triads and by that supporting policy making and detecting weak signals.
Use of the Triads in KiF-diagrams differs from their use together with Cynefin. Used
together with KiF, the triads must be distributed over the four domains, question and
terms on the corners must fit the domain and we ask to provide reasons for the score
given. The sign definition, a sign is something (monadic), that presents some object
(dyadic relation sign-object), to an interpreting thought (triadic relation of sign, object,
interpretant) delivers the format for the terms to choose on the corners, see [12] for the
Peircean background. If disorder is an intrinsic feat of the research domain, the Cynefin
approach is suited to find weak signals and patterns. If, like in an organization, it is
feasible and desirable to resolve disorder, the KiF-diagrams offer a uniform model for
all processes and a means to order and distinguish them in dependency structures.
4 An Experimental Business Case
At some point Nieuwenhuijsen, a trainer in social and commercial skills and interim
manager, was asked by a company, vending highly technical tools, to improve the sales
of the sales representatives, results deteriorating over time, markets being lost. With
Van Breemen he decided that this was a good opportunity to probe the possibilities of
the Sensemaking approach for an assessment of the training needs.
The goal of this paper is to propose a diagrammatic method for the social layer, not
to analyze a case. For that reason, we will use case data only where it serves the expo-
sition. The actual order of development was: first the left diagram of fig. 3, next the
Trikons4 left in fig. 4. The information we got from the sales representatives set us to
diagram the remaining two figures for consultation of the MT. Next time we probably
will try to follow the order suggested here.
We start with a diagram of the responsible root agent and define the process from
the perspective of the goal pursued: MT, events >- sales results, see fig. 3 right. Onto-
logically dependent agents are embedded processes that reside in the index position. A
sale is an exchange of goods and/or services in exchange for money. The company has
a Technical Department (TD) in which the tools sold are prepared for sale and adapted
to the house style. Our focus is on the Sales Representatives (SR). We indicate both
sub-processes as primordial soups with the agent tag below. Regarding each other the
processes are parallel processes. Goal and effect are determined in relation to each other
4 Trikons are a special case of Triads because they must adhere to the categorical rules of
Peircean semiotics. Space forbids going into details.
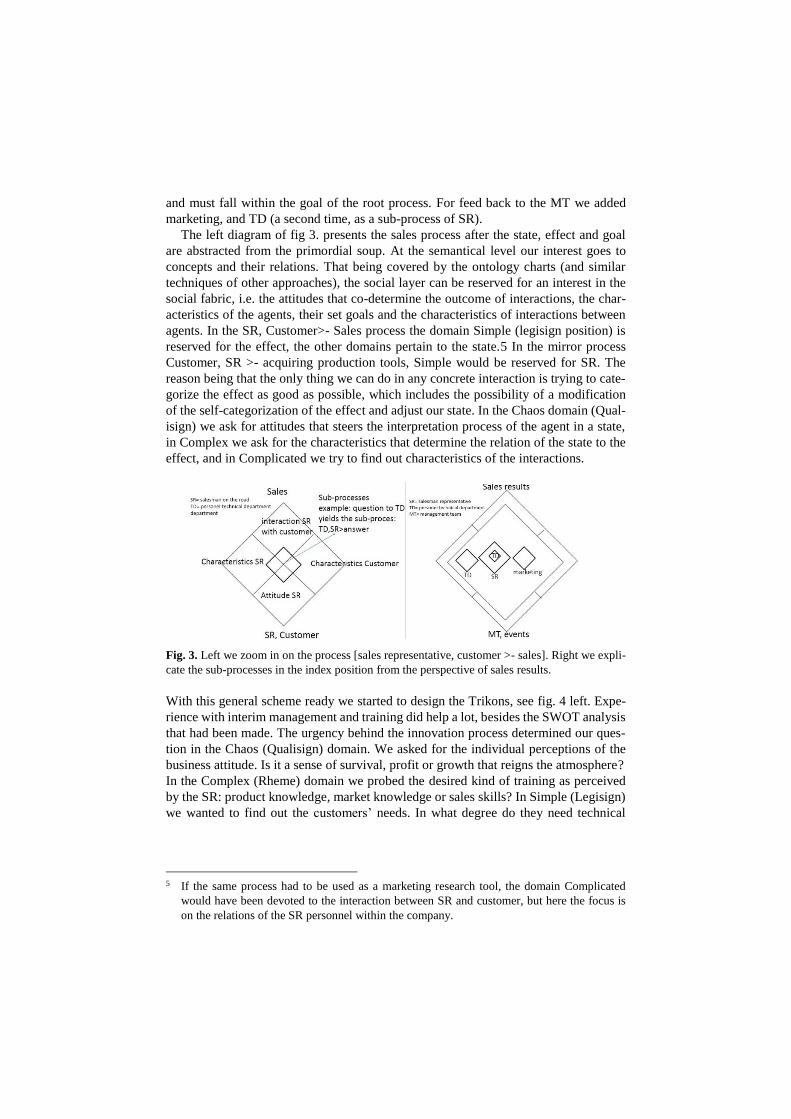
and must fall within the goal of the root process. For feed back to the MT we added
marketing, and TD (a second time, as a sub-process of SR).
The left diagram of fig 3. presents the sales process after the state, effect and goal
are abstracted from the primordial soup. At the semantical level our interest goes to
concepts and their relations. That being covered by the ontology charts (and similar
techniques of other approaches), the social layer can be reserved for an interest in the
social fabric, i.e. the attitudes that co-determine the outcome of interactions, the char-
acteristics of the agents, their set goals and the characteristics of interactions between
agents. In the SR, Customer>- Sales process the domain Simple (legisign position) is
reserved for the effect, the other domains pertain to the state.5 In the mirror process
Customer, SR >- acquiring production tools, Simple would be reserved for SR. The
reason being that the only thing we can do in any concrete interaction is trying to cate-
gorize the effect as good as possible, which includes the possibility of a modification
of the self-categorization of the effect and adjust our state. In the Chaos domain (Qual-
isign) we ask for attitudes that steers the interpretation process of the agent in a state,
in Complex we ask for the characteristics that determine the relation of the state to the
effect, and in Complicated we try to find out characteristics of the interactions.
Fig. 3. Left we zoom in on the process [sales representative, customer >- sales]. Right we expli-
cate the sub-processes in the index position from the perspective of sales results.
With this general scheme ready we started to design the Trikons, see fig. 4 left. Expe-
rience with interim management and training did help a lot, besides the SWOT analysis
that had been made. The urgency behind the innovation process determined our ques-
tion in the Chaos (Qualisign) domain. We asked for the individual perceptions of the
business attitude. Is it a sense of survival, profit or growth that reigns the atmosphere?
In the Complex (Rheme) domain we probed the desired kind of training as perceived
by the SR: product knowledge, market knowledge or sales skills? In Simple (Legisign)
we wanted to find out the customers’ needs. In what degree do they need technical
5 If the same process had to be used as a marketing research tool, the domain Complicated
would have been devoted to the interaction between SR and customer, but here the focus is
on the relations of the SR personnel within the company.

solutions, product service combinations or best price and delivery conditions? In Com-
plicated (argument) finally our interest went to the social organization of work. Do the
SR work on their own, in a hierarchical structure or networked?
Fig. 4. Left scores of sales representatives for their perceived position on the Trikons. The dots
are pointers to texts with explanations for the scores. Right the Trikons we asked the management
team members to score themselves on, without the scores.
In two days we interviewed all SR for an hour each. Van Breemen asked the SR to
score on the Trikons after that Nieuwenhuijsen had an unstructured, in debt conversa-
tion about the reasons for the scores, while Van Breemen acted as scribe. In fig. 4. only
part of the scores is given. Analyzing the results of the conversation our conclusion is
that we have a promising tool for the MT member responsible for guidance of SR per-
sonnel. Four types of issues surfaced.
First, we found strict individual issues to be handled on a personal base: one SR, for
instance, felt very insecure, but he proved to be very helpful for SR’s with technical
questions they didn’t get answered by the Technical Department out of lack of time and
started calling him for advice. Eventually he went to TD.
Second, on group level, we found issues that ask for a meeting to straighten out the
diversity of opinion as well on social as on business issues. Look for example at the
diversity of opinions at the attitude question. Such issues ought to be policy driven.
Third, the responsible manager of the SR’s, can use this method for progress inter-
views with personnel to check goals, e.g. in a next interview concerning the trainings
needs question: What did you learn? What is your current score on the Trikon? Why?
Fourth, we found structural issues. The SR’s fell apart in three groups on the question
“Who is your responsible manager?” Sometimes SR’s had to call their manager during
price negotiation. The bottom price differed, giving rise to uneasiness since part of the
wages consisted in a percentage of turn over. This instigated us to design fig. 3 right
and fig. 4 right for discussion with MT about business processes and responsibility.

5 Conclusion
In order to actually facilitate actionable insight into the human interplay among sign-
based world and digital technologies as part of processes of organizational transfor-
mation in and between organizations we have to facilitate horizontal alignment at the
social layer level and we have to facilitate vertical alignment between the social and the
semantic layer. For the social layer alignment issues, we propose our narrative sense
making approach. For the vertical alignment issues in our opinion the most promising
way to proceed is to systematically work out the connections between our approach for
the social layer and the ontology charts of the semantic layer. The pragmatic layer in
between consists in the interactions between all those involved in the transformation
process.
References
1. Hoppenbrouwers, S.: Inaugural address, 2013. https://www.han.nl/onderzoek/mensen/stijn-
hoppenbrouwers/_attachments/intreerede_hoppenbrouwers_2013.pdf. Last accessed
13/04/2018.
2. Gazendam, H., Liu, K.: The evolution of organizational semiotics; a brief review of the con-
tribution of Ronald Stamper. In: J. F. K. Liu (Ed.), Studies in organisational semiotics.
Kluwer Academic Publishers, Dordrecht, 2005.
3. Liu, S., Li, W, Liu, K.: Assessing Pragmatic Interoperability of Information Systems from a
Semiotic Perspective. In: 15th International Conference on Informatics and Semiotics in Or-
ganisation, ICISO (2014). In: Editors, Liu, K. et al. 15th International Conference on Infor-
matics and Semiotics in Organisations (ICISO), May 2014, Shanghai, China. Springer, IFIP
Advances in Information and Communication Technology, AICT-426, pp.32-41, 2014, Ser-
vice Science and Knowledge Innovation, 2014.
4. Liu, S., Li, W, Liu, K.: Assessing Pragmatic Interoperability for Process Alignment in Col-
laborative Working Environment. In: Editor, K. Liu et al.: ICISO 2015, IFIP AICT 449, pp.
60–69, 2015., pp. 1–13. Springer, Heidelberg 2016.
5. Weaver, W.: The mathematical theory of communication. In Shannon C.: Some Recent Con-
tributions to the Mathematical Theory of Communication. The University of Illinois Press,
(1949) 1998.
6. Goldkuhl, G., Ǻgerfalk,P. J.: Actability; a way to understand Information Systems Pragmat-
ics. In: Editors, Liu, K., Clarke, R.J., Andersen, P.B., Stamper, R.K.: Coordination and Com-
munication Using Signs; Studies in Organisational Semiotics, pp. 85-115. Springer 2002
7. Oppl S., Hoppenbrouwers S.: Scaffolding Stakeholder-Centric Enterprise Model Articula-
tion. In: Horkoff J., Jeusfeld M., Persson A. (eds) The Practice of Enterprise Modeling.
PoEM. Lecture Notes in Business Information Processing, vol 267. Springer, Cham, 2016
8. Bonacin, R., Baranauskas, M. C. C., & Liu, K.: From Ontology Charts to Class Diagrams:
Semantic Analysis Aiding Systems Design. pp. 389-395 In: ICEIS (3) 2004.
9. Kurtz, C.F., Snowden, D.J.: The new dynamics of strategy: Sense-making in a complex
and complicated World. IBM Systems Journal 42(3), 462–483, 2003.
10. Farkas, J.I, Sarbo J.J.: A Logical Ontology In: Working with Conceptual Structures: Contri-
butions to ICCS'2000, ed. G. Stumme, pages 138-151, Darmstadt (Germany), Shaker Ver-
lag. 2000. Author, F.: Article title. Journal 2(5), 99–110, 2016.
11. Sarbo, J., Farkas, J., Breemen, A.J.J.: van: Knowledge in Formation: A computational

theory of interpretation. Springer, 2011.
12. Breemen, A.J.J. van: Quality of Service in the Long Tail: Narratives and the Exploitation of
Soft Metadata, IFIP AICT426, 15th International Conference on Informatics and Semiotics
in Organisations (ICISO2014), eds. K. Liu, S. Gulliver, W. Li, C. Yu, pages 22-31, Shanghai
(China), 2014.