the size and cost of atlantic canada’s public sector - aims size and cost of atlantic... · the...
TRANSCRIPT

The Size and Cost of Atlantic Canada’s Public Sector
Ben Eisen Director of Research and Programmes, Atlantic Institute for Market Studies
Shaun Fantauzzo
Policy Analyst, Atlantic Institute for Market Studies
September 2014
© 2014 Atlantic Institute for Market Studies

AIMS POLICY PAPER: The Size and Cost of Atlantic Canada’s Public Sector
2
The Atlantic Institute for Mark Studies (AIMS)
AIMS is a Canadian non-profit, non-partisan think tank that provides a distinctive Atlantic
Canadian perspective on economic, political, and social issues. The Institute sets the benchmark
on public policy by drawing together the most innovative thinking available from some of the
world's foremost experts and applying that thinking to the challenges facing Canadians.
AIMS was incorporated as a non-profit corporations under Part II of the Canada Corporations
Act and was granted charitable registration by Revenue Canada as of 3 October 1994. It received
US charitable recognition under 501(c)(3), effective the same date.
287 Lacewood Drive, Second Floor, Suite 204
Halifax, Nova Scotia, Canada B3M 3Y7
Telephone: (902) 429-1143
Email: [email protected]
Website: www.AIMS.ca
Board of Directors
Chairman: John Risley
Former Chairman: John F. Irving
President and CEO: Marco Navarro-Genie
Vice-Chair: Robert Campbell (New Brunswick)
Vice-Chair: David Hooley (Prince Edward Island)
Vice-Chair: Leo Power (Newfoundland and Labrador)
Secretary: Fae Shaw
Treasurer: Elaine Sibson
Directors: Paul Antle, Laura Araneda, Lee Bragg, Stephen Emmerson, Richard Florizone,
Malcolm Fraser, Greg Grice, Mary Keith, Dennice Leahey, Scott McCain, Jonathon Norwood,
Bob Owens, Maxime St. Pierre, Jason Shannon, Peter Woodward
Advisory Council
George Bishop, Angus Bruneau, George Cooper, Purdy Crawford, Ivan Duvar, Peter Godsoe,
James Gogan, Frederick Hyndman, Bernard Imbeault, Phillip Knoll, Colin Latham, Norman
Miller, James Moir, Jr., Gerald L. Pond, Cedric E. Ritchie, Allan C. Shaw, Joseph Shannon
Board of Research Advisors
Advisors: Charles Colgan, J. Colin Dodds, Morley Gunderson, Doug May, Jim McNiven, Robert
Mundell
© 2014 Atlantic Institute for Market Studies

AIMS POLICY PAPER: The Size and Cost of Atlantic Canada’s Public Sector
3
Table of Contents
About the Authors………………………………………………………………………………....4
Introduction………………………………………………………………………………………..5
Measuring the Size of Atlantic Canada’s Public Sector…………………………………………..6
Public Sector Compensation as a Share of Labour Income……………………………………….8
The Cost of Atlantic Canada’s Public Sector……………………………………………………..9
Conclusion: Opportunities to Reduce the Public Sector Wage Bill.………………………...…...10
References………………………………………………………………………………………..13

AIMS POLICY PAPER: The Size and Cost of Atlantic Canada’s Public Sector
4
About the Authors
Ben Eisen
Ben Eisen is the Director of Research and Programmes at the Atlantic Institute for Market
Studies. Mr. Eisen has conducted extensive research on a wide range of Canadian policy issues
and published influential studies on several policy topics, including intergovernmental relations,
environmental policy, healthcare, and higher education. Invited frequently to comment on
Canadian policy developments, Mr. Eisen has provided dozens of radio and television interviews
for media outlets across the country. His policy columns have appeared in the National Post, the
Telegraph-Journal, the Winnipeg Free Press, the Montreal Gazette, the Calgary Herald, and the
Toronto Sun. Mr. Eisen holds a Bachelor of Arts from the University of Toronto, as well as a
Master of Public Policy from the University of Toronto’s School of Public Policy and
Governance.
Shaun Fantauzzo
Shaun Fantauzzo is a policy analyst at the Atlantic Institute for Market Studies. He earned a
Bachelor of Arts in Political Science from the University of Windsor and Master of Arts in
Political Science from the University of British Columbia, where he defended his thesis on the
regulatory determinants of Iceland’s financial collapse in 2008. His research focuses on public
finances and regulatory policy and his commentary has appeared in the National Post, Financial
Post, and Vancouver Sun. He is a co-author of New Brunswick’s Debt and Deficit: A Historical
Look.

AIMS POLICY PAPER: The Size and Cost of Atlantic Canada’s Public Sector
5
Introduction
Observers of economics and politics in Atlantic Canada frequently assert that the region’s public
sector is unusually large compared with the national average, and that high levels of government
employment come at a significant cost to taxpayers, while hindering economic growth.1 In this
paper, we examine Statistics Canada data to empirically assess the claim that Atlantic Canada’s
public sector is unusually large compared with other regions of the country.2
We find that public sector employment rates in the Atlantic region, relative to population, are
indeed, higher than in the rest of Canada. Furthermore, we find the gap in average compensation
between public and private sector employees, present in all provinces, is larger in Atlantic
Canada than elsewhere in the country. To measure the size of the public sector wage bill in each
province relative to its underlying private sector economy, we also calculate the share of
economy-wide labour income that public sector workers consume in the ten provinces. We find
the share of all provincial labour income public sector workers receive is substantially higher in
Atlantic Canada than in any other region of the country. Finally, we measure the cost associated
with high rates of public sector employment, and calculate how much each province in Atlantic
Canada would save if public sector employment levels were aligned with the national average.
Measuring the Size of Atlantic Canada’s Public Sector
Statistics Canada data3 clearly support the notion that public sector employment in Atlantic
Canada is higher than the national average. Nationally, in 2013, 17.8 per cent of all jobs were in
the civilian public sector. By comparison, in the Atlantic provinces, this figure is 22.6 per cent,
nearly five percentage points above the national average.
Chart 14 shows that public sector employment, as a share of total jobs, is significantly higher in
Atlantic Canada than in the rest of Canada. In fact, the largest public sector using this metric is
that of Newfoundland and Labrador, where it accounts for 27.5 per cent of all jobs in the
province; in Prince Edward Island, which has the third-largest public sector using this measure,
that figure is 23.2 per cent. Public sector employment rates in Nova Scotia and New Brunswick
also exceed the national average of 18 per cent, accounting for 21.8 and 20.4 per cent of all jobs.
1 See, for example, Frontier Centre for Public Policy (2011).
2 Specifically, the data presented in this study are from Statistics Canada, CANSIM database, tables 383-0030, 281-
0027, 051-0001, and 384-0038, and from Public Accounts data from the provinces. All data are from 2013. 3 We use data from Statistics Canada, CANSIM database, table 383-0030 in this study to report employment figures
for the “civilian public sector” and the “sub-national public sector.” In that table, Statistics Canada considers an
employee of the “Government Sector [GS00]” as someone who works in education services (administrators,
professors, teachers), health services (nurses, doctors, hospital administrators), federal government services
(elected officials and Canada Revenue Agency employees), defence services (military personnel), provincial and
territorial government services (elected officials and public administration), and local, municipal, and Aboriginal
government services (city councillors). These data do not include employees of crown corporations and we
exclude defence employees altogether from the analysis. 4 The four charts presented in this paper use manipulated data from CANSIM database, table 383-0030.

AIMS POLICY PAPER: The Size and Cost of Atlantic Canada’s Public Sector
6
To analyze the component of the public sector that is subject to direct influence by provincial
policymakers, it is necessary to remove federal employees from the analysis. The reason for this
is that the cost of employing federal employees is borne by all taxpayers in the country, whereas
the cost of employing sub-national public sector workers is a direct expense for local and
provincial governments, and the taxpayers of their jurisdictions. Sub-national public sector
employment, therefore, is a more useful measure for assessing the financial burden shouldered
by governments and taxpayers in a specific region or province because of higher levels of public
sector employment. This metric is especially important because it measures the share of sub-
national public sector employment relative to the private sector tax base that supports those
public sector jobs. A high rate of sub-national public sector employment as a percentage of all
jobs might be problematic, therefore, if the cost of supporting that public sector increases the
cost of government for the relatively narrow underlying private sector tax base, through either
higher tax rates or growing public debt.
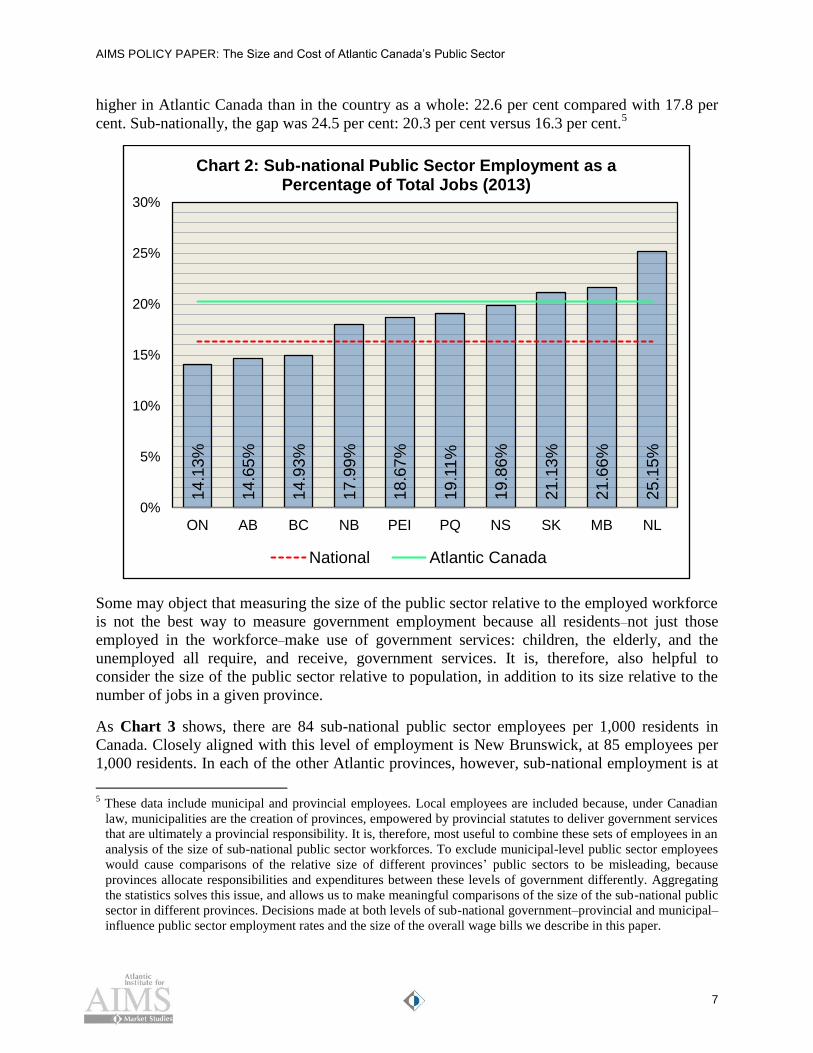
As Chart 2 shows, sub-national public sector employment as a share of all jobs in 2013 was
highest in Newfoundland and Labrador at 25.2 per cent, compared with the national average of
16.3 per cent. Nova Scotia’s sub-national public sector accounted for 19.9 per cent of all jobs in
the province. This figure was 18.7 per cent in Prince Edward Island and 18 per cent in New
Brunswick. In 2013, public sector employment as a percentage of total jobs was 27 per cent
15
.38
%
15
.90
%
16
.14
%
20
.35
%
20
.53
%
21
.83
%
22
.46
%
23
.22
%
23
.35
%
27
.52
%
0%
5%
10%
15%
20%
25%
30%
AB ON BC NB PQ NS SK PEI MB NL
Chart 1: Civilian Public Sector Employment as a Percentage of All Jobs (2013)
National Atlantic Canada
AIMS POLICY PAPER: The Size and Cost of Atlantic Canada’s Public Sector
7
higher in Atlantic Canada than in the country as a whole: 22.6 per cent compared with 17.8 per
cent. Sub-nationally, the gap was 24.5 per cent: 20.3 per cent versus 16.3 per cent.5
Some may object that measuring the size of the public sector relative to the employed workforce
is not the best way to measure government employment because all residents–not just those
employed in the workforce–make use of government services: children, the elderly, and the
unemployed all require, and receive, government services. It is, therefore, also helpful to
consider the size of the public sector relative to population, in addition to its size relative to the
number of jobs in a given province.
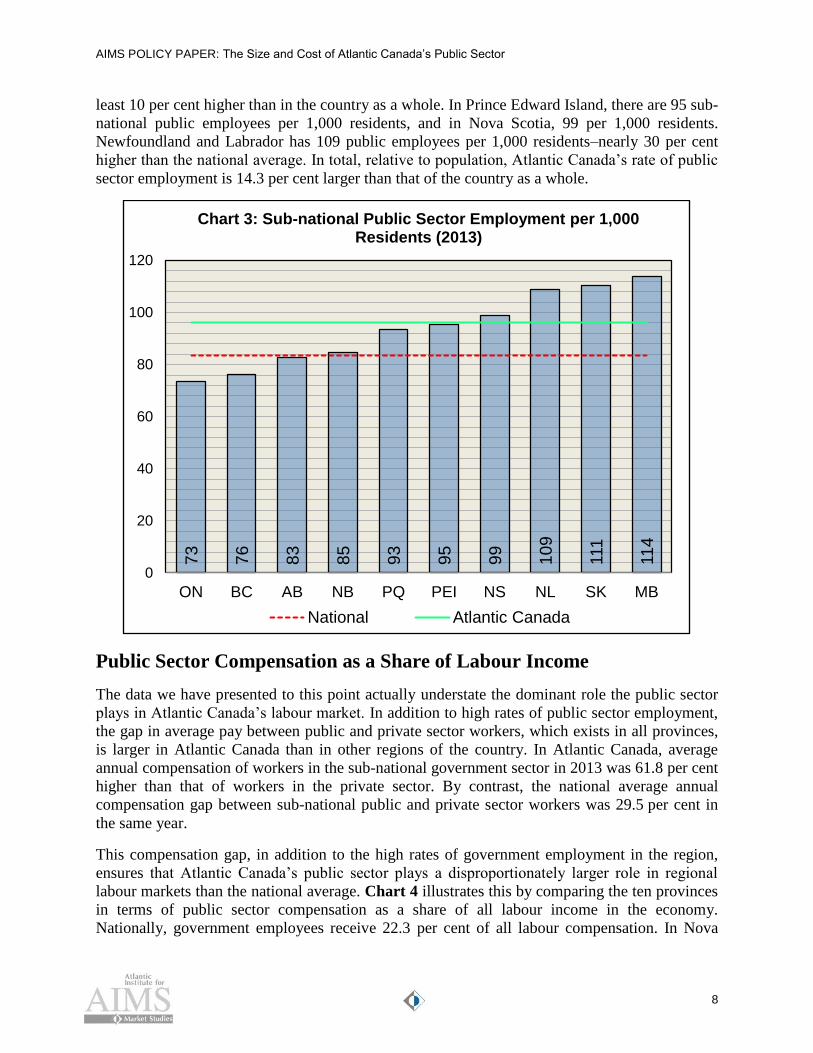
As Chart 3 shows, there are 84 sub-national public sector employees per 1,000 residents in
Canada. Closely aligned with this level of employment is New Brunswick, at 85 employees per
1,000 residents. In each of the other Atlantic provinces, however, sub-national employment is at
5 These data include municipal and provincial employees. Local employees are included because, under Canadian
law, municipalities are the creation of provinces, empowered by provincial statutes to deliver government services
that are ultimately a provincial responsibility. It is, therefore, most useful to combine these sets of employees in an
analysis of the size of sub-national public sector workforces. To exclude municipal-level public sector employees
would cause comparisons of the relative size of different provinces’ public sectors to be misleading, because
provinces allocate responsibilities and expenditures between these levels of government differently. Aggregating
the statistics solves this issue, and allows us to make meaningful comparisons of the size of the sub-national public
sector in different provinces. Decisions made at both levels of sub-national government–provincial and municipal–
influence public sector employment rates and the size of the overall wage bills we describe in this paper.
14
.13
%
14
.65
%
14
.93
%
17
.99
%
18
.67
%
19
.11%
19
.86
%
21
.13
%
21
.66
%
25
.15
%
0%
5%
10%
15%
20%
25%
30%
ON AB BC NB PEI PQ NS SK MB NL
Chart 2: Sub-national Public Sector Employment as a Percentage of Total Jobs (2013)
National Atlantic Canada
AIMS POLICY PAPER: The Size and Cost of Atlantic Canada’s Public Sector
8
least 10 per cent higher than in the country as a whole. In Prince Edward Island, there are 95 sub-
national public employees per 1,000 residents, and in Nova Scotia, 99 per 1,000 residents.
Newfoundland and Labrador has 109 public employees per 1,000 residents–nearly 30 per cent
higher than the national average. In total, relative to population, Atlantic Canada’s rate of public
sector employment is 14.3 per cent larger than that of the country as a whole.
Public Sector Compensation as a Share of Labour Income
The data we have presented to this point actually understate the dominant role the public sector
plays in Atlantic Canada’s labour market. In addition to high rates of public sector employment,
the gap in average pay between public and private sector workers, which exists in all provinces,
is larger in Atlantic Canada than in other regions of the country. In Atlantic Canada, average
annual compensation of workers in the sub-national government sector in 2013 was 61.8 per cent
higher than that of workers in the private sector. By contrast, the national average annual
compensation gap between sub-national public and private sector workers was 29.5 per cent in
the same year.
This compensation gap, in addition to the high rates of government employment in the region,
ensures that Atlantic Canada’s public sector plays a disproportionately larger role in regional
labour markets than the national average. Chart 4 illustrates this by comparing the ten provinces
in terms of public sector compensation as a share of all labour income in the economy.
Nationally, government employees receive 22.3 per cent of all labour compensation. In Nova
73
76
83
85
93
95
99
109
111
114
0
20
40
60
80
100
120
ON BC AB NB PQ PEI NS NL SK MB
Chart 3: Sub-national Public Sector Employment per 1,000 Residents (2013)
National Atlantic Canada

AIMS POLICY PAPER: The Size and Cost of Atlantic Canada’s Public Sector
9
Scotia and New Brunswick, however, public sector employees receive 30.2 and 31 per cent of
economy-wide labour compensation. Public sector compensation in Newfoundland and Labrador
accounts for 31.6 per cent of labour income in that province, and in Prince Edward Island, it
accounts for fully 40.3 per cent of all labour income. The regional average is 31.3 per cent,
nearly ten percentage points, or 40 per cent, higher than the national average.
The Cost of Atlantic Canada’s Large Public Sector
Public sector salaries are the single largest expense for provincial governments, and Atlantic
Canada’s large public sector wage bill relative to the size of the underlying economy is a
significant expense for taxpayers in the region. In this section, we analyze the cost to Atlantic
Canadian taxpayers of maintaining a larger-than-average public sector by calculating how much
each province’s public sector wage bill would decrease if its public sector employment rate were
in line with the national average.
Table 16 shows how many more sub-national public sector employees each Atlantic province
has compared with what would be the case if the public sector employment rate in that province
were in line with the national average (84 per 1,000 residents). The final column of the table
shows the extent to which the public sector wage bill in each province would decrease if the
public sector employment rate were in line with the national average. We calculated these
6 Table 1 uses CANSIM database, table 383-0030 and relevant provincial public accounts for 2012-13.
16
.50
%
21
.14
%
21
.92
%
24
.11
%
26
.50
%
29
.21
%
30
.16
%
31
.01
%
31
.57
%
40
.28
%
0%
5%
10%
15%
20%
25%
30%
35%
40%
45%
AB BC ON PQ SK MB NS NB NL PEI
Chart 4: Civilian Public Sector Compensation as a Percentage of Economy-wide Compensation (2013)
National Atlantic Canada

AIMS POLICY PAPER: The Size and Cost of Atlantic Canada’s Public Sector
10
numbers by multiplying the number of additional employees by the average salary for public
sector employees in Atlantic Canada.
Aligning sub-national public sector employment with the national average would result in
significantly fewer government employees in all four Atlantic provinces. If public sector
employment rates matched the national average in Newfoundland and Labrador, there would be
13,253 fewer public sector workers than is currently the case, which would have reduced the
province’s wage bill by $880 million in the 2012-13 fiscal year. In Nova Scotia, there would
have been 14,127 fewer public sector workers, reducing the wage bill by $836 million. The
corresponding figures for Prince Edward Island are 1,686 public sector workers and $112
million, and for New Brunswick, 834 public sector workers and $58 million.
To put these figures into perspective, the regional provincial-level budget deficit was $1.08
billion in fiscal year 2012/13, and aligning public sector employment rates with the national
average would have reduced the total sub-national government wage bill by $1.89 billion in the
2012-13 fiscal year. Of course, municipalities and various other public sector institutions would
capture some of these savings, but these statistics, nonetheless, demonstrate that maintaining a
large public sector in each Atlantic province represents a significant expenditure for taxpayers in
the region.
Table 1: Spending on Public Sector Employment in Excess of the National Average
Employees
per 1,000
Residents
Additional Employees
Above the National
Average per 1,000
Residents
Total Additional
Employees in the
Government Sector
Additional
Spending on Public
Sector Wage Bill
(in Millions)
Newfoundland
and Labrador 109 25 13,253 $880
Prince Edward
Island 95 11 1,686 $112
Nova Scotia 99 15 14,127 $836
New Brunswick 85 1 834 $58
Total 29,900 $1,886
Conclusion: Opportunities to Reduce the Public Sector Wage Bill
Each province faces a unique set of circumstances in the form of economic development
challenges, demographic restraints, and the urban-rural divide. For instance, it is sometimes
noted that, since Alberta, British Columbia, and Ontario have larger populations than all the
Atlantic provinces combined, they might benefit from economies of scale that enable them to
deliver public services at lower costs and with fewer employees. On the other hand, provincial
governments in Atlantic Canada generally face relatively slack labour markets compared with
these jurisdictions and, therefore, may have an advantage in securing qualified public sector
employees at lower wages. Nevertheless, due to multiple confounding factors, each province

AIMS POLICY PAPER: The Size and Cost of Atlantic Canada’s Public Sector
11
faces advantages and disadvantages that influence the number of public sector employees it
needs to provide services and how much it must pay them.
Despite these differences among provinces, the stubborn fact remains that the large public sector
wage bills we have documented constitute a significant expense for provincial governments and
taxpayers in the region. All four Atlantic provinces face significant fiscal challenges. Net public
debt, for instance, is approximately $15,000 per capita in Atlantic Canada–much higher than in
most other provinces. Given these fiscal challenges, all of the factors that drive government
spending in the region, including its large public sector wage bill, need to be examined and
savings achieved wherever possible.
This is especially true because provincial governments in the region must face these fiscal
challenges in the context of declining federal transfers as a share of gross domestic product
(GDP), driven partly by economic weakness in Ontario. Spending restraint in the near future will
be necessary, and provincial governments must reduce costs wherever possible. The data in this
paper, which show that regional public sector employment substantially exceeds the national
average in terms of size and cost, suggest the public sector is an area where Atlantic Canada’s
governments could achieve meaningful savings.
Achieving these savings may be difficult due to the small populations of the Atlantic provinces,
which hinder gains from economies of scale. This issue, however, is resolvable. Alberta and
British Columbia, for instance, have much smaller populations than Quebec, and significantly
smaller public sector workforces relative to population. Within Atlantic Canada itself, it is
noteworthy that New Brunswick provides public services with a significantly smaller public
sector workforce than does any of the other three Atlantic provinces. (New Brunswick does not
benefit from substantial economies of scale compared with Nova Scotia or Newfoundland and
Labrador.)
As we have seen, public sector employment rates in excess of the national average cost
governments in Atlantic Canada $1.89 billion in the 2012-13 fiscal year. Even if complications
related to economies of scale make it difficult to align public sector employment levels with the
national average, reducing the gap somewhat still would produce significant savings. If
provincial governments in Newfoundland and Labrador, Nova Scotia, and Prince Edward Island
could cut the gap in half, or even reduce it by a quarter over a ten-year period through attrition,
wage restraint, and other frugal management options, they would save hundreds of millions of
dollars, with significant positive implications for their fiscal outlook. Public sector employment
in New Brunswick, in contrast, already closely aligns with the national average and, therefore,
that province likely has less room to achieve savings in this area.7 Even there, however, the
provincial government may be able to control expenditures through the policy of wage restraint it
has followed over the past few years. Indeed, it has already implemented a public sector wage
freeze as a cost-saving strategy (New Brunswick 2012), which suggests a recognition that
gradually closing the gap in average compensation between public and private sector workers is
a promising strategy for saving money and improving the province’s fiscal position.
7 The New Brunswick government, as all provincial governments, likely could tackle inefficiencies that would result
in fewer personnel and lower costs, thus helping to address the province’s fiscal challenges. We interpret these
data narrowly to suggest that there might be somewhat less scope for these types of savings in New Brunswick
than in the other three Atlantic provinces.

AIMS POLICY PAPER: The Size and Cost of Atlantic Canada’s Public Sector
12
There are valid reasons public-sector employees earn, on average, more than do private sector
workers (see Gartner 2007). The fact that this gap is much larger in Atlantic Canada than
elsewhere, however, places a strain on the region’s private sector taxpayers and contributes to
rising regional debt. This large compensation gap is, therefore, worthy of attention from
policymakers in the region who may be able to find opportunities for savings through detailed
“apples to apples” examinations that compare compensation levels for similar jobs in the public
and private sectors. If considerable gaps exist, the government could reduce real wages for those
positions gradually to bring them in line with market levels.
A high-quality public sector workforce that delivers public services efficiently and effectively
can contribute to economic prosperity and maintaining such a workforce requires paying
competitive wages. At the same time, responsibility to taxpayers requires the diligent use of
public funds, meaning the government should keep public sector employment levels and
compensation rates within reasonable bounds. The key is to find ways to deliver high-quality
public services while ensuring that taxpayers receive the maximum value for their money.
The governments of all four Atlantic provinces face the stark reality of large debt loads and the
risk that debt-servicing costs will rise should interest rates increase. They must manage that
fiscal risk, moreover, in the context of Ontario’s economic weakness, which is resulting in
declining equalization payments as a share of regional GDP. In this paper, we have shown that
one source of pressure on provincial budgets in Atlantic Canada is the public sector wage bill.
Due to high rates of public sector employment in the region, and a compensation gap between
private and public sector employees that is wider than the Canadian average, the four Atlantic
provinces face the largest public sector wage bills relative to labour income in the country. Since
public sector wages and benefits are the single largest expenditure for these governments,
restraining the growth of the public sector wage bill is a necessary condition for maintaining
fiscal stability in the years ahead.

AIMS POLICY PAPER: The Size and Cost of Atlantic Canada’s Public Sector
13
References
Frontier Center for Public Policy. 2011. “‘It’s Unsustainable’: Special report: The public service
falls under scrutiny as government wrestles with a financial crisis.” Winnipeg, March 18.
Available online at https://www.fcpp.org/posts/its-unsustainable-special-report-the-
public-service-falls-under-scrutiny-as-government-wrestles-with-a-fiscal-crisis.
Gartner, Brett. 2007. “You Get What You Pay for: Comparing Public and Private Sector
Salaries.” Canada West Foundation Occasional Paper 2007-2. Calgary: CWF, 2007.
Available online at http://cwf.ca/pdf-docs/publications/You-get-what-you-pay-for.pdf.
New Brunswick. 2012. “Provincial government reduces deficit by half and invests in priorities.”
New release, March 27, 2012. Available online at
http://www2.gnb.ca/content/gnb/en/news/news_release.2012.03.0257.html.