the short- and long-term career effects of graduating in … · the short- and long-term career...
TRANSCRIPT
The Short- and Long-Term Career Effects of Graduating in a Recession 1
Philip Oreopoulos University of Toronto and NBER
Till von Wachter Columbia University, NBER, CEPR, and IZA
Andrew Heisz Statistics Canada
Abstract This paper analyzes the magnitude and sources of long-term earnings declines associated
with graduating from college during a recession. Using a large longitudinal university-
employer-employee data set we find that the cost of recessions for new graduates is
substantial and unequal. Unlucky graduates suffer persistent earnings declines lasting ten
years. They start to work for lower-paying employers, then partly recover through a gradual
process of mobility toward better firms. We document that more advantaged graduates
suffer less from graduating in recessions because they switch to better firms quickly, while
earnings of less advantaged graduates can be permanently affected by cyclical downgrading.
1 Contact information: Till von Wachter [email protected], Philip Oreopoulos [email protected]. This paper is a substantially revised version of National Bureau of Economics Working Paper No. 12159 and IZA Discussion Paper No. 3578, whose Supplementary Appendix contains many more results. We would like to thank Marianne Bertrand, David Card, Ken Chay, Janet Currie, Pierre-André Chiappori, Damon Clark, John DiNardo, Henry Farber, David Figlio, Thomas Lemieux, Lisa Kahn, Larry Katz, David Lee, Justin McCrary, Bentley McLeod, Paul Oyer, Daniel Parent, Mike Riordan, Eric Verhoogen, two anonymous referees and participants at the NBER Summer Institute 2005 and at seminars in UC Berkeley, Cornell University, UC Los Angeles, Stanford University, Columbia University, University of British Columbia, University of Maryland, University of Michigan, University of Florida, University of Chicago, John’s Hopkins University, the Bank of Italy, Tor’ Vergata, and the NBER Conference on Higher Education 2007 for helpful comments. We also thank Mai Chi Dao and Florian Hoffman for helpful research assistance. All remaining errors are our own.


2
1. Introduction
Increasing evidence suggests that adverse initial labor market conditions can have substantial long-
term effects on the earnings of college graduates.1 This suggests that some cohorts may earn
substantially lower returns on their investment into higher education than others.2 College graduates
from less prestigious colleges or majors, who might have received less training or might be of lower
ability, are particularly at risk from early career interruptions. Yet, the overall magnitude and
heterogeneity of these persistent losses is currently unknown, partly because of a lack of longitudinal
data on a sufficient number of cohorts and detailed information on educational background.
Similarly, little is known about the sources of persistent reductions in earnings. Yet, an
understanding of the mechanisms leading to persistent effects of initial labor market conditions is a
key step in devising policy options to assist young workers and in helping to prevent prolonged
stagnation in the earnings and careers of ‘unlucky” cohorts.
The long-term impact on workers of graduating in recessions can depend on how recessions
affect, among others: (1) the quality and availability of initial job opportunities, (2) wage adjustments
within firms, (3) knowledge about workers' productivity by potential employers, and (4) human
capital accumulation. A long literature has documented the fact that the quality of jobs tends to
decline in recessions (e.g., Reder 1955, Okun 1973, McLaughlin and Bils 2001). Finding jobs that
offer significant opportunities for promotion and training are likely more difficult under these
conditions – especially for those less skilled – and recovering from these initial shocks may depend
on mobility between firms. This would be in line with career development models such as those
presented by Topel and Ward (1992) and Gibbons, Katz, Lemieux and Parent (2005). However, 1 See, for example, Oyer (2006, 2008) for an analysis of MBA college graduates and Ph.D. economists, Kahn (2010) for an analysis of college graduates in the 1982 recession, and Genda, Kondo, and Souichi (2010) for a comparison of U.S. and Japanese college graduates. E.g., Ellwood (1982), Beaudry and DiNardo (1991), Baker, Gibbs, and Holmstrom (1994) and Devereux (2003) also find persistent effects of cyclical fluctuations for non-college workers. 2 Since the literature suggests that high-school graduates suffer shorter-lived (albeit initially larger) losses (Blanchflower and Oswald, 1994; Genda, Kondo, and Souichi, 2010), the overall return to college relative to a high-school degree is also likely to fall in recessions.

3
other models, based on human capital accumulation, job assignment or persistent wage contracts,
suggest that recovery may occur within firms, and hence that obtaining a stable job is important.
In this study, we examine a unique Canadian administrative employer-employee-matched dataset
of over 20 years of male college graduates in an effort to understand how short-term labor market
conditions affect long-term earnings within and across firms. College graduates are ideal as subjects
of the study of the effects of initial labor market shocks because at graduation the vast majority
enters the labor market and begins to search for full-time work. Another advantage of studying
college graduates is that based on information on college type, program of study and length of study
we can categorize our sample into more and less advantaged groups based on predicted labor market
success. This information is typically not available for other samples of workers or from other data
sources.
This is the first study to document persistent earnings losses for a large number of
representative cohorts of male college graduates. The resulting amount of variation allows us to
study whether persistent losses arise even from temporary adverse labor market conditions.3 Our
administrative data also allows us to provide an in-depth investigation of the mechanism underlying
the observed earnings losses. Our analysis of reallocation between firms complements studies showing
persistent effects for employment spells within firms (e.g., Beaudry and DiNardo, 1991; McDonald
and Worswick, 1999; Grant, 2003; Schmieder and von Wachter, 2010). Our analysis also provides
direct evidence concerning the role of job transitions to better firms in young workers’ careers,
complementing existing studies documenting the correlation of job mobility and earnings (e.g.,
3 Several previous studies on the persistent effects of aggregate labor market conditions have used the Panel Study of Income Dynamics (Devereux, 2003) and the National Longitudinal Studies of Youth (Gardecki and Neumark, 1998; Kahn, 2010). While providing detailed survey information on careers and worker demographics, the small samples of these data sets do not allow controlling for cohort, state and year effects in a flexible way, controlling for persistent correlated labor market conditions or studying other career outcomes than wages with a sufficient degree of precision. Often by necessity, the range of cohorts studied is limited.

4
Topel and Ward, 1992). Finally, this is the first study to analyze the differential effect of graduating
in a recession for more and less advantaged college graduates.
Our findings paint an intricate picture of the effect of initial labor market conditions for college
graduates in which very short-lived adverse labor market conditions have long-term effects that vary
dramatically across the skill distribution. A typical recession – a rise in unemployment rates by five
percentage points in our context – implies an initial loss in earnings of about 9 percent that halves
within five years and finally fades to zero by ten years. For this time period, these reductions add up
to a loss of about 5 percent of cumulated earnings.
This result is robust across specifications and arises mainly from the first unemployment rate
individuals face after graduating – net of correlation with labor market shocks occurring later in
workers’ careers – and it does not seem to be due to selective employment and graduation decisions.
The persistent effects from changes in labor market conditions are much larger for individuals in the
first year of their careers than for individuals with just a few years of experience. We also find that
graduates with the lowest predicted earnings based on college and major (our measure of skill) suffer
larger and much more persistent earnings losses than those at the top. The least advantaged
graduates suffer a loss of 8 percent of cumulated earnings in their first ten years – almost double
those of the median graduate and more than four times as much as those of the top graduate.
Initial firm placement plays a significant role in determining long-term labor market success.
Along with lower earnings, negative labor market shocks at labor market entry lead to more workers
taking jobs at poorer quality firms (with firm quality measured in terms of firm size and average
earnings among employees). The ensuing earnings adjustment process is characterized initially by
increased mobility across employers and industries and improvements in the characteristics of the
average employer. Decomposing earnings losses into their sources, we find that lasting reductions
in the quality of employers can explain up to 40 to 50 percent of persistent earnings losses. For

5
college graduates, both mobility toward better firms and recovery within firms are important
margins of adjustment to adverse labor market conditions. These patterns also varied by worker
type: Graduates at the top of the wage distribution catch up, on average, within two to four years,
mostly by moving to better firms. Average graduates recover within ten years, partly by switching
jobs and partly within firms. Workers with low predicted earnings are permanently down-ranked to
firms paying lower wages and consequently experience lasting reductions in earnings after a bad
start.
Our findings imply that recessions lead to high and unequal losses in cumulated earnings for
unlucky college graduates. These losses imply substantial reductions in the financial returns on the
investment into higher education, particularly for graduates from schools and majors in which
graduates tend to be paid less. Our results also highlight the important role of employer quality –
and hence initial job placement and ensuing job mobility – for the careers of young college
graduates. We are the first to document that this leads to persistent cyclical downgrading for college
graduates and that less advantaged college graduates permanently lose access to better employers.
Our results also have important implications for recent strands of literature in macroeconomics. We
provide direct evidence for whether wages of labor market entrants respond more to aggregate
fluctuations than do wages of already employed workers, even accounting for changes in employer
quality. Our findings also offer direct evidence in favor of gradual sorting processes emphasized by
models of reallocation between sectors (e.g., Krause and Lubik, 2006; Moscarini and Vella, 2008).
Yet, our results also imply that even temporary shocks can lead to persistent changes in the
allocation of workers. Finally, our study provides direct estimates of the unequal and large costs of
recessions for new college graduates – costs that are larger than typical existing model-based
estimates (e.g., Barlevy, 2005).

6
2. Alternative Explanations for Persistence of Initial Labor Market Conditions
Our analysis of persistence of initial labor market conditions for college graduates was informed by
existing theories of career development. Since these models are not typically used to explain
persistence, we will briefly discuss their implications and outline alternative hypotheses. While
several models have the capacity to predict differential long-term effects of only temporary labor
market conditions by skill group, fewer models are able to rationalize very persistent declines in
earnings from only short-term adverse labor market conditions.
A first category of models suggests that job search is an integral part of young workers’ careers
(e.g., Topel and Ward, 1992; Manning, 2006). Search theory predicts that even a temporary
worsening of the wage offer distribution leads workers entering the labor market in a recession to
catch up by undertaking a lengthy search process for higher-paying jobs. An increasing empirical
literature suggests that the cost of job searches increases with age (for example, as a result of family
mobility constraints) and that higher-skilled young workers are more likely to move between regions
or industries in response to adverse labor market shocks.4 Thus, lower-skilled workers may search
less intensely (or receive fewer new job opportunities) after obtaining lower-quality jobs in
recessions. If they accumulate some employer-specific skill on the job, they may also have a harder
time moving, the longer they stay with their initial employer.5
An alternative, yet not mutually exclusive, class of models explains job mobility in early careers
by a process of assortative matching as employers gradually learn about worker quality (e.g.,
Gibbons, Katz, Lemieux, and Parent, 2005). The same class of models has been extended to
differential speed of learning by skill (e.g., Lange, 2007). In the present context, temporary labor
4 Among others, see Blau and Robins (1990), Bloemen (2005), Wozniak (2006) and Neal (1999). Mortensen (1986), Pissarides (2000) and Shimer (2004) discuss the theoretical implications of differential search intensities. 5 In addition to differences in workers’ search behaviors, in the presence of rents or complementarities, firms have incentives to select the most able workers for employment and to reduce the employment of less able workers. A cyclical process of adjustment in hiring and promotion standards has often been noted (e.g., Reder, 1955). Rents can arise due to rigid pay scales, as in Hall (1974), or unions, as in McDonald and Solow (1985).
7
market conditions could lead to lasting declines in earnings if employers learn only gradually about
the quality of a graduating cohort after an initial down ranking to lower-paying jobs. Faster learning
about higher-skilled workers could explain differential speeds of recovery.
Evidence suggests that high-wage jobs are concentrated in particular firms and sectors and that
the supply of high-wage jobs appears to be pro-cyclical.6 Both job search and employer learning
explain how a protracted recovery process could follow after graduates are initially downgraded to
worse employers. These models can also rationalize different rates of recovery by skill background.
Yet, neither model is geared to explain how recovery occurs on the job or how permanent effects of
temporary labor market conditions can arise.
Another class of models links career progression to human capital accumulation at either the
firm or the industry level. Since students graduating in a recession experience a prolonged period of
job and industry mobility, they will have spent less time, on average, accumulating firm- or industry-
specific skills. Thus, if there is a concave profile of learning, human capital accumulation can explain
recovery within firms as unlucky graduates catch up with luckier peers. An extension of these
models, based on the assumption that recessions are associated with a lower supply of jobs leading
to a career track or of jobs offering opportunities for skill accumulation, can also explain permanent
effects resulting from temporary labor market conditions (Gibbons and Waldman, 2006).7 A similar
observable pattern can be generated by models of long-term wage contracting with renegotiation.
Initial labor market conditions set the starting value of the wage, and recovery occurs as the wage is
6 Firms and industries pay wage premiums that cannot easily be rationalized by worker characteristics (e.g., Krueger and Summers, 1988; Abowd, Creecy, and Kramarz, 2002). It is also well known that sectors paying higher wages have more pro-cyclical job creation, partly because of more volatile demand for their products (Okun 1973; McLaughlin and Bils, 2001; Aaronson and Christopher, 2004). There appears to be cyclical downgrading of young and lower-skilled workers (e.g., Reynolds 1951; Reder 1955; Cutler and Katz 1991; and Hines, Hoynes, and Krueger, 2002). Less able workers tend to flow to larger firms and high wage sectors in booms (e.g., Vroman 1977; Albaek and Sorensen 1998; Devereux 2002). 7 The more traditional explanation of wage-growth with experience – human capital accumulation on-the-job – is unlikely to explain persistent losses from just temporary labor market conditions without a reduction in time worked.

8
renegotiated based on better outside labor market conditions.8 Persistence arises if renegotiation is
not perfect; permanent effects could occur in the absence of renegotiation.
The list of models given here is not meant to be exhaustive but has been presented
to demonstrate the potential and difficulties in explaining persistent effects of initial labor market
conditions. To give an example of a model that captures one set of minimum features needed to
yield differential predictions for the persistent effects of temporary labor market conditions by skill
group, we developed a search model with high- and low-ability workers (see Oreopoulos, von
Wachter, and Heisz 2008). In this model, those of high ability receive better or more frequent job
offers, and mobility costs depend on age or job tenure.9 After a one-period decline in the wage offer
distribution (perhaps from an economic downturn), high-skilled workers recover more quickly by
moving between jobs. The smaller search intensity of low-skilled workers implies slower mobility to
high-wage firms and a more important role of accumulation of firm-specific capital. Because search
costs increase with age, some lower-skilled workers stop searching before they have found a higher-
paying job. An important insight of the model is that initial conditions lead to permanent earnings
differences only if coupled with search frictions that intensify with age. Without a distinction
between “newly minted” workers and workers who appear to have settled, nothing would prevent
unlucky workers to keep seeking better jobs and thereby eventually recover from beginning to work
in a depressed labor market.
To assess the magnitudes of alternative channels, we simulated the model for standard
parameter values (Sensitivity Appendix VI of our longer working paper). The results suggested that a
standard job search model could explain persistence for high-skilled workers who recover quickly
8E.g., Harris and Holmstrom (1982), MacLeod and Malcomson (1993), Prendergast (1999), Gibbons and Waldman, (2006). For empirical papers on within-firm wage mobility, see Beaudry and DiNardo (1991), Baker, Gibbs, and Holmstrom (1994), and Schmieder and von Wachter (2010). 9 To obtain a sense of the age-profile of mobility costs in our sample, we used the information from the Canadian Census to show that the rate of marriage and homeownership rises rapidly after college graduation as workers age.
9
from initial labor market conditions. Yet, for reasonable job offer arrival rates, search frictions alone
cannot explain the higher degree of persistence of earnings losses for the average college graduate.
Age- or tenure-related mobility costs are needed to explain slower recovery of firm quality for these
workers. For the least advantaged workers, job mobility is slow enough that age-related costs
become sufficiently large before the initial shock has dissipated, leading to a lasting effect on firm
quality and earnings.
The simulation yielded two additional useful results that helped us better understand the model’s
predictions. First, the larger the initial shock, the more likely it is that the age-related slowdown in
search will occur before the initial effect has dissipated, especially for lower-skilled college graduates.
Thus, larger recessions exhibit more lasting increases in inequality and mismatch, something borne
out in our empirical analysis. Second, the persistence due to age-related costs increases with the
dispersion of firm quality (i.e., a dispersion in firms’ average wages). Thus, the higher the pre-
existing inequality in earnings in the labor market, the bigger the persistent rise in inequality due to
initial shocks predicted by the model.
3. Empirical Strategy and Matched Data
Our main empirical strategy for estimating the long-term effects of initial labor market conditions
was to exploit variation in unemployment rates at graduation at the national and provincial levels in
Canada over 20 years. We began by estimating the effect on earnings of the unemployment rate at
graduation, and in the process, we verified the appropriateness of our empirical specification. We
then replicated our analysis by subgroups and for a range of alternative outcomes.
Since our main independent variable – the rate of unemployment – varied across provinces and
across cohorts, we collapsed the individual level data at the level of graduation cohort (c), initial
region of residence (r) and calendar year (t) and worked only with the cell means crty of the log of

10
annual earnings and other variables (weighted by the corresponding cell sizes). The cell level model
on which most of the estimates in this analysis were based is
certcrecrt uURy 0
(1)
Where r , c , e and t represent unrestricted fixed effects for first region of residence, year of
graduation, year of potential labor market experience (e) and calendar year. The unemployment rate
is measured at the time of graduation and the region of first residence ( 0crUR ). The main coefficients
of interest e on the initial unemployment rates were allowed to vary with potential experience.
Given the presence of experience effects, region effects and cohort effects, the coefficients measure
changes in experience profiles in earnings and other outcomes resulting from province-cohort-specific
variation in unemployment rates.10 To account for group-specific error components, we clustered
standard errors at the cohort-region level. In the figures, we show separate coefficients for the first
ten years of potential experience. For ease of exposition, in our tables, we combined the experience
years into three group-level dummies and interacted them with the initial unemployment rate.
We interpret the variation in 0crUR to arise from changes in aggregate labor demand that are
uncorrelated with characteristics of different graduation cohorts. To help verify that we picked up
effects driven by demand conditions and not influences from cohort-specific changes in the labor
supply of young workers, we also used the provincial unemployment rate for all workers as a
measure of initial labor market shock. Differences between graduation cohorts at the national level
were taken out by cohort-fixed effects. Below and in the Supplementary Appendix in our longer
working paper version Oreopoulos, von Wachter, and Heisz (2008) (hereafter referred to as the
10 As is well known, cohort effects, potential experience effects and year effects cannot be identified separately without an additional restriction on cohort effects. Since we are mainly interested in experience effects and in how they change over the business cycle, we simply drop one additional cohort effect from the regression. We could have chosen to restrict cohort effects to sum to zero (as suggested by Deaton, 1997). This alternative does not alter our estimates of the experience profile.

11
“Supplementary Appendix” or “SA”), we address other potential biases. We conducted multiple
specification and robustness checks to show that our results were unaffected by selective changes in
the timing of college graduation, by selective labor force participation, by our functional form or by
our measure of labor market conditions.
Dynamic Effects. Since the current state of regional labor markets continues to influence
earnings of more experienced workers as well (see, for example, Blanchflower and Oswald, 1994),
our basic estimate of the effect of the first unemployment rate exposure yielded the long-term effect
of the first unemployment rate plus the weighted sum of the effect of unemployment rates a worker
faced during his career. This is a parameter of interest that captures the average change in earnings
from graduating in a recession, given the regular evolution of the regional unemployment rate faced afterwards.11
We were also interested in isolating the effect of labor market conditions at entry net of subsequent
effects on earnings from exposure to a possibly prolonged recession. The isolation of these effects
helped distinguish the impact of labor market conditions at entry (at the time when all cohorts
search for work) from the impact of labor market conditions when working or entering a new firm
in mid-career (as stressed, for example, by Beaudry and DiNardo, 1991). This approach also allowed
us to assess whether the persistent effects of aggregate unemployment rates at time of entry differed
from those experienced by more mature workers.
11 Denote the effect on earnings in experience year e from the unemployment rate in the labor market during experience year d (where e ≥ d) by de, . Then with the notation of Equation 2 we get that coefficient
estimates from Equation 1 of the effect of the initial unemployment rates in experience year e can be written as
e
d cr
dcrcr
deee UR
URURp d
1 0
0
,0,0, )var(
),cov(ˆlim ;
This is the sum of the direct effect of the initial unemployment rate in experience year e ( 0,e ), plus the sum of the
persistent effects of all other unemployment rate conditions in experience year e the worker faced since graduation (
de, ), to the extent they are correlated with the initial unemployment rate
12
In Section 4, we explore this issue by examining whether the effect of the early unemployment
rate would remain stable even when we included the cohort’s current unemployment rate or when
we controlled for current region-year fixed effects. To do so, we worked with a version of the data
that was collapsed at the level of graduation cohort, initial region of residence and calendar year, as
well as region of current residence. We then allowed for persistent effects of the provincial
unemployment rate a worker was exposed to at each experience year (e) in the relevant region ( er ),
denoted by ecreUR . Due to strong correlation in aggregate unemployment rates across years, an
unrestricted model allowing for effects from unemployment conditions each year since graduation
generated imprecise estimates. Our preferred specification thus used a more restricted model in
which we grouped the effects of unemployment over two consecutive experience years. Defining
the effect on earnings in experience year e from the unemployment rate at experience year 0-1 (2-3,
4-5, 6-7, …) by 01,e ...),,,( 67,45,23, eee , and dropping the region subscripts on the
unemployment rates for simplicity, the dynamic model whose results were reported in the paper can
be written succinctly as
crteeeecrtcrt uURURURw ....log 4545,2323,0101, (2)
where 2/)( 10011crcr URURUR , 2/)( 3223
32 crcr URURUR , etc., and we imposed the
restriction edde 0, . The regression estimated the persistent effect of the transitory
component of each aggregate unemployment condition in a given pair of experience years, net of its
correlation with other unemployment rates affecting the worker in adjacent experience years. For
more detail, see Appendix III in SA in Oreopoulos, von Wachter, and Heisz (2008).
Canadian Administrative Data. Our results are based on a unique match between three large
administrative data sets collected and compiled within Statistics Canada (this match is described in
detail in the Supplementary Appendix). The data combined administrative information on about 70

13
percent of Canadian university students and graduates from 1976 to 1995 with longitudinal
individual income tax records and firms’ payroll information covering the years 1982 to 1999.12 The
data contains exceptional information about individual students’ courses of study (such as type of
degree, major and date of graduation), as well as detailed career information (e.g., annual earnings,
province of residence and receipt of unemployment benefits) and information about employers. To
analyze the role of employer characteristics, we exploited the panel nature of our firm data and
calculated average firm size, average median wage and total payroll at the firm level, with year fixed
effects taken out. All firm characteristics in our empirical analysis referred to permanent attributes so
that these characteristics remained unchanged across the worker panel (i.e., an individual’s firm
characteristics could change only if he moved to a different employer).13
To generate a uniform sample with a common definition of labor market entry, we focused on
the effect of recessions at the end of the first exit from college and excluded workers obtaining
higher degrees from our sample.14 As shown in Table A1 in the Supplementary Appendix (SA), even
within this relatively homogeneous sample, there was a high dropout rate and high variance in
college duration. To focus on students whose labor market conditions at graduation were difficult to
predict at the time of entering college and to reduce possible measurement error, our main sample
excluded early college dropouts and concentrated on a more homogenous group of workers with
better-measured graduation dates. To do so, we calculated the difference between actual and
12 The term “college” is something of a misnomer in Canada because it is usually used to refer to one- or two-year, community-level, postsecondary institutions, rather than degree-granting universities. However, in keeping with the terminology used most often, we will refer to Canadian universities as colleges. 13 We thereby conform to the vast majority of the literature, which focuses on permanent firm characteristics. We experimented with alternative measures of firm characteristics, such as firm growth rates, and found other differences to change little over the cycle. The information is at the firm level; for simplicity, we use the terms “firm,” “company,” and “employer” interchangeably. 14 Since we found that early recessions do not affect the probability of obtaining a graduate degree, this exclusion did not affect our results. Similarly, the probability of being in the graduate sample as defined below is not affected by graduating in a recession. We have experimented with other definitions of the relevant date of labor market entry (such as last degree or last degree of continuous education) and have seen little effect on the results. In the sensitivity analysis, we also show results using a sample that includes workers obtaining a postgraduate degree.

14
predicted graduation year (based on length of program in first or second year) and kept only workers
with non-negative differences (we refer to this as the graduate sample). The right columns of SA
Table A1 show characteristics for that sample. Within the sample of workers on or above grade, 89
percent graduated, and average duration of college was about four years.
To assign unemployment rates at the time of graduation, we had to choose a relevant province
of residence (which would also constitute the relevant labor market). After careful analysis, we
settled on the province of first residence as the relevant labor market for young college graduates.
We imposed some additional basic sample restrictions and limited the degree of missing
observations on earnings. In particular, in order to remove individuals who stopped being recorded
annually, we dropped workers who permanently stopped filing taxes because they left the country,
obtained a new personal identification number or entered the underground economy or because
their file was simply miscoded along the way. None of these choices or restrictions affected our
results.
SA Figure A1 shows that the general experience profiles in annual earnings and job mobility for
our baseline Canadian data were similar to those for the United States. In addition, we documented a
strong experience gradient in average size and average wages paid by employers: from years one to
ten, average firm size and average firm wage increased by 34 percent and 24 percent, respectively.
The longer male Canadian graduates progress through the labor market, the more they tend to move
to firms that, on average, pay more and are larger.15 Our main analysis measures deviation from
these average experience profiles due to unemployment conditions at college graduation.
15 The first years of the careers of young male Canadian college graduates are characterized by steep wage growth (also documented for the U.S. by Murphy and Welch, 1990), frequent job changes (Topel and Ward 1992), initially unstable labor force attachment (Gardecki and Neumark, 1998; Ryan, 2001), some interregional mobility (Wozniak, 2006) and frequent industry changes (McCall, 1990; Neal, 1995; Parent, 2000). SA Figure A1 (Panel C) and SA Table A5 suggest that average firm size tends to grow with labor market experience for college graduates in the United States, too.
15
Canada experienced two major recessions in the early 1980s and 1990s, which increased young
workers’ unemployment rates for certain years by more than seven percentage points. We used this
variation for our national specification. The evolution of the unemployment rate at the provincial
level displayed a high degree of regional heterogeneity. During this period, an increase of
unemployment rates of five percentage points (or about two standard deviations) described a typical
recession.16
4. The Persistent Effect of Initial Labor Market Conditions on Earnings
The evolution of annual earnings in our baseline sample displayed clear differences in initial level
and ensuing growth of earnings by year of college graduation. This is shown in Figure 1A, which
plots mean earnings by experience and year of graduation at the national level, together with the
individual’s entry wage at experience one (their first full year of work) and the average wage for
“mature” workers (workers with five to ten years of experience). One can clearly see differences in
starting wages across graduation cohorts leading to differences in average cohort earnings. The
figure also shows a clear pattern of convergence. Initial differences in starting conditions appear to
fade over time. Cohort effects appear to have a time-varying component, or, as noted by Beaudry
and Green (2000), experience profiles vary across cohorts.
There is a strong correlation between starting wages and initial unemployment rate conditions,
which persists into higher experience years and slowly fades over time. This is shown in Figure 1B,
which graphs national unemployment rates for young workers and wages at different years of
experience by graduation cohort (both expressed as deviations from their means across cohorts).
16 If we regress regional unemployment rates on year and region fixed effects, the R2 is 0.9, which is a common finding in the U.S. and other countries. The remaining variation in regional unemployment rates allows us to obtain precise estimates of the effect of province recession shocks and to include further interaction terms, such as region-specific year effects. We should stress that our results are robust when excluding large Canadian provinces such as Ontario or Quebec.
16
The correlations in the figure strongly suggest that part of the initial but fading earnings differences
in Figure 1A are driven by variation in initial labor market conditions.
Table 1 presents analogous results to this figure and other figures in this article, along with
standard errors. Similar to the case of Figure 1B, Columns 1 and 2 in Panel A display estimated
effects of the unemployment rate at time of graduation on annual earnings for different years of
experience in the workforce using national unemployment variation. These estimates control for the
year in which earnings are observed, average experience effects across cohorts, and linear or
quadratic cohort trends. Standard errors are clustered at the level of graduation cohort to allow for
group-level error terms. The results suggest a strong initial effect that persists but fades after about
five years in the labor market.
4.1 Main Regional Models
Our main results are drawn from regional models that include cohort effects as well as effects for
province of first residence as described in Section 3. The shifts in experience profiles due to an
initial provincial unemployment shock are shown in Figure 2 (Panel A) for our baseline graduate
sample. The initial effects are similar in size to those from the national model, but starting at
experience year four, the regional estimates indicate more persistence. Estimates with standard
errors are shown in Column 3 of Panel A in Table 1.17 The coefficients demonstrate that the effect
on a high unemployment rate at graduation converges to zero only after ten experience years.
Although our main results are based on a sample of graduates, as shown in Figure 2 there is little
difference in the point estimates if we use all workers with some college. It does not appear that
those with a college degree fare better than the full sample.
17 The coefficient estimates of all figures are contained in the Supplementary Appendix. The main regression specification is given in Equation 1.

17
The similarity between the national and regional results suggests we can exclude a strong
correlation of initial unemployment rates at the national level with changing unobserved cohort
characteristics. Below, we show that higher persistence in our regional results is not driven by more
persistent local unemployment shocks. Instead, national estimates may be more affected by
measurement error problems due to aggregating across local labor market shocks. Interregional
mobility is less common in Canada than in the U.S. Thus, the relevant labor market shock is at the
regional level, an effect only partially absorbed by the national unemployment rate. Low regional
mobility may also explain why results from the national model are not larger than those from the
regional model.
Using the results from our main regional model, with an increase in unemployment of five
percentage points – roughly a shift from boom to recession in our sample – annual wages are about
9 percent lower in the first year after college, still 4 percent lower after five years out and about 2
percent lower nine years out. Overall, we view the regional and national results as telling a
consistent story: Graduating during a recession leads to significantly lower earnings at the beginning
of an individual’s career, but the gap converges to zero within ten years after graduation. The effects
of concurrent unemployment rates we find are consistent with estimates from the literature on the
“wage curve” in the U.S. and Canada (Blanchflower and Oswald, 1994). They are also consistent
with estimates by Bloom and Freeman (1989), who find that initial effects due to differences in
cohort sizes fade after ten years. Similarly, Devereux (2003) finds among a sample of workers from
all ages that half of a wage shock, instrumented by local unemployment conditions, is still present
after about five years. Kahn (2010) finds somewhat more persistent losses in earnings than ours for
college graduates in the United States, perhaps due to her focus on graduates entering the strong
recession of the early 1980s.
18
Dynamic Effects. The large number of cohorts at our disposition allows us to take the existing
literature a step further by distinguishing the long-term effect of the very first unemployment rate,
when the majority of graduates are beginning their search for a full-time job, from the role of
persistent conditions in the labor market affecting them in later years. As discussed in Section 3, due
to the presence of continuing exposure to adverse labor market conditions, the estimates in Figure 2
(Panel A) represent a summary of the earnings losses the average worker can expect due to entry in a
depressed labor market. To isolate the extent to which our baseline results occur primarily from the
very first labor market conditions, we include in our main model controls for the confounding
effects of later regional unemployment rates correlated with initial labor market conditions (as
explained in Equation 2).
We find that the majority of the effect is due to unemployment “shocks” in the year of labor
market entry. We began by adding an interaction between dummies for potential labor market
experience and the concurrent regional unemployment rate prevalent in the relevant year and
current province of residence, and after adding fixed effects for current province of residence. As
predicted, the long-term effect of the initial unemployment rate partly arises due to the correlation
with ongoing persistent labor market conditions, but the difference is small (not shown). As shown
in Figure 3, the basic results are also not affected if in addition we also allow for persistent effects of
concurrent labor market conditions at higher experience years, too, as discussed in Section 3.18 As
benchmark, the figure replicates estimates for e corresponding to our main model (“baseline”), as
well as estimates of the effect of the average unemployment rates at experience years 0 and 1
without any history controls (labeled “Group 01 (No History)”). We then show results from
estimating Equation 2 ( 01,e and 23,e , labeled “full history”). These results suggest that part of the
18 Note that since we observe full history of province of residence only for cohorts graduating 1982 and onward, our estimates in Figure 3 and in other relevant specifications use only these cohorts.

19
effect of initial unemployment rates is due to the correlation of initial and continuing regional labor
market conditions. This is consistent with findings of Beaudry and DiNardo (1991), McDonald and
Worswick (1999), Grant (2003) and Schmieder and von Wachter (2010) who found that labor
market conditions have persistent effects on earnings even for more experienced workers on the
job. However, our results also clearly imply that an important part of the effect of initial
unemployment rates is driven by the very first “shock” young workers encounter in the labor market
at graduation.
Results from the dynamic model also imply that regional unemployment rates have much
stronger effects on labor market entrants than on workers with a few years of labor market
experience. To put the magnitude of the effect of initial labor market conditions into perspective,
Figure 3 shows the dynamic effect of a shock occurring at experience years two to three from the
grouped model with full history controls ( 23,e in the notation of Equation 2) To make the dynamic
pattern comparable with that of the first group, the figure shows coefficients relative to the time of
the shock (i.e., experience zero now relates to the moment of the shock). The effect of a shock
experienced at experience years two to three is much smaller than the effect of a shock at entry (0 to
1) for all experience years. Our period is too short to observe complete reversion, but the point
estimates are insignificant after years 5 to 7. Inspection of the data leads us to believe that the
dynamic effects for shocks at later experience years are small. The result highlights the greater
importance economic conditions have at the beginning of one's labor market career relative to their
effect after an individual has begun his career.19
Sensitivity Analysis. Our overall results hold up well against a variety of sensitivity checks.
Since most of our measures indicate insignificant effects of unemployment rates on college duration,
19 The limited role of regional mobility we find below suggests that the correlation of future unemployment rates with unobserved worker characteristics may not be a major concern. Any remaining amount of selection implies we would tend to overstate the impact of labor market conditions at higher experience years.

20
selective timing of graduation does not appear to be an important phenomenon in our data (see
Table 1, Panel A, Column 4 and the Supplementary Appendix in Oreopoulos, von Wachter and
Heisz (2008)). Not surprisingly, when we use the unemployment rate in the predicted year of
graduation (based on starting year of college and typical degree duration) as an instrument, our
estimates confirm the main ordinary least squares results. Although all our results carry over with the
instrumental variable estimate, in what follows, we report the more efficient ordinary least squares
estimates.
The remaining columns of Table 1 (Panel A) show two further sensitivity checks. First, Column
5 shows that there are only small (and insignificant) differences in the effects when we only include
workers always present with positive earnings. This implies that our findings are not due to selective
labor force participation. Columns 6 to 8 show that although there are some expected differences in
the effects of initial labor market conditions across cohorts (e.g., graduates entering in the strong
recession of the early 1980s suffered slightly larger and more persistent effects), our results are quite
similar for different groups of labor market entrants.
We have also tried various other sample and specification choices, none of which substantially
affected our results. For instance, including college students who entered the labor market after a
graduate degree had no effect on our results (see SA Figure C3, Panel B), suggesting that workers in
our sample do not selectively choose to enter advanced degree programs due to unemployment. We
also tried various ways of excluding workers with repeatedly missing wages and found little effect on
our results (see SA Figure C3, Panel A). We also re-estimated all of our results using the province of
college as the region for the relevant initial shock, but in this case, too, our basic findings were
unchanged (see SA Figure C1, Panel C).
It is possible that regional results show more persistent effects of initial labor market conditions
on wages partly because workers are “stuck” in persistently slack regional labor markets. To address

21
this possibility, we also included current-province-by-current-year fixed effects (shown in SA Figure
C1, Panel D), but this showed barely any differences from the main results. This observation is also
an indicator that mobility toward provinces with higher wages is not a strong source of catch-up in
our sample, a question to which we return below. We also examined whether using the average
unemployment rate over several years after entry would yield different results – and found that it
does not appear that the effects captured in the main models are driven by periods of extended
unemployment (see SA Figure C1, Panel B). Our results are also robust to many additional
sensitivity checks contained in the Supplementary Appendix.
Effects on Employment. If unemployment rates affect participation, part of the recovery
process in earnings that we found may be due to sample selection. Similarly, losses in employment
could depress wages by reducing accumulation of labor market experience. Figure 2, Panel D,
replicates the results shown in Panel A, using as outcome variables the fraction of workers claiming
unemployment insurance benefits (called “employment insurance” in Canada), the fraction of
workers filing taxes with zero earnings and the fraction of workers not filing taxes in a given year.
Estimates with standard errors for the fraction with zero earnings are shown in Column 1 of Table
2. The table and figure show an initially significant increase in fraction zero earnings and the fraction
of unemployment insurance claimants that fades within three experience years. The effects are
numerically small and become smaller and insignificant when we control for persistence of local
unemployment rates as in Equation 2. In other words, a temporary unemployment rate shock has no
persistent effects on employment or participation of male college graduates.
Since our sample does not contain information on time worked, we also replicated our results
with the Canadian Census and found similar effects of early unemployment rates on annual earnings
(see Supplementary Appendix V). Decomposing this effect into the effects of early unemployment
rates on weeks worked and on weekly wages, we find that the effect on weeks worked is short lived.

22
The majority of the persistent effects are driven by a reduction in weekly earnings. Overall, the loss
in experience due to labor market entry in recessions is not very large for the average college
student.20 Thus, neither reduction in the accumulation of experience nor selective entry or exit from
the earnings sample of workers of different abilities affects the main pattern of reversion.
Effects on Regional Mobility. To explore whether entering the job market in recessions is
associated with higher mobility across provinces, we also analyzed the effects of the unemployment
rate at college exit on subsequent provincial mobility. As shown in the Supplementary Appendix (SA
Appendix IV), the national unemployment rate is uncorrelated with moving to other provinces.
However, for the regression models identifying regional economic shocks, we do observe initially
increased provincial mobility for cohorts exposed to higher unemployment conditions at time of
college exit.
For the graduate sample, a five percentage point difference in the unemployment rate at entry is
associated with about a 0.75 percentage point difference in the provincial mobility rate in the first
two years. This rate is about half of that for firm mobility and drops quickly after the third year. The
benefit of moving to different provinces in terms of earnings also appears to be considerably smaller
and shorter lived than that of moving to different firms or industries. The small effect of
unemployment at college exit on provincial mobility suggests that most of the pattern of catch-up in
wages over time for individuals who made their first entry into the labor market during a recession
occurs within provinces.
To directly assess the potential effect of provincial mobility on earnings we also replicated
our estimates separately for workers who never switched region and for movers. Those never
moving (about three-quarters of our sample) behaved in a way very similar to the behavior of the
20 These results are echoed by Kahn (2010), who has found small initial effects on hours, employment and weeks worked for male college graduates in the U.S. after the 1982 recession. Table 2 also displays a pattern of “overshooting” for some measures; this would imply that workers who had initially higher instability become more stable later relative to their more lucky counterparts. However, the estimates are numerically very small and never above 0.2 percentage points.
23
full sample (see SA Figure D3). It appears that regional mobility after an adverse initial shock may
not be as important in Canada as in the U.S. (Wozniak, 2006).
4.2 Heterogeneity in the Effect of Graduating from College in a Recession
In this section we use our data to show that college graduates with lower predicted wages, based on
college background, are more adversely affected by higher initial unemployment rate conditions. We
first use a linear regression model to predict log earnings based on college attended, program of
graduation and years of study, conditional on province of study and cohort year. Since individuals
are likely to be sorted into colleges, these estimates capture both differences in innate ability and
differences in college quality. We then group individuals into quintiles based on these predicted
wages.21
Our results imply that college graduates with the lowest predicted annual earnings are most
affected by higher initial unemployment conditions and experience permanent earnings losses, while
those at the top experience losses that are short lived. Figure 4 shows the same coefficients for the
effects of the initial unemployment rate on log earnings, job mobility, individual’s firm’s log median
earnings and employment as in the baseline model, but for regression models estimated separately
for the first, third and fifth predicted wage quintiles (this figure corresponds to Figure 2 for the full
sample). Columns 2 to 4 of Table 2 summarize the key structure of losses by quintile and compare
them to results for the full sample, with standard errors. As is apparent from the figure and table,
those with the lowest predicted annual earnings are most affected by higher initial unemployment
conditions and experience permanent earnings losses. Earnings one year into the labor market are
about 15 percent lower from a five percentage point increase in the initial unemployment rate, and 21 A similar approach to assessing college quality is followed by Betts, Ferrall, and Finnie (forthcoming), who use the same college data and information about wages after graduation as we do. After analyzing majors and colleges separately, in our final specification, we interact major and college dummies. Differences by major or college in themselves are as expected. For example, humanities graduates do worst and then come social sciences; economics and engineering are in the middle range, whereas hard sciences are in the high range (See SA Figure G1). The effect of sorting into colleges is discussed extensively in Black and Smith (2004), Black, Kermit and Smith (2005), and Dale and Krueger (2002).
24
in this case, they remain about 7.5 percent lower even after ten years. In contrast, the earnings of
college graduates in the top quintile are, on average, about 7.5 percent lower in the first year after a
five-point increase in unemployment rates, but the gap falls to less than two percent after only four
years. The median group of graduates experiences similar patterns of reversion as the average shown
in Figure 2.
Overall Costs of Recessions. The longitudinal data allowed us to obtain a direct measure of
the cost of recessions that is a useful complement to measures in the literature based on the standard
deviations of earnings. Figure 5 graphs the percentage decline in the present discounted value of
annual earnings by deciles of the predicted earnings distribution. We discounted earnings at an
interest rate of five percent and included only the first ten years of earnings in our calculation. This
assumed that the difference in annual earnings had decayed after ten years. We thus understated the
loss for less advantaged workers, whose earnings had not fully recovered by that time. Thus, we
view our calculations as lower-bound estimates of the full, life-time loss in earnings.
Figure 5 illustrates two key messages. First, there is an important gradient in the cost of
recessions in predicted earnings – those individuals with lower earnings capacity face four to five
times the cost of recessions than do the most advantaged workers. On the other hand, the least
advantaged college graduates appear to bear most of the impact from graduating in a recession.
Second, losses from starting to work in a recession as measured by actual changes in the present
discounted values of earnings or utility losses are high even for the more able workers. In particular,
for the median worker in our sample, losses are much higher than what is typically found in the
literature.22
22 The median worker in our sample loses about Can$22,000 (in 2005 prices), which represents about 6 percent of the present discounted value of earnings, during their first ten years in the labor market. This compares to average annual earnings during the first experience year for the median worker of about Can$25,000 (in 2005 prices). In SA Appendix IX, we also show the fraction increase in annual earnings a worker would require in order to be indifferent between a noisy earnings path and an alternative stable path, using a constant relative risk aversion utility function. This

25
5. Mechanisms of Recovery from Graduating in a Recession
The preceding results draw a detailed picture of the effect of initial labor market conditions on
college graduates, in which very short-lived, adverse labor market conditions have long-term effects,
in which labor market entrants are much more affected than workers with just a few years of
experience and in which the size and persistence of the effect vary dramatically across the skill
distribution. In Section 4, we ruled out mobility across provinces and reduced work time in terms of
non-employment or weeks worked in determining income recovery for students graduating in a
recession. In this section, we analyze two additional key channels: the role of first employers and
mobility across jobs and industries.
Figure 2, Panel C, and Column 1 of Table 2 show that, according to our data, graduates
entering the labor market during times of high unemployment are more likely to begin work at
lower-quality employers, measured in terms of average log firm size, log total payroll and log median
wage over the course of the panel.23 Figure 2 also shows that after an initial down ranking, firm
quality improves quickly in the first three to five years that a worker spends in the labor market
when job mobility is higher than average. As the effect of initial unemployment on job mobility
declines (Panel B of Figure 2), improvements in firm quality slow down visibly (Panel C). Reversion
in firm quality continues, but at a reduced rate. According to these results, the catch-up process
appears to occur in two phases. In the first phase of catch-up, workers experience rapid
improvements in the quality of their employers through job mobility. This phase lasts four to five
corresponds conceptually to the original Lucas measure. The results convey the same message as Figure 5. We find that an uncertain stream of earnings had to be increased by about 7 percent for the median worker in our sample in order for it to be of equal utility as a comparable certain path. The typical estimate in the literature is below 1 percent. Some studies, such as Storesletten, Telmer, and Yaron (2001) and Krusell and Smith (1999), find effects comparable to ours for households with no wealth. 23 High wage sectors have more pro-cyclical employment (e.g., McLaughlin and Bils, 2001), and we find a corresponding pattern for firms. Typical high-wage and pro-cyclical industries are durable goods manufacturing and construction. Typical low wage, less pro-cyclical sectors are retail trade and personal services. At the firm level, the patterns may arise due to changes in demand for products of different quality, differences in the costs of job creation, or because of changes in product market competition.

26
years. Improvement in employer quality is largely absent in the second phase, where reversion
appears to occur within firms.
Figure 4 and the remaining columns of Table 2 highlight important differences in catch-up
for workers with different skill levels. High-skilled workers experience large, temporary increases in
rates of job mobility and completely close the gap in employer quality within four years. Medium-
skilled workers experience above-average job mobility and increases in firm quality within the first
four years, too, but they do not fully close the gap. College graduates at the bottom of the skill
distribution experience only small increases in job mobility and improvement in firm quality in the
years after graduation, and they are permanently downgraded to lower-paying employers and sectors.
For these workers, any catch-up that occurs appears to happen within firms but does not fully close
the gap.
Sensitivity. As in our analysis of earnings effects, all of our firm mobility results are robust
to a range of specification checks. For example, the results hold when we use national instead of
provincial unemployment variation (see SA Table D4 for job mobility and SA Table E2 for firm
quality). We also find similar results after including concurrent unemployment rates in the present
province of residence. Controlling for persistent unemployment generates larger estimated effects
for unemployment conditions at labor market entry. This is because higher unemployment rates
tend to reduce job mobility among more experienced workers (e.g., Shimer 2005, SA Appendix
VIII). This exercise shows that job mobility and firm quality of labor market entrants respond more
strongly to conditions in the labor market than do the job mobility and firm quality of workers
already in the labor market. It also confirms our conclusion for Section 4.1 that labor market
entrants have exceptional responses to labor market conditions.
In Table 2, we also report how unemployment conditions affect workers' propensity to
switch industries. In addition to job shopping, workers may actively search for a match with the

27
“right” industry (see, for example, Neal 1995 and McCall 1990). We discovered a similar pattern of
cyclical downgrading toward low-wage industries as the one we found for low-wage firms (see SA
Table E3), but we also found that downgrading occurs within industries. Finally, as observed in the
United States by Topel and Ward (1992), on average, job mobility in Canada during the first ten
years of workers’ careers substantially contributes to wage growth. This positive association of job
changes and wage changes strengthens for workers graduating during a recession, further suggesting
that job mobility plays an important role in the recovery process (SA Table D5).
What’s behind the catch-up process? Our analysis of channels has suggested that initial
down ranking to low-wage employers and gradual improvements in firm quality play key roles in
explaining persistent earnings effects in our data. To obtain a sense of the potential magnitude of the
role of job mobility, we calibrated the magnitude of the effects of job change or improvements in
firm quality based on the average wage gain at job mobility. We find that 40 to 50 percent of
recovery after initial earnings losses could be explained by productive job mobility (SA Appendix
VII). To directly assess the magnitude of alternative channels underlying the catch-up process, we
added controls for a cohort’s average firm quality and current and lagged regional unemployment
rates to our cell-level regression of average log annual earnings. Since career outcomes after
graduation are potentially correlated with unobserved individual characteristics, such a regression is
not meaningful at the worker level. However, our finding that recessions do not appear to affect the
timing of graduation or labor force participation in our data, there is no selection at the cell level.
Thus, the inclusion of cell-level variables allows decomposing the persistent effect of the initial
unemployment rate on earnings into the part explained by differences and changes in firm quality,
the part explained by persistent effects of unemployment rates and what is explained by other
factors. Effectively, we add average outcome variables at the level of cells defined by graduation
cohort, initial province, and experience year to versions of the regression model in Equation 2.
28
Figure 6 shows the effect on earnings of initial unemployment rates in years 0 to 1 in the
labor market (these are simply estimates of Equation 2 without any controls for unemployment rate
histories as in Figure 3). The second line from the bottom shows the remaining effect of initial
unemployment rates after we conditioned for average employer quality in a given cell. The figure
suggests that an important part of the earnings difference (about 40 to 50 percent) could be
explained by reductions in firm quality. As predicted by a model of job search with age-related
mobility costs, differences in firm quality matter especially during the first years after entry into the
labor market.
We then added the current unemployment rate to the model, interacted with labor market
experience to allow for persistent effects (thus, these are estimates of 01,e for a version of Equation
2 where we added the average mean firm earnings of the current employer at the cell level). Once we
added persistent effects of further labor market conditions, the long-term effect of initial
unemployment faded completely by the sixth year in the labor market. Thus, temporary reductions
in firm quality plus continuing exposure to adverse labor market conditions correlated with the effect
at entry explain a large fraction of the earnings losses we find.
Discussion. The available evidence suggests that mobility toward better employers is an
important channel through which catch-up after an adverse initial start occurs. Differences in job
mobility can also explain the heterogeneity in responses of earnings and firm quality that we
discovered. This has implications for our understanding of the role of job mobility in workers’
careers and in the labor market’s adjustment to cyclical shocks. Overall, the results support an
environment in which heterogeneous workers gradually search for jobs at better firms but in which
recovery is slowed due to accumulation of specific capital and increases in the cost of mobility as
workers age. An important feature of the model we summarized in Section 2 is that these adjustment
processes may differ by workers’ skill level. Given realistic assumptions about comparative
29
advantage, low-skilled workers are more likely to be affected by time-increasing mobility costs and to
be persistently down-ranked to lower-paying firms. As a result, low-skilled workers are more likely to
experience permanent effects from initial labor market conditions. A key insight of the search model
we outlined in Section 2 is that effects of initial unemployment rates lead to permanent earnings
differences only if coupled with search frictions that intensify with age. Without a distinction
between “newly minted,” flexible workers and workers settling down, nothing would prevent
workers to keep seeking better jobs once they have entered the labor market.
While a model based on search frictions yields a parsimonious explanation of the findings, as
discussed in Section 2 other modeling approaches combining differential job mobility and
persistence by skill levels could yield similar predictions. For example, a neo-classical model of
gradual sorting, in which employers learn about workers’ ability at differential speeds (Gibbons,
Katz, Lemieux, and Parent, 2005) and provide different degrees of training (Gibbons and Waldman,
2006) may explain some of the patterns we found. In either case, one key mechanism underlying our
findings is likely to be the interaction between age- and skill-related incentives to job mobility. It is
beyond the scope of this article to test between these models. Instead, in the remainder of this
section, we will summarize two additional empirical results that are consistent with search-related
frictions playing a role in the recovery process.
Our longitudinal worker-firm-college data set allows us to make a direct assessment of the
long-term effect of a worker’s very first job by including fixed effects for his first employer
interacted with experience dummies in an individual-level version of our regression model. To do so,
we were able to re-estimate Equation 1 without first collapsing our data to the cell level (only the
dependent variable changes and, besides the firm-experience year effects, all other regressors are as
stated in Equation 1). Note that if high-wage firms attract workers of higher ability during
recessions, the result will tend to be an over estimation of the role of the initial employer. Consistent
30
with the findings in Figure 6, the result suggests that about half of the earnings loss can be explained
by the first employer alone (see Table 1, Panel B, Column 1). This finding confirms that first job
placement plays an important role in explaining the long-term consequences of graduating in a poor
labor market. It appears less consistent with models of employer learning unless (contrary to the
assumptions of the learning model) first placement correlates strongly with worker ability.
Again using an individual-level version of our main regression equation, we also found that
the rate of catch up slowed significantly for workers whose first employer paid high average wages
(Table 1, Panel B, Columns 3 to 6). This is consistent with the search model we outlined, according
to which the nature of catch-up changes once workers enter high-productivity firms, and is from
thereon driven by accumulation of specific skills. Given the large differences in average employer
quality on the one hand and moderate consensus estimates of the returns to tenure on the other
hand, it is not surprising that this second phase is slower.24 Such a pattern is more difficult to
rationalize in the context of a model of employer learning, where wages depend on workers’
expected skills, not their employers, or in a model of skill accumulation, unless higher paying firms
also have fewer opportunities for skill accumulation and hence wage growth.
6. Conclusion
We have estimated the long-term effects of entering the labor market in a recession for a large
sample of Canadian men leaving college whose earnings, employers and career outcomes were
tracked for ten years. Using an unusually large number of cohorts, we discovered that the average
worker graduating from college in a recession faces earnings losses that are very persistent but not
permanent. A key contribution of this article is to document the fact that the average estimates mask 24 Even if workers continue to search, once they are employed by a large firm, they are less likely to obtain a better job match. Again, the probability of starting to work at a high-quality firm may be correlated with workers’ ability, and the degree of selectivity might be affected by early unemployment rates. To address this problem, we have included control functions in the fraction of workers starting to work at high-quality firms. Similarly, we have included average fathers’ income as a control function. Neither strategy affects our results (results available upon request). Since young workers’ earnings may not be entirely a function of their ability (due, for example, to the presence of employer learning), including worker fixed effects is not be the ideal strategy for dealing with this problem.

31
complex patterns in the timing and heterogeneity of the effects from early labor market conditions.
Controlling for unemployment rate conditions after the first year of labor market entry, we conclude
that an important part of the wage deficit can be attributed to the unemployment rate variation in
the very first year after leaving school. We have also found that the effects of recession shocks are
strongest for young workers, while workers with a couple of years of labor market experience are
less affected. In addition, we have found that college graduates at the bottom of the wage and ability
distribution have larger and more persistent losses, while the effects at the top are small and short
lived. Our estimates of how the path of earnings declines suggest that the present discounted value
of losses in annual earnings could be three to four times larger for the least advantaged as compared
to the most advantaged workers – indicating that even within the group of college graduates, there is
a large degree of heterogeneity in the costs of recessions.
Another key contribution of this study is its analysis of the mechanisms behind these persistent
and heterogeneous effects of short-term labor market shocks. We find that recessions initially lead
workers to start at less attractive employers. An important part of earnings catch-up occurs by
means of workers moving to higher-paying firms, especially during the first years after the shock.
These patterns are much more pronounced for more advantaged college graduates. Less advantaged
graduates recover at much slower speeds, if they recover at all, from the initial downgrading to
lower-paying employers. The patterns are also much more pronounced for labor market entrants
than for workers with two or three years of labor market experience.
Our results provide direct evidence that short-term shocks can lead to cyclical downgrading with
an ensuing gradual process of reallocation through job mobility. Our approach based on exogenous
variation in labor market conditions has allowed us to explicitly quantify the contribution of job
mobility to individual wage growth – an important channel in many micro and macro models of the
labor market. We have also shown that the adjustment process can take a long time, that it differs by

32
college background, and that some workers never recover, a challenge for typical models of career
progression.
We have argued that a job search model with frictions that vary with skill as well as age would
have the capacity to capture the main patterns in our data, including the high degree of persistence.
However, other relevant mechanisms could explain part of the catch-up process – including gradual
reallocation through employer learning (e.g., Gibbons, Katz, Lemieux, and Parent 2005). We have
also emphasized a potential role of recovery on the job due to contracting (e.g., Beaudry and
DiNardo, 1991) or job assignment (e.g., Gibbons and Waldman, 2006). We leave an explicit test
between different models to future work. Finally, we should emphasize that by focusing on male
college graduates, we have left out other workers – such as high school graduates and women – that
could be important in determining the overall response of labor market entrants to cyclical shocks.
33
References
Aaronson, Daniel and Sara Christopher. 2004. ‘Employment Growth in Higher-Paying Sectors.’
Chicago Fed Letter (206): Federal Reserve Bank of Chicago.
Abowd, John, Robert Creecy, and Francis Kramarz. 2002. ‘Computing Person and Firm Effects
Using Linked Longitudinal Employer-Employee Data.’ Census Bureau LEHD Technical
Paper TP-2002-06.
Albaek, Karsten and Bent E. Sorensen. 1998. ‘Worker Flows and Job Flows in Danish
Manufacturing.’ The Economic Journal 108(November): 1750-1771.
Altonji, Joseph and Nicolas Williams.2005. ‘Do Wages Rise with Job Seniority? A Reassessment.’
Industrial Labor Relations Review 58(3): 370-397.
Baker, George, Michael Gibbs, and Bengt Holmstrom. 1994. ‘The Wage Policy of a Firm.’ Quarterly
Journal of Economics 109: 881-919.
Barlevy, Gady. 2005. ‘The cost of business cycles and the benefits of stabilization.’ Economic
Perspectives Chicago Federal Reserve 1st Quarter.
Beaudry, Paul and John DiNardo. 1991. ‘The Effect of Implicit Contracts on the Movements of
Wages over the Business Cycle’ Journal of Political Economy 99(4): 665-688.
Beaudry, Paul and David Green. 2000. ‘Cohort patterns in Canadian earnings: assessing the role of
skill premia and inequality trends.’ Canadian Journal of Economics 33 (4): 907-936.
Beaudry, Paul, Thomas Lemieux, and Daniel Parent. 2000. ‘What is Happening in the Youth Labor
Market in Canada?’ Canadian Public Policy, XXVI Supplement 1.
Betts, Julian, Christopher Ferrall, and Ross Finnie (forthcoming). ‘The Role of University Quality in
Determining Post-Graduation Outcomes: Panel Evidence from Three Recent Canadian
Cohorts.’ Canadian Journal of Economics.
Black, Dan and Jeffrey Smith. 2004. “How Robust is the Evidence on the Effects of College
Quality? Evidence from Matching.” Journal of Econometrics 121(1): 99-124.
Black, Dan, Kermit Daniel and Jeffrey Smith. 2005. “College Quality and Wages in the United
States.” German Economic Review 6(3): 415-443
Blanchflower, David G. and Andrew J. Oswald. 1994. The Wage Curve. Cambridge, MA: MIT Press.
Blau, D.M. and P.K. Robins.1990.“Job search outcomes for the employed and unemployed”, Journal
of Political Economy, 98: 637-655.
Bloemen, Hans. 2005. ‘Job Search, Search Intensity, and Labor Market Transitions: An Empirical
Analysis.’ The Journal of Human Resources 40(1): 231-269.
34
Bloom, David E.and Richard B. Freeman. 1989. ‘The ‘Youth Problem’: Age or Generational
Crowding.’ NBER Working Paper No. 1829.
Christensen, Bent Jesper, Rasmus Lentz, Dale T. Mortensen, George Neumann, and Axel Werwatz.
2005. ‘On the job search and the wage distribution.’ Journal of Labor Economics 23(1): 31-58.
Cutler, David and Lawrence Katz. 1991. ‘Macroeconomic Performance and the Disadvantaged.’
Brookings Papers on Economic Activity 1991(2): 1-74.
Dale, S. B. and A. Krueger. 2002. ‘Estimating the payoff to attending a more selective college: an
application of selection on observables and unobservables.’ Quarterly Journal of Economics 117:
1491-1528.
Deaton, Angus. 1997. The Analysis of Household Surveys. Johns Hopkins University Press.
Devereux, Paul. 2002. ‘Occupational Upgrading over the Business Cycle.’ Labour 16(3): 423-452.
Devereux, Paul. 2003. ‘The Importance of Obtaining a High-Paying Job.’ Mimeo, University of
California, Los Angeles.
Ellwood, David. 1982. "Teenage Unemployment: Permanent Scars or Temporary Blemishes?" In:
Richard B. Freeman and David A. Wise (Eds). The Youth Labor Market Problem: Its Nature,
Causes and Consequences, pp. 349-390. Chicago: University of Chicago Press.
Gardecki, Rosella and David Neumark. 1998. ‘Order from Chaos? Effects of Early Labor Market
Experiences on Adult Labor Market Outcomes.’ Industrial and Labor Relations Review 51(2):
299-322.
Genda, Yuji, Ayako Kondo, and Souichi Ohta. 2010. ‘Long-Term Effects of a Recession at Labor
Market Entry in Japan and the United States.’ Journal of Human Resources 45(1): 157-196.
Gibbons, Robert, Lawrence F. Katz, Thomas Lemieux, and Daniel Parent. 2005. ‘Comparative
Advantage, Learning, and Sectoral Wage Determination.’ Journal of Labor Economics 23: 1-54.
Gibbons, Robert and Michael Waldman. 2006. ‘Enriching a Theory of Wage and Promotion
Dynamics Inside Firms.’ Journal of Labor Economics, 24: 59-107.
Grant, Darren. 2003. ‘The Effect of Implicit Contracts on the Movement of Wages over the
Business Cycle: Evidence from the National Longitudinal Survey.’ Industrial and Labor
Relations Review 56(3): 393-408.
Hall, Robert E. 1974. ‘The Process of Inflation and the Labor Market.’ Brookings Papers on Economic
Activity 1974 (2): 343-393.
Harris, Milton and Bengt Holmstrom. 1982. ‘A Theory of Wage Dynamics.’ Review of Economic Studies
49: 315—333.

35
Heisz, Andrew. 2001. ‘Income Prospects of British Columbia University Graduates.’ Statistics
Canada Analytical Studies Branch Research Paper Series no. 170.
Heisz, Andrew. 2003. ‘Cohort Effects in Annual Earnings by Field of Study Among British
Columbia University Graduates.’ Statistics Canada Analytical Studies Branch Research Paper
Series no. 200.
Hines, James, Hilary Hoynes, and Alan Krueger. 2002. ‘Another Look at Whether a Rising Tide
Lifts All Boats.’ in Alan Krueger and Robert Solow. (Eds.), The Roaring Nineties: Can Full
Employment Be Sustained? Russell Sage Foundation: New York.
Kahn, Lisa. 2010. ‘The Long-Term Labor Market Consequences of Graduating College in a Bad
Economy.’ Labour Economics 17(2): 303-316.
Krueger, Alan and Lawrence Summers. 1988. ‘Efficiency Wages and the Inter-Industry Wage
Structure.’ Econometrica 56(2): 259-293.
Krause, Michael U. and Thomas A. Lubik. 2006. ‘The Cyclical Upgrading of Labor and On-the-Job
Search.’ Labour Economics 13: 459-477.
Krusell, Per and Anthony Smith. 1999. ‘On the welfare effects of eliminating business cycles.’ Review
of Economic Dynamics 2(1): 245–272.
Lange, Fabian. 2007. ‘The Speed of Employer Learning’, Journal of Labor Economics 25(1): 1-35.
Lentz, Rasmus. 2007. ‘Sorting in a General Equilibrium On-the-Job Search Model.’ Mimeo,
University of Wisconsin.
Lucas, Robert. 1987. Models of Business Cycles. Oxford: Basil Blackwell.
Manning, Alan. 2005. Monopsony in Motion. Princeton University Press.
Martins, Pedro, Gary Solon, and Jonathan Thomas. 2009. ‘Measuring What Employers Really do
About Entry Wages Over the Business Cycle.’ Mimeo, University of Michigan.
Macleod, Bentley and James M. Malcomson. 1993.‘Investments, Holdup, and the Form of Market
Contracts.’ American Economic Review 83(4): 811-37.
McCall, Brian P. 1990. 'Occupational Matching: A Test of Sorts,' Journal of Political Economy, 98: 45-
70.
McDonald, Ian M. and Robert M. Solow. 1985. ‘Wages and Employment in a Segmented Labor
Market.’ The Quarterly Journal of Economics 100(4): 1115-1141.
McDonald, James Ted and Christopher Worswick. 1999. ‘Wages, Implicit Contracts, and the
Business Cycle: Evidence from Canadian Micro Data.’ The Journal of Political Economy 107(4):
884-892.

36
McLaughlin, Kenneth J. and Mark J. Bils. 2001. ‘Inter-Industry Mobility and the Cyclical Upgrading
of Labor’ Journal of Labor Economics 19(1): 94-135.
Mortensen, Dale T. 1986. ‘Job Search and Labor Market Analysis.’ In: Orley Ashenfelter and
Richard Layard (Eds.), Handbook of Labor Economics, Volume 2. Amsterdam, New York, and
Oxford: Elsevier Science.
Mortensen, Dale T. 1988. ‘Wages, Separations, and Job Tenure: On-the-Job Specific Training or
Matching?’ Journal of Labor Economics 6(4): 445-471.
Moscarini, Giuseppe, and Frank Vella. 2008. ‘Occupational Mobility and the Business Cycle.’ NBER
Working Paper No. 13819.
Murphy, Kevin M. and Finis Welch. 1990. ‘Empirical Age-Earnings Profiles.’ Journal of Labor
Economics 8(2): 202-229.
Neal, Derek. 1995. ‘Industry-Specific Human Capital: Evidence From Displaced Workers,’ Journal of
Labor Economics, October, vol. 13: 653-77.
Neal, Derek. 1999. ‘The Complexity of Job Mobility Among Young Men.’ Journal of Labor Economics
17(2): 237-261.
Okun, Arthur M. 1973. ‘Upward Mobility in a High-Pressure Economy.’ Brookings Papers of Economic
Activity 1: 207-52.
Oreopoulos, Philip, Till von Wachter, and Andrew Heisz. 2008. ‘The Short- and Long-Term Career
Effects of Graduating in a Recession: Hysteresis and Heterogeneity in the Market for
College Graduates.’ IZA Discussion Paper No. 3578.
Oyer, Paul. 2006. ‘The Macro-Foundations of Microeconomics: Initial Labor Market Conditions and
Long Term Outcomes for Economists.’ NBER Working Paper No. 12157.
Oyer, Paul. 2008. ‘The Making of an Investment Banker: Macroeconomic Shocks, Career Choice,
and Lifetime Income’, The Journal of Finance, 63 (December): 2601-2628.
Parent, Daniel. 2000. "Industry-Specific Capital and the Wage Profile: Evidence from the National
Longitudinal Survey of Youth and the Panel Study of Income Dynamics," Journal of Labor
Economics 18(2): 306-23.
Pissarides, Christopher. 2000. Equilibrium Unemployment Theory. 2nd Edition. Cambridge: MIT Press.
Prendergast, Canice. 1999. ‘The Provision of Incentives in Firms.’ Journal of Economic Literature 37(1):
7-63.
Reder, M. W. 1955. ‘The Theory of Occupational Wage Differentials.’ American Economic Review
45(5): 833-852.

37
Reynolds, Lloyd. 1951. The Structure of Labor Markets. Westport, CN: Greenwood Press.
Ryan, Paul. 2001. ‘The School-to-Work Transition: A Cross-National Perspective.’ Journal of Economic
Literature, 39(1): 34–92
Shimer, Robert. 2004. ‘Search Intensity.’ Mimeo, University of Chicago.
Shimer, Robert. 2005. ‘The Cyclical Behavior of Equilibrium Unemployment and Vacancies.’ The
American Economic Review 95(1): 25-49.
Shimer, Robert. 2007. ‘Mismatch.’ American Economic Review, 97(4): 1074-1101.
Schmieder, Johannes F., and Till von Wachter. 2010. "Does Wage Persistence Matter for
Employment Fluctuations? Evidence from Displaced Workers." American Economic Journal:
Applied Economics, 2(3): 1–21.
Stevens, Ann. 1997. ‘Persistent Effects of Job Displacement: The Importance of Multiple Job
Losses.’ Journal of Labor Economics 15(1): 165-88.
Storesletten, Kjetil, Chris Telmer, and Amir Yaron. 2001. ‘The welfare cost of business cycles
revisited: Finite lives and cyclical variation in idiosyncratic risk.’ European Economic Review
45(7): 1311–1339.
Topel, Robert and Michael Ward. 1992. ‘Job Mobility and the Careers of Young Men.’ Quarterly
Journal of Economics 107(2): 439-479.
Vroman, Wayne. 1977. ‘Worker Upgrading and the Business Cycle.’ Brookings Papers on Economic
Activity (1): 229-252.
Wozniak, Abigail. 2006. ‘Why Are College Graduates More Responsive to Distant Labor Market
Opportunities?’ University of Notre Dame, mimeo.
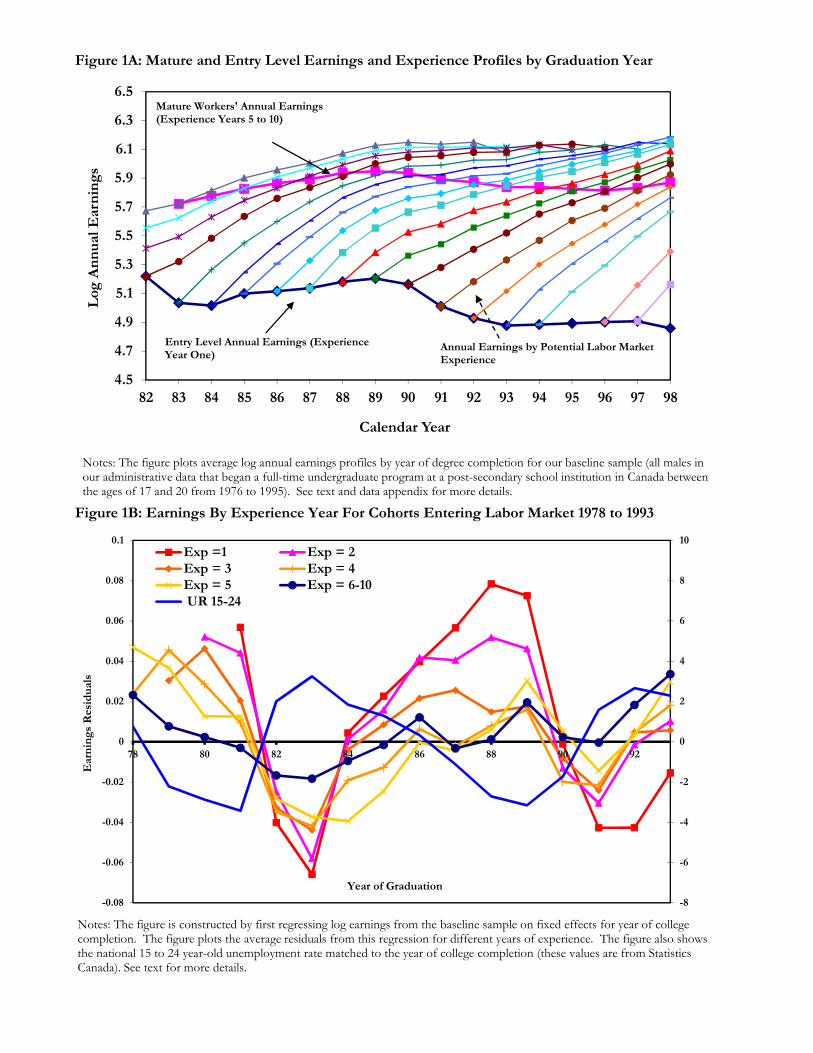
Figure 1A: Mature and Entry Level Earnings and Experience Profiles by Graduation Year
Figure 1B: Earnings By Experience Year For Cohorts Entering Labor Market 1978 to 1993
uding Coho
4.5
4.7
4.9
5.1
5.3
5.5
5.7
5.9
6.1
6.3
6.5
82 83 84 85 86 87 88 89 90 91 92 93 94 95 96 97 98
Log
An
nual
Ear
nin
gs
Calendar Year
Entry Level Annual Earnings (Experience Year One)
Mature Workers' Annual Earnings (Experience Years 5 to 10)
Annual Earnings by Potential Labor Market Experience
Notes: The figure plots average log annual earnings profiles by year of degree completion for our baseline sample (all males in our administrative data that began a full-time undergraduate program at a post-secondary school institution in Canada between the ages of 17 and 20 from 1976 to 1995). See text and data appendix for more details.
-8
-6
-4
-2
0
2
4
6
8
10
-0.08
-0.06
-0.04
-0.02
0
0.02
0.04
0.06
0.08
0.1
78 80 82 84 86 88 90 92
Ear
nin
gs R
esid
ual
s
Year of Graduation
Exp =1 Exp = 2Exp = 3 Exp = 4Exp = 5 Exp = 6-10 UR 15-24
Notes: The figure is constructed by first regressing log earnings from the baseline sample on fixed effects for year of college completion. The figure plots the average residuals from this regression for different years of experience. The figure also shows the national 15 to 24 year-old unemployment rate matched to the year of college completion (these values are from Statistics Canada). See text for more details.
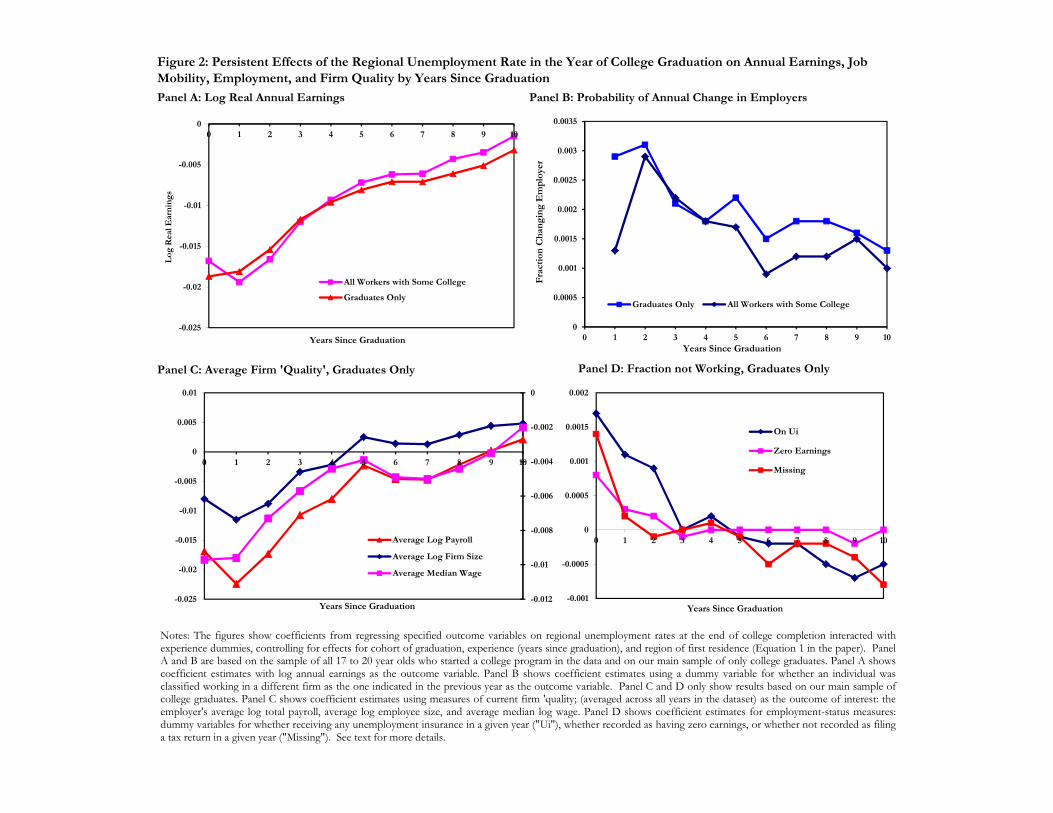
Panel A: Log Real Annual Earnings Panel B: Probability of Annual Change in Employers
Panel C: Average Firm 'Quality', Graduates Only
Figure 2: Persistent Effects of the Regional Unemployment Rate in the Year of College Graduation on Annual Earnings, Job Mobility, Employment, and Firm Quality by Years Since Graduation
Panel D: Fraction not Working, Graduates Only
uding Coho0
0.0005
0.001
0.0015
0.002
0.0025
0.003
0.0035
0 1 2 3 4 5 6 7 8 9 10
Fra
ctio
n C
han
gin
g E
mp
loye
r
Years Since Graduation
Graduates Only All Workers with Some College
-0.025
-0.02
-0.015
-0.01
-0.005
00 1 2 3 4 5 6 7 8 9 10
Log
Rea
l Ear
ning
s
Years Since Graduation
All Workers with Some College
Graduates Only
-0.012
-0.01
-0.008
-0.006
-0.004
-0.002
0
-0.025
-0.02
-0.015
-0.01
-0.005
0
0.005
0.01
0 1 2 3 4 5 6 7 8 9 10
Years Since Graduation
Average Log Payroll
Average Log Firm Size
Average Median Wage
-0.001
-0.0005
0
0.0005
0.001
0.0015
0.002
0 1 2 3 4 5 6 7 8 9 10
Years Since Graduation
On Ui
Zero Earnings
Missing
Notes: The figures show coefficients from regressing specified outcome variables on regional unemployment rates at the end of college completion interacted withexperience dummies, controlling for effects for cohort of graduation, experience (years since graduation), and region of first residence (Equation 1 in the paper). PanelA and B are based on the sample of all 17 to 20 year olds who started a college program in the data and on our main sample of only college graduates. Panel A showscoefficient estimates with log annual earnings as the outcome variable. Panel B shows coefficient estimates using a dummy variable for whether an individual wasclassified working in a different firm as the one indicated in the previous year as the outcome variable. Panel C and D only show results based on our main sample ofcollege graduates. Panel C shows coefficient estimates using measures of current firm 'quality; (averaged across all years in the dataset) as the outcome of interest: theemployer's average log total payroll, average log employee size, and average median log wage. Panel D shows coefficient estimates for employment-status measures:dummy variables for whether receiving any unemployment insurance in a given year ("Ui"), whether recorded as having zero earnings, or whether not recorded as filinga tax return in a given year ("Missing"). See text for more details.

Figure 3: Effect of Unemployment Rate at Time of Graduation on Earnings Controlling for Dynamic Effects of Further Unemployment Shocks (by Experience Groups)
uding Coho-0.02
-0.018
-0.016
-0.014
-0.012
-0.01
-0.008
-0.006
-0.004
-0.002
00 1 2 3 4 5 6 7 8 9 10
Log
Rea
l Ear
nin
gs
Years Since Graduation
Baseline (No History)
Group 01 (No History)
Group 01 (Full History)
Group 23 (Full History)
Notes: This figure shows estimates from regressing log annual earnings on the average of regional unemployment rates (UR) in experience years 0 and 1 at the end of college completion interacted with experience dummies, controlling for effects for cohort of graduation, experience (years since graduation), and region of first residence ("Group 01 (No History)"). The remaining lines show estimates from Equation 2 in the text that control for the dynamic effect of unemployment rates encountered at higher experience years. Since we only observe full labor market histories for cohorts graduating in 1982 onwards, this figure is restricted to this set of cohorts. In addition, the figure shows our main estimates comparable to those in Figure 2 ("Baseline") for this sample.

Panel A: Log Real Annual Earnings Panel B: Probability of Annual Change in Employers
Panel D: Fraction Filing With Zero Annual Earnings
Figure 4: Persistent Effects of the Regional Unemployment Rate in the Year of Graduation on Annual Earnings, Job Mobility, Employment, and Firm Quality for Workers with Different Predicted Earnings Based on College and Major
Panel C: Average Firm 'Quality'
-0.035
-0.03
-0.025
-0.02
-0.015
-0.01
-0.005
00 1 2 3 4 5 6 7 8 9 10
Log
Rea
l Ear
ning
s
Years Since Graduation
Top
Middle
Bottom
-0.002
-0.001
0
0.001
0.002
0.003
0.004
0.005
0.006
0.007
0.008
0 1 2 3 4 5 6 7 8 9 10
Fra
ctio
n C
hang
ing
Em
ploy
er
Years Since Graduation
Top
Middle
Bottom
-0.016
-0.014
-0.012
-0.01
-0.008
-0.006
-0.004
-0.002
0
0.002
0.004
0 1 2 3 4 5 6 7 8 9 10
Ave
rage
Log
Pay
roll
Years Since Graduation
Top Middle Bottom
-0.0025
-0.002
-0.0015
-0.001
-0.0005
0
0.0005
0.001
0.0015
0.002
0.0025
0.003
0 1 2 3 4 5 6 7 8 9 10
Fra
ctio
n Z
ero
Ear
ning
s
Years Since Graduation
Top
Middle
Bottom
z
Notes: The figures show coefficients from regressing specified outcome variables on regional unemployment rates at the end of college completion, controlling foreffects for year of graduation, experience (years since graduation), and province of first residence (Equation 1 in the paper). The samples are divided into predictedskill groups, based on major program of study and college (see text for more details). Panel A shows coefficient estimates with log annual earnings as the outcomevariable. Panel B shows coefficient estimates using a dummy variable for whether an individual was classified working in a different firm as the one indicated in theprevious year as the outcome variable. Panel C shows coefficient estimates using the employer's average log total payroll (averaged across all years in the dataset) as ameasure for firm quality. Panel D shows coefficient estimates for whether recorded as having zero earnings or whether not recorded as filing a tax return in a givenyear.
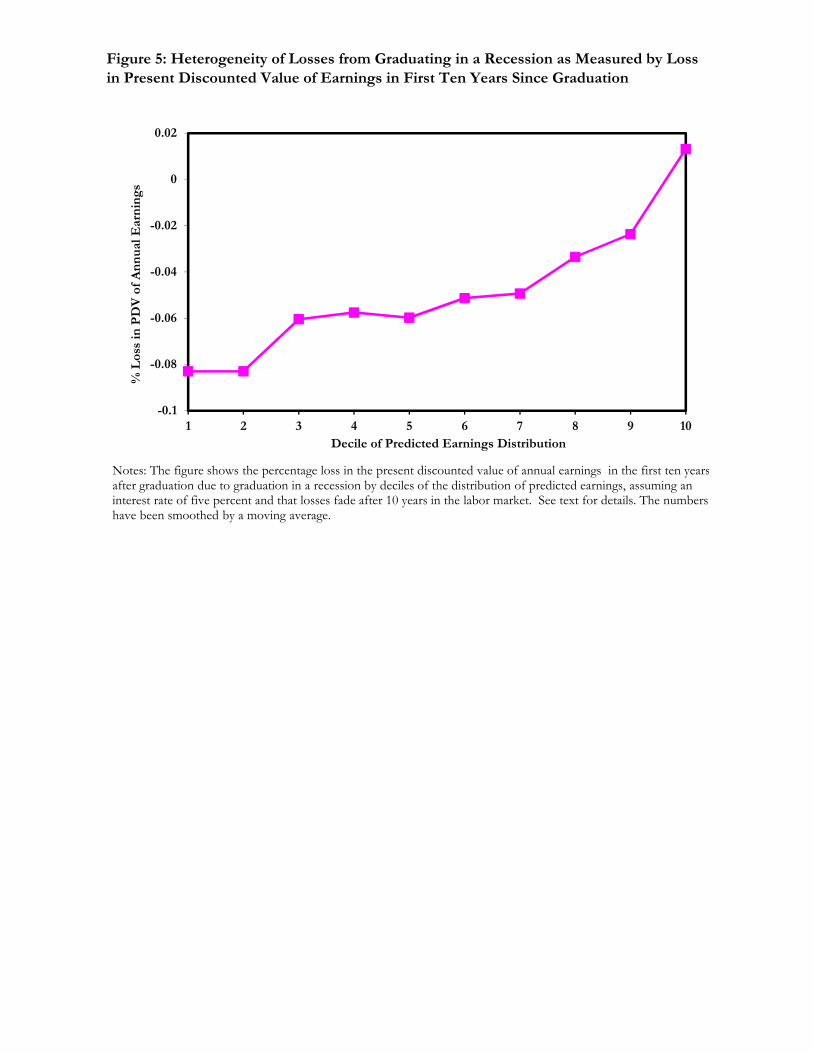
Figure 5: Heterogeneity of Losses from Graduating in a Recession as Measured by Loss in Present Discounted Value of Earnings in First Ten Years Since Graduation
Notes: The figure shows the percentage loss in the present discounted value of annual earnings in the first ten yearsafter graduation due to graduation in a recession by deciles of the distribution of predicted earnings, assuming an interest rate of five percent and that losses fade after 10 years in the labor market. See text for details. The numbers have been smoothed by a moving average.
-0.1
-0.08
-0.06
-0.04
-0.02
0
0.02
1 2 3 4 5 6 7 8 9 10
% L
oss
in P
DV
of
An
nu
al E
arn
ings
Decile of Predicted Earnings Distribution

Figure 6: The Role of Labor Market Conditions and Firm Characteristics in Explaining Persistence in the Effect of Unemployment Rates in the Year of College Graduation on Annual Earnings
-0.02
-0.018
-0.016
-0.014
-0.012
-0.01
-0.008
-0.006
-0.004
-0.002
0
0.002
0 1 2 3 4 5 6 7 8 9 10
Diff
eren
ce in
Log
Rea
l Ear
ning
s
Years Since Graduation
Basic Model: Grouped UR Exp 0-1
Basic Model with Avg. Firm Earnings
With Firm Earnings and Full UR History
Notes: The figures show coefficients from regressing annual earnings on the average of regional unemployment rates (UR) in experience years 0 and 1 at the end of college completion interacted with experience dummies, controlling for effects for cohort of graduation, experience (years since graduation), and region of first residence ("Basic Model"). The dotted line adds as a regressor average firm earnings at the cell-level to this model (where as discussed in the text cells are defined by graduation year, region of first residence, and year of experience). In addition, the squred line adds controls for the dynamic effects of the continuing history of unemployment rates as shown in Equation 2 in the text. Since we only observe full labor market histories for cohorts graduating in 1982 onwards, this figure is restricted to this set of cohorts.
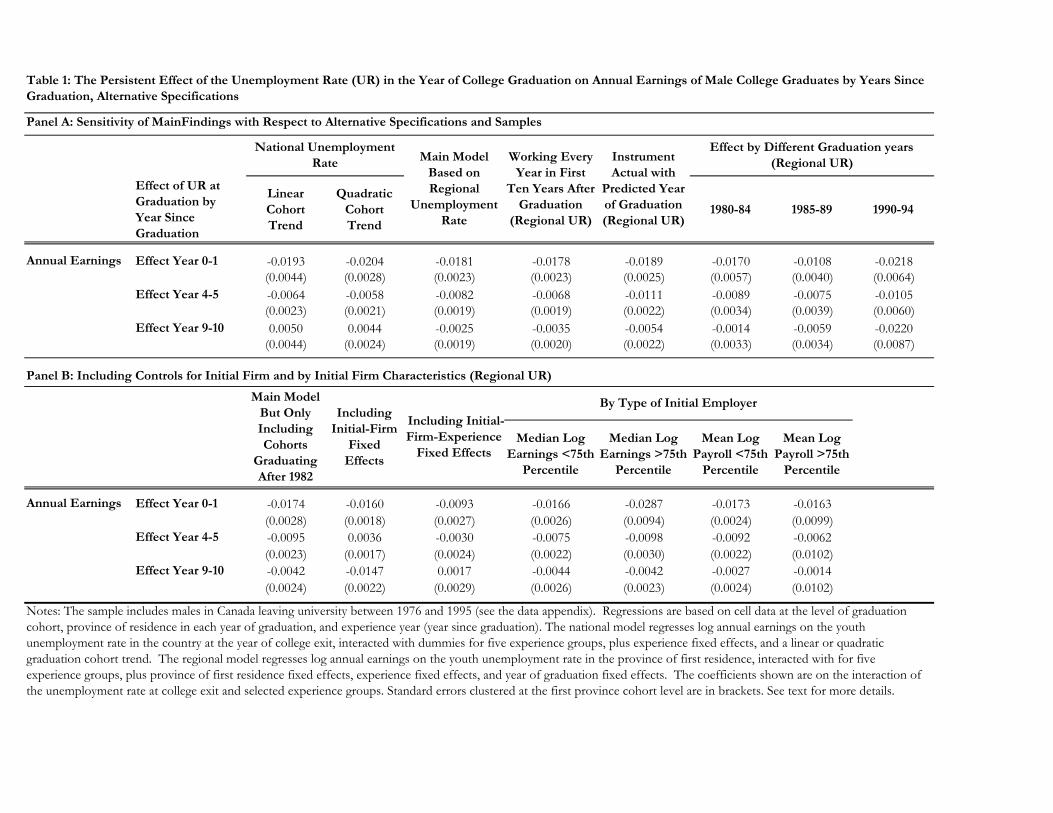
Panel A: Sensitivity of MainFindings with Respect to Alternative Specifications and Samples
Effect of UR at Graduation by Year Since Graduation
Linear Cohort Trend
Quadratic Cohort Trend
1980-84 1985-89 1990-94
Effect Year 0-1 -0.0193 -0.0204 -0.0181 -0.0178 -0.0189 -0.0170 -0.0108 -0.0218(0.0044) (0.0028) (0.0023) (0.0023) (0.0025) (0.0057) (0.0040) (0.0064)
Effect Year 4-5 -0.0064 -0.0058 -0.0082 -0.0068 -0.0111 -0.0089 -0.0075 -0.0105(0.0023) (0.0021) (0.0019) (0.0019) (0.0022) (0.0034) (0.0039) (0.0060)
Effect Year 9-10 0.0050 0.0044 -0.0025 -0.0035 -0.0054 -0.0014 -0.0059 -0.0220(0.0044) (0.0024) (0.0019) (0.0020) (0.0022) (0.0033) (0.0034) (0.0087)
Panel B: Including Controls for Initial Firm and by Initial Firm Characteristics (Regional UR)
Median Log Earnings <75th
Percentile
Median Log Earnings >75th
Percentile
Mean Log Payroll <75th
Percentile
Mean Log Payroll >75th
Percentile
Effect Year 0-1 -0.0174 -0.0160 -0.0093 -0.0166 -0.0287 -0.0173 -0.0163(0.0028) (0.0018) (0.0027) (0.0026) (0.0094) (0.0024) (0.0099)
Effect Year 4-5 -0.0095 0.0036 -0.0030 -0.0075 -0.0098 -0.0092 -0.0062(0.0023) (0.0017) (0.0024) (0.0022) (0.0030) (0.0022) (0.0102)
Effect Year 9-10 -0.0042 -0.0147 0.0017 -0.0044 -0.0042 -0.0027 -0.0014(0.0024) (0.0022) (0.0029) (0.0026) (0.0023) (0.0024) (0.0102)
Table 1: The Persistent Effect of the Unemployment Rate (UR) in the Year of College Graduation on Annual Earnings of Male College Graduates by Years Since Graduation, Alternative Specifications
Main Model Based on Regional
Unemployment Rate
Annual Earnings
Notes: The sample includes males in Canada leaving university between 1976 and 1995 (see the data appendix). Regressions are based on cell data at the level of graduation cohort, province of residence in each year of graduation, and experience year (year since graduation). The national model regresses log annual earnings on the youth unemployment rate in the country at the year of college exit, interacted with dummies for five experience groups, plus experience fixed effects, and a linear or quadratic graduation cohort trend. The regional model regresses log annual earnings on the youth unemployment rate in the province of first residence, interacted with for five experience groups, plus province of first residence fixed effects, experience fixed effects, and year of graduation fixed effects. The coefficients shown are on the interaction of the unemployment rate at college exit and selected experience groups. Standard errors clustered at the first province cohort level are in brackets. See text for more details.
National Unemployment Rate Working Every
Year in First Ten Years After
Graduation (Regional UR)
Instrument Actual with
Predicted Year of Graduation (Regional UR)
Effect by Different Graduation years (Regional UR)
Annual Earnings
Including Initial-Firm
Fixed Effects
Including Initial-Firm-Experience
Fixed Effects
By Type of Initial EmployerMain Model But Only Including Cohorts
Graduating After 1982

Bottom Quintile
Middle Quintile
Top Quintile
Outcome Variable (1) (2) (3) (4)
Effect Year 0-1 -0.0183 -0.0277 -0.0232 -0.0147(0.0020) (0.0058) (0.0033) (0.0028)
Effect Year 4-5 -0.0089 -0.0168 -0.0124 -0.0042(0.0016) (0.0046) (0.0025) (0.0019)
Effect Year 9-10 -0.0048 -0.0146 -0.0051 -0.0028(0.0016) (0.0053) (0.0027) (0.0020)
Effect Year 0-1 -0.0096 -0.0111 -0.0129 -0.0082(0.0012) (0.0043) (0.0022) (0.0015)
Effect Year 4-5 -0.0042 -0.0088 -0.0050 -0.0004(0.0011) (0.0040) (0.0017) (0.0015)
Effect Year 9-10 -0.0034 -0.0112 -0.0047 0.0005(0.0011) (0.0042) (0.0018) (0.0015)
Effect Year 0-1 -0.0098 -0.0172 -0.0156 -0.0063(0.0048) (0.0188) (0.0092) (0.0070)
Effect Year 4-5 0.0000 0.0007 -0.0122 0.0069(0.0049) (0.0168) (0.0090) (0.0070)
Effect Year 9-10 0.0040 -0.0190 -0.0095 0.0220(0.0057) (0.0180) (0.0096) (0.0073)
Effect Year 0-1 0.0020 -0.0023 -0.0018 0.0079(0.0011) (0.0024) (0.0016) (0.0013)
Effect Year 4-5 0.0021 0.0019 0.0032 -0.0002(0.0005) (0.0020) (0.0008) (0.0007)
Effect Year 9-10 0.0018 0.0015 0.0036 -0.0009(0.0004) (0.0018) (0.0007) (0.0007)
Effect Year 0-1 0.0009 -0.0032 -0.0036 0.0069(0.0010) (0.0021) (0.0016) (0.0012)
Effect Year 4-5 0.0016 0.0018 0.0021 -0.0002(0.0004) (0.0018) (0.0008) (0.0006)
Effect Year 9-10 0.0016 0.0023 0.0026 -0.0007(0.0004) (0.0016) (0.0007) (0.0006)
Effect Year 0-1 0.0014 0.0000 0.0009 0.0017(0.0002) (0.0009) (0.0003) (0.0004)
Effect Year 4-5 -0.0001 -0.0018 0.0002 -0.0005(0.0002) (0.0007) (0.0004) (0.0003)
Effect Year 9-10 -0.0002 -0.0014 0.0005 -0.0007(0.0002) (0.0008) (0.0003) (0.0003)
Average Firm Employment
Fraction Changed Employer
Fraction Changed Industry
Fraction Zero Earnings
Table 2: Heterogeneity in the Effect of the Regional Unemployment Rate (UR) in the Year of College Graduation on Annual Earnings, Job Mobility, Employment, and Firm Quality
Effect of UR at Graduation by Year Since Graduation
All Graduates
Position in Distribution of Predicted Annual Earnings at Time of Graduation
Annual Earnings
Average Firm Median Log Earnings
Notes: Coefficients from separate regression models of outcomes listed in the first column on unemployment rate at graduation byselected years since graduation, controlling for effects for year of graduation, experience, and province of first residence. Column 1 shows the results for the full sample of college graduates, whereas columns 2-4 show the results separately for college graduates in the first, third, and fifth quintile of predicted earnings at the time of graduation. Standard errors clustered at the first province cohort level are in parentheses. See text for more details.